 Qixin Wen1,2
 Huopo Chen1,3*
- 1Nansen-Zhu International Research Centre, Institute of Atmospheric Physics, Chinese Academy of Sciences, Beijing, China
- 2University of Chinese Academy of Sciences, Beijing, China
- 3Collaborative Innovation Center on Forecast and Evaluation of Meteorological Disasters, Nanjing University of Information Science and Technology, Nanjing, China
Drought is extremely complex and can be influenced by various factors. This study uses Penman-Monteith (PM) method to calculate the potential evapotranspiration and get the monthly drought metric of Standardized Precipitation-Evapotranspiration Index (SPEI) across China during the period of 1961–2019. Results show that the regions of the west of Northwest China (WNWC), Northeast China (NEC), and South China (SC) are reported to experience a wetting trend, while the droughts in the regions of the east of Northwest China (ENWC), North China (NC), and Southwest China (SWC) deteriorated over the past decades. Seasonally, the significant wetting trends mainly occurred in summer, autumn, and winter for WNWC, while mainly in winter for the region of NEC. Additionally, the droughts in China show an obvious interdecadal variability, with more severe droughts for the periods of 1961–1979 and 2000–2019, but with relatively fewer events in the period of 1980–1999. During the 1960 s and 1970 s, droughts in China are observed to mainly happen in summer and winter, while the droughts mainly occurred in autumn and winter during the 1980 s and 1990 s. Since the early 21st century, both the frequency and intensity of spring droughts have increased obviously and played a dominant role in seasonal droughts. Further studies indicate that the drought changes in southern China are mainly affected by the precipitation anomalies, while that in northern China are mainly influenced by the temperature and wind speed anomalies. Hence, our analyses provide theoretical basis for further understanding the drought changes and the prevention control of drought disasters in China.
1 Introduction
Drought is one of the major natural disasters faced by human society, which has a great impact on food production, social economy, human health, and ecosystem (Kuwayama et al., 2019; Ma et al., 2021; Schumacher et al., 2022; Zhao et al., 2022). With the rapid development of society, droughts are getting worse under the influence of human activities (Chen and Sun, 2017; Deng et al., 2021; Zhang et al., 2022). Some early studies have indicated that from 1951 to 2010, the drought occurrences in Africa, East Asia, the Mediterranean and South Australia showed a significant increasing trend (e.g., Spinoni et al., 2014). According to the Sixth Assessment Report (AR6) of the Intergovernmental Panel on Climate Change (IPCC, 2021), global warming has led to an obvious increase in the frequency of droughts across the global lands, which would be further deteriorated in response to the future warming. Additionally, there will also be a rise in the occurring risks of compound extreme events of drought, heatwave, and wildfire. Especially across China, the droughts have become more frequent and severe during the past decades and it would be likely more serious in the future in response to further warming (Yang et al., 2012; Zhang et al., 2013; Yu et al., 2014; Liu et al., 2015; Yao et al., 2020; Yu and Zhai, 2020; Han et al., 2021; Xu et al., 2021). It is thus critical to increase the understanding of the changes in droughts and the associated underlying mechanisms.
Drought is extremely complex and difficult to be monitored. There are a variety of drought indices developed to meet different demands, mainly through quantitative index values to reflect the severity of drought, such as the Z-index, comprehensive meteorological drought index CI, precipitation anomaly percentage, surface wetness index SWI, and so on (Wu et al., 2001; Li et al., 2012; Yu et al., 2013; Wang et al., 2017; Yang et al., 2017). Among these indices, Palmer drought severity index (PDSI), standardized precipitation index (SPI), and standardized precipitation evapotranspiration index (SPEI) are popularly and widely used in many fields. PDSI was first proposed by Palmer in 1965 based on the water balance concept (Palmer, 1965), and then upgraded by Wells et al. (2004) with the self-calibration PDSI, which provides superior spatial comparability. However, PDSI can only account for drought variability on the scales of 9–12 months (Guttman, 1998). This defect is overcome by McKee et al. (1993) in SPI, which is obtained by standardizing the cumulative probability of precipitation and can effectively monitor drought at different time scales. However, SPI only considers the role of precipitation. On basis of this, Vicente-Serrano et al. (2010) have introduced the effect of temperature into SPI, that is SPEI. Thus, SPEI combines the sensitivity of PDSI to changes in evaporation demand with the simple calculation and multi-time scale characteristics of SPI.
Some recent studies have well revealed the changing characteristics of drought over China using SPEI. At national scale, there is an overall drying trend over China during the period of 1949–2008, and the drying trend is the most significant in spring (Liu and Jiang, 2015). But some studies have also shown that most regions of China exhibited an overall wetter trend from 1961 to 2016, except the belt from northeastern to southwestern China (e.g., Wu et al., 2020). Due to the increasing potential evapotranspiration, an overall increase in drought severity, area, and frequency can be observed in the period of 1998–2015 compared to the period of 1980–1997 (Li et al., 2020). At regional scale, after the 1950 s, the region of northwest China (especially Xinjiang) showed a wetting trend, while the regions of northeast China, north China, and southwest China showed drying trends, and the aridification in southwest China has become even more pronounced since the 2000 s (Wang et al., 2014; Zhou et al., 2014; Liang et al., 2017; Jia et al., 2018; Bai et al., 2019). Furthermore, for the arid region, the 1960 s and 1970 s are the periods occurring vast drought events with the largest drought area, while the drought area in the humid region has increased significantly since the late 1990 s (Chen and Sun, 2015).
However, the evapotranspiration based on Thorthwaite (TH) calculation is generally used among these previous studies when calculating the drought indices, which would cause a large error in monitoring drought, especially over the arid regions (Jensen et al., 1990). Chen and Sun (2015) also pointed out that in the region of northwest China, TH method would overestimate the role of temperature anomalies in drought changes. Compared with the TH method, the Penman-Monteith (PM) equation recommended by the Food and Agriculture Organization of the United Nations (FAO) (Allen et al., 1998) considers more comprehensive physical factors including temperature, wind speed, humidity, and solar radiation, which can more objectively and truly reflect the dry and wet conditions of actual climates. Thus, in this work, we revisit the changes in drought characteristics over China using the latest site-observation from 1961 to 2019 and the evapotranspiration is calculated by FAO PM method. Additionally, a key question of about the roles of drought drivers to the drought changes in China will be also addressed. We explore this issue by setting up four groups of sensitivity experiments, discussing the potential effects of changes in precipitation, temperature, wind speed, and humidity on the drought changes during recent decades, which provide theoretical basis for further understanding the characteristics of drought changes and the prevention and control of drought disasters in China.
2 Data and methods
2.1 Dataset
The datasets used in this study are the monthly meteorological data from 699 basic meteorological stations in China during 1961–2019, including the variables of precipitation, maximum and minimum temperature, wind speed, relative humidity, and sunshine duration, which are mainly derived from the National Meteorological Information Center of the China Meteorological Administration (CMA). We first screen the data before calculating SPEI. If the number of missing values for a meteorological element at a site exceeds 5% of the time series, the site is abandoned; otherwise, the missing values are replaced by the monthly climatic average values. After that, there are 613 sites remained in this work and their geographical locations are shown in Figure 1. Refer to the division method in previous work (e.g.; Chen and Sun, 2017), 613 sites here are also divided into six regions. Among them, there are 43 stations in the west of Northwest China (WNWC), 79 stations in the east of Northwest China (ENWC), 132 stations in North China (NC), 88 stations in Northeast China (NEC), 114 stations in Southwest China (SWC) and 152 stations in South China (SC).
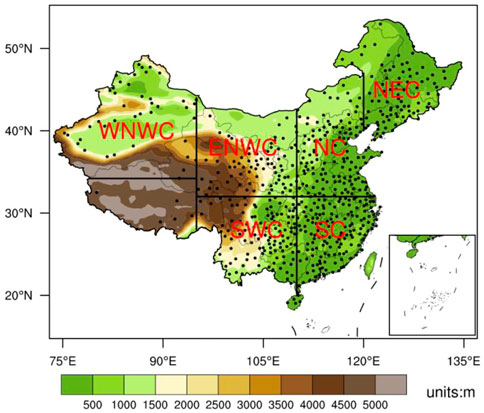
FIGURE 1. Geographical locations of meteorological stations used in this study. Six sub-regions, including WNWC, ENWC, NC, NEC, SWC, and SC are also shown.
2.2 Calculation of SPEI
The standardized precipitation evapotranspiration index (SPEI) is calculated based on precipitation and potential evapotranspiration, with different time scales and good spatial comparability, which can be used to monitor different types of droughts, such as meteorological, agricultural, hydrological, and social droughts (Vicente-Serrano et al., 2010). Before getting SPEI, potential evapotranspiration (PET) needs to be calculated, and this paper uses the FAO Penman-Monteith equation to calculate the PET (Allen et al., 1998). The general steps for calculating SPEI are as follows.
1. Calculation of PET
Where
2. Accumulate the difference between monthly precipitation and evapotranspiration on a given time scale.
Where
3. Calculate the probability distribution function of cumulative series based on three-parameter Log-Logistic distribution.
Where
4. Normalize the distribution function to get SPEI.
when
when
Where
More detailed information referring this calculation can be found in Vicente-Serrano et al. (2010).
SPEI has different time scales, of which 3-month SPEI generally reflects the meteorological drought, 6-month SPEI reflects the agricultural drought, 12-month SPEI reflects the hydrological drought, and 24-month SPEI reflects the social drought (Szalai et al., 2000; Vicente-Serrano and López-Moreno, 2005; Vicente-Serrano et al., 2010). This study mainly focuses on the meteorological drought, 3-month SPEI is thus selected to investigate the characteristics of drought changes in China. The drought classification based on SPEI is shown in Table 1.
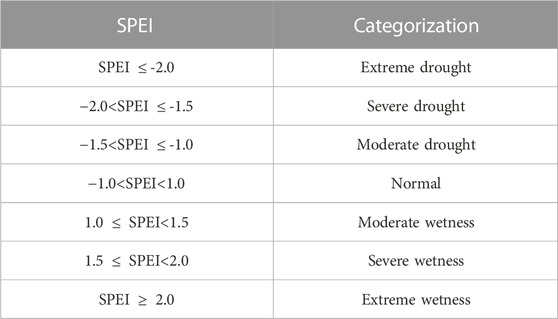
TABLE 1. The drought grades according to SPEI values.
2.3 Drought metrics
Drought frequency:
This index is used to represent the occurrence frequency of drought in a certain station during a certain period.
Where
Drought intensity:
This index is used to describe the drought severity in a certain station during a certain period, which is defined as the average SPEI value of the dry months in that period.
Where
Consecutive drought events:
In this work, the continuous drought of SPEI
Drought station ratio:
This index is used to represent the impacted area of drought in a certain region.
Where
2.4 Mann-Kendall trend test
Mann-Kendall (MK) test is a non-parametric test used to detect the trend of samples over time, which does not require samples to follow a specific distribution and is not easily disturbed by abnormal values. This method is used here to explore the spatial patterns of changing trends for annual and seasonal SPEI. The annual SPEI is taken as the average of 12 months, the spring SPEI is taken as the average of March, April, and May. The specific steps of MK test are as follows:
Where
In the case of no identical values in the sample series, the variance of S is given by the following method:
Finally, the standard normal statistical variables Z are obtained:
In this paper,
3 Results
3.1 Changing characteristics of drought over China
We first analyze the changing trends of SPEI across China. The spatial distributions of MK trends for annual and seasonal SPEI in China from 1961 to 2019 are shown in Figure 2. Most stations in ENWC and SWC have shown significant drying trends over the past decades, while most stations in WNWC, some stations in NEC and SC have shown significant wetting trends (Figure 2A). From seasonal perspective, the trends of SPEI in four seasons show great spatial difference. In spring, there are drying trends in ENWC, NC, and northwestern NEC, while wetting trends are clear in WNWC, northern SWC, and southeastern NEC (Figure 2B). In summer, most parts of China tend to get wet, especially some stations in Xinjiang, Qinghai, Neimeng, Heilongjiang, and Sichuan provinces, where the wetting trends are much more significant. However, the Yunnan province is observed to toward drier in summer during the past decades (Figure 2C). In autumn, there is a drying belt from NEC to SWC across China, including the regions of NEC, NC, ENWC, and SWC, while a wetting trend is reported to be dominated over WNWC and SC (Figure 2D). In winter, we can see the significant wetting trends in WNWC, NEC, northern NC, and SC, but the significant drying trends mainly prevail over ENWC and SWC (Figure 2E). Meanwhile, we calculate the linear trends of the average SPEI for each region during the past decades (figure not shown). In terms of annual mean, the SPEIs in WNWC, NEC, and SC show an upward trend, and the trend in WNWC is significant with a rate of 0.121 per decade, while the SPEIs in ENWC, NC, and SWC exhibit a downward trend. From the perspective of seasons, the region of WNWC presents a significant wetting trend in summer, autumn, and winter, with SPEIs increasing by 0.174, 0.168, and 0.122 per decade, respectively. The wetting trend over NEC is much more obvious in winter than that in other seasons, with the tendency of 0.102 per decade, which plays a key role in the annual wetting trend in this region.
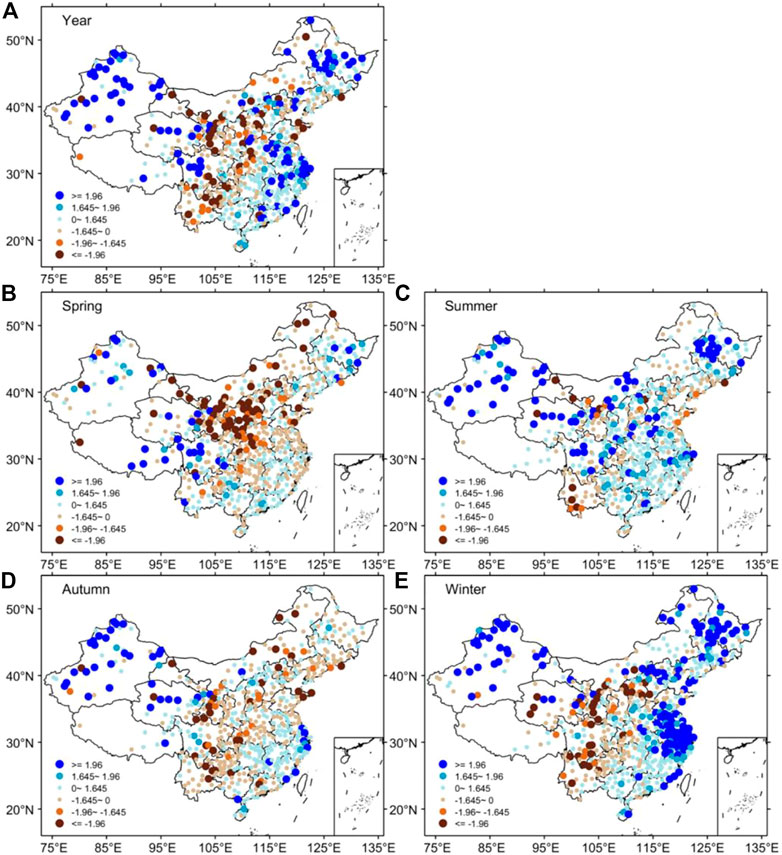
FIGURE 2. Spatial distributions of MK trends for (A) annual and (B–E) seasonal SPEI in China during 1961–2019. The significance levels of 5% and 10% are shown.
Figure 3 shows the spatial distributions of drought frequency during three periods of 1961–1979, 1980–1999, and 2000–2019 in China, as well as their associated changes. Clearly, the drought frequency in China has shown decrease first and then increase during the past decades. That is, from the 1960 s to the end of the 20th century, the dry condition was eased in China, but droughts began to become more frequent again since the early 21st century. This conclusion is line with results of the previous work (e.g., Chen and Sun, 2015). Specifically, the 1960 s and 1970 s are the periods with the most frequent droughts in China, and the drought frequencies in WNWC, NC, and SC are 29.6%, 20.6%, and 20.1%, respectively (Figure 3A). In the 1980 s and 1990 s, the frequencies in all regions decreased compared with the previous period, and the relatively declining proportion in WNWC is 43.7%, followed by respectively 23.0% and 11.5% in SC and NC, this proportion is less than 10% in the other three regions (Figure 3D). However, since the beginning of the 21st century, droughts have become more frequent again in the other five regions except for WNWC. The changes in ENWC and SWC are more obvious, with increasing proportions of 33.3% and 24.8%, respectively, followed by NC, NEC, and SC, where the frequencies increased by 18.3%, 17.2%, and 17.0%, respectively (Figure 3E).
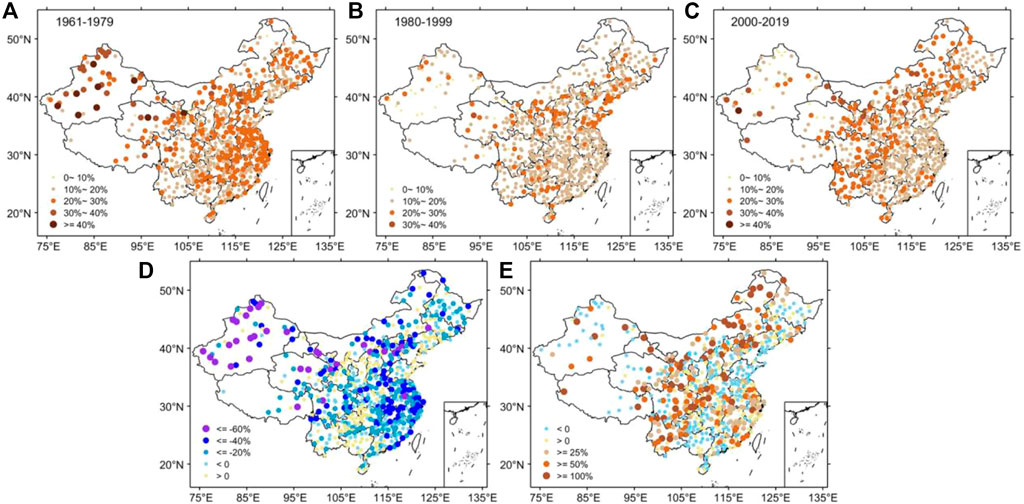
FIGURE 3. Spatial distributions of drought frequency in China for the period of (A) 1961–1979, (B) 1980–1999, and (C) 2000–2019. (D) Shows the relative changes of drought frequency between 1980–1999 and 1961–1979, and (E) shows the difference between 2000–2019 and 1980–1999. Units: %.
The changes in drought intensity present similar spatial patterns with that in frequency. As shown in Figure 4, the 1960 s and 1970 s are the periods with the greatest drought intensity in China, and the averaged drought intensities in WNWC, NC, and SC are −1.56, −1.53, and −1.53, respectively (Figure 4A). Compared with the period of 1961–1979, drought intensity was reported to decrease across China during the period of 1980–1999 (Figure 4D). The largest decrease can be observed in SC, with the value of approximately 9.1%, followed by 6.5% and 5.5% in NC and WNWC, respectively. This proportion is smaller in the other three regions, where the intensity decreased by about 1.8% in SWC, 1.4% in NEC, and 1.0% in ENWC. During the period of 2000–2019, the droughts over NEC became much more severe, with the averaged intensity of −1.53. Compared to the period of 1980–1999, the intensity increased by 6.6% in NEC and 5.9% in SC, followed by 3.6%, 2.7%, and 2.0% in NC, SWC, and ENWC, respectively (Figure 4E).
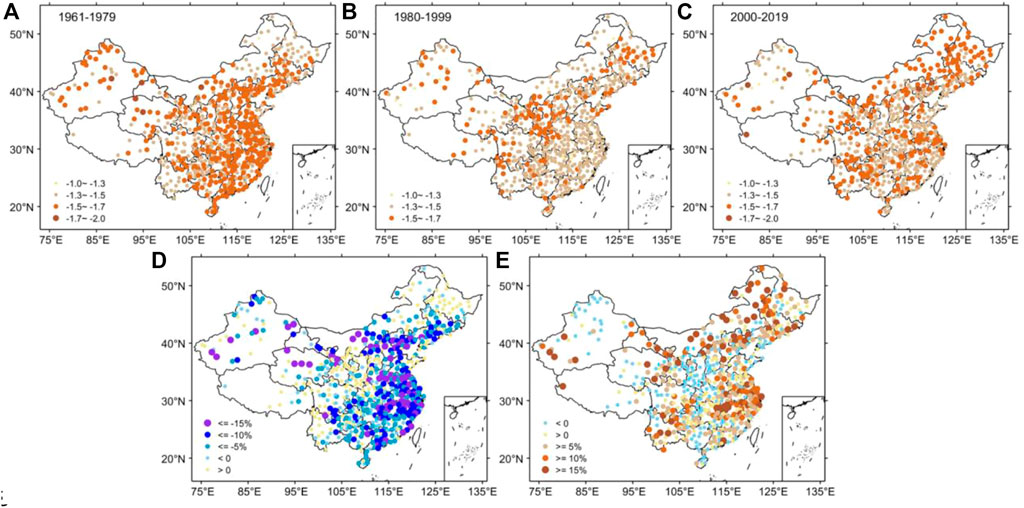
FIGURE 4. Spatial distributions of drought intensity in China for the period of (A) 1961–1979, (B) 1980–1999, and (C) 2000–2019. (D) Shows the relative changes of drought intensity between 1980–1999 and 1961–1979, and (E) shows the difference between 2000–2019 and 1980–1999.
Compared with the short-term drought, the consecutive drought events can generally exert a more serious impact on agricultural and animal husbandry production, ecological environment, and human society. We can see from Figure 5 that there were many consecutive drought events across China in the 1960 s and 1970 s, mainly concentrated in WNWC, ENWC, NC, SWC, and southeastern coastal areas (Figure 5A). Few consecutive droughts can be observed in the 1980 s and 1990 s, which were mainly manifested in NC, ENWC, and WNWC (Figure 5B). According to the statistics of the sum of the events for each region, the number of consecutive drought events decreased by 103 times in SC, 98 times in WNWC, 90 times in NC, 44 times in SWC, 19 times in ENWC, and 5 times in NEC during the period of 1980–1999 compared to the period of 1961–1979 (Figure 5D). However, the frequency of consecutive drought events has increased again since the early of this century, and the provinces of Yunnan, Guizhou, Gansu, and Neimeng are the regions with the high incidences of such events (Figure 5C). In the 2000 s and 2010 s, except for WNWC, where the number of consecutive drought events has continued to decrease, an increase prevailed over most stations of the other five regions (Figure 5E). Compared to the period of 1980–1999, the consecutive drought events increased by 77 times in SWC, 60 times in SC, 38 times in NEC, 11 times in NC, and 2 times in ENWC during the period of 2000–2019. In terms of the regional average over the whole study period, the consecutive drought events are more likely to occur in northern China, especially in WNWC, with an average of 6 consecutive drought events occurring at each station during the past decades.
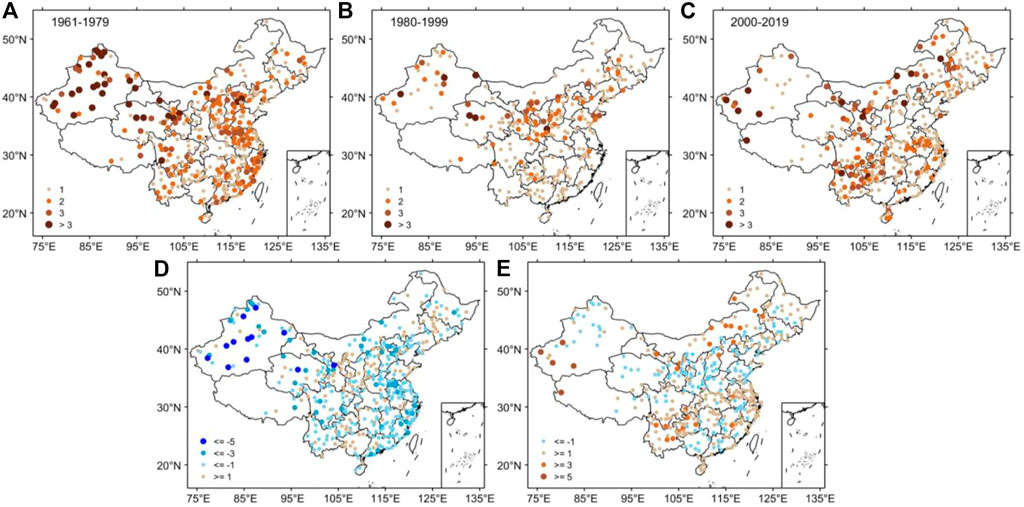
FIGURE 5. Spatial distributions of consecutive drought events in China for the period of (A) 1961–1979, (B) 1980–1999, and (C) 2000–2019. (D) Shows the changes of consecutive drought events between 1980–1999 and 1961–1979, and (E) shows the difference between 2000–2019 and 1980–1999.
We also investigated the changes of seasonal droughts in China over the past decades. Table 2 shows the statistics of seasonal drought frequency and intensity for different periods. In the 1960 s and 1970 s, droughts in China mainly occurred in summer and winter. The summer droughts mostly broke out in northern regions, with the highest frequency of 33.6% in WNWC, while the winter droughts mostly broke out in WNWC and NC, with drought frequency of 27.7% and 23.5%, respectively. Except for autumn, drought intensities of the other three seasons all reached the level of severe drought, led by winter. The strongest winter drought occurred in SC, with an intensity of −1.60. In the 1980 s and 1990 s, the frequency and intensity of seasonal droughts decreased in most areas of China compared with that in the previous period. During this period, the droughts mainly occurred at the autumn and winter seasons, and the autumn droughts mostly occurred in ENWC and NC with drought frequency of respective 22.9% and 19.3%, while the winter droughts mainly occurred in NEC and SC with the value of respective 21.0% and 19.1%. Additionally, the droughts in all seasons were at a moderate level with the intensity of approximately −1.44 in summer, autumn, and winter, while the spring droughts presented much weaker, particularly in SC. After entering the 21st century, the drought frequency over China is reported to increase in spring, summer, and autumn, but decrease in winter. Different from the change in drought frequency, the drought intensity during the 2000 s and 2010 s is observed to increase in all seasons compared to the 1980 s and 1990 s. Furthermore, the droughts can be observed to mainly occur in spring, especially over the regions of ENWC, NC, WNWC, and SC, with the occurring frequencies of 27.6%, 24.0%, 22.2%, and 20.4%, respectively. Additionally, the region of NEC has experienced the strongest drought in spring in recent 2 decades.
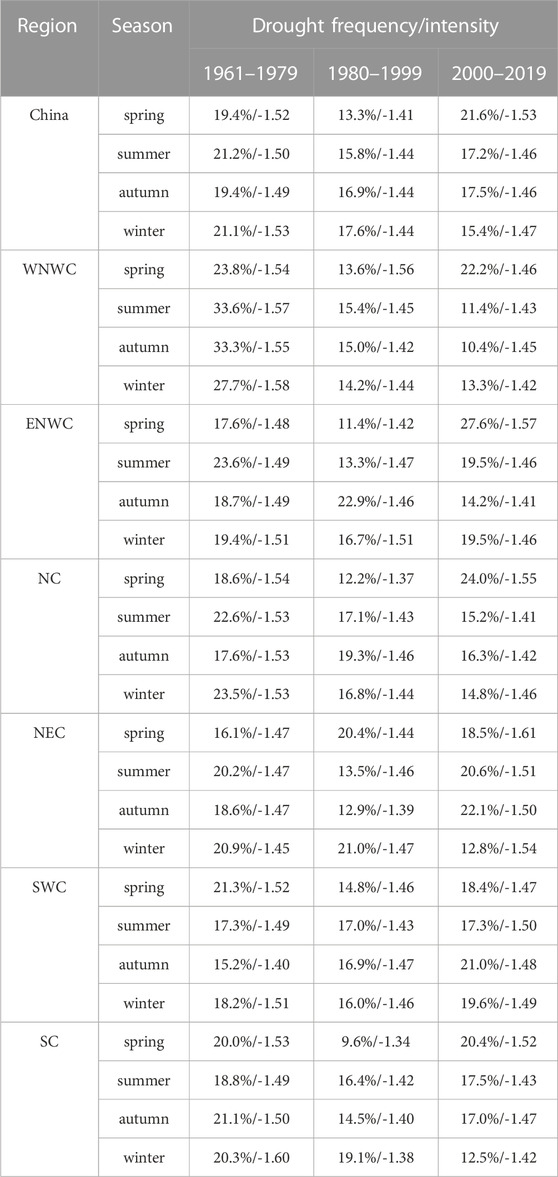
TABLE 2. Statistics of seasonal drought frequency (left column) and drought intensity (right column) during three periods (1961–1979, 1980–1999, 2000–2019) in different regions and China.
To further explore the changes in the drought impacted area for different seasons, we use drought station ratio here to represent the drought coverage for different regions. Before the 1990 s, the drought station ratios showed a decline tendency for all seasons and then increased, as shown in Figure 6. From the early 1960 s to the late 1980 s, the whole region was dominated by summer and winter droughts (Figure 6A), as indicated before. In the 1990 s, the droughts over China mainly occurred in autumn. However, more droughts can be observed in spring since the early 2000 s, and the coverage of spring droughts stabilized at the top of the four seasons. The changes in seasonal drought station ratios also differed greatly among regions. For WNWC (Figure 6B), more stations experienced droughts in summer and autumn before the early 1990 s and the ratios in all seasons showed a decreasing trend. Afterwards, the ratios started to increase, especially for the spring season. For ENWC (Figure 6C), the ratios for the four seasons presented an obvious interdecadal variability during the past 6 decades. The droughts mainly occurred in summer before the mid-1970 s, and then the autumn droughts mainly prevailed from the mid-1980 s to the late 1990 s. However, since the early of this century, the region of ENWC was prone to spring droughts. For NC (Figure 6D), the dominant seasonal droughts have transitioned from summer and winter droughts to autumn droughts and then to spring droughts, with dividing lines of the mid-1980 s and the late 1990 s. For NEC (Figure 6E), the station ratios for summer and autumn droughts showed an obvious interdecadal variability since the late 1970 s, with a trend of first decrease, then increase, and decrease again. The ratio for winter droughts showed a decreasing trend since the mid-1990 s, and the ratio for spring droughts showed an increasing tendency from the early 1980 s to the early 1990 s, but then decreased until the early 2010 s. For SWC (Figure 6F), we can see an increasing trend from the mid-1980 s to the late 2000 s for autumn droughts, and during the 1990 s and 2000 s, the number of stations occurring autumn droughts is the most in the four seasons. For SC (Figure 6G), the drought station ratios in summer, autumn, and winter exhibited a fluctuating decline over the last 60 years, but the ratio in spring has experienced an obvious process of decreasing first and then increasing, with the dividing line of the early 1990 s. Overall, analyses of changing characteristics for seasonal droughts indicate that since the beginning of this century, spring droughts have become the dominant seasonal droughts in China, no matter in frequency, intensity, or impacted area.
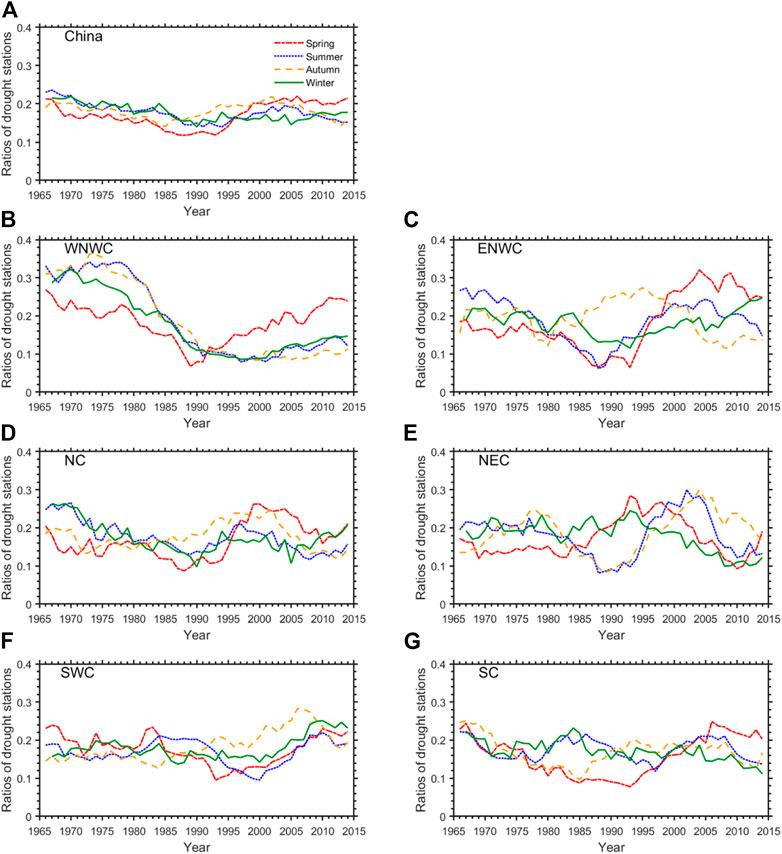
FIGURE 6. Plots of 11-year moving average of seasonal drought station ratios in (A) China and (B–G) six sub-regions (WNWC, ENWC, NC, NEC, SWC, SC) during the period of 1961–2019.
3.2 Roles of meteorological factors on drought changes
Drought is extremely complex and influenced by many factors. From the FAO Penman-Monteith equation, we can see that drought is not only affected by precipitation, but also influenced by temperature, wind speed, humidity, and other meteorological factors. Thus, a key issue would be raised about the contribution of these factors to drought changes in China. To explore this question, we set up four sensitivity experiments, assuming precipitation, temperature, wind speed, and humidity fixed as constant (the average from 1961 to 1980), respectively, and the true values are used for the other factors from observations, to recalculate the SPEI. Then, the differences between the true SPEI and the recalculated SPEI are considered as the impacts of the specified factor. For example, when considering the effect of precipitation, we assume precipitation as constant, but the actual observations of temperature, wind speed, humidity and other factors are still adopted, then using the new SPEI to calculate drought frequency over the last 20 years (2000–2019) and comparing it with the frequency under actual conditions, to get the potential contribution of precipitation anomalies to the drought changes.
Results show that precipitation and wind speed anomalies generally have inhibited the increase of droughts (Figure 7). Specifically, precipitation has a stronger negative effect on droughts in South and Northwest China, especially in northern Xinjiang, eastern Qinghai, and southeastern coastal areas (Figure 7A). Due to the precipitation variations, the drought frequency decreases by about 28.2%, 28.0%, and 22.1% in WNWC, SC, and ENWC, respectively, while relatively smaller in NEC and SWC with the value of 11.0% and 10.1%, respectively. The wind speed anomalies have greater influence on the droughts in northern China, and the drought frequency in WNWC, NC, NEC, and ENWC decreases by about 60.1%, 28.4%, 25.4%, and 22.8%, respectively, but this inhibiting effect is much weaker in SC and SWC with the value of both 4.8% (Figure 7C). The roles of temperature and humidity are opposite to that of precipitation and wind speed, increasing temperature and decreasing humidity can promote the occurrence of droughts. Compared with southern China, the droughts in northern China are more sensitive to temperature variations (Figure 7B). Approximately 46.7%, 25.2%, 19.9%, and 17.4% of the observed droughts in WNWC, ENWC, NC, and NEC have been caused by temperature anomalies in recent 20 years, respectively, but this proportion decreases to 6.5% and 6.4% in SC and SWC, respectively. The effects of humidity variations on drought changes are not as great as that of the other three meteorological elements, which present slightly stronger in eastern regions than that in western regions (Figure 7D). There are about 4.9%, 4.2%, and 3.9% of the observed droughts in SC, NEC, and NC being caused by humidity variations, followed by 2.8% and 1.2% in SWC and ENWC, respectively. However, in WNWC, humidity variations have a slight inhibition on the occurrence of droughts, with the frequency decreasing by about 4.7%.
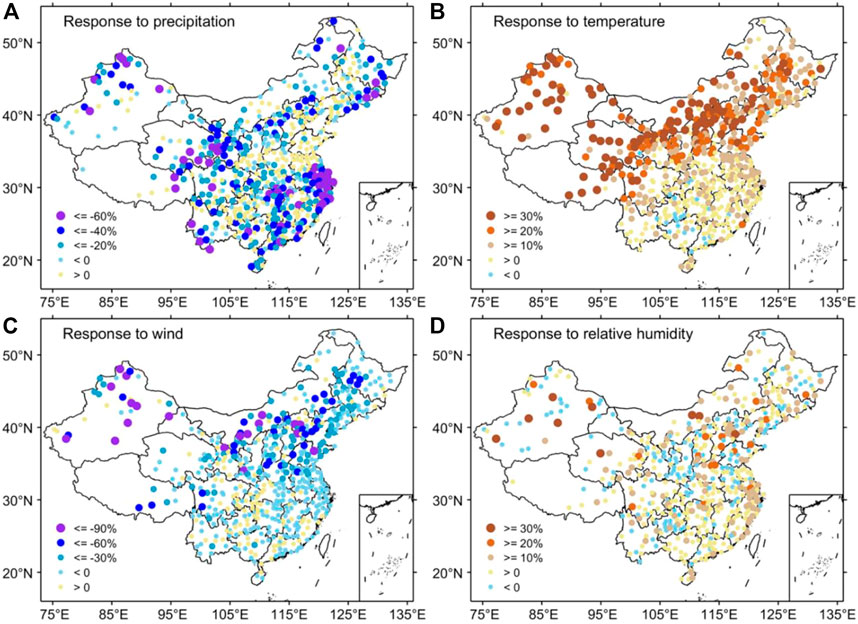
FIGURE 7. Response of drought frequency to the changes of (A) precipitation, (B) temperature, (C) wind speed, and (D) relative humidity during recent decades (2000–2019). Here, the response is defined as the relative change between actual drought frequency and the frequency under experimental conditions. Units: %.
4 Conclusions and discussion
In this work, FAO Penman-Monteith method is used to calculate the potential evapotranspiration, and we get the monthly SPEI values of 613 stations in China from 1961 to 2019. Based on SPEI, the variations of SPEI and the changes in drought frequency, drought intensity, and consecutive drought events during the past decades have been explored. Furthermore, the effects of changes in precipitation, temperature, wind speed, and humidity on drought changes are also investigated, which is the highlight of this paper.
Results indicate that the region of WNWC and some parts of SC and NEC are reported to have experienced a significant wetting trend, while some parts of SWC, ENWC, and NC have experienced a significant drying trend during the last 6 decades. The changing trends of droughts over China are similar to the results from previous studies (e.g., Wu et al., 2020; Wu et al., 2020). Further analyses show that the wetting tendency in WNWC mainly happened in the seasons of summer, autumn, and winter, while the drying trend in spring is the most prominent in ENWC. NC was dominated by the drying trend in spring and autumn but the wetting trend in summer and winter. Most parts of NEC are reported to have the wetting trends, especially for the season of winter. Some parts of SWC have suffered from the significant aridification in autumn and winter, while the wetting tendency is almost dominated over SC in summer and winter.
The changing features of drought frequency, drought intensity, and consecutive drought events during the period of 1961–2019 in China consistently indicate that there is an obvious interdecadal variability existing in the drought changes across China. The droughts were more frequent and severe for the periods of 1961–1979 and 2000–2019, but relatively fewer and weaker for the period of 1980–1999. The interdecadal variations of droughts are similar to the earlier study by Chen and Sun. (2015), who found that more droughts occurring before the 1980 s and in the 2000 s compared with the 1980 s and 1990 s. From the perspective of the changes in seasonal droughts, the summer and winter droughts prevailed over China in the 1960 s and 1970 s, but then the autumn and winter droughts became more prominent in the 1980 s and 1990 s. Since the beginning of this century, more severe and frequent spring droughts have become the dominant drought events across China. Especially in recent years, extreme droughts were observed to occur in South and Southwest China in the spring of 2018 and 2021, respectively (Zhang et al., 2020; Liu et al., 2022).
We further explore the potential effects of different meteorological factors on drought changes during recent decades. The relevant results show that the precipitation anomalies generally have exerted a great inhibiting effect on droughts in China. Drought frequency decreases by 28.2%, 28.0%, and 22.1% in WNWC, SC, and ENWC, respectively, due to the precipitation changes. The roles of wind speed variations in drought changes are like that of precipitation variations, which make a stronger inhibition on droughts in the regions of WNWC (60.1%), NC (28.4%), NEC (25.4%), and ENWC (22.8%). Contrary to the effects of the former two factors, temperature and humidity anomalies contribute to the increase of droughts. There are approximately 46.7%, 25.2%, 19.9%, and 17.4% of the observed droughts over the last 2 decades in WNWC, ENWC, NC, and NEC being caused by temperature changes, respectively. Humidity variations generally present a slightly greater influence on the droughts in eastern China, which bring about 4.9%, 4.2%, and 3.9% of the droughts in SC, NEC, and NC, respectively. It should be admitted that this work also has some limitations. The types and causes of droughts are complicated, and the dry conditions cannot be reflected via only one index. Here, our analyses of changes in drought characteristics are just based on SPEI. Thus, it is more objective and appropriate to combine multiple drought and hydrological indices when monitoring drought changes in the future. Additionally, the effects of meteorological factors on droughts are non-linear, but we explore the contributions of these factors to drought changes by controlling variables from linear perspectives, which requires more in-depth analyses in further work. Moreover, the changes in drought events are not only associated with the local meteorological factors, but also modulated by the dynamical and thermodynamic processes of atmospheric circulation systems. Some studies have made efforts to identify the related atmospheric physical mechanisms for the changes in droughts in China. For example, Li et al. (2018) revealed that the decline of Barents Sea ice in March is the key factor leading to the hot drought events over northeastern China in July-August of 2016. The warm sea surface temperature anomalies over central equatorial Pacific have an important contribution to the severe droughts over east China from August to October 2019 (Ma et al., 2020). But the occurrences and changes in droughts are quite complex, more studies especially connecting to the underlying physical mechanisms are needed in the future.
Data availability statement
Publicly available datasets were analyzed in this study. This data can be found here: http://www.nmic.cn/.
Author contributions
QW: formal analysis; investigation; writing original draft; writing-review and editing. HC: supervision; writing-review and editing.
Funding
This work was jointly supported by the National Key Research and Development Program of China (Grant No: 2022YFF0801303) and the National Natural Science Foundation of China (Grant No: 42075021).
Conflict of interest
The authors declare that the research was conducted in the absence of any commercial or financial relationships that could be construed as a potential conflict of interest.
Publisher’s note
All claims expressed in this article are solely those of the authors and do not necessarily represent those of their affiliated organizations, or those of the publisher, the editors and the reviewers. Any product that may be evaluated in this article, or claim that may be made by its manufacturer, is not guaranteed or endorsed by the publisher.
References
Allen, R. G., Pereira, L. S., Raes, D., and Smith, M. (1998). Crop evapotranspiration: Guidelines for computing crop water requirements. FAO Irrigation and Drainage Paper 56, 300.
Bai, Q., Yan, P., Cai, D., Jin, H., Feng, G., and Zhang, T. (2019). Inter-decadal change characteristics of different grades drought in northwest China in recent 56 years (in Chinese). J. Arid Meteorology 37, 722–728. doi:10.11755/j.issn.1006-7639(2019)-05-0722
Chen, H., and Sun, J. (2017). Anthropogenic warming has caused hot droughts more frequently in China. J. Hydrology 544, 306–318. doi:10.1016/j.jhydrol.2016.11.044
Chen, H., and Sun, J. (2015). Changes in drought characteristics over China using the standardized precipitation evapotranspiration index. J. Clim. 28, 5430–5447. doi:10.1175/jcli-d-14-00707.1
Deng, S., Liu, S., and Mo, X. (2021). Assessment and attribution of China’s droughts using an integrated drought index derived from GRACE and GRACE-FO data. J. Hydrology 603, 127170. doi:10.1016/j.jhydrol.2021.127170
Guttman, N. B. (1998). Comparing the Palmer drought severity index and the standardized precipitation index. J. Am. Water Resour. Assoc. 34, 113–121. doi:10.1111/j.1752-1688.1998.tb05964.x
Han, R., Li, Z., Li, Z., and Han, Y. (2021). Spatial-temporal assessment of historical and future meteorological droughts in China. Atmosphere 12, 787. doi:10.3390/atmos12060787
IPCC (2021). Climate change 2021: The physical science basis. Contribution of working group I to the Sixth assessment Report of the intergovernmental Panel on climate change. Cambridge: Cambridge University Press.
Jensen, M. E., Burman, R. D., and Allen, R. G. (1990). Evapotranspiration and irrigation water requirements. ASCE Man. Pract. 70, 360.
Jia, Y., Zhang, B., and Ma, B. (2018). Daily SPEI reveals long-term change in drought characteristics in southwest China. Chin. Geogr. Sci. 28, 680–693. doi:10.1007/s11769-018-0973-3
Kuwayama, Y., Thompson, A., Bernknopf, R., Zaitchik, B., and Vail, P. (2019). Estimating the impact of drought on agriculture using the US drought monitor. Am. J. Agric. Econ. 101, 193–210. doi:10.1093/ajae/aay037
Li, C., Xiao, Z., and Zhang, X. (2012). Climatic characteristics of precipitation in various regions of China for the past 60 years (in Chinese). Meteorol. Mon. 38, 419–424. doi:10.7519/j.issn.1000-0526.2012.4.005
Li, H., Chen, H., Wang, H., Sun, J., and Ma, J. (2018). Can Barents sea ice decline in spring enhance summer hot drought events over northeastern China? J. Clim. 31, 4705–4725. doi:10.1175/JCLI-D-17-0429.1
Li, L., She, D., Zheng, H., Lin, P., and Yang, Z. (2020). Elucidating diverse drought characteristics from two meteorological drought indices (SPI and SPEI) in China. J. Hydrometeorol. 21, 1513–1530. doi:10.1175/jhm-d-19-0290.1
Liang, F., Liu, D., Wang, W., Zhang, F., and Wang, X. (2017). Temporal and spatial distributions of drought in northeast China in 1961-2014 based on standardized precipitation evapotranspiration index (in Chinese). J. Desert Res. 37, 148–157. doi:10.7522/j.issn.1000-694X.2015.00288
Liu, K., and Jiang, D. (2015). Analysis of dryness/wetness over China using standardized precipitation evapotranspiration index based on two evapotranspiration algorithms (in Chinese). Chin. J. Atmos. Sci. 39, 23–36. doi:10.3878/j.issn.1006-9895.1402.13265
Liu, X., Wang, S., Zhou, Y., Wang, F., Li, W., and Liu, W. (2015). Regionalization and spatiotemporal variation of drought in China based on standardized precipitation evapotranspiration index (1961-2013). Adv. meteorology 2015, 1–18. doi:10.1155/2015/950262
Liu, Y., Hu, Z. Z., Wu, R., and Yuan, X. (2022). Causes and predictability of the 2021 spring southwestern China severe drought. Adv. Atmos. Sci. 39, 1766–1776. doi:10.1007/s00376-022-1428-4
Ma, N., Szilagyi, J., and Zhang, Y. Q. (2021). Calibration-free complementary relationship estimates terrestrial evapotranspiration globally. Water Resour. Res. 57, e2021WR029691. doi:10.1029/2021wr029691
Ma, S., Zhu, C., and Liu, J. (2020). Combined impacts of warm central equatorial Pacific sea surface temperatures and anthropogenic warming on the 2019 severe drought in east China. Adv. Atmos. Sci. 37, 1149–1163. doi:10.1007/s00376-020-0077-8
McKee, T. B., Doesken, N. J., and Kleist, J. (1993). “The relationship of drought frequency and duration to time scales,” in Eighth conf. On applied climatology (Anaheim, CA: Amer. Meteor. Soc), 179–184.
Palmer, W. C. (1965). Meteorological drought. Research Paper No.45. Washington: Office of Climatology U.S. Weather Bureau.
Schumacher, D. L., Keune, J., Dirmeyer, P., and Miralles, D. G. (2022). Drought self-propagation in drylands due to land-atmosphere feedbacks. Nat. Geosci. 15, 262–268. doi:10.1038/s41561-022-00912-7
Spinoni, J., Naumann, G., Carrao, H., Barbosa, P., and Vogt, J. (2014). World drought frequency, duration, and severity for 1951–2010. Int. J. Climatol. 34, 2792–2804. doi:10.1002/joc.3875
Szalai, S., Szinell, C. S., and Zoboki, J. (2000). Drought monitoring in Hungary. Early warning systems for drought preparedness and drought management. World Meteorol. Organ. 1037, 182–199.
Vicente-Serrano, S. M., Beguería, S., and López-Moreno, J. I. (2010). A multiscalar drought index sensitive to global warming: The standardized precipitation evapotranspiration index. J. Clim. 23, 1696–1718. doi:10.1175/2009jcli2909.1
Vicente-Serrano, S. M., and López-Moreno, J. I. (2005). Hydrological response to different time scales of climatological drought: An evaluation of the standardized precipitation index in a mountainous mediterranean basin. Hydrology earth Syst. Sci. 9, 523–533. doi:10.5194/hess-9-523-2005
Wang, D., Zhang, B., An, M., Zhang, T., Ji, D., and Ren, P. (2014). Temporal and spatial distributions of drought in southwest China over the past 53 years based on standardized precipitation evapotranspiration index (in Chinese). J. Nat. Resour. 29, 1003–1016. doi:10.11849/zrzyxb.2014.06.009
Wang, Y., Ren, F., Zhao, Y., and Li, Y. (2017). Comparison of two drought indices in studying regional meteorological drought events in China. J. Meteorological Res. 31, 187–195. doi:10.1007/s13351-017-6075-9
Wells, N., Goddard, S., and Hayes, M. J. (2004). A self-calibrating Palmer drought severity index. J. Clim. 17, 2335–2351. doi:10.1175/1520-0442(2004)017<2335:aspdsi>2.0.co;2
Wu, H., Hayes, M. J., Weiss, A., and Hu, Q. (2001). An evaluation of the standardized precipitation index, the China-Z Index and the statistical Z-Score. Int. J. Climatol. 21, 745–758. doi:10.1002/joc.658
Wu, M., Li, Y., Hu, W., Yao, N., Li, L., and Liu, D. (2020a). Spatiotemporal variability of standardized precipitation evapotranspiration index in mainland China over 1961-2016. Int. J. Climatol. 40, 4781–4799. doi:10.1002/joc.6489
Wu, Z., Yu, L., Du, Z., Zhang, H., Fan, X., and Lei, T. (2020b). Recent changes in the drought of China from 1960 to 2014. Int. J. Climatol. 40, 3281–3296. doi:10.1002/joc.6397
Xu, Y., Zhang, X., Hao, Z., Hao, F., and Li, C. (2021). Projections of future meteorological droughts in China under CMIP6 from a three-dimensional perspective. Agric. Water Manag. 252, 106849. doi:10.1016/j.agwat.2021.106849
Yang, J., Gong, D., Wang, W., Hu, M., and Mao, R. (2012). Extreme drought event of 2009/2010 over southwestern China. Meteorology Atmos. Phys. 115, 173–184. doi:10.1007/s00703-011-0172-6
Yang, Q., Li, M., Zheng, Z., and Ma, Z. (2017). Regional applicability of seven meteorological drought indices in China (in Chinese). Sci. China Earth Sci. 47, 337–353. doi:10.1007/s11430-016-5133-5
Yao, N., Li, L., Feng, P., Feng, H., Liu, D., Liu, Y., et al. (2020). Projections of drought characteristics in China based on a standardized precipitation and evapotranspiration index and multiple GCMs. Sci. Total Environ. 704, 135245. doi:10.1016/j.scitotenv.2019.135245
Yu, M., Li, Q., Hayes, M. J., Svoboda, M. D., and Heim, R. R. (2014). Are droughts becoming more frequent or severe in China based on the standardized precipitation evapotranspiration index: 1951–2010? Int. J. Climatol. 34, 545–558. doi:10.1002/joc.3701
Yu, R., and Zhai, P. (2020). Changes in compound drought and hot extreme events in summer over populated eastern China. Weather Clim. Extrem. 30, 100295. doi:10.1016/j.wace.2020.100295
Yu, W., Shao, M., Ren, M., Zhou, H., Jiang, Z., and Li, D. (2013). Analysis on spatial and temporal characteristics drought of Yunnan Province. Acta Ecol. Sin. 33, 317–324. doi:10.1016/j.chnaes.2013.09.004
Zhang, L., Zhou, T., Chen, X., Wu, P., Christidis, N., and Lott, F. C. (2020). The late spring drought of 2018 in South China. Bull. Am. Meteorological Soc. 101, S59–S64. doi:10.1175/bams-d-19-0202.1
Zhang, M., He, J., Wang, B., Wang, S., Li, S., Liu, W., et al. (2013). Extreme drought changes in southwest China from 1960 to 2009. J. Geogr. Sci. 23, 3–16. doi:10.1007/s11442-013-0989-7
Zhang, X., Yu, J., Li, L. Z. X., and Li, W. (2022). Role of anthropogenic climate change in autumn drought trend over China from 1961 to 2014. J. Meteorological Res. 36, 251–260. doi:10.1007/s13351-022-1178-3
Zhao, M., Geruo, A., Liu, Y. L., and Konings, A. G. (2022). Evapotranspiration frequently increases during droughts. Nat. Clim. Change 12, 1024–1030. doi:10.1038/s41558-022-01505-3
Keywords: drought, SPEI, precipitation, temperature, wind speed
Citation: Wen Q and Chen H (2023) Changes in drought characteristics over China during 1961–2019. Front. Earth Sci. 11:1138795. doi: 10.3389/feart.2023.1138795
Received: 06 January 2023; Accepted: 11 April 2023;
Published: 21 April 2023.
Edited by:
Hakki Baltaci, Gebze Technical University, TürkiyeReviewed by:
Ning Ma, Institute of Geographic Sciences and Natural Resources Research, Chinese Academy of Sciences (CAS), ChinaGang Zeng, Nanjing University of Information Science and Technology, China
Copyright © 2023 Wen and Chen. This is an open-access article distributed under the terms of the Creative Commons Attribution License (CC BY). The use, distribution or reproduction in other forums is permitted, provided the original author(s) and the copyright owner(s) are credited and that the original publication in this journal is cited, in accordance with accepted academic practice. No use, distribution or reproduction is permitted which does not comply with these terms.
*Correspondence: Huopo Chen, Y2hlbmh1b3BvQG1haWwuaWFwLmFjLmNu