 Ling Bai
 Chaoya Liu1,2
 Yingfeng Ji
 Weiling Zhu
- 1State Key Laboratory of Tibetan Plateau Earth System, Resources and Environment, Institute of Tibetan Plateau Research, Chinese Academy of Sciences, Beijing, China
- 2University of Chinese Academy of Sciences, Beijing, China
A powerful volcanic eruption that occurred in Tonga on 15 January 2022, produced strong vibrations in the atmosphere, ocean, and solid Earth. We identify infrasound waves traveling with an apparent velocity of 0.31 km/s up to 10,000 km from Tonga in seismic and tsunami recordings. Clear signals of these infrasound waves with a fundamental model of Lamb wave are evident before the shallow-water gravity wave and after the Rayleigh and body waves. The pressure amplitudes of the infrasound waves at stations of 400–1000 km from the eruption are 5–10 hPa. The infrasound wave generated trans-Pacific tsunami waves to arrive 4–5 h earlier than the gravity waves of regular tsunami in the populated countries near the Pacific oceans. We use numerical simulation methods for the oceanic plate subduction zone in Tonga to estimate the pressure-temperature fields and the desulfurization at shallow depths. The simulated total sulfur dioxide released during the eruption ranges from 0.4 to 2.0 Tg. This is small in comparison with previous studies of comparable infrasound pressures. The total emission and sulfur dioxide amounts may have been controlled by the amount of sulfur contained in the subducted plate as well as the pressure and temperature conditions of the subduction zones.
1 Introduction
The Hunga Tonga-Hunga Ha’apai (HTHH) volcano is in the northern part of the Tonga-Kermedec arc (20.546°S, 175.390°W). Here, the Pacific plate subducts beneath the Indo-Australian plate at a rate of 10–20 cm/yr and the Wadati-Benioff zone extends to 700 km depth (Kawakatsu, 1985; Bevis et al., 1995; Liu et al., 2012) (Figure 1). The potential for devastating volcanic eruptions in the Tonga-Kermedec arc has long been recognized. Recent volcanic eruptions in Tonga occurred in March 2009, November 2014, and August 2019 (Btandl et al., 2020; Zhao et al., 2022). The major eruption on 15 January 2022 (hereafter referred to as the HTHH eruption) generated an ash plume that reached the mesosphere at nearly 60 km altitude with a maximum diameter of 600 km (https://volcano.si.edu/volcano.cfm?vn=243040) (Proud et al., 2022). Tsunami waves had a height of up to 15 m near HTHH and were still over 1 m high along all coasts of the Pacific Ocean (Brodsky and Lay, 2022; Kubota et al., 2022; Matoza et al., 2022; Vergoz et al., 2022; Yuen et al., 2022; Zhao et al., 2022).
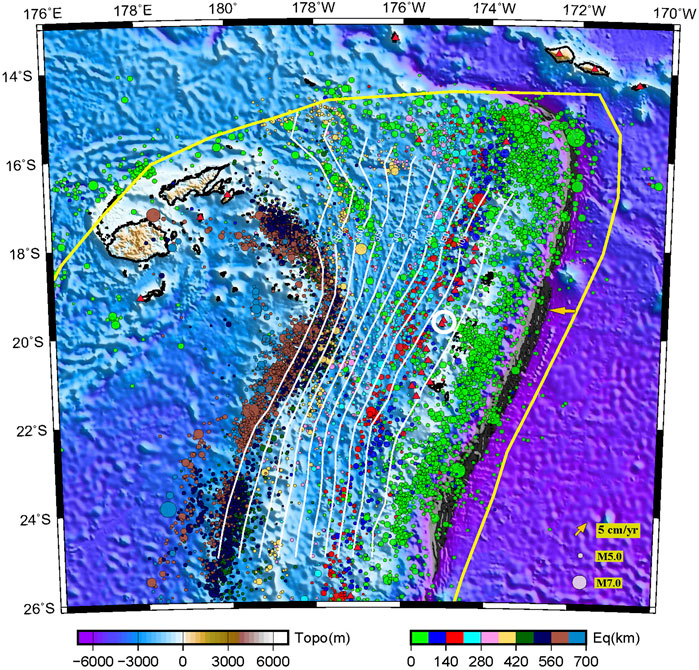
FIGURE 1. Plate tectonic background with earthquake (colored circles) and volcanic (red triangles) distributions in the Tonga subduction zone. The white circle indicates the location of the HTHH volcano. White curves represent the iso-depth contours of the subducted plate upper surface in the Tonga-Kermadec arc (Slab2). Yellow arrows indicate the plate subduction velocities (cm/yr). The yellow line denotes the plate boundary.
Figure 2 shows sentinel 2A/B satellite images provided by the European Space Agency before (2 January 2022) and after (17 January 2021) the HTHH eruption. The source areas are heavily covered in clouds, and the satellite images before the HTHH eruption are blurry for most of the time. On 2 January 2022, the satellite images revealed green seawater to the west and white steam emission to the southeast of the HTHH. The area of HTHH island was approximately 3.6 km2 (Figure 2A) on 2 January 2022. After the eruption, only a small remnant of the southwestern and northeastern ends of the HTHH remained above sea level (Figure 2B). The subaerial HTHH eruption caused strong vibrations in the atmosphere, ocean, and solid Earth, and released Sulfur dioxide (SO2) with heightened concerns for environmental effects (Dalton et al., 2010; Matoza et al., 2022; Yuen et al., 2022) (https://volcano.si.edu).
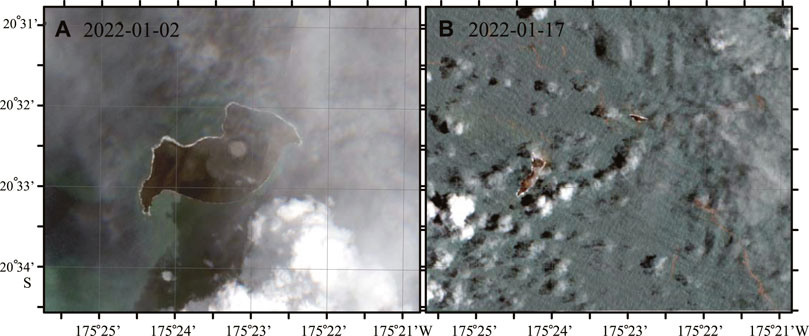
FIGURE 2. Sentinel2A/B satellite images obtained (A) on 2 January 2022, before the volcanic eruption and (B) on 17 January 2022, after the volcanic eruption. The white curve area is plotted based on the outline of the island area above the ocean surface on 2 January 2022.
These vibrations caused by the HTHH eruption were well recorded by seismic stations and ocean bottom pressure sensors around the world. The infrasound waves associated with temporal variations in atmospheric pressures have been used to study eruption dynamics (Johnson and Rippepe, 2011; Watson et al., 2022). Immediately before the major eruption on 15 January 2022, there was no shallow earthquake of Mw≥4.0 within 50 km of the HTHH (https://earthquake.usgs.gov/). Within 24 h after the eruption, the earthquake swarm with moderate-magnitude shallow events occurred in the eruption area (Kintner et al., 2022). These earthquakes are too small to generate tsunamis, so the HTHH eruption and the generated infrasound waves are likely the cause for the trans-Pacific tsunami waves.
The infrasound waves have dominant frequency ranges smaller than 20 Hz. These low-frequency signals can travel long distances in the air, water and solid Earth with weak attenuations (Chen and Xue, 2021). These signals have been related to the volcanic degassing process, which is often used to evaluate the environmental effects after the volcanic eruption. The gas emission rate q(t) (kg/s) can be calculated by integrating the temporal variation in observed pressure:
where p is the infrasound pressure recorded at time t, traveling at the speed of sound c, to a distance r from the source (Dalton et al., 2010; Fee et al., 2017). Generic gas compositions for small explosions include about 1.15% SO2 with respect to the total gas emission amount (Mori and Burton, 2009). Recent studies have monitored volcanic sulfur fluxes for large eruptions by microwave satellites with various sensors (Rowe et al., 2000; Carn et al., 2016). However, accurate measurement of the gas emission for remote volcanoes is challenging. The released amount of SO2 in the serpentinized slab can be roughly estimated through subduction models under high pressure‒temperature (P‒T) conditions (Alt et al., 2013; Ji et al., 2017).
In this study, we analyze different vibrations in the atmosphere, ocean, and solid Earth caused by the HTHH eruption from seismic and tsunami waveforms. We use numerical simulations with the local subduction zone condition to estimate the volcanic sulfur fluxes. We then compare the estimated infrasound waves and the released SO2 to previous volcanic eruptions. Our study provides a new constraint for the strength of the infrasound waves and the emissions of SO2 by the HHTH eruption.
2 The recordings of seismic, infrasound, and tsunami waves
We analyze waveforms from global seismic stations archived at the Incorporated Research Institution for Seismology (IRIS) (https://ds.iris.edu/wilber3/find_event) (Figure 3). The record for the nearest station, MSVF (Monasavu, Fiji), confirms that the origin time of the major eruption is at 4:15 am UTC (7:15 am local time) on 15 January 2022. The first pulse after the origin time lasted for approximately 6,000 s. A record section reveals several coherent high-amplitude pulses (Figure 4A).
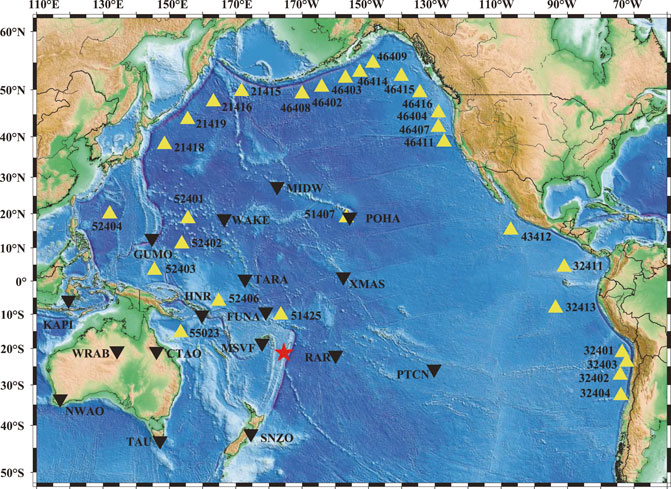
FIGURE 3. Seismic stations (black triangles) and ocean bottom pressure gauges (yellow triangles) used in this study.
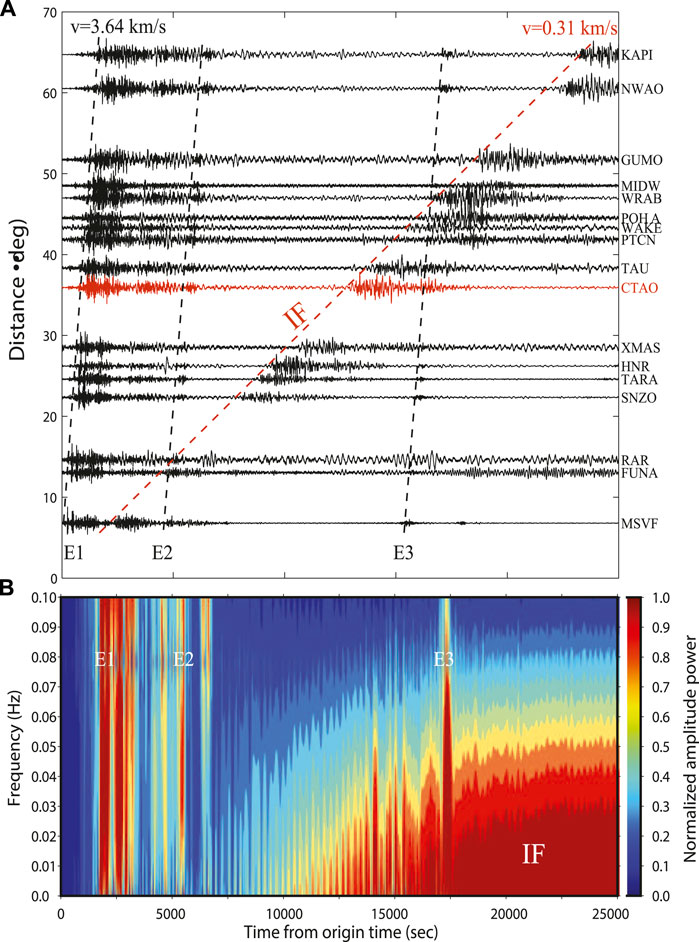
FIGURE 4. (A) Recorded cross section of the vertical-component seismic waveforms. The first pulse of Rayleigh wave is noted as E1. Rayleigh waves from two smaller eruptions are noted as E2 and E3. The infrasound wave is indicated by IF. We used the bandpass filtering of 0.005–0.02 Hz to bring the infrasound wave out of the high-frequency signals. (B) Spectrogram recorded by station CATO at an epicentral distance of 36°. E1, E2, E3, and IF are indicated.
The fast wave is the Rayleigh wave with an apparent propagation velocity of 3.64 km/s (E1). The direct P and S waves arrive at similar times within the first pulse but are suppressed by the filtering of 0.005–0.02 Hz (50–200 s) (Yuen et al., 2022). The Rayleigh wave is an elastic wave that traveled through the crust and upper mantle. Smaller pulses with Rayleigh-wave apparent velocities are also clear in the 7-h (25,000 s) long records on 15 January 2022 at 5:30 UTC (E2) and at 8:25 UTC (E3) (Poli and Shapiro, 2022). The slow wave is recorded between 2,000 and 20,000 s after the Rayleigh wave at the stations with distances of 7°–70°. It has an apparent propagation velocity of 0.31 km/s, consistent with infrasound waves in the atmosphere. Both signals have emergent onsets and long durations as mass-wasting events (Bai et al., 2022). These characteristics are distinct from recordings of regular earthquakes occurring in lands and oceans, which show impulse P and S wave onset and short durations (Ritsema et al., 2012; Bai et al., 2019; Liu et al., 2021).
Figure 4B shows the spectrogram for station CTAO (Charters Towers, Australia) at an epicentral distance of 36°. The frequency response of the EPOSENSOR instrument is from DC to 200 Hz, which allows us to study motions at low frequencies (http://earthquake.usgs.gov). The infrasound pulse at ∼13,000 s has frequencies lower than 0.05 Hz. These low-frequency signals traveled a long distance and had an N-wave shape with weak attenuation. These observations suggest that the infrasound pulse is a Lamb wave, which is a fundamental mode of infrasound, propagating along the troposphere (Amores et al., 2022; Matoza and Roman, 2022; Yamada et al., 2022; Wang et al., 2023).
Ocean-bottom-pressure records from DART sensors on the seafloor of the northern Pacific Ocean (Figure 3) reveal a third wave type. The DART data from the National Oceanic and Atmospheric Administration (NOAA) Tsunami Program (https://www.tsunami.noaa.gov/tsunami-detection) are records of ocean-bottom pressure sampled every 15 s. We bandpass filter the time series with corner periods of 1000 and 10,000 s. The section in Figure 5 shows a clear onset of the infrasound with an apparent velocity of ∼0.31 km/s, like the infrasound signal in Figure 4. The infrasound wave is followed by a higher-frequency tsunami wave with an apparent velocity of 0.2 km/s.
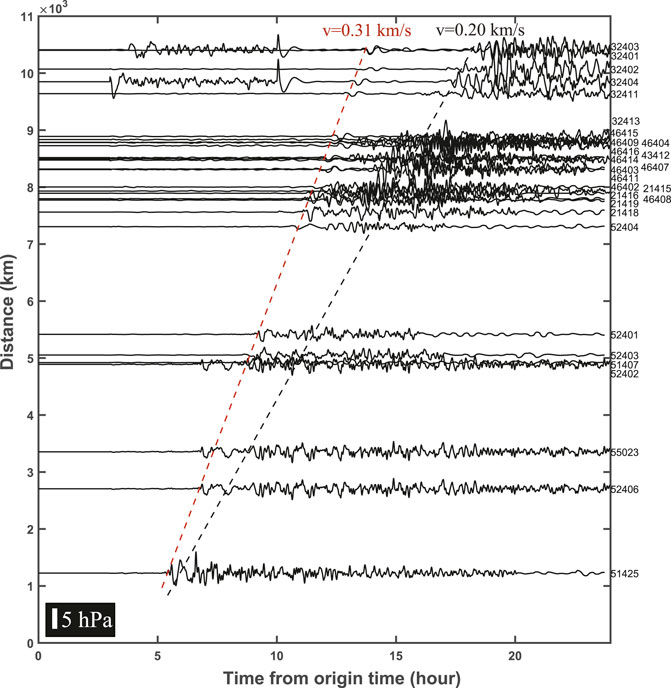
FIGURE 5. Record section of ocean-bottom pressure recorded by DART sensors with a continuous recording of 24 h after the eruption origin time. Waveforms are bandpass filtered from 0.0001 to 0.005 Hz. The infrasound wave has an apparent velocity of 0.31 km/s. The waves with an apparent velocity of 0.20 km/s, which arrived up to 5 hours after the infrasound at 10,000 km, is a shallow-water gravity wave.
The DART records indicate that the infrasound wave has an initial small positive onset followed by a clear negative amplitude signal. The pressure amplitude of the Lamb wave is approximately 5 hPa at the closest station 51,425 with a distance of 1000 km from HTHH (Figure 5). This observation is consistent with the values of 10 hPa observed at the infrasound station IS-I at a distance of 500 km, and 9 hPa at the atmospheric pressure station MSVF in Fuji at a distance of 757 km (Matoza et al., 2022; Yamada et al., 2022). The infrasound waves are recorded 4–5 h earlier than the tsunami waves at stations with distances of approximately 10,000 km. The early arrivals recorded by stations 55,023 and 51,407 at distances around 4,000 km might be caused by the local clock issue. However, the abnormally large amplitudes that appeared several hours before the tsunami signals at stations 32,404 and 32,403 around 10,000 km are unclear.
3 Numerical modeling of sulfur dioxide
To investigate the gas emission amount for the HTHH eruption, we utilize a numerical model for the dynamic modeling under the subduction zone conditions (Ji et al., 2017; Plank and Manning, 2019). An approximation and the equations of conservation of mass, momentum, and energy are used as:
where
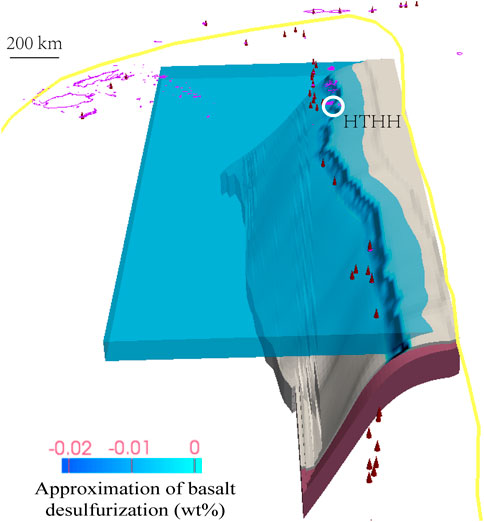
FIGURE 6. Three-dimensional distribution of desulfurization of the basalt layer in the subducted Pacific Plate below the HTHH volcano. The red cones denote the volcanoes. The blue stripe on the subducted plate represents the desulfurization belt on the plate interface. The mid-ocean ridge is shown on the top of slab.
We found that the average desulfurization rate under the Tonga-Kermedec arc is greater than 0.01 wt%, while the maximum value directly below the HTHH volcano reaches approximately 0.1 wt%. The largest desulfurization rate occurred at the petrological metamorphic boundaries of ultramafic rocks inside the subducted plate. The total emission amounts of SO2 are controlled by the amount of sulfur contained in the subducted plate as well as the pressure and temperature conditions of the subduction zones (Devine et al., 1984; Guo et al., 2003). The desulfurization of the basalt layer of the subducted mid-ocean ridge in the Pacific Plate is approximately 0.23 Tg (230,000 tons), which can produce the eruption amount of SO2 by 0.46 Tg for the local volcanic area (Carn et al., 2022). This observation is consistent with the 0.40–0.42 Tg of the SO2 eruption observed by the TROPOMI instrument on the Sentinel-5P satellite in the first 3 days (https://volcano.si.edu). Numerical modeling of SO2 is essential especially for the volcanoes with blurry satellite images or inefficient nearby filed observations. Assuming the desulfurization area (100 km2), magma upward lost (40%–80%), and porosity of the overlying Indo-Australian Plate (1%–5%), we estimated that the total surface eruption of SO2 during volcanic eruptions at the HTHH area can reach up to 2 Tg.
4 Conclusion and discussion
Rayleigh, infrasound, and tsunami waves are clear in Global Seismic Network and DART stations following the HHTH eruption. Volcanic eruptions are prone to generate explosive sound and infrasound, which impact the water surface (Huang et al., 2022; Matoza et al., 2022; Yang et al., 2022). The pulse of the infrasound wave generated by the HTHH volcano is as large as that of the 1883 Krakatau eruption at comparable distances. But the duration of the HTHH infrasound wave was ∼30% smaller than that of the Krakatau (Matoza et al., 2022). The destructive tsunami produced by the submarine 1883 Krakatau eruption is caused by the pyroclastic flow (Self and Rampino, 1981). The origin time and location estimated from recorded cross section of seismic waveforms (Figure 4) and ocean-bottom pressures (Figure 5) confirmed that the infrasound waves are generated by the HTHH volcanic eruption. The Lamb waves, as a fundamental mode of infrasound waves generated by the HTHH eruption is the major cause for producing the tsunami to arrive 4–5 h earlier than the regular tsunami at the populated coastlines for countries near the Pacific and the Atlantic oceans (Ramirez-Herrera et al., 2022; Wang et al., 2022). This source of the tsunami caused by the infrasound waves needs to be considered in the tsunami warning systems in the future.
The time series of the infrasound wave records has been correlated with the volcanic degassing process based on observations of many small volcanoes (Bluth et al., 2007; Mori and Burton, 2009; Dalton et al., 2010). Large volcanic eruptions are expected to create strong infrasound waves with proportional amounts of gas and SO2 emissions (Eq. 1). Table 1 shows infrasound waves and total SO2 releases for individual eruptions. A single Redoubt volcanic eruption that occurred on 27 March 2009, produced maximum infrasound waves of 1 hPa at a local station of 12 km. There were 4 large eruptions that occurred from March to April 2009, and each of them has infrasound waves of 1–2 hPa. The cumulative SO2 release for the Redoubt eruption in the period from March to June 2009 is 0.5–0.6 Tg (Rowe et al., 2000; McNutt et al., 2013). The SO2 emission for a single eruption can be estimated from the average value of the 4 large eruptions as 0.1–0.15 Tg. The Manam volcano erupted on 28 January 2005, generated infrasound waves of 1 Pa at a station of 2000 km with SO2 release of 0.14 Tg (Rowe et al., 2000; Dabrowa et al., 2011). The Raikoke volcano in Kuril island erupted on 22 June 2019, produced 0.3 Tg SO2 mass with 1 Pa pressure recorded at infrasound stations approximately 400 km apart (McKee et al., 2021). The Nabro volcano, Eritrea erupted on 13 June 2011 and showed a high SO2 amount of 1.3 Tg with recorded pressures up to 6 Pa recorded at an infrasound array of approximately 250 km (Fee et al., 2013; Goitom et al., 2015). Compared with these previous studies, the HTHH eruption with infrasound of 5–10 hPa at the distances of 400–1000 km from the eruption seems to have produced a small amount of SO2 of 0.46 Tg (Table 1).
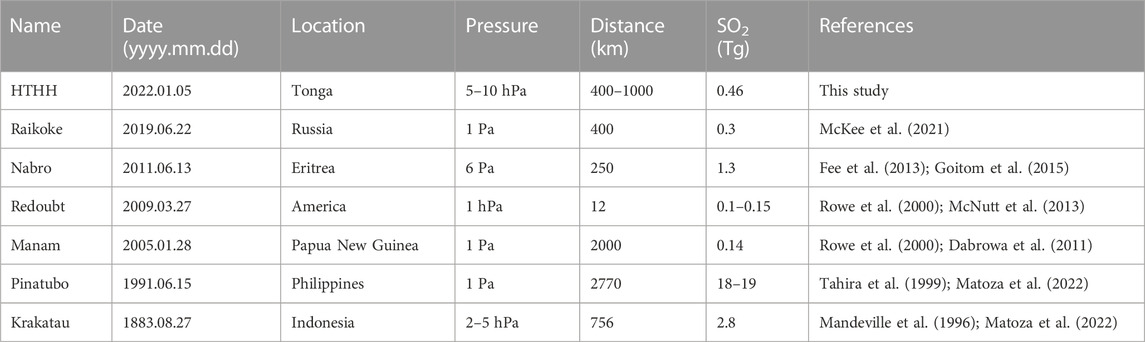
TABLE 1. Infrasound pressures and SO2 emissions for individual eruptions.
Mount Pinatubo volcano of the Philippines erupted in 1991 released approximately 18–19 Tg of SO2. The released SO2 during the HTHH volcanic eruption is at least one order of magnitude smaller than that of Mount Pinatubo (Matoza et al., 2022). From the modeling, we found that the volcanic eruption levels depend not only on the amount of sulfur contained in the subducted plate but also on factors such as the porosity of the overlying crust, the size of the magma chamber, the P-T condition and the components of the subducted plate (Butterfield et al., 2011; Bataleva et al., 2018). The thermal gradient in the mantle beneath the HTHH is much smaller than that beneath Mount Pinatubo (Robock et al., 2007; Matoza et al., 2022). The megathrust underneath the Tonga-Kermedec arc is characterized by a cooler plate interface because of the older subducted plate than that in the Philippines (Johnson et al., 2004; Ji et al., 2016). The temperature range elevated for desulfurization at the Tonga subduction zone is consequently much lower than that beneath the Philippines. We thus suggest that there is less potential to create a significant global temperature drop in the years following the HTHH eruption considering the small amount of SO2 contributions in Tonga.
Data availability statement
The original contributions presented in the study are included in the article. Further inquiries can be directed to the corresponding author.
Author contributions
LB designed the study, analyzed and interpreted the seismic and tsunami data, and wrote most of the manuscript. CL analyzed the satellite and tsunami data. YJ interpreted the numerical modeling and wrote some of the manuscript. WZ performed the numerical modeling.
Funding
This research was funded by grants from the Second Tibetan Plateau Scientific Expedition and Research Program (No. 2019QZKK07), the National Natural Science Foundation of China (No. 42130312, 41988101), and the K. C. Wong Education Foundation (No. GJTD-2019-04).
Acknowledgments
We thank the editor ZL and reviewers MX and ZG for their constructive comments. We are grateful to Prof. Jeroen Ritsema for useful discussions. Data are provided by the Incorporated Research Institutions for Seismology (IRIS) Wilber website (https://ds.iris.edu/wilber3/find_event) for the seismic data and by the National Oceanic and Atmospheric Administration (NOAA) Tsunami Program (https://www.tsunami.noaa.gov/tsunami-detection) for the tsunami data.
Conflict of interest
The authors declare that the research was conducted in the absence of any commercial or financial relationships that could be construed as a potential conflict of interest.
The reviewer ZG declared a shared affiliation with the authors to the handling editor at the time of review.
Publisher’s note
All claims expressed in this article are solely those of the authors and do not necessarily represent those of their affiliated organizations, or those of the publisher, the editors and the reviewers. Any product that may be evaluated in this article, or claim that may be made by its manufacturer, is not guaranteed or endorsed by the publisher.
References
Alt, J. C., Schwarzenbach, E. M., Fruh-Green, G. L., Shanks, W. C., Bernasconi, S. M., Garrido, C. J., et al. (2013). The role of serpentinites in cycling of carbon and sulfur: Seafloor serpentinization and subduction metamorphism. Lithos 178, 40–54. doi:10.1016/j.lithos.2012.12.006
Amores, A., Monserrat, S., Marcos, M., Argüeso, D., Villalonga, J., Jordà, G., et al. (2022). Numerical simulation of atmospheric Lamb waves generated by the 2022 Hunga-Tonga volcanic eruption. Geophy Res. Letts 49, e2022GL098240. doi:10.1029/2022gl098240
Bai, L., Klemperer, S. L., Mori, J., Karplus, M. S., Ding, L., Liu, H., et al. (2019). Lateral variation of the Main Himalayan Thrust controls the rupture length of the 2015 Gorkha earthquake in Nepal. Sci. Adv. 5, eaav0723. doi:10.1126/sciadv.aav0723
Bai, L., Jiang, Y., and Mori, J. (2022). Source processes associated with the 2021 glacier collapse in the yarlung tsangpo grand canyon, southeastern Tibetan plateau. Landslides 20, 421–426. doi:10.1007/s10346-022-02002-6
Bataleva, Y., Palyanov, Y., and Borzdov, Y. (2018). Sulfide formation as a result of sulfate subduction into silicate mantle (experimental modeling under high P, T-parameters). Minerals2018 8 (9), 373. doi:10.3390/min8090373
Bevis, M., Taylor, F. W., Schutz, B. E., Recy, J., Isacks, B. L., Helu, S., et al. (1995). Geodetic observations of very rapid convergence and back-arc extension at the Tonga arc. Nature 374, 249–251. doi:10.1038/374249a0
Bluth, G. J. S., Shannon, J. M., Watson, I. M., Prata, A. F., and Realmuto, V. J. (2007). Development of an ultraviolet digital camera for volcanic SO2 imaging. J. Volcanol. Geotherm. Res. 161, 47–56. doi:10.1016/j.jvolgeores.2006.11.004
Brandl, P. A., Schmid, F., Augustin, N., Grevemeyer, I., Hannington, M. D., Devey, C. W., et al. (2020). The 6-8 aug 2019 eruption of 'volcano F' in the tofua arc, Tonga. J. Volcanol. Geotherm. Res. 390, 106695. doi:10.1016/j.jvolgeores.2019.106695
Brodsky, E. E., and Lay, T. (2022). The wave blown around the world. Science 377, 30–31. doi:10.1126/science.abq5392
Butterfield, D. A., Nakamura, K. I., Takano, B., Lilley, M. D., Lupton, J. E., Resing, J. A., et al. (2011). High SO2 flux, sulfur accumulation, and gas fractionation at an erupting submarine volcano Geology2011. Geology 39 (9), 803–806. doi:10.1130/g31901.1
Carn, S. A., Clarisse, L., and Prata, A. J. (2016). Multi-decadal satellite measurements of global volcanic degassing. J. Volcanol. Geotherm. Res. 311, 99–134. doi:10.1016/j.jvolgeores.2016.01.002
Carn, S. A., Krotkov, N. A., Fisher, B. L., and Li, C. (2022). Out of the blue: Volcanic SO2 emissions during the 2021–2022 eruptions of Hunga Tonga-Hunga Ha’apai (Tonga). Front. Earth Sci. 10, 976962. doi:10.3389/feart.2022.976962
Chen, F., and Xue, M. (2021). Impact of the tsunami excited by the 2011 MW9.0 Japan earthquake on seismic ambient noises. Acta Seismol. Sin. 43 (3), 321–337.
Dabrowa, A. L., Green, D. N., Rust, A. C., and Phillips, J. C. (2011). A global study of volcanic infrasound characteristics and the potential for long-range monitoring. Earth Planet Sci. Letts 310, 369–379. doi:10.1016/j.epsl.2011.08.027
Dalton, M. P., Waite, G. P., Watson, I. M., and Nadeau, P. (2010). Multiparameter quantification of gas release during weak Strombolian eruptions at Pacaya Volcano, Guatemala. Geophy Res. Letts 37 (9). doi:10.1029/2010gl042617
DeMets, C., Gordon, R. G., and Argus, D. F. (2010). Geologically current plate motions. Geophy J. Int. 181, 1–80. doi:10.1111/j.1365-246x.2009.04491.x
Devine, J. D., Sigurdsson, H., Davis, A. N., and Self, S. (1984). Estimates of sulfur and chlorine yield to the atmosphere from volcanic eruptions and potential climatic effects. J. Geophys Res. 89, 6309–6325. doi:10.1029/jb089ib07p06309
Fee, D., Izbekov, P., Kim, K., Yokoo, A., Lopez, T., Prata, F., et al. (2017). Eruption mass estimation using infrasound waveform inversion and ash and gas measurements: Evaluation at Sakurajima Volcano, Japan. Earth Planet Sci. Letts 480, 42–52. doi:10.1016/j.epsl.2017.09.043
Fee, D., Matoza, R. S., Gee, K. L., Neilsen, T. B., and Ogden, D. E. (2013). Infrasonic crackle and supersonic jet noise from the eruption of Nabro Volcano, Eritrea. Geophys Res. Lett. 40, 4199–4203. doi:10.1002/grl.50827
Goitom, B., Oppenheimer, C., Hammond, J. O. S., Grandin, R., Barnie, T., Donovan, A., et al. (2015). First recorded eruption of Nabro volcano, Eritrea, 2011. Bull. Volcanol. 77, 85. doi:10.1007/s00445-015-0966-3
Guo, Z., Liu, J., He, H., Sui, S., Sun, H., Dai, G., et al. (2003). Environmental and climatic effects of volcanic volatiles and the use of volatiles as potential indicator of future eruptions. Seismol. Geol. 25, 88–98.
Hacker, B. R., Abers, G. A., and Peacock, S. M. (2003). Subduction factory 1. Theoretical mineralogy, densities, seismic wave speeds, and H2O contents. J. Geophy Res. 108, 001127. doi:10.1029/2001jb001127
Hayes, G. P., Moore, G. L., Portner, D. E., Hearne, M., Flamme, H., Furtney, M., et al. (2018). Slab2, a comprehensive subduction zone geometry model. Science 362, 58–61. doi:10.1126/science.aat4723
Huang, B., Xue, M., Guo, Z., and Song, W. (2022). Exploring the deep ocean single-frequency microseisms southwest of Japan in northern Philippine Sea. Geophy Res. Letts 49, e2021GL097444. doi:10.1029/2021gl097444
Ji, Y., Yoshioka, S., Manea, V. C., Manea, M., and Matsumoto, T. (2017). Three-dimensional numerical modeling of thermal regime and slab dehydration beneath Kanto and Tohoku, Japan. J. Geophys Res. solid earth 122, 332–353. doi:10.1002/2016jb013230
Ji, Y., Yoshioka, S., and Matsumoto, T. (2016). Three-dimensional numerical modeling of temperature and mantle flow fields associated with subduction of the Philippine Sea plate, southwest Japan. J. Geophy Res. 121, 4458–4482. doi:10.1002/2016jb012912
Johnson, J. B., Aster, R., and Kyle, P. (2004). Volcanic eruptions observed with infrasound. Geophys Res. Letts 31, L14604. doi:10.1029/2004gl020020
Johnson, J. B., and Ripepe, M. (2011). Volcano infrasound: A review. J. Volcanol. Geotherm. Res. 206, 61–69. doi:10.1016/j.jvolgeores.2011.06.006
Kintner, J. A., Yeck, W. L., Earle, P. S., Prejean, S., and Pesicek, J. D. High-precision characterization of seismicity from the 2022 Hunga Tonga-Hunga Ha'apai volcanic eruption. Seismol. Res. Lett. 94, 589, 602. 2022, doi:10.1785/0220220250
Kubota, T., Saito, T., and Nishida, K. (2022). Global fast-traveling tsunamis driven by atmospheric Lamb waves on the 2022 Tonga eruption. Science 377, 91–94. doi:10.1126/science.abo4364
Liu, C., Bai, L., Hong, S., Dong, Y., Jiang, Y., Li, H., et al. (2021). Coseismic deformation of the 2021 Mw7.4 Maduo earthquake from joint inversion of InSAR, GPS and teleseismic data. Earthq. Sci. 2021, 34 436–446. doi:10.29382/eqs-2021-0050
Liu, J., Liu, J., Chen, X., and Guo, W. (2012). Volcanic natural resources and volcanic landscape protection: An overview. Updat. Volcanol. 2012, 181–222.
Mandeville, C. W., Carey, S., and Sigurdsson, H. (1996). Magma mixing, fractional crystallization and volatile degassing during the 1883 eruption of Krakatau volcano, Indonesia. J. Volcanol. Geotherm. Res. 74, 243–274. doi:10.1016/s0377-0273(96)00060-1
Matoza, R. S., Fee, D., Assink, J. D., Iezzi, A. M., Green, D. N., Kim, K., et al. (2022). Atmospheric waves and global seismoacoustic observations of the January 2022 Hunga eruption, Tonga. Science 377, 95–100. doi:10.1126/science.abo7063
Matoza, R. S., and Roman, D. C. (2022). One hundred years of advances in volcano seismology and acoustics. Bull. Volcanol. 86, 86. doi:10.1007/s00445-022-01586-0
McKee, K., Smith, C. M., Reath, K., Snee, E., Maher, S., Matoza, R. S., et al. (2021). Evaluating the state-of-the-art in remote volcanic eruption characterization Part I: Raikoke volcano, Kuril Islands. J. Volcanol. Geotherm. Res. 419, 107354. doi:10.1016/j.jvolgeores.2021.107354
McNutt, S. R., Thompson, G., West, M. E., Fee, D., Stihler, S., and Clark, E. (2013). Local seismic and infrasound observations of the 2009 explosive eruptions of Redoubt Volcano, Alaska. J. Volcanol. Geotherm. Res. 259, 63–76. doi:10.1016/j.jvolgeores.2013.03.016
Mori, T., and Burton, M. (2009). Quantification of the gas mass emitted during single explosions on Stromboli with the SO2 imaging camera. J. Volcanol. Geotherm. 188, 395–400. doi:10.1016/j.jvolgeores.2009.10.005
Müller, R. D., Sdrolias, M., Gaina, C., and Roest, W. R. (2008). Age, spreading rates, and spreading asymmetry of the world's ocean crust. Geochem Geophy Geosys 9. doi:10.1029/2007GC001743
Omori, T., Watanabe, K., Umetsu, R., Kainuma, R., and Ishida, K. (2009). Martensitic transformation and magnetic field-induced strain in Fe–Mn–Ga shape memory alloy. Appl. Phys. Letts 95, 082508. doi:10.1063/1.3213353
Plank, T., and Manning, C. E. (2019). Subducting carbon. Nature 574, 343–352. doi:10.1038/s41586-019-1643-z
Poli, P., and Shapiro, N. M. (2022). Rapid characterization of large volcanic eruptions: Measuring the impulse of the Hunga Tonga Ha’apai explosion from teleseismic waves. Geophy Res. Letts 49, e2022GL098123. doi:10.1029/2022gl098123
Proud, S. R., Prata, A. T., and Schmauss, S. (2022). The January 2022 eruption of Hunga Tonga-Hunga Ha’apai volcano reached the mesosphere. Science 378, 554–557. doi:10.1126/science.abo4076
Ramirez-Herrera, M. T., Coca, O., and Vergas-Espinosa, V. (2022). Tsunami effects on the coast of Mexico by the Hunga Tonga-Hunga ha’apai volcano eruption, Tonga. Pure Appl. Geophy 179, 1117–1137. doi:10.1007/s00024-022-03017-9
Ritsema, J., Lay, T., and Kanamori, H. (2012). The 2011 tohoku earthquake. Elements 8, 183–188. doi:10.2113/gselements.8.3.183
Robock, A., Adams, T., Moore, M., Oman, L., and Stenchikov, G. (2007). Southern hemisphere atmospheric circulation effects of the 1991 Mount Pinatubo eruption. Geophy Res. Letts 34, L23710. doi:10.1029/2007gl031403
Rowe, C. A., Aster, R. C., Kyle, P. R., Dibble, R. R., and Schlue, J. W. (2000). Seismic and acoustic observations at mount erebus volcano, ross island, Antarctica, 1994-1998. J. Volcanol. Geotherm. Res. 101, 105–128. doi:10.1016/s0377-0273(00)00170-0
Self, S., and Rampino, M. R. (1981). The 1883 eruption of Krakatau. Nature 294, 699–704. doi:10.1038/294699a0
Tahira, M., Nomura, M., Sawada, Y., and Kamo, K. (1999). Infrasonic and acoustic-gravity waves generated by the Mount Pinatubo eruption of June. FIRE MUD 15.
Vergoz, J., Hupe, P., Listowski, C., Le Pichon, A., Garcés, M. A., Marchetti, E., et al. (2022). IMS observations of infrasound and acoustic-gravity waves produced by the january 2022 volcanic eruption of Hunga, Tonga: A global analysis. Earth Planet Sci. Letts 591, 117639. doi:10.1016/j.epsl.2022.117639
Wang, Y., Imai, K., Kusumoto, S., and Takahashi, N. (2022). Tsunami early warning of the Hunga volcanic eruption using an ocean floor observation Network off the Japanese islands. Seism. Res. Letts 94, 567–577. doi:10.1785/0220220098
Wang, Y., Wang, P., Kong, H., and Wong, C.-S. (2023). Tsunamis in Lingding Bay, China, caused by the 2022 Tonga volcanic eruption. Geophy J. Int. 232, 2175–2185. doi:10.1093/gji/ggac291
Watson, L. M., Iezzi, A. M., Toney, L., Maher, S. P., Fee, D., McKee, K., et al. (2022). Volcano infrasound: Progress and future directions. Bull. Volcanol. 84 (5), 44. doi:10.1007/s00445-022-01544-w
Yamada, M., Ho, T.-C., Mori, J., Nishikawa, Y., and Yamamoto, M.-Y. (2022). Tsunami triggered by the Lamb wave from the 2022 Tonga volcanic eruption and transition in the offshore Japan region. Geophy Res. Letts 49, e2022GL098752. doi:10.1029/2022gl098752
Yang, X., Su, W., Jiang, C., and Bian, Y. (2022). Research progress on infrasound generation mechanism, monitoring technology and application. Prog. Geophy 37, 78–93.
Yoshioka, S., and Murakami, K. (2007). Temperature distribution of the upper surface of the subducted philippine sea plate along the nankai trough, southwest Japan, from a three-dimensional subduction model: Relation to large interplate and low-frequency earthquakes. Geophy J. Int. 171, 302–315. doi:10.1111/j.1365-246x.2007.03510.x
Yuen, D. A., Scruggs, M. A., Spera, F. J., Zheng, Y., Hu, H., McNutt, S. R., et al. (2022). Under the surface: Pressure-induced planetary-scale waves, volcanic lightning, and gaseous clouds caused by the submarine eruption of Hunga Tonga-Hunga Ha'apai volcano. Earthq. Res. Adv. 2, 100134. doi:10.1016/j.eqrea.2022.100134
Keywords: the 2022 Tonga volcano, seismic observation, ocean bottom pressure gauge, numerical modeling, infrasound wave, sulfur dioxide
Citation: Bai L, Liu C, Ji Y and Zhu W (2023) Infrasound waves and sulfur dioxide emissions caused by the 2022 Hunga volcanic eruption, Tonga. Front. Earth Sci. 11:1144496. doi: 10.3389/feart.2023.1144496
Received: 14 January 2023; Accepted: 20 March 2023;
Published: 29 March 2023.
Edited by:
Zhanwu Lu, Chinese Academy of Geological Sciences, ChinaReviewed by:
Mei Xue, Tongji University, ChinaZhengfu Guo, Institute of Geology and Geophysics (CAS), China
Copyright © 2023 Bai, Liu, Ji and Zhu. This is an open-access article distributed under the terms of the Creative Commons Attribution License (CC BY). The use, distribution or reproduction in other forums is permitted, provided the original author(s) and the copyright owner(s) are credited and that the original publication in this journal is cited, in accordance with accepted academic practice. No use, distribution or reproduction is permitted which does not comply with these terms.
*Correspondence: Ling Bai, YmFpbGluZ0BpdHBjYXMuYWMuY24=