- 1Geophysical Exploration Center, China Earthquake Administration, Zhengzhou, China
- 2School of Earth and Space Sciences, University of Science and Technology of China, Hefei, China
To evaluate the effectiveness of using airguns as seismic sources in inland waters to detect the regional crustal structure, a mobile large-capacity airgun excitation experiment was conducted in October 2015 in the Anhui section of the middle–lower Yangtze metallogenic belt. In this study, we extracted 1,957 first-arrival phases (Pg) and 2,179 Moho reflection phases (PmP) from the airgun seismic signals, and performed joint inversion of the traveltimes. The inversion results reveal the P-wave high-velocity anomalies above 7 km depth in the upper crust beneath the ore clustering areas, suggesting the source of mineralized materials. The crustal velocity structure characteristics substantially differed above and below a depth of 7 km, indicating the existence of a regional basement detachment surface. The velocity structure in the middle–lower crust, especially in the lower crust show lateral uniformity characteristic, which could be related to that the middle–lower Yangtze metallogenic belt had undergone a MASH metallization process. The Moho is 30–36 km deep, and its uplift zone extends from southwest to northeast in a “V” shape, which is consistent with the planar spreading characteristics of the metallogenic belt, indicating that the asthenosphere uplift and crustal thinning have had a controlling effect on the formation of the metallogenic belt. This study suggests the present-day crust in the region along the Yangtze River in Anhui retains the traces of lithosphere delamination-thinning and basaltic magma underplating during the Yanshan period. Our results indicates that airgun source detection in inland waters can effectively determine the continental crustal structure.
1 Introduction
Active seismic source detection is an effective method to obtain high-precision crustal structures (Chen et al., 2017a). In marine seismic surveys, airguns are typically used as seismic sources, whereas large-tonnage explosive sources are more widely used on land. However, the high cost and destructiveness of explosive sources limit the application of active source detection on land (Chen et al., 2007). Therefore, researchers have sought alternative terrestrial seismic sources (Chen et al., 2004; Ge et al., 2006; Chang et al., 2008; Tang et al., 2008). In coastal or island areas, airguns can be used in combined land and sea surveys to elucidate the structure of the crust and upper mantle (Okaya et al., 2003; Rawlinson and Urvoy, 2006a; Harm et al., 2016; Kuo et al., 2016). To test whether airguns could be used to detect continental crustal structure in inland waters, a series of fixed-point high-capacity airgun firing experiments were carried out in Chinese inland waters (Chen et al., 2007; Wang et al., 2010). These experiments showed that the dominant frequency of the airgun seismic signal is 2–8 Hz, and multiple groups of seismic waves from the deep crust and Moho discontinuity were observed by superimposing repeated airgun signals, which indicates that the airgun can be used as an effective source for continental wide-angle seismic detection (Lin et al., 2008; Wang et al., 2012; Wang et al., 2015; Wei et al., 2016; Chen et al., 2017a).
In October 2015, a team led by Chen Yong, a member of the Chinese Academy of Sciences, conducted an excitation experiment using a mobile high-capacity airgun in the middle and lower reaches of the Yangtze River in Anhui Province, known as the “Geoscience Yangtze Project”. Airgun excitation was conducted in the Yangtze River waterway, and a mobile array consisting of short-period seismometers was installed along both sides of the Yangtze River to form a 3D active source array together with the surrounding regional seismic stations, covering an area of approximately 40,000 km2 in Anhui Province, China. The middle and lower reaches of the Yangtze River are important polymetallic mineral resource bases in eastern China, where strong tectonic magmatism and mineralization occurred during the Yanshan period, leading to the formation of a north-east-oriented volcanic–magmatic belt and the accumulation of various metallic minerals. To reveal the deep dynamics of mineralization and the mechanism of large-scale magmatic activities, geophysicists have conducted multi-scale integrated geophysical explorations of the deep structure in this region. The crustal structure at the scale of metallogenic belt and ore clustering district was detected by 2D method, including deep seismic reflection profiles (Lü et al., 2003; Lü et al., 2013; Liang et al., 2014; Lü et al., 2015a; Shao et al., 2015), deep seismic sounding profiles (Xü et al., 2014), Magnetotelluric profiles (Tang et al., 2013; Zhang et al., 2014a; Qiang et al., 2014; Xiao et al., 2014), gravity profiles (Zhang et al., 2014b), and broadband seismic profiles (Shi et al., 2012), which have revealed the 2D crust–mantle velocity structure, reflection structure, electrical structure, and density structure of the metallogenic belt and ore clustering district. The research on the crustal structure at the 3D regional-scale included teleseismic tomography (Jiang et al., 2014), background noise imaging (Luo et al., 2019), teleseismic receiver function imaging (Wei et al., 2018), and gravity data inversion and calculation (Yan et al., 2011; Chen et al., 2017b). However, because of inherent characters in research method, these results have insufficient constraints on the crust and need to be improved. The “Geoscience Yangtze Project” provides a possibility to establish a regional-scale 3D high-precision crustal model using active sources.
According to the airgun seismic records obtained from the mobile array, the first-arrival waves (Pg) and Moho-reflected waves (PmP) are clearly visible in most records. Tian et al. (2018) inverted the velocity structure of the upper crust using the Pg traveltimes recorded by the mobile array; Zhang et al. (2020) inverted the 3D crustal velocity structure in and around the Tan–Lu Fault using the Pg traveltimes recorded by the mobile array and a regional seismic network in combination with the P-wave first-arrivals of local earthquakes recorded by the regional network. These results validated the use of mobile airgun seismic data in inland waters for body wave tomography but only used the Pg and did not include the PmP or Moho. As the most active and variable interface in the process of continental geodynamic evolution, the Moho retains the dynamic information on continental evolution. Thus, imaging the Moho can illustrate the deep dynamic history of mineralization. In this study, we analyzed airgun seismic records, identified seismic phases, and then performed joint inversion of the traveltimes of multiple seismic phases (Pg and PmP) to reconstruct 3D images of the crustal velocity structure and the Moho for the middle and lower reaches of the Yangtze River in Anhui Province. We then evaluated the resolution of the solution model using the checkerboard model recovery test. Finally, we compare the inversion results with other geophysical findings in the study area and discuss the characteristics and tectonic implications of the crustal structure revealed by our model.
2 Geological outline
The study area is located in the middle–lower Yangtze metallogenic belt within Anhui Province, China (Figure 1). The metallogenic belt is part of the northeastern margin of the South China Plate and is wedged between the Tan–Lu and Yangxin–Changzhou faults, with a near northeast strike. It is a V-shaped zone which is narrow in the southwest and wide in the northeast (Chang et al., 1991) and is famous for rich deposits of copper, iron, and other metals.
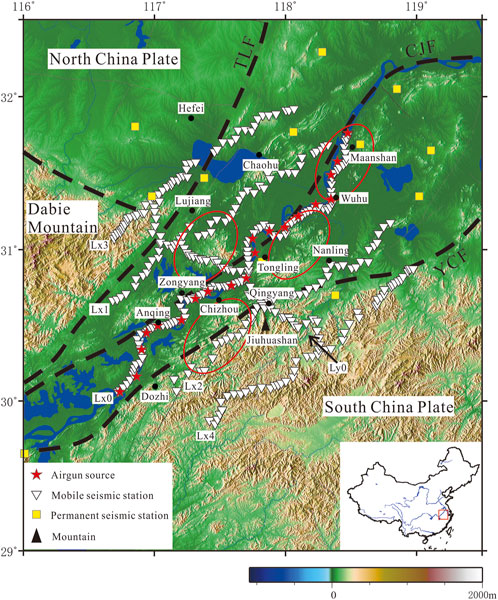
FIGURE 1. Map showing the distribution of the airgun array, major faults, and metallic deposit fields in the middle–lower Yangtze in Anhui Province [red ovals on the map indicate the approximate locations of the deposits, derived from Zhou et al. (2008)]. TLF: Tan–Lu Fault; CJF: Yangtze River Fault; YCF: Yangxin–Changzhou Fault; M1: Luzong ore clustering district; M2: Guichi ore clustering district; M3: Tongling ore clustering district; M4: Ningwu ore clustering district.
The basement of the middle–lower Yangtze metallogenic belt is located at the junction of two pre-Sinian period basements, on which a unified cover after Sinian has been developed, forming a pattern of “one cover and two basement” (Chang et al., 1991; Chang et al., 1996). The mineralized zone is dominated by sedimentary cover, with very little metamorphic basement exposed (Chang et al., 2012). From the Nanhua Period through the entire Paleozoic (excluding the period of the Silurian Mao Shan Formation to the Early-Middle Devonian) to the Early and Middle Triassic, this area was in a period of cover deposition dominated by marine sedimentation. Except for the influence of the Caledonian movement, the whole area was relatively stable, and two complete sets of transgression–regression sequences have been deposited, namely, Nanhua–Silurian and Late Devonian–Middle Triassic, forming two sets of platform-type substratigraphic sedimentary cover. The Indosinian movement, which began in the Middle Triassic, changed the original tectonic features of the area. The cover was strongly reformed by folds and faults. At this point, a unified land mass was formed in China, and the area entered a phase of intra-land deformation. From the Jurassic to the Cretaceous period, strong faulting activity led to disruptive cutting and differential vertical movement, resulting in a series of faulted basins of different scales in the area. In addition, intense volcanic and magmatic activities were a major geological event in the area, and intrusive rocks were intermediate-acid rock. During the late Yanshan and early Himalayan movements, the differential vertical movement reached its peak and deposited a very thick red-rock stratum, with a corresponding reduction in magmatic activity (Chang et al., 2019).
Many studies have shown that the formation of the middle–lower Yangtze metallogenic belt is closely related to the tectonic transition and magmatic activity in East Asia continent during the Yanshan period (Zhai et al., 1992; Tang et al., 1998; Dong et al., 2011). Mineralization occurred in the transitional stage that regional tectonic dynamic mechanism changed from compression to extension after the transformation of the Paleo-Tethys tectonic system into the Pacific system (Chang et al., 2012). At the stage, the intra-land extension and large-scale lithospheric thinning associated with the mantle uplift led to strong tectonic magmatism along the aforementioned basement junction zone, forming the present-day north-east-oriented rock-controlling and mineral-controlling tectonic zone, and large-scale metal ore accumulation in several tectonic sites.
3 Data acquisition and processing
The large-capacity airgun experimental observation layout of the “Geoscience Yangtze Project” includes 20 fixed airgun source points and six surveying lines consisting of mobile stations (Figure 1). A Ship with airgun firing devices sailed from Ma’anshan to Anqing (a distance of approximately 330 km), with the airgun source comprising a combination of four airguns with a capacity of 2,000 in3 each. The airgun source spacing is approximately 10 km, and 100–150 times of continuous firing are conducted at each source. Among the six surveying lines, Lx0 was placed on the bank of Yangtze River, with Lx1, Lx2, Lx3, and Lx4 on both sides of Lx0 and parallel to it; the distance between adjacent lines was approximately 40 km, and line Ly0 intersected the above five lines. The interval between receiving points on each line was approximately 3–4 km. A total of 350 sets of three-component portable seismometers with a dominant frequency of 2.5–80 Hz were used, and the seismometers recorded continuously the airgun seismic signal with a sampling interval of 5 ms. The observation layout covered an area of approximately 40,000 km2, and there were 12 regional seismic stations in the area (Figure 1).
We intercepted the seismic records of the P wave with a duration of 60 s from the time of airgun firing, and then performed linear superposition (Zheng et al., 2017). After 100–150 superimpositions and 2–8 Hz filtering, Pg and PmP were visible in the seismic records (Figure 2). Seismic phase identification and traveltime picking were performed on the reduced time–distance graph. The formula for calculating the reduced traveltime is as follows:
where t is the observed traveltime; x is offset; and Vred is reduced velocity, typically taken at 6 km/s.
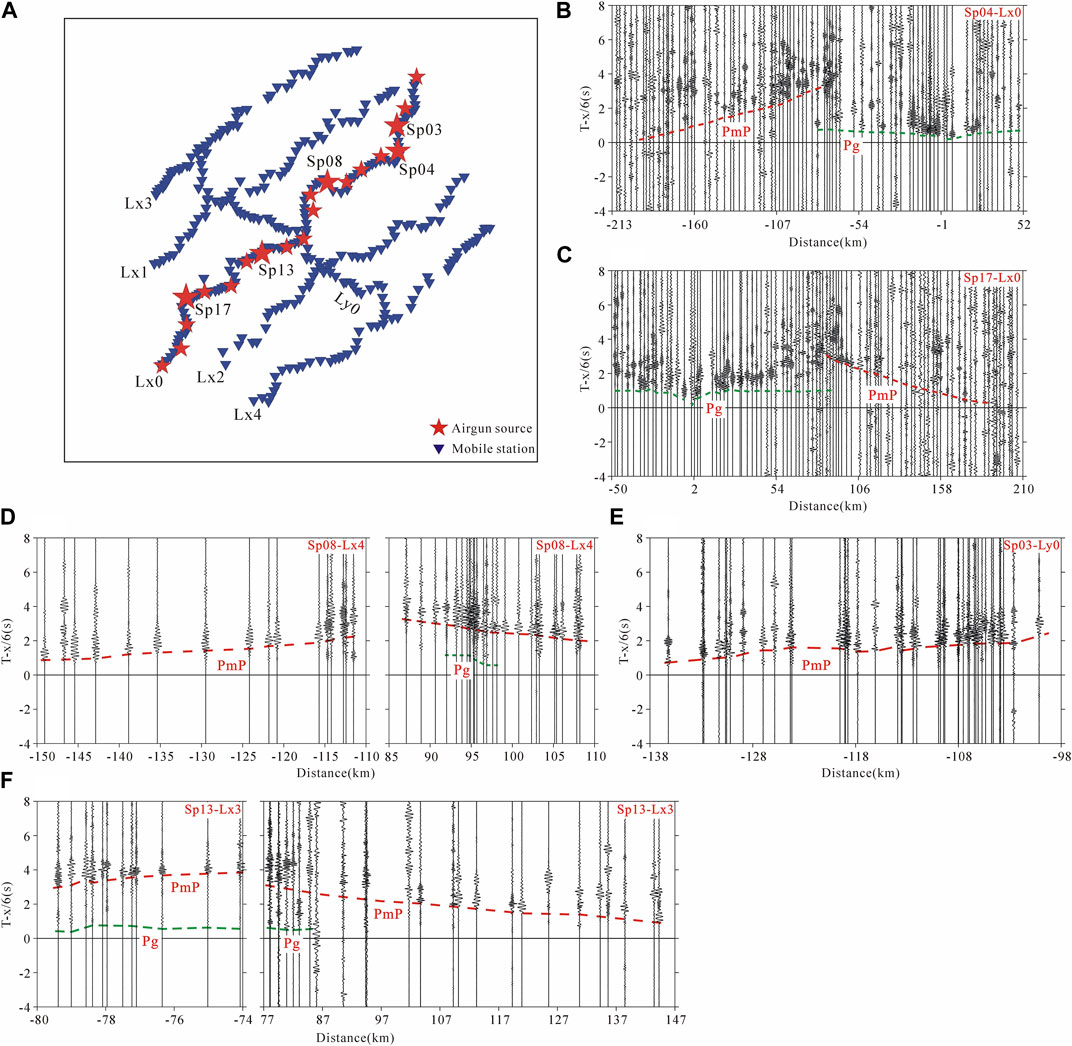
FIGURE 2. Seismic records of airgun signals acquired by mobile arrays. Positive distance indicates that the receivers are located to the northeast of the sources; negative distance indicates that the receivers are located to the southwest of the sources. (A)Location of airgun sources and seismometer stations; (B)signals generated by Sp04 recorded along the Lx0 line; (C)signals generated by Sp17 recorded along the Lx0 line; (D)signals generated by Sp08 recorded along the Lx4 line; (E)signals generated by Sp03 recorded along the Ly0 line; (F)signals generated by Sp13 recorded along the Lx3 line.
The Pg, also known as refraction waves in the upper crust, generally appear as the first break within 100 km from shotpoint and are characterized by strong energy, clear phase, and easy identification. In the positive velocity gradient layer, the apparent velocity of Pg gradually increases with the penetration depth, and the time–distance curve gradually bends toward the horizontal axis (distance axis). When the apparent velocity is approximately 6 km/s, the time–distance curve is nearly parallel to the horizontal axis (distance axis). Unlike near-vertical reflections, the reflections in the deep seismic sounding records appear at the wide-angle end, and their energy reaches the maximum at the critical distance. Especially for the Moho reflection PmP, it’s amplitude is even more than that of the first break because of the large velocity difference between crust and mantle; thus, PmP can be easily identified in the seismic records. The seismic phase identification and traveltime picking of in-lines were verified by the “traveltimes reciprocity” principle, whereas the seismic phase identification and traveltime picking of broadside-lines should conform to the rule that the traveltime at the intersection of different lines of the same gun is consistent. In addition, we superimposed the airgun signals recorded at 12 regional stations and picked the Pg traveltimes for the seismic records with higher signal-to-noise ratios (Figure 3). The uncertainties of the picked traveltimes were estimated by the signal-to-noise ratios (Zelt and Forsyth, 1994). Finally, we obtained a total of 1,947 Pg and 2,179 PmP traveltimes. The uncertainties of the Pg and PmP traveltimes were 100 ms and 150 ms, respectively. Plotting all the Pg and PmP traveltimes on the same time–distance graph showed that the morphological characteristics of the Pg and PmP time–distance curves are close to that of theoretical time–distance curves of the 1D crustal model (Figure 4), indicating that the phase identification and traveltime picking are reliable.
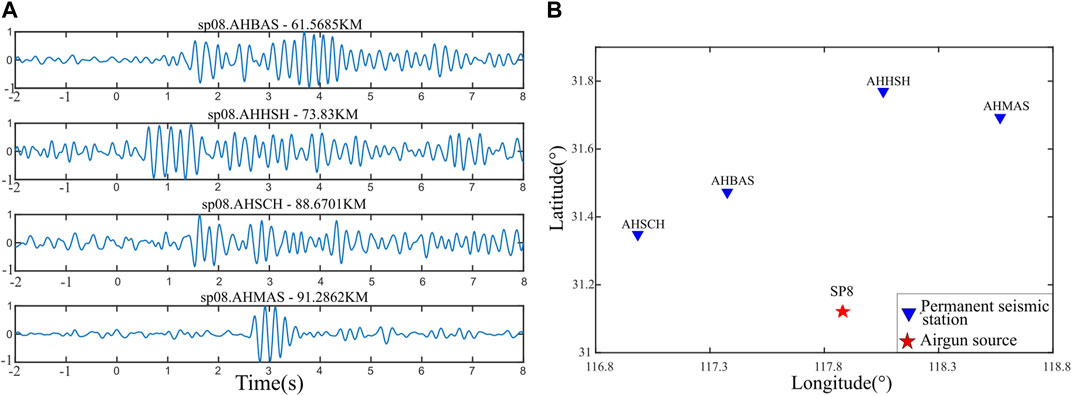
FIGURE 3. (A)Airgun waveform data recorded by permanent seismic stations; (B)Location of airgun sources and seismic stations.
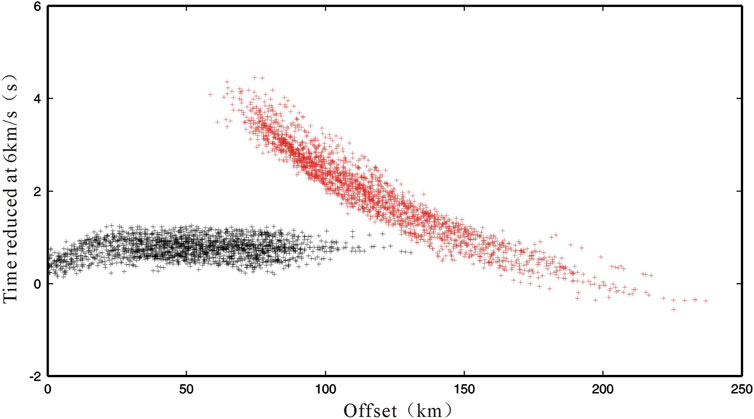
FIGURE 4. Picked traveltimes plotted with reduced velocity of 6.0 km/s. Black crosses represent Pg and red crosses represent PmP.
4 Tomographic inversion scheme
In this study, we adopted a tomographic inversion scheme designed for the integration of multiple classes of body wave datasets. The central innovation of the scheme is its use of a multi-stage fast marching method (FMM) based eikonal solver to solve the forward problem of traveltime prediction in 3D heterogeneous layered media (Rawlinson and Sambridge, 2004a; Rawlinson and Sambridge, 2004b; de Kool et al., 2006). Unlike the standard FMM (Sethian, 1996), which only identifies first arrivals, this multi-stage approach can track those later-arriving phases explicitly caused by the presence of discontinuities. We treated each layer in which the wavefront enters as an independent computational domain. Thus, a wavefront propagates through a layer until it impinges on all points of an interface. At this stage, FMM is halted, and we are left with a narrow band of traveltime values defined along the interface. From here, a refracted branch can be tracked by reinitializing FMM from the narrow band into the adjacent layer, and a reflected branch can be obtained by reinitializing FMM in the incident layer (Rawlinson and Sambridge, 2004b). As the multi-stage FMM allows phases comprising refraction and reflection branches, or a combination of these, to be tracked, the velocity and interface depth can be obtained simultaneously using these phases for joint inversion.
The first step in performing tomographic inversion is to specify how the model structure is to be represented (i.e., model parameterization). In this inversion scheme, the velocity field within each layer was independently described by a regular grid of nodes in spherical coordinates, which means that the grid spacing of each layer can be different from that of other layers. These nodes were used as the control vertices of a mosaic of cubic B-spline volume elements, which define the continuum. Layer interfaces were described by a regular mesh in latitude and longitude, with a mosaic of cubic B-spline surface patches to describe the complete interface (Rawlinson et al., 2006b).
The inverse problem can be solved by specifying an objective function S(m), where m represents the model parameters. Here, we use an objective function of the following form (Rawlinson et al., 2006c):
The first term on the RHS of the above equation is the data residual term, and the last two terms are regularization terms, where g(m) is the predicted traveltime, dobs is the observed traveltime, Cd is the a priori data covariance matrix, m0 is the starting model, Cm is the a priori model covariance matrix, and D is a second derivative smoothing operator. ε and η are the damping factor and smoothing factor, respectively, which govern the trade-off between how well the solution satisfies the data, the proximity of the solution model to the starting model, and the smoothness of the solution model. In our case, the unknowns comprise the grid of vertices that control the patterns of the B-spline velocity field and the Moho discontinuity.
We used an iterative nonlinear approach to minimize the objective function S(m), which applies a subspace inversion method (Kennett et al., 1988; Rawlinson and Sambridge, 2003) to solve the linearized inverse problem. The subspace inversion method is a gradient-based technique, which works by projecting the quadratic approximation of S(m) onto an n-dimensional subspace of model space. S(m) minimization is simultaneously conducted along several search directions that together span a subspace of the model space. The subspace method provides a natural way of dealing with multiple parameter classes, such as velocity parameters and interface depth parameters, that are to be inverted for simultaneously (Rawlinson and Sambridge, 2003).
5 Results
We defined a two-layer model in spherical coordinates. Both layers were independently defined using velocity grids with a node separation of 1 km in depth and 0.1° in both latitude and longitude. However, as the ray coverage in this study was limited within the crust containing the Moho, the second layer under the Moho was not inverted. The interface grid, which describes the spatial variations of the Moho, was defined with a node separation of 0.1° in latitude and longitude. The initial velocity model was derived from six 1D velocity–depth curves obtained from the Yixing–Lixin DSS profile (Xü et al., 2014). According to the Moho depth results of this profile, we set the initial Moho as a horizontal interface with a depth of 32.5 km.
In total, 1,957 Pg and 2,179 PmP traveltimes were used as input data for the inversion. Error estimates of Pg and PmP were used in the diagonal elements of Cd to weight the relative importance of each traveltime in the inversion. The a priori model uncertainty associated with each node in the model, which was used to form the diagonal elements of Cm, was set to 0.3 km/s for velocities and 3 km for the Moho.
The complete inversion procedure was performed using six iterations of a 20-dimensional subspace inversion routine with ε = 1 and η = 0.5. The forward problem was solved between each iteration to obtain new traveltimes, ray paths, and Fréchet derivatives.
The damping factor ε and smoothing factor η govern the trade-off between fitting the data and satisfying the regularization constraints. If ε and η are too small, the solution model may overfit the observation data, so that the error in the observation data will be introduced into the final model; if ε and η are too large, the solution model may be too dependent on the reference model and too smooth. The appropriate trade-off between the data residual term and the model regularization terms was obtained by running the complete inversion process several times with different values of ε and η. In our case, we first set the damping factor to ε = 2 and varied η. Figure 5A shows a plot of the resultant trade-off between the data variance and roughness of the solution model for different values of η in each parameter class (velocity and interface). From this curve, η = 0.5 provides the best trade-off between minimizing the data misfit and producing the smoothest solution model. In the next step, the smoothing factor was set to η = 0.5 and ε was varied. The trade-off curve generated from this process (Figure 5B) suggests that ε = 1 provides the best trade-off between minimizing the data misfit and minimizing model perturbation. Finally, as ε and η both affect model variance and roughness, the first step was repeated with ε = 1. The resulting trade-off curve (Figure 5C) shows that η = 0.5 is still a good choice of smoothing parameter, making further iterations of this process unnecessary.
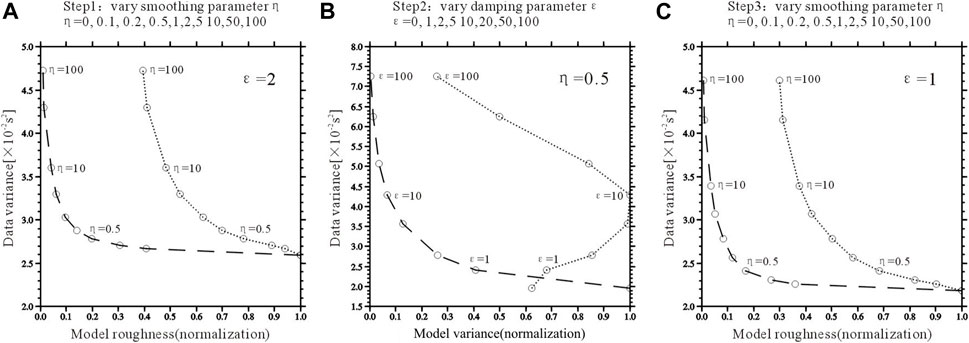
FIGURE 5. Scheme used to estimate optimum damping and smoothing parameters for joint inversion of velocity (dashed line) and the Moho (dotted line). (A)Smoothing parameter is varied while fixing the damping parameter at ε = 2. In this case, η = 0.5 is chosen from the curve; (B) Damping parameter is varied while fixing the smoothing parameter at η = 0.5. ε = 1 is chosen as the optimum; (C) η is varied while fixing the damping parameter at the new value of ε = 1. The value η = 0.5 still appears to be an acceptable choice.
The final solution model reduces the data misfit variance by 75.4%, from 0.09807s2 to 0.0241s2, which corresponds to an RMS reduction of 313.12 ms–155.23 ms.
5.1 Model recovery test
According to the observation layout (Figure 1), the airgun source is linearly distributed along the Yangtze River channel. The Lx0-Lx4 lines are parallel to each other with a distance of approximately 40 km (∼0.4°) between adjacent lines, and the Ly0 lines intersect with Lx0-Lx4. The minimum distance between stations on the broadside lines and the airgun source is approximately 40 km (except for a few stations on the Ly0 line). According to the seismic ray distribution (Figure 6), the Pg rays are primarily distributed at depths above 10 km and very sparse below this depth, with the distribution dominated by PmP rays.
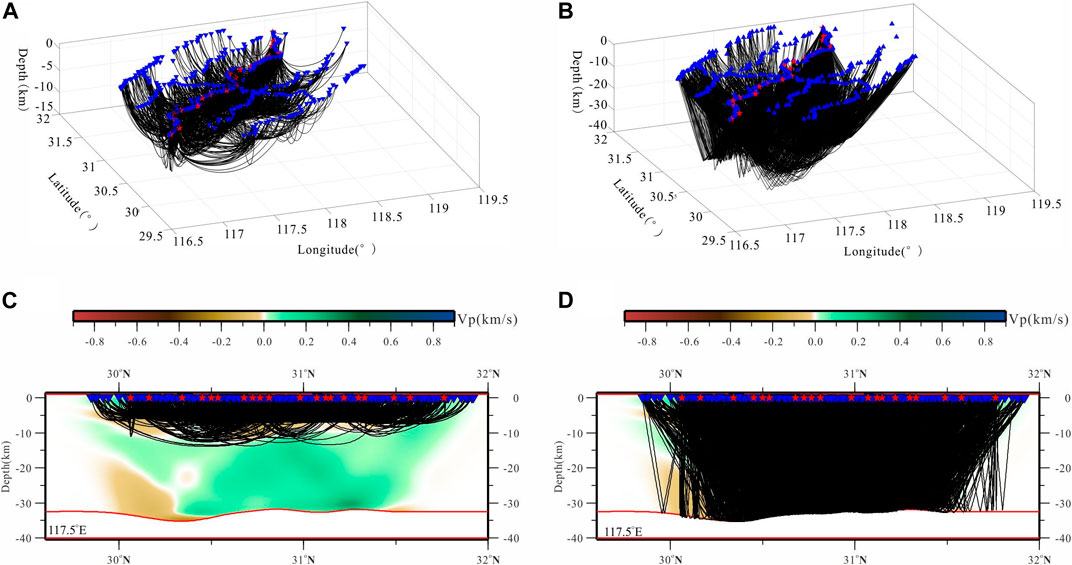
FIGURE 6. Seismic ray distribution charts. (A) and (C) 3D distribution of Pg rays and their projection on 117.5°E, respectively; (B) and (D) 3D distribution of PmP rays and their projection on 117.5°E, respectively.
To investigate the robustness of our solution model and assess its resolution, a model recovery test was performed using synthetic checkerboard. The synthetic models were defined by alternating regions of high and low velocity (between ± 0.4 km/s) and deep and shallow Moho (between 29 and 36 km depth). The traveltime residuals for the given structure were predicted using identical sources, receivers, and phase types to the observational dataset. Gaussian noise with a standard deviation of 100 ms was added to the synthetic datasets to simulate the noise content of the observed data. Inversion was then performed using the tomographic inversion method outlined above, the initial model and constraint parameters are the same as those used in the inversion of the observed data. The difference between the synthetic and recovered models gives an indication of which regions of the model are well or weakly constrained by the data. Regions in which the checkerboard patterns are clearly recovered can be considered well resolved.
According to the source–receiver geometry, we set the lateral scales of both the velocity checkerboard and the Moho checkerboard to 0.4° × 0.4°; based on this, we selected the velocity checkerboard vertical scales from large to small and conducted several model recovery tests. The results show that the velocity anomaly of 0.4° × 0.4° × 4 km in size can be recovered in most regions above 10 km depth (Figures 7A–C). Under 10 km depth, recovery of the velocity anomaly of 0.4° × 0.4° × 4 km was unsuccessful (Figure 7C); however, the velocity anomaly of 0.4° × 0.4° × 10 km can be recovered (Figure 7D). The Moho checkerboard model of 0.4° × 0.4° can be well recovered (Figure 7E).
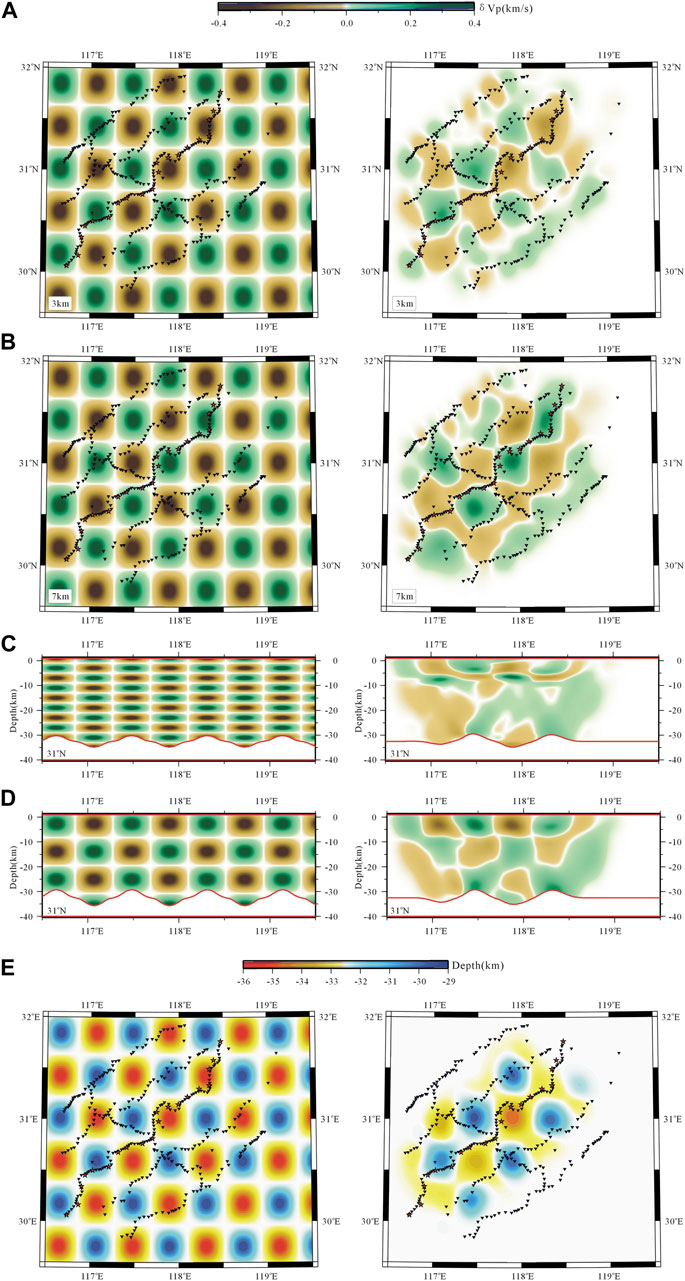
FIGURE 7. Model recovery test results. (A) and (B) Horizontal velocity slices at 3 and 7 km depth at a resolution of 0.4° × 0.4° × 4 km; (C) vertical velocity slice along 31°N at a resolution of 0.4° × 0.4° × 4 km; (D) vertical velocity slice along 31°N at a resolution of 0.4° × 0.4° × 10 km; (E) Moho recovery result at a resolution of 0.4° × 0.4°.
The model recovery test results show that the resolution scale of the velocity structure was basically up to 0.4° × 0.4° × 4 km above a depth of 10 km and 0.4° × 0.4° × 10 km below this depth. The resolution scale of the Moho discontinuity was 0.4° × 0.4°.
The checkerboard results are influenced by various factors, such as simplification of the forward problem, the noise level of data, model parameterization, the size of anomalies in the checkerboard, and coupling style between velocity checkerboard patterns and interface patterns (Rawlinson and Urvoy, 2006a; Rawlinson and Spakman, 2016). Thus, the results of the checkerboard test are a reference for evaluating the reliability of the solution model, but do not fully represent the real resolution of the model. An explicit geological interpretation of the solution model can also assist in verifying the reliability of the inversion results.
5.2 3D crustal velocity structure and moho morphology
Cross sections through the solution model obtained by the inversion of the airgun array dataset, which are shown in Figure 7, reveal a number of significant structural features. The horizontal slice at a depth of 1 km (Figure 8A) indicates that high velocity is present at four ore clustering districts in Luzong (M1), Guichi (M2), Tongling (M3), and Ningwu (M4). The Yangtze River waterway in the southwest of Tongling (M3) shows a NE–SW low-velocity strip, whereas the waterway in the northeast of Tongling (M3) shows high-velocity in some parts, which may be influenced by the ore clustering districts. At 3 km depth, the high-velocity area enlarges significantly, the high-velocity feature of the ore clustering districts is more obvious, and the low-velocity area and amplitude of the Yangtze River waterway decreases significantly (Figure 8B). At a depth of 5 km, the high-velocity area starts to reduce, but the ore clustering districts still show obvious high-velocity. The Yangtze River waterway still corresponds to the NE–SW low-velocity strip (Figure 8C). At a depth of 7 km, the high-velocity area further reduces, and the high-velocity areas in Tongling (M3) and Guichi (M2) ore clustering districts reduce obviously, thus, the velocity structure in the study area is on the whole characterized by sheet-like low-velocity distribution with a velocity value of approximately 5.8–6.0 km/s (Figure 8D). At a depth of 11 km, the velocity characteristic with sheet-like low-velocity disappears in the study area (Figure 8E). As the depth deepens, the velocity structure overall exhibits a relative high-velocity distribution and gradually tends to be lateral uniform. (Figures 8F–H).
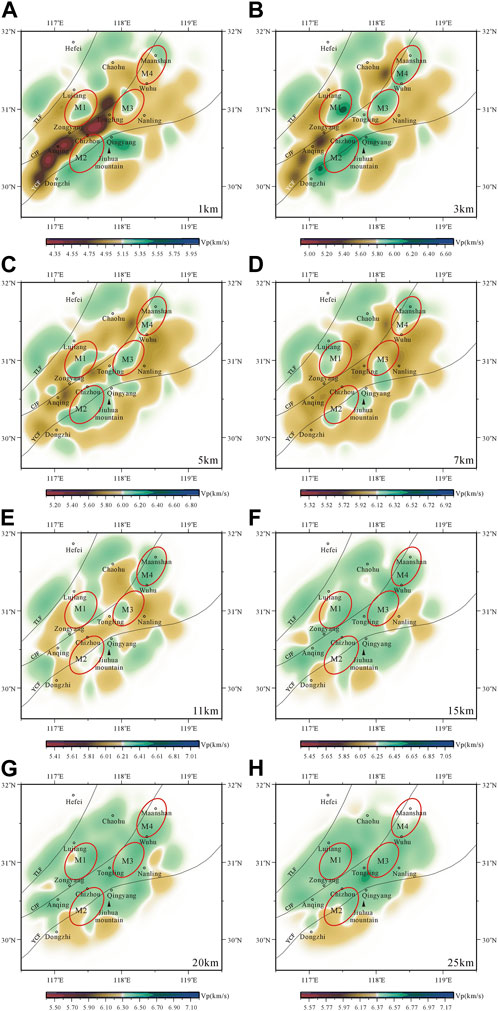
FIGURE 8. (A–H) are the horizontal cross sections of crustal velocities at different depths of 1 km,3 km, 5 km, 7 km, 11 km, 15 km, 20 km and 25 km. TLF: Tan-Lu Fault; CJF: Yangtze River Fault; YCF: Yangxin-Changzhou Fault. M1: Luzong ore clustering district; M2: Guichi ore clustering district; M3: Tongling ore clustering district; M4: Ningwu ore clustering district.
To sum up, the velocity structure above a depth of 7 km is characterized by high-velocity in the ore clustering districts and a low-velocity strip in the Yangtze River waterway; below a depth of 7 km, the velocity structure gradually tends to be lateral uniform as the depth increasing, and is more pronounced below a depth of 20 km. The difference in velocity structure above and below 7 km depth suggests that there may be a crustal deformation decoupling surface near this depth. Furthermore, the ray distribution (Figures 6C) indicates that most of Pg waves were refracted above a depth of 7–8 km, and the dense refraction of Pg waves at 7–8 km depth indicates the existence of velocity discontinuity near this depth.
The depth of the Moho discontinuity varies between 30 km and 36 km (Figure 9). Among the four ore clustering districts, Guichi (M2) has the deepest Moho discontinuity at 33–36 km, which is also the location of Jiuhua Mountain. The Moho discontinuity in Luzong (M1) and Tongling (M3) is 31–33 km deep. At the northeastern end of the study area, Ningwu (M4) has too few PmP samples for a reliable analysis. Roughly along the Yangxin–Changzhou Fault, the depths of the Moho on both sides of the fault are different.
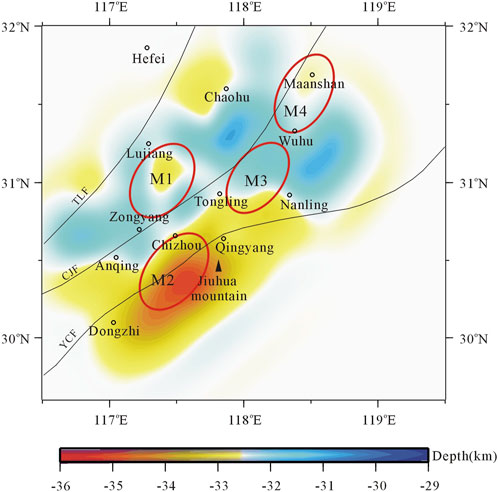
FIGURE 9. Moho structure. TLF: Tan–Lu Fault; CJF: Yangtze River Fault; YCF: Yangxin–Changzhou Fault. M1: Luzong ore clustering district; M2: Guichi ore clustering district; M3: Tongling ore clustering district; M4: Ningwu ore clustering district.
6 Discussion
6.1 Comparison with existing studies
This study shows that above 7 km depth, the general characteristics of the velocity structure are that the ore clustering districts exhibit high-velocity anomalies and the Yangtze River waterway exhibits a strip-shaped low-velocity distribution. Some scholars have also used the sounding data from this air gun experiment to study the crustal velocity structure. For example, She et al. (2018) used airgun surface-wave data recorded by the mobile array to invert the S-wave velocity structure at a depth above 1 km in the study area. Tian et al. (2018) used the Pg traveltimes to invert the 3D P-wave velocity structure of the upper crust. Furthermore, Zhang et al. (2020) inferred the 3D crustal velocity structure of the middle–lower Yangtze metallogenic belt and adjacent areas using airgun Pg traveltimes recorded by mobile and regional stations combined with local earthquake first-arrivals in the region. These study results all show that the upper crust of the metallic ore clustering districts exhibits high velocities. At a depth of 0–1 km, the P-wave velocity values obtained in this study are the same as those obtained by Zhang et al. (2020), i.e., approximately 5.3 km/s. At a depth of 5–10 km, the velocity values obtained by this study are about 5.7–6.0 km/s in the low-velocity area, and about 6.2–6.3 km/s in the high-velocity area beneath the ore clustering districts, which are similar to the results of Zhang et al. (2020) and Tian et al. (2018). This study shows that the low-velocity strip corresponding to the Yangtze River waterway extends downwards to a depth of 7 km. Zhang et al. (2020) also observed a low-velocity anomaly zone corresponding to the Yangtze River waterway that extended to approximately 9 km in depth and interpreted it as a junctional zone of the metallic ore clustering districts.
This study found that the depth of the Moho in the study area varies between 30 and 36 km. The Moho depth in both Luzong and Tongling ore clustering districts is 31–33 km, and the Moho depth of Guichi ore clustering districts is 33–36 km. Wei et al. (2018) used the teleseismic receiver function recorded by the airgun mobile array and regional seismic network to infer a Moho depth of approximately 30–35 km in an area overlapping our study area, which is approximately consistent with the results of this study. Deep seismic reflection profiles yielded crustal thicknesses of 30–32 km in the Luzong ore clustering districts (Lü et al., 2013), 33–36 km in Guichi (Shao et al., 2015), and 30–32 km in Tongling (Lü et al., 2003). The Moho depths of each ore clustering district obtained in this study are basically consistent with the reflection seismic results. The Moho is depressed in Guichi ore clustering district, which may indicate the effect of crustal equilibrium in the Jiuhua Mountain area.
6.2 Tectonic implications of the crustal structure
The upper crust beneath the ore clustering districts exhibit high-velocity anomalies, which has been confirmed by numerous deep exploration studies (Shi et al., 2004; Liu et al., 2012; Lü et al., 2014; She et al., 2018; Tian et al., 2018; Zhang et al., 2020). The middle–lower Yangtze metallogenic belt is located within the Yangtze plate and is the product of volcanic activity under the regime of intracontinental orogeny (compression) and subsequent extensional tectonics during Yanshanian. A large amount of hydrothermal fluid carried by large-scale magmatic intrusion gradually cooled and mineralized in the Cretaceous, Jurassic, and Triassic strata of the upper crust, with weak metamorphism. This environment is conducive to the migration and metasomatism of various metal ions (Qiang et al., 2014). Liu et al. (2012) compared five shallow crustal velocity profiles in Luzong with the results of gravity, aeromagnetic surveys, and geochemical profiles, which showed that the development zone of intrusive body generally presents high anomaly of the metal contents and high elastic wave velocity. Numerous studies have also confirmed that the occurrence location of metallic deposits in the study area is related to the location of hidden intrusive rock bodies (Tang et al., 2010; Du and Chang, 2011). Therefore, the high-velocity anomalies in the upper crust beneath the ore clustering districts may suggest the source of mineralized materials.
The several results of deep seismic reflection profiles show that the upper crust of the middle–lower Yangtze metallogenic belt has been subjected to intense compression and deformation, and the deformation at different scales was generally developed above the basement detachment surface, which was located at a two-way traveltime of 2.0–4.0 s, with a depth of 6–12 km (Liang et al., 2014; Lü et al., 2015b; Shao et al., 2015). According to the velocity structure obtained in this study, the velocity characteristics above and below 7 km depth are obviously different, which indicates that the crustal deformation above and below 7 km is decoupled. Therefore, this study infers that there might have been a basement detachment surface determined by deep reflection near a depth of 7 km.
The basement detachment surface may be important for the migration and retention of magma-hydrothermal fluid and their eventual emplacement and mineralization in the upper crust. In the brittle upper crust, regional tectonic deformation and faults control magma separation, migration, and emplacement (Vigneresse, 1995). The research results of the mineralization system in the middle–lower Yangtze metallogenic belt indicates that, during the Yanshan period intracontinental orogeny, the basement detachment surface and other tectonics in the upper crust might have also become “the channels” of the metallogenic system. Meanwhile, as a sedimentary surface or interlayer detachment surface in the upper crust, the basement detachment surface, like many other sedimentary surfaces in the overburden, might rupture and slip during tectonic movement because of a difference in physical properties. Together with fault zones, these surfaces formed complex spatial networks that became the sites of mineralizing fluids and mineral precipitation (Lü et al., 2019).
The velocity structure in the middle–lower crust obtained in this study shows high-velocity and lateral uniformity characteristics, with a resolution scale of 0.4° × 0.4° × 10 km. Luo et al. (2019) obtained the 3D crustal S-wave velocity structure with a resolution of 0.5° × 0.5° × (15–20 km) in the middle–lower Yangtze metallogenic belt and its surrounding areas using the background noise data recorded by the regional network. From velocity vertical slices, the S-wave velocity of the middle–lower crust in the Anhui section of the middle–lower Yangtze metallogenic belt are higher than those of its surrounding area, with smaller internal lateral variation.
Previous studies have pointed out that the present-day lower crust of the middle–lower Yangtze metallogenic belt may be a part of the multi-level magma chamber system that underwent metallogenesis in the Mesozoic (chang et al., 1991), that the ore-forming rock bodies in the middle–lower Yangtze metallogenic belt are similar to Adakite, and it is inferred that the lower crust of the metallogenic belt had undergone a process similar to MASH mineralization (melting-assimilation-storage- homogenisation) (Wang et al., 2001; Xü et al., 2001; Xü et al., 2002). The results of P-wave receiver function suggest that large-scale magma melting and flow might have occurred in the lower crust of the middle–lower Yangtze metallogenic belt during Yanshanian, and the metallogenic belt may be the product of the MASH metallization process (Shi et al., 2012). Therefore, the velocity structure in the middle–lower crust, especially in the lower crust observed by this study show lateral uniformity characteristics, which could be related to that the middle–lower Yangtze metallogenic belt had undergone a MASH metallization process. On the surface, the middle–lower Yangtze metallogenic belt is wedged between the Tan–Lu Fault and the Yangxin–Changzhou Fault and is in a “V” shaped narrow in the southwest and wide in the northeast (Chang et al., 1991). Some studies have suggested that a mantle uplift zone with a trumpet shape is observed beneath the regions along the Yangtze River in Anhui Province (Chang et al., 1991; Tang et al., 1998). The research from regional gravity data has shown that the Moho beneath the middle–lower Yangtze metallogenic belt has shown a “V” shaped uplift belt along the SW-NE strike, with a depth of about 30–33 km (Figure 10A) (Yan et al., 2011). In this airgun experiment, because the offset of PmP waves in NW–SE direction is not enough, this study is insufficient to conclude that the Moho beneath the metallogenic belt is uplifted. However, our results indicate that the Moho within the area overlapped with Yan et al.’s image (2011) is about 30–33 km depth, and the area with relatively shallow Moho also shows a “V” shape extending from southwest to northeast (Figure 10B). Altogether, the Moho beneath the metallogenic belt along Yangtze River in Anhui is uplifted than those of its surrounding area, and its planeform corresponds to the “V” shape of the metallogenic belt, indicating that the region along Yangtze River in Anhui might have experienced a more intense crustal thinning process, that the mantle uplift zone is the dominant factor controlling the formation of the diagenetic and metallogenic belt in this area (Wu et al., 1999).
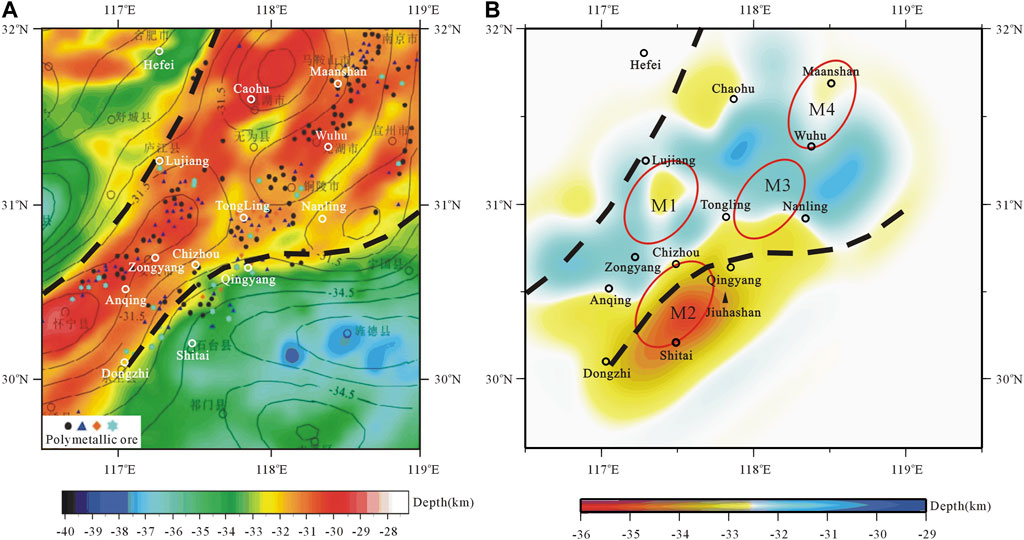
FIGURE 10. Moho comparison chart. (A) Moho image obtained by regional gravity data (Yan et al., 2011); (B) Moho image from our research. M1: Luzong ore clustering district; M2: Guichi ore clustering district; M3: Tongling ore clustering district; M4: Ningwu ore clustering district.
In conclusion, the high-velocity anomalies in the upper crust beneath the ore clustering districts in the area along the Yangtze River in Anhui result from hidden intrusive rocks; the basement detachment surface near a depth of 7 km may be channel and site for the migration and retention of crust-mantle magma; The Moho uplift zone, which is distributed in a “V” shaped pattern from southwest to northeast, controlled the formation of the metallogenic belt; the lateral uniform velocity structure in the middle–lower crust could be related to that the metallogenic belt had experienced a MASH metallization process.
Numerous studies have shown that the middle–lower Yangtze metallogenic belt underwent the process of lithosphere thickening, delamination thinning, and basaltic magma underplating during the Yanshan period (Yan et al., 2011; Shi et al., 2012; Lü et al.,2013; Jiang et al., 2014; Xü et al., 2014; Xü et al., 2015). Our study results support this opinion. The regional extension in the late Yanshan period led to the delamination of the thickened lithospheric mantle and lower crust, and the uplift of the asthenosphere, which resulted in large-scale magmatic intrusion. The mantle-derived magma underplated the lower crust, caused uplifted Moho; the hot materials from the asthenosphere led to large-scale magma melting in the lower crust, and the crust–mantle magma experienced the process of mixing, assimilation, and homogenization, resulted in the lateral uniform velocity structure in the lower crust; the crust-mantle magma migrated upwards through tectonic weak sites such as faults and basement detachment surfaces, and ultimately formed metal ore accumulation in several tectonic sites in the upper crust above the mantle uplift zone.
7 Conclusion
In this study, the upper crustal refraction wave (Pg) and Moho reflection wave (PmP) were identified from airgun seismic records of the “Geoscience Yangtze Project”. Joint inversion of the Pg and PmP traveltimes was conducted to reconstruct the 3D crustal velocity structure and Moho discontinuity for the middle–lower Yangtze metallogenic belt in Anhui Province. The characteristics of the solution model are consistent with existing geophysical results. The present-day crust in the study area retains the traces of lithosphere delamination-thinning and basaltic magma underplating during the Yanshan period. This study suggest that airgun excitation in inland waters is an effective method for detecting continental crustal structure to obtain the velocity and velocity discontinuity.
Data availability statement
The waveform data used in this study are available in Management Centre of China National Seismic Network (http://data.earthquake.cn).
Author contributions
All authors contributed to the article and approved the submitted version. WG and ZY performed the inversion and wrote the manuscript draft; ZY, XT, and WG contributed to the discussion section in the manuscript. ZY, XT, BL, CZ, XS, and ZG analyzed the seismic waveforms, and manually picked the traveltimes; YQ contributed to drawing figures.
Funding
Our work is supported by the National Natural Science Foundation of China under Grant 41674068 and 41774066.
Acknowledgments
The author is very grateful to Academician Chen Yong, who led the airgun experiment, to Professor Zhang Xiankang for giving technical guidance to this experiment, and to colleagues from Geophysical Exploration Center of China Earthquake Administration, Fujian Earthquake Administration, Anhui Earthquake Adm-inistration, and Institute of Geology of Chinese Academy of Geological Sciences. We would also like to thank Wang Baoshan, Yao Huajian, Tian Xiaobo and other experts for their advice on this article. Waveform data were provided by the Management Centre of China National Seismic Network at Institute of Geophysics (SEISDMC, doi:10.11998/SeisDmc/SN) (Zheng et al., 2009). The Imaging software used in our research was FMTOMO (Rawlinson et al., 2010). The GMT software package (Wessel et al., 2013) was used to draw the figures in this paper.
Conflict of interest
The authors declare that the research was conducted in the absence of any commercial or financial relationships that could be construed as a potential conflict of interest.
Publisher’s note
All claims expressed in this article are solely those of the authors and do not necessarily represent those of their affiliated organizations, or those of the publisher, the editors and the reviewers. Any product that may be evaluated in this article, or claim that may be made by its manufacturer, is not guaranteed or endorsed by the publisher.
References
Chang, Y. F., Liu, X. P., and Wu, Y. C. (1991). Copper and iron mineralization belt of middle and lower Yangtze River, 10-18. Beijing: Geological Publishing House, 10-18, 71–76. (in Chinese).
Chang, Y. F., Dong, S. W., and Huang, D. Z. (1996). On tectonics of “Poly-basement with one cover” in middle-lower Yangtze craton China. Volcanol. Mineral Resour. 17 (1-2), 1–15. in Chinese with English abstract.
Chang, X., Li, L. X., Liu, Y. K., and Wang, H. L. (2008). Seismic profile of huangzhuang-gaoliying fault in beijing by mini-sosie method. Chin. J. Geophys. 51 (5), 1503–1510. in Chinese with English abstract.
Chang, Y. F., Zhou, T. F., and Fan, Y. (2012). Polygenetic compound mineralization and tectonic evolution: Study in the Middle-Lower Yangtz River Valley metallogenic belt. Acta Petrol. Sin. 28 (10), 3067–3075. in Chinese with English abstract.
Chang, Y. F., Li, J. H., and Song, C. Z. (2019). The regional tectonic framework and some new understandings of the Middle-Lower Yangtz River Valley metallogenic belt. Acta Petrol. Sin. 35 (12), 3579–3591. in Chinese with English abstract.
Chen, Q. F., Li, L., Li, G., Chen, L., Peng, W. T., Tang, Y., et al. (2004). Seismic Features of vibration induced by train. Acta Seismol. Sin. 26 (6), 651–659. in Chinese with English abstract.
Chen, Y., Zhang, X. K., Qiu, X. L., Ge, H. K., Liu, B. J., and Wang, B. S. (2007). A new way to generate seismic waves for continental crustal exploration. Chin. Sci. Bull. 52, 2264–2268.
Chen, Y., Wang, B. S., and Yao, H. J. (2017a). Seismic gas gun exploration of continental crust structures. Sci. China Earth Sci. 60, 1739–1751.
Chen, A. G., Zhou, T. F., Liu, D. J., and Ge, C. (2017b). The Moho depth and metallogenic setting of the Middle-Lower Yangtze River valley metallogenic belt and its adjacent areas. Acta Geol. Sin. 81 (6), 1299–1311. in Chinese with English abstract.
de Kool, M., Rawlinson, N., and Sambridge, M. (2006). A practical grid based method for tracking multiple refraction and reflection phases in three-dimensional heterogeneous media. Geophys. J. Int. 167, 253–270.
Dong, S. W., Ma, L. C., Liu, G., Xue, H. M., Shi, W., and Li, J. H. (2011). On dynamics of the metallogenic belt of middle-lower reaches of Yangtze River, eastern China. Acta Geol. Sin. 85 (5), 612–625. in Chinese with English abstract.
Du, J. G., and Chang, D. Y. (2011). Consideration on the deep iron ore deposits prospecting in the middle lower Yangtze metallogenic belt. Acta Geol. Sin. 85 (5), 687–698. in Chinese with English abstract.
Ge, H. K., Lin, J. M., Wang, B. S., Song, L. L., Luo, G. C., and Chen, Y. (2006). A field experiment study of improving the seismic detectability with coded source. Chin. J. Geophys. 49 (3), 864–870. in Chinese with English abstract.
Harm, J. A., Avendonk, V., McIntosh, K., Hao, K. C., Lavier, L., Okaya, D., et al. (2016). A lithospheric profile across northern taiwan: From arc-continent collision to extension. Geophys. J. Int. 204, 331–346.
Jiang, G. M., Zhang, G. B., Lü, Q. T., Shi, D. N., and Xü, Y. (2014). Deep geodynamics of mineralization beneath the middle-lower reaches of Yangtze River: Evidence from teleseismic tomography. Acta Petrol. Sin. 30 (4), 907–917. in Chinese with English abstract.
Kennett, B. L. N., Sambridge, M. S., and Williamson, P. R. (1988). Subspace methods for large scale inverse problems involving multiple parameter classes. Geophys. Journal-Oxford 94, 237–247.
Kuo, Y. W., Wang, C. Y., Hao, K. C., Jin, X., Cai, H. T., Lin, J. Y., et al. (2016). Crustal structures from the Wuyi-Yunkai orogen to the Taiwan orogen: The onshore-offshore wide-angle seismic experiments of the TAIGER and ATSEE projects. Tectonophysics 692, 164–180.
Liang, F., Lü, Q. T., Yan, J. Y., and Liu, Z. D. (2014). Deep structure of Ningwu volcanic basin in the Middle and Lower reaches of Yangtze River: Insights from reflection seismic data. Acta Petrol. Sin. 30 (4), 941–956. in Chinese with English abstract.
Lin, J. M., Wang, B. S., Ge, H. K., Tang, J., Zhang, X. K., and Chen, Y. (2008). Study on large volume gas gun source characteristics and seismic phase analysis. Chin. J. Geophys. 51, 206–212. in Chinese with English abstract.
Liu, Z. D., Lü, Q. T., Yan, J. Y., Zhao, J. H., and Wu, M. A. (2012). Tomographic velocity structure of shallow crust and target prediction for concealed ore deposits in the Luzong basin. Chin. J. Geophys. 55 (12), 3910–3922. in Chinese with English abstract.
Lü, Q. T., Hou, Z. Q., ZhaoShi, J. H. D. N., Wu, X. Z., Chang, Y. F., Pei, R. F., et al. (2003). Complex crustal structure in Tongling mining area revealed by deep seismic reflection profile. Sci. China (Series D) 33, 442–449. in Chinese.
Lü, Q. T., Yan, J. Y., Shi, D. N., Dong, S. W., Tang, J. T., Wu, M. G., et al. (2013). Reflection seismic imaging of the lujiang-zongyang volcanic basin, Yangtze metallogenic belt: An insight into the crustal structure and geodynamics of an ore district. Tectonophysics 606, 60–77.
Lü, Q. T., Liu, Z. D., Tang, J. T., Wu, M. A., Yan, J. Y., and Xiao, X.Sinpprone-03-CJ Group (2014). Upper crustal structure and deformation of Luzong ore district: Constraints from integrated geophysical data. Acta Geol. Sin. 88 (4), 447–465. in Chinese with English abstract.
Lü, Q. T., Shi, D. N., Liu, Z. D., Zhang, Y. D., Dong, S. W., and Zhao, J. H. (2015a). Crustal structure and geodynamics of the middle and lower reaches of Yangtze metallogenic belt and neighboring areas: Insights from deep seismic reflection profiling. J. Asian Earth Sci. 114, 704–716.
Lü, Q. T., Dong, S. W., Tang, J. T., Shi, D. N., and Chang, Y. F.SinoProbe-03-CJ Group (2015b). Multi-scale and integrated geophysical data revealing mineral systems and exploring for mineral deposits at depth: A synthesis from SinoProbe-03. Chin. J. Geophys. 58 (12), 4319–4343. in Chinese with English abstract.
Lü, Q. T., Meng, G. X., Yan, J. Y., Zhang, K., Zhao, J. H., and Gong, X. J. (2019). Multi-scale exploration of mineral system: Concept and progress: A case study in the middle and lower reaches of the Yangtze River metallogenic belt. Geol. China 46 (4), 373–689. in Chinese with English abstract.
Luo, S., Yao, H. J., Li, Q. S., Wang, W. T., WanMeng, K. S. Y. F., and Liu, B. (2019). High-resolution 3D crustal S-wave velocity structure of the middle-lower Yangtze River metallogenic belt and implications for its deep geodynamic setting. Sci. China Earth Sci. 62, 1361–1378.
Okaya, D., Stern, T., Holbrook, S., Avendonk, H., Davey, F., and Henrys, S. (2003). Imaging a plate boundary using double-sided on shore-offshore seismic profiling. Lead. Edge 22, 256–260.
Qiang, J. K., Wang, X. Y., Tang, J. T., Pan, W., and Zhang, Q. J. (2014). The geological structures along huainan-liyang magnetotelluric profile: Constraints from MT data. Acta Petrol. Sin. 30 (4), 957–965. in Chinese with English abstract.
Rawlinson, N., and Sambridge, M. (2003). Seismic traveltime tomography of the crust and lithosphere. Adv. Gepphysics 46, 142–145.
Rawlinson, N., and Sambridge, M. (2004a). Wave front evolution in strongly heterogeneous layered media using the fast marching method. Geophys. J. Int. 156, 631–647.
Rawlinson, N., and Sambridge, M. (2004b). Multiple reflection and transmission phases in complex layered media using a multistage fast marching method. Geophysics 69, 1338–1350.
Rawlinson, N., and Spakman, W. (2016). On the use of sensitivity tests in seismic tomography. Geophys. J. Int. 205, 1221–1243.
Rawlinson, N., and Urvoy, M. (2006a). Simultaneous inversion of active and passive source datasets for 3-D seismic structure with application to Tasmania. Geophys. Res. Lett. 33, L24313.
Rawlinson, N., de Kool, M., and Sambridge, M. (2006b). Seismic wavefront tracking in 3D heterogeneous media: Applications with multiple data classes. Explor. Geophys. 37, 322–330.
Rawlinson, N., Reading, A. M., and Kennett, B. L. N. (2006c). Lithospheric structure of Tasmania from a novel form of teleseismic tomography. J. Geophys. Res. 111, B02301.
Rawlinson, N., Pozgay, S., and Fishwick, S. (2010). Seismic tomography: A window into deep Earth. Phys. Earth Planet. Interiors 178, 101–135.
Sethian, J. A. (1996). A fast marching level set method for monotonically advancing fronts. Proc. Natl. Acad. Sci. 93, 1591–1595.
Shao, L. S., Liu, Z. D., Lü, Q. T., Yan, J. Y., Zhang, K., Zhao, J. H., et al. (2015). Deep fine structure of Guichi ore concentrated area: The understanding of the integrated geophysical detection results. Chin. J. Geophys. 58 (12), 4490–4504. in Chinese with English abstract.
She, Y. Y., Yao, H. J., Zhai, Q. S., Wang, F. Y., and Tian, X. F. (2018). Shallow crustal structure of the Middle-Lower Yangtze River region in Eastern China from surface-wave tomography of a large volume gas gun-shot experiment. Seismol. Res. Lett. 89, 1003–1013.
Shi, D. N., Lü, Q. T., Xü, M. C., and Zhao, J. H. (2004). Tomographic study of shallow structures in tongling metallogenic province. Mineral. Deposits 23 (3), 383–389. in Chinese with English abstract.
Shi, D. N., Lü, Q. T., Xü, W. Y., Yan, J. Y., Zhao, J. H., Dong, S. W., et al. (2012). Crustal structures beneath the mid-lower Yangtze Metallogenic belt and its adjacent regions in Eastern China: Evidences from P wave receiver function imaging for a MASH metallization process? Acta Geol. Sin. 86 (3), 389–399. in Chinese with English abstract.
Tang, Y. C., Wu, Y. C., Chu, Z. G., Xing, F. M., Wang, Y. M., Cao, F. Y., et al. (1998). Copper-gold polymetallic deposits Geology along the Yangtze River in Anhui Province. Beijing: Geological Publishing House, 60–85. (in Chinese).
Tang, J., Wang, B. S., Ge, H. K., and Chen, Y. (2008). Study on weak signal detection of small shot in regional scale deep exploration. Chin. J. Geophys. 51 (6), 1810–1818. in Chinese with English abstract.
Tang, J. F., Lu, S. M., Li, J. S., and Wei, D. Z. (2010). The basement structural deformation, evolution and its control action on deposit distribution in Luzong volcanic basin and its adjacent area in Anhui Province, China. Acta Petrol. Sin. 26 (3), 2587–2597. in Chinese with English abstract.
Tang, J. T., Zhou, C., Wang, X. Y., Xiao, X., and Lü, Q. T. (2013). Deep electrical structure and geological significance of Tongling ore district. Tectonophysics 606, 78–96.
Tian, X. F., YangWang, Z. X. B. S., Yao, H. J., Wang, F. Y., and Liu, B. J. (2018). 3D seismic refraction traveltime tomography beneath the Middle-Lower Yangtze River region. Seismol. Res. Lett. 89, 992–1002.
Vigneresse, J. L. (1995). Control of granite emplacement by regional deformation. Tectonophysics 249, 173–186.
Wang, Q., Zhao, Z. H., Xiong, X. L., and Xv, J. F. (2001). Melting of the underplated basaltic lower crust: Evidence from the Shaxi adakitic sodic quartz diorite-porphyrites, Anhui Province, China. Geochimica 30 (4), 353–362. in Chinese with English abstract.
Wang, B. S., Yang, W., Yuan, S. Y., Guo, S. J., Ge, H. K., Xu, P., et al. (2010). An experimental study on the excitation of large volume airguns in a small volume body of water. J. Geophys. Eng. 7, 388–394.
Wang, B. S., Ge, H. K., Yang, W., Wang, W. T., Wang, B., Wu, G. H., et al. (2012). Transmitting seismic station monitors fault zone at depth. Eos Trans. AGU 93 (5), 49–50.
Wang, B., Wu, G. H., Su, Y. J., Wang, B. S., Ge, H. K., Jin, M. P., et al. (2015). Site selection and construction process of Binchuan earthquake signal transmitting seismic station and its preliminary observation result. J. Seismol. Res. 38 (1), 1–6. in Chinese with English abstract.
Wei, B., Su, J. B., Wang, H. T., Zheng, L. M., Wang, Q., Zhang, W. L., et al. (2016). Site selection and construction of Hutubi airgun source signal transmitting seismic station and its characteristic of source. Earthq. Res. China 32 (2), 222–230. in Chinese with English abstract.
Wei, Y. H., Tian, X. B., Duan, Y. H., and Tian, X. F. (2018). Imaging the topography of crust-mantle boundary from a high-density seismic array beneath the Middle-Lower Yangtze River, Eastern China. Seismol. Res. Lett. 89 (5), 1690–1697.
Wessel, P., Smith, W., Scharroo, R., Luis, J., and Wobbe, F. (2013). Generic mapping tools: Improved version released. Eos Trans. AGU 94 (45), 409–410.
Wu, Y. C., Cao, F. Y., and Chang, Y. F. (1999). A Preliminary study on the deep-seated structural-magmatic control over the metallogenic system around the Yangtze River reaches in Anhui Province. Earth Sci. Front. 6 (2), 285–296. in Chinese with English abstract.
Xiao, X., Wang, X. Y., Tang, J. T., Zhou, C., Wang, Y. Q., Chen, X. B., et al. (2014). Conductivity structure of the lujiang-zongyang ore concentrated area, Anhui province: Constraints from magnetotelluric data. Acta Geol. Sin. 88 (4), 478–495. in Chinese with English abstract.
Xü, J. F., Wang, Q., Xü, Y. G., Zhao, Z. H., and Xiong, X. L. (2001). Geochemistry of Anjishan intermediate-acid intrusive rocks in Ningzhen area: Constraint to origin of the magma with HREE and Y depletion. Acta Petrol. Sin. 17 (4), 576–584. in Chinese with English abstract.
Xü, J. F., Shijo, R., Defant, M. J., Wang, Q., and Rapp, R. P. (2002). Origin of mesozoic adakitic intrusive rocks in the ningzhen area of east China: Partial melting of delaminated lower continental crust. Geology 30, 1111–1114.
Xü, T., Zhang, Z. j., Tian, X. B., Liu, B. F., Bai, Z. M., Lü, Q. T., et al. (2014). Crustal strycture beneath the Middle Lower Yangtze metallogenic belt and its surrounding areas: Constraints from active source seismic experiment along the Lixin to Yixing profile in East China. Acta Petrol. Sin. 30 (4), 918–930. in Chinese with English abstract.
Xü, Y., Lü, Q. T., Zhang, G. B., Jiang, G. M., Zhang, C. R., Shan, X. P., et al. (2015). S wave velocity structure beneath the Middle Lower Yangtze River Metallogenic belt and the constraints on the deep dynamic processes. Chin. J. Geophys. 58 (12), 4373–4387. in Chinese with English abstract.
Yan, J. Y., Lü, Q. T., Meng, G. X., Zhao, J. H., Deng, Z., and Liu, Y. (2011). Tectonic framework research of the lower and middle reach of the Yangtze River metallogenic belt based on gravity and magnetic multi-scale edge detection. Acta Geol. Sin. 85 (5), 900–914. in Chinese with English abstract.
Zelt, C. A., and Forsyth, D. A. (1994). Modeling wide-angle seismic data for crustal structure: Southeastern Grenville Province. J. Geophys. Research:Solid Earth 99, 11687–11704.
Zhai, Y. S., Yao, S. Z., and Ling, X. D. (1992). Regularities of metallogenesis for copper(gold) deposits in the middle and lower reaches of the Yangtze River area. Beijing: Geological Publishing House, 1–120. (in Chinese).
Zhang, K., Yan, J. Y., Lü, Q. T., Wei, W. B., Shao, L. S., Wang, H. F., et al. (2014a). The crust-mantle conductivity structure of nanjing(ning)-wuhu(Wu) in the middle and lower reaches of Yangtze River: Broadband magnetotelluric sounding research. Acta Petrol. Sin. 30 (4), 966–978. in Chinese with English abstract.
Zhang, Y. Q., Lü, Q. T., Teng, J. W., Wang, Q. S., and Xü, T. (2014b). Discussion on the crustal density structure and deep mineralization background in the Middle-Lower Yangtze metallogenic belt and its surrounding areas: Constraints from the gravity inversion. Acta Petrol. Sin. 30 (4), 931–940. in Chinese with English abstract.
Zhang, Y. P., Wang, B. S., Xu, T., Yang, W., Wang, W. T., Xu, Y. H., et al. (2020). Three-dimensional crustal Vp and vs structures beneath the southern segment of the Tan-Lu fault revealed by active source and earthquake data. Geophys. J. Int. 223, 2148–2165.
Zheng, X. F., Ouyang, B., Zhang, D. N., Yao, Z. X., Liang, J. H., and Zheng, J. (2009). Technical system construction of data backup Centre for China seismograph network and the data support to researches on the wenchuan earthquake. Chin. J. Geophys. 52 (5), 1412–1417. in Chinese with English abstract.
Zheng, C. L., Tian, X. F., Yang, Z. X., Wang, S. J., and Fan, Z. Y. (2017). Application of S-transform threshold filtering in Anhui experiment gas gun sounding data de-noising. Geodesy Geodyn. 9, 320–327.
Keywords: airgun source, middle-lower yangtze metallogenic belt, inland waters, joint inversion of travel times, 3D crustal structure
Citation: Guo W, Yang Z, Tian X, Liu B, Zheng C, Song X, Gao Z and Qiu Y (2023) Crustal structure and its tectonic implications beneath the middle–lower Yangtze metallogenic belt in Anhui Province: 3D deep seismic sounding results from airgun source in inland waters. Front. Earth Sci. 11:1153938. doi: 10.3389/feart.2023.1153938
Received: 30 January 2023; Accepted: 18 May 2023;
Published: 31 May 2023.
Edited by:
Xintong Dong, Jilin University, ChinaCopyright © 2023 Guo, Yang, Tian, Liu, Zheng, Song, Gao and Qiu. This is an open-access article distributed under the terms of the Creative Commons Attribution License (CC BY). The use, distribution or reproduction in other forums is permitted, provided the original author(s) and the copyright owner(s) are credited and that the original publication in this journal is cited, in accordance with accepted academic practice. No use, distribution or reproduction is permitted which does not comply with these terms.
*Correspondence: Zhuoxin Yang, eWFuZ3p4QGdlYy5hYy5jbg==
 Wenbin Guo1,2
 Zhuoxin Yang
 Xiaofeng Tian