 Hiroko Miyahara
 Kanya Kusano3
 Ryuho Kataoka
- 1Humanities and Sciences/Museum Careers, Musashino Art University, Tokyo, Japan
- 2Okinawa Institute of Science and Technology, Okinawa, Japan
- 3Institute for Space-Earth Environmental Research, Nagoya University, Nagoya, Aichi, Japan
- 4National Institute of Polar Research, Tachikawa, Japan
- 5SOKENDAI, The Graduate University for Advanced Studies, Hayama, Kanagawa, Japan
- 6Graduate School of Information Science, University of Hyogo, Kobe, Japan
- 7Department of Mechanical Engineering, Imperial College London, London, United Kingdom
Galactic cosmic rays are one of the possible mediators of the solar influence on climate. However, the impacts of GCR on clouds and climate systems are not fully understood. In this paper, we show that the high-altitude clouds associated with deep convective activities are responding to the decadal-scale cycles of GCRs and that the susceptible areas are seasonally variable. Most notable responses were found in August over tropical land areas, suggesting that the susceptivity of clouds to GCRs depends on the depth of convective activities and the abundance of aerosol precursor materials. Furthermore, following the activation of high-altitude cloud formation, an increase in sea surface temperature (SST) gradient was observed over the Pacific. Although the response of sea surface temperature to solar activity has mostly been discussed as mediated by solar radiations, we propose that another mechanism is possible: through the impact of GCRs on clouds and the resultant changes in atmospheric circulations.
1 Introduction
The possible responses of climate to solar activity variations have been reported for various time scales (Gray et al., 2010), and several mediators have been proposed, including solar radiations (Kodera & Kuroda, 2002; Matthes et al., 2006; Meehl et al., 2008; Misios et al., 2019), GCRs modulated by solar-wind magnetic field (Svensmark & Friis-Christensen, 1997; Carslaw et al., 2002), and the interplanetary magnetic field (Voiculescu et al., 2013; Scott et al., 2014). Notable responses of climate, such as temperatures and precipitation, to solar activity have been observed for millennial (Bond et al., 2001; Obrochta et al., 2012) and centennial time scales (Neff et al., 2001; Wang et al., 2005); however, identifying the relative importance of mediating solar-activity related parameters is difficult at such time scales, as the radiative and magnetic outputs of the Sun vary in a similar pattern. To identify the contribution of each of the parameters and trace the propagation of their impacts, it is needed to examine the shorter time scales, such as those associated with the solar decadal cycle, or even shorter, where the temporal variation of the solar radiative outputs and GCRs are slightly different (Miyahara et al., 2008; Yamaguchi et al., 2010).
Solar radiations vary based on the emergence and disappearance of sunspots and faculae on the solar surface (Domingo et al., 2009). Therefore, they change along with the decadal-scale variation of the activity level of sunspots. However, the flux of GCRs incident to the Earth’s atmosphere is attenuated by the solar wind magnetic field in the heliosphere and is thus dependent on the evolution of the configuration and its direction (Jokipii & Thomas, 1981). As a result, the flux of GCRs is dependent on the solar magnetic polarity that reverses every solar cycle maximum (see Supplementary Figure S1). In addition, the transient intensification of the magnetic fields associated with solar coronal mass ejections contributes to the shielding of GCRs (Forbush, 1938). Due to the travel time of the solar magnetic field in the heliosphere and its influence on the trajectory of GCRs, the variation of GCRs at Earth occasionally delays up to ∼1.4 years relative to the decadal variations in solar activity level (Usoskin et al., 2001; Koldobskiy et al., 2022). Such features might allow identifying the potential contribution of GCRs to the Sun–Climate connection.
The possible impact of the decadal-scale solar activity cycle on climate has been reported, e.g., in the North Atlantic region (Kodera, 2002; Gray et al., 2016; Kuroda et al., 2022), in the Pacific region (Dima & Voiculescu, 2016), and particularly in the tropical region (Gleisner and Thejll, 2003; van Loon et al., 2004; White, 2006; Misios et al., 2019). Recent studies have suggested that an increased solar activity results in a reduction in the east-west gradient of SST over the Pacific and in a weakening of the Pacific Walker Circulation (Misios et al., 2019). These decadal-scale Sun-Climate connections have been mostly attempted to be explained by the so-called “top-down” mechanism, through which solar UV (SUV) influences stratospheric temperature and subsequently alters tropospheric circulation (Kodera & Kuroda, 2002; Matthes et al., 2006) or by the “bottom-up” mechanism, through which the total solar irradiance (TSI) warms up the ocean to change atmospheric circulation (Meehl et al., 2008; Misios et al., 2019). However, significant positive feedback is needed for the latter mechanism to explain the observed temperature variations, as the variability of TSI over solar cycles is as small as 1 W/m2.
It is, however, also possible that GCRs contribute to the decadal-scale Sun–Climate connection through the ionization and its impacts on cloud condensation nuclei (Dickinson, 1975; Carslaw et al., 2002; Kirkby et al., 2011; Svensmark et al., 2013), by enhancing the collision efficiency between aerosols and cloud droplets (Tinsley, 2000; Zhou et al., 2009; Tinsley, 2022), or by stabilizing the molecular cluster to grow to cloud condensation nuclei (Tinsley and Deen, 1991; Yu & Turco, 2001; Yu, 2002). However, it is not well understood where their effects may proceed in actual environments and how those impacts propagate in the climate system.
Originally, it was suggested that the cloud covers over oceans are enhanced with the increase in GCRs (Svensmark & Friis-Christensen, 1997). Later on, it was demonstrated that the low-altitude clouds over oceans are most significantly correlated to GCR variations (Marsh & Svensmark, 2003). Voiculescu et al. (2006) has suggested that the correlation to low-altitude clouds is significant over the mid latitudes of the Atlantic. However, both theoretical estimates and the laboratory chamber experiment have indicated that GCR-induced aerosol formations are rather efficient at low temperatures (Kazil et al., 2006; Yu et al., 2008; Kirkby et al., 2011; Dunne et al., 2016) (i.e., at high altitudes). The upper troposphere is also favorable in terms of the abundance of GCR-induced ions (Ney, 1959; Ermakov et al., 1997; Usoskin et al., 2004). Deep convection is a possible method for supplying aerosol precursors from the biogenic activities at the ground or ocean surfaces to the upper troposphere (Twohy et al., 2002; Kazil et al., 2006); therefore, the high-altitude clouds near highly convective areas are potentially most susceptive to GCRs, although the deep convection may also contribute to the transport of newly-formed cloud condensation nuclei to the lower troposphere to change the cloud properties (Williamson et al., 2019).
The impact of GCRs through the formation of aerosols may only be emphasized if there are few pre-existing aerosols in an ambient environment (Almeida et al., 2013), as newly formed aerosols tend to be adsorbed to pre-existing aerosols if they are abundant. Atmospheric aerosols, including the ones that have anthropogenic origins, are mostly confined within ∼4 km from the surface, except over the mountains with high elevations (Koffi et al., 2016). This factor also suggests a possibility that only the middle to upper troposphere meets the criteria of significantly being impacted by GCRs.
In this paper, we examine the response of high-altitude clouds based on records over the past 43 years. Due to the possible long-term artifactual influence from satellite-based observations (Evan et al., 2007), it is crucial to examine the cloud behaviors based on multiple independent data sets, and, to concentrate on the short to mid-term fluctuations. Therefore, in this work, we base on two records (see methods) and focus on the response at the decadal scale. We used monthly-resolved high temporal-resolution data to constrain the possible conditions required for cloud activity to respond to GCR variations.
2 Methods
To examine the response of high-altitude clouds to GCR decadal cycles, we utilized a daily record of Outgoing Longwave Radiation (OLR) (Lee and NOAA CDR Program, 2001) with 1° × 1° resolution for Jan/1979–Dec/2021. OLR reflects the existence of high-altitude clouds, although only for low-latitude regions. For example, the existence of high clouds with low cloud-top temperatures leads to lower OLR value. In this study. We calculated the fraction of the days OLR is equal to or lower than a threshold value for each month. We produced four time series for each 1° × 1° grid with a threshold value: 170 W/m2, 200 W/m2, 230 W/m2, and 260 W/m2, respectively. In cases where the threshold used yielded a fraction of none or 100% for more than fifty percent of the time window used in the analysis, the threshold was considered too low or too high for that 1° × 1° tile and was discarded. The time series were then compared with the GCR variation to derive the Spearman’s correlation coefficient. The maximum correlation coefficient among the four cases and the corresponding threshold were displayed on the maps. In the tropical regions, if the maximum correlation was obtained with the threshold of 200 W/m2, it implies that tropospheric high-altitude clouds (cloud top pressure ≤ ∼440 mb) are most sensitively responding to GCRs. On the other hand, if the maximum correlation was obtained with 230 W/m2, it suggests that adding mid-altitude clouds (∼440 mb < cloud top pressure ≤680 mb) improves the correlation.
The response of clouds to GCR may be accompanied by some time lags; therefore, correlations were examined for lags between 0 and 3 years. When estimating correlation coefficients with a time lag of 0 years, correlation coefficients with lags of −2 years (GCRs lag cloud variation with 2 years) to 0 years (no time lag) were calculated, and only the cases the correlation was maximized at 0 years were considered non-false correlation and displayed on the map. For the zero-year lag, the cloud data were compared with the monthly mean GCR flux and with the yearly mean for a lag of 1 year or longer. With the lag and threshold that yielded the maximum correlation coefficient, we estimated, based on the regression line, the maximum variability of high-altitude clouds over the GCR cycles, i.e., the variability for 1987–1990 when GCR variation was at its maximum. For the GCR variation, the neutron monitor data for Jan/1953–Nov/2006 obtained at the Climax station (http://cr0.izmiran.ru/clmx/main.htm) and those for Apr/1964–Dec/2021 obtained at the Oulu station (http://cr0.izmiran.ru/oulu/main.htm) were used. The daily data were normalized and averaged to obtain the monthly means. Prior to the analyses, the long-term trends were subtracted from the cloud and GCR data to concentrate on the decadal-scale variations.
We also analyzed the ISCCP-HGM series provided by the International Satellite Cloud Climatology Project (Rossow et al., 2016) to validate the response of OLR to GCRs. We used the monthly data of high (≤440 mb) and low (>680 mb) cloud fractions for July/1983–June/2017.
For the examination of the response of SST, we used the NOAA Optimum Interpolation SST V2 data provided by NOAA/OAR/ESRL PSL (Reynolds et al., 2002). We used the 1-degree grid data for Dec/1981–Dec/2021. We also used the Niño 4 index (Trenberth and Stepaniak, 2001) and the NCEI Pacific Decadal Oscillation index (Mantua, 1999). To analyze the response of surface pressure, zonal wind, and meridional wind, we used the JRA-55 (Japanese 55-year Reanalysis) data of monthly mean pressure reduced to mean sea level with 1.25° × 1.25° resolution (Kobayashi et al., 2015). We only used data from 1979 when the observational data was substantial and the reliability was high (Ebita et al., 2011). For the precipitation analysis, we used CMAP monthly mean precipitation data with 2.5° × 2.5° resolution (Huffman et al., 1997).
To examine the responses of SST and atmospheric data to TSI, the NOAA Climate Data Record of TSI (Coddington et al., 2015) was used. As an index of solar UV, NOAA adjusted the solar radio flux at 10.7 cm (https://lasp.colorado.edu/lisird/data/noaa_radio_flux/) were combined with the Penticton radio flux data for May/2018 to present (https://lasp.colorado.edu/lisird/data/penticton_radio_flux/).
Note that the data from Jun/1991 to May/1993 were excluded from the analyses so that the possible impacts from the eruption of Mt. Pinatubo in 1991 are eliminated.
3 Results
3.1 Relationship between high-altitude clouds and GCR cycles
The monthly data of high-altitude clouds, as monitored by OLR and those of International Satellite Cloud Climatology Project (ISCCP) H-series Gridded Monthly (HGM), were compared with GCR cycles (see Methods). Then, it was found that both series consistently indicate that there are regions in the tropics where high-altitude clouds show significant positive correlations to decadal-scale GCR cycles (Figures 1, 2, also see Supplementary Figures S2, S3), suggesting that GCRs may be contributing to the changes in cloud activity. However, these areas are localized and vary based on the seasons. Most significant correlations were found in August for the areas in which the formation of high-altitude clouds is active (see Figure 1), supporting the above-mentioned hypothesis; however, they were localized to the land areas and nearby oceans. There were also some regions in which high cloud formations were suppressed (see below). In boreal winter, the areas showing significant correlations migrated to the convective regions in the southern hemisphere (Figure 2, also see Supplementary Figure S3). The correlations were weaker compared with those of August; however, a prompt response was observed around the northern tip of Australia and the northwest coast of South America (Figure 2A). Figures 1F–I and Figures 2F–I indicate the OLR range that achieved the maximum correlation for each grid. While the threshold of 200 W/m2 or lower suggests that the response is limited to the high-altitude clouds, the threshold of 230/m2 or higher implies that the addition of mid- and possibly lower altitude clouds improves the correlation. For example, Figure 1F and Figure 2F suggest that the correlations off the northwest coast of South America involve the response of mid-altitude clouds.
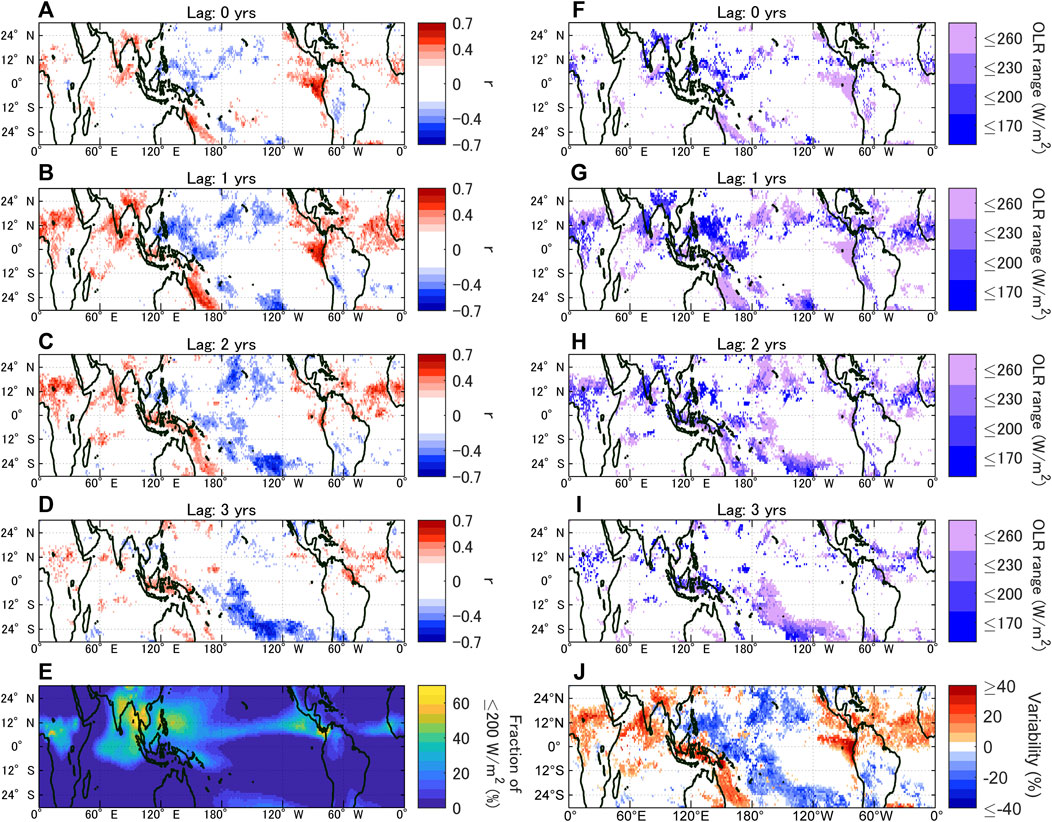
FIGURE 1. (A–D) Correlation coefficient r (p ≤ 0.05) between the ratio of existence days of high-altitude clouds and GCRs in August for a time lag of 0 (no time lag) to 3 years (clouds lag GCRs). (E) Fraction of the days OLR is ≤200 W/m2 in August. (F–I) OLR ranges that yielded the maximum correlation coefficients in (A–D). (J) Maximum variability of the ratio of existence days of high-altitude clouds over the GCR cycles.
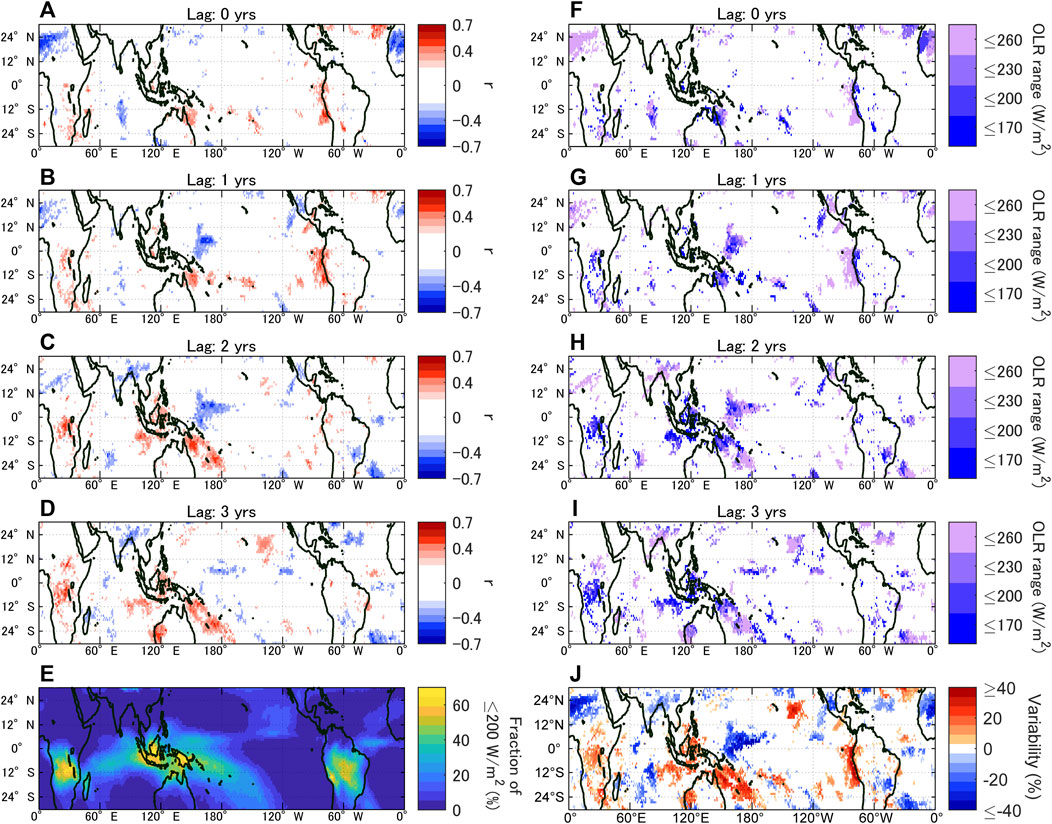
FIGURE 2. (A–J) Same as Figure 1 but for January.
In August, the correlations were maximized in 1 year (Figure 1B) and diminished afterward (Figures 1C, D). Such lagged responses of clouds imply that a positive feedback mechanism exists behind the GCR–cloud connection (see the fifth paragraph in the Discussion). The correlations around the Indonesian maritime continent were maximized with a further delay (Figures 1C, D), suggesting an impact through the mechanism involving atmospheric and ocean coupling. Similarly, the correlations around the northern tip of Australia and the northwest coast of South America in January diminished after 1 year, whereas the correlations around the Indonesian maritime continent were maximized in 2–3 years (Figures 2C, D).
The maximum variability of the ratio of existence days of high-altitude clouds over the GCR cycle is shown in Figure 1J and Figure 2J. The obtained maps indicate that there are regions where the variability is much larger than expected from the ion production rate in the tropics (see Supplementary Figure S12 of Dunne et al., 2016), also supporting the existence of a positive feedback mechanism. For example, while the variability of ion production rate in the upper troposphere is up to ∼20% around 20–30°N and 20–30°S in the tropics and is smaller in the lower latitude regions, the variability of the fraction of days OLR is equal to or lower than 200 W/m2 is larger than 20% in August around eastern India and Bangladesh (Figure 3), where the mean fraction is ∼40% (Figure 1E), although the corresponding variability of cloud amount needs further investigations. Note that the enhancement in the fraction of days with the presence of high clouds as estimated based on the OLR thresholds may also be caused by the uplift of the convective cloud system in addition to the increase of cloud amount itself.
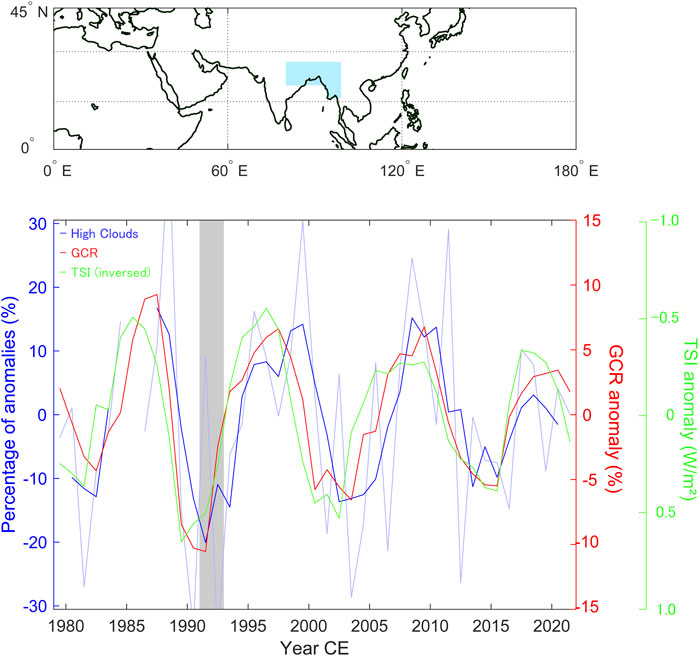
FIGURE 3. Variability of the ratio of existence days of high-altitude clouds as monitored by OLR with a threshold value of 200 W/m2 (pale blue line) and the 3-point running averages (blue line) for the area shown in the map (highlighted by cyan), plotted together with the anomaly of GCR flux monitored by neutron monitors (red line) and TSI (green line). The variability of ion production rate in the upper troposphere over the solar cycles is about 20% around the region (Dunne et al., 2016). Note that all of the series are high-pass filtered for p ≤ 15 yrs. Note also that the period of 2 years after the eruption of Mt. Pinatubo, indicated by the gray highlight, was excluded from the correlation analysis of this study.
3.2 Relationship between SST and the GCR cycles
Figures 4A–E indicates the correlation coefficient between SST and GCRs in August when the most notable correlations were found for cloud activity. Figure 4F exhibits the spatial pattern of SST in August. The figures indicate that decadal-scale forcing results in a characteristic spatial pattern in the central and western Pacific. While the SST in the central Pacific tends to decrease as GCR is enhanced, especially in the winter hemisphere (Figure 4G), the SST in the southwestern Pacific tends to be increase, suggesting that the trade winds over the Pacific region are intensified at the GCR cycle maxima. This tendency is consistent with the previously suggested reduced east–west SST gradient and the weaker trade winds at the solar cycle minima (Misios et al., 2019). However, the response of SST to TSI, which was suggested as the forcing parameter in Misios et al. (2019), delays by 1 year compared to the response to GCR, and the correlations between SST and TSI were maximized with a lag of 3 years (see Figures 4H–N). The relationship between SST and SUV is more or less the same for TSI (see Supplementary Figure S4) and is peaked with a lag of ∼3 years.
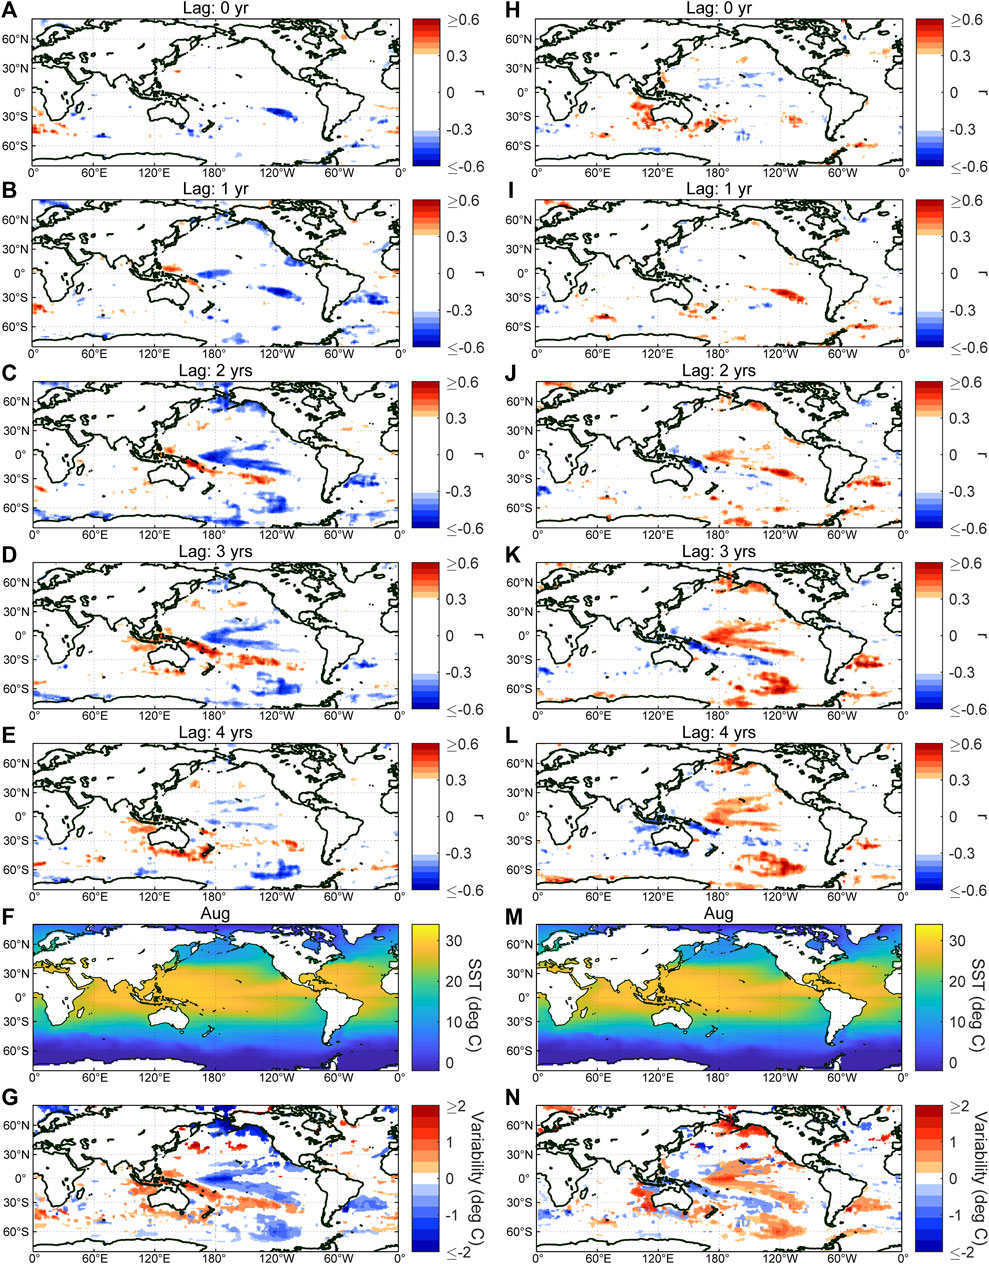
FIGURE 4. (A–E) Correlation coefficient r (p ≤ 0.05) between GCRs and SST in August for a lag of 0–4 years. (F) Monthly mean SST for August. (G) Maximum variability of SST over the GCR cycles. (H–N) Same as (A–G) but for TSI.
The areas showing significant correlations between SST and GCRs with no time lag were limited to the southern edge of the tropical zone around 20–30°S 100–130°W (Figure 4A); however, the impacts on SST were expanded and maximized with a lag of 2 years (Figure 4C). The maximum temperature change around the equatorial region over the GCR cycle was as large as 1.7 K and was observed in an area centered at about 180°W(E) (Figure 4G, also see Supplementary Figure S5 for the time profile). Regarding January, the east–west contrast was less well structured. However, the maximum change around the region reached 2.1 K (see Supplementary Figure S6). This region is often characterized by the El Niño modoki events (Ashok et al., 2007) and has been examined using the Niño 4 index, one of the indices of the El Niño–Southern Oscillation. Although the Niño 4 index is derived based on the SST over the region wider than those indicating correlations to GCRs, and thus the correlation coefficient between Niño 4 and GCRs is relatively lower, the lead-lag analysis supports that the decadal component of SST in this region lags that of GCRs by about 2 years (see Supplementary Figures S7A, B).
Figures 4C, G indicates that the areas showing correlation with GCRs include the Bering Sea, which is within the region characterized by the Pacific Decadal Oscillation (Mantua et al., 1997), and that the correlations become maximum with a lag of 2 years. The lead-lag analysis between the Pacific Decadal Oscillation index and the GCRs shows that the correlation becomes maximum when the lag is about 2–3 years (see Supplementary Figures S7C, D), supporting that the decadal component of the Pacific Decadal Oscillation also lags that of GCRs.
In the cases the decadal components of the Niño 4 and the Pacific Decadal Oscillation indices were compared to the tropical high-altitude clouds, correlations were observed with a spatial pattern similar to those of Figures 1A, B; however, they were maximized when the lag was −2 to −1 years (see Supplementary Figures S8, S9), supporting that the decadal components in the Pacific Decadal Oscillation and the Niño 4 indices lag those of tropical cloud activities. Note that the direct comparison between the Niño 4 index and the Pacific Decadal Oscillation index shows that they are linked with an occasional lag of up to 1 year (see Supplementary Figures S7E, F).
3.3 Relationship between the surface pressure, zonal/meridional winds, and GCR cycles
The comparison between the surface pressure and GCRs (Figures 5A–F) indicates increased pressure around the southern edge of the tropical zone in the Pacific (Figure 5A), and the impacts are further intensified and expanded toward the northern hemisphere in 1–2 years (Figures 5B, C). On the contrary, the tropical regions between 120°W and 100°E indicate a tendency of decreasing pressure for the higher GCR, especially over the oceans. The zonal and meridional wind speed compared with GCRs suggests a possible intensification of trade winds or a westerly migration of the deep convection core around the western Pacific, especially in the northern hemisphere (see Supplementary Figure S10). When the pressure data were compared with TSI, slightly different behaviors were recognized (Figures 5G–L). One is the absence of immediate response of pressures (Figure 5G), and the other is the overall delay in the responses (Figures 5H–J) compared with the case for GCR (Figures 5A–C).
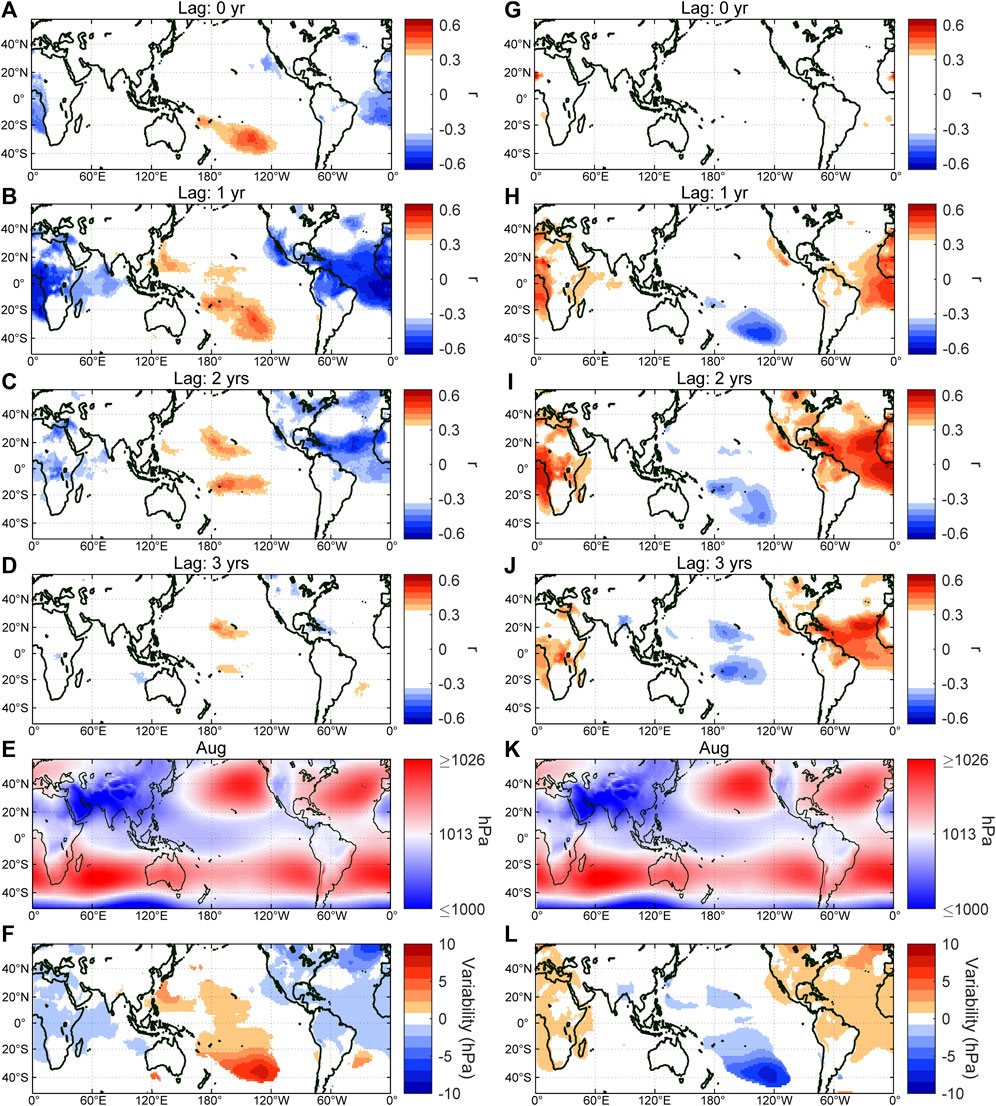
FIGURE 5. (A–D) Correlation coefficient r (p ≤ 0.05) between surface pressure and GCRs in August for a lag of 0–3 years. (E) Monthly mean pressure reduced to the mean sea level for August. (F) Maximum variability of surface pressure over the GCR cycles. (G–L) Same as (A–F) but for TSI.
4 Discussion
Although the influence of solar cycles on climate has so far been mostly discussed under the framework of the “top-down” or “bottom-up” mechanisms described earlier, the present results suggest that another mechanism is possible: “deep-convective-clouds-mediated” mechanism through the influence of GCRs on the development of deep convective clouds, and their impact on atmospheric circulation and SST gradient.
The monthly-resolved high-resolution data allowed us to identify the areas where high-altitude clouds are responding to GCR variations and to understand the possible contributing factors determining their susceptivity, although high-resolution analyses might fail to capture the responses of the clouds that are not stationed and randomly advected after being formed or those whose locations are under the influence of other interannual variations such as the El Niño–Southern Oscillation. Significant positive GCR-cloud correlations were found in tropical regions; however, they are concentrated over land and nearby oceans, suggesting the importance of any of or all the following factors: 1) the presence of relatively deeper convections compared with oceans, 2) the abundance of continental aerosol precursors for ions to produce aerosols, and 3) a more pronounced diurnal cycle over lands (see below). Most notable correlations were found in August around West and Central Africa, India and Bangladesh, the northwest coast of South America, and the proximate oceans, with a lag of 0–1 years (Figures 1A, B). The correlations around eastern India and Bangladesh suggest that the sea breezes blowing toward elevated mountains may also contribute to creating an environment in which cloud formations become sensitive to GCRs. They uplift a substantial amount of water vapor and aerosol precursors to the upper troposphere, similar to deep convection. The correlations around the southern Brazil in February (see Supplementary Figure S11) may also be related to the same mechanism. Even though convective cloud formation is active over Brazil in austral summer, the correlations were not significant except for the areas facing oceans, thus suggesting the importance of marine aerosol precursors for the impact of ions.
The more pronounced impact in August, compared with January, can be associated with the relatively low pressure around the convective areas in August (Figure 5E, also see Supplementary Figure S12), which provides improved conditions for supplying water vapor and aerosol precursors to the upper troposphere. In other words, the overlap of the Intertropical Convergence Zone (ITCZ) with the continental areas could be the key to strengthening the GCR-cloud connection. The significant northward excursion of ITCZ from the geomagnetic equator in August also contributes in terms of the magnitude of the variability in ion production rate. As also mentioned in the Results section, the variability of the abundance of GCR-induced ions is greater at higher latitudes, especially at high altitudes (see Supplementary Figure S12B of Dunne et al., 2016); thus, the excursion of ITCZ significantly increases the encounters between ions and aerosol precursors. The lower pressure in August also contributes to the higher GCR flux in the troposphere due to the reduced barometric effect (Myssowsky and Tuwim, 1926; De Mendonça et al., 2013), although the associated enhancement is only a few percent. The more significant impact in August may also be related to the seasonal variability in the emission of organic compounds from biogenic activities, the precursory materials for the aerosol formation (Kirkby, 2007; Almeida et al., 2013). For example, the flux of dimethyl sulfide is maximum in the northern hemisphere from July to September and is especially enhanced around the north part of the Indian Ocean, near the continental areas (Land et al., 2014).
Although the climatological condition is similar for July and August, the correlations between high clouds and GCRs are significantly different. The impact in July is sparse and not notable for a lag of 0–1 years (see Supplementary Figures S13A, B), while correlations become pronounced around the Indonesian maritime continent for a lag of 2–3 years (see below). The possible explanation for the relatively weaker response in July may be related to the influence of the updrafted pre-existing aerosols masking the impact of GCRs. For example, the abundance of mineral dust in northern Africa is maximum in June and starts to decrease in July (Vandenbussche et al., 2020). It has also been reported that the aerosol optical depth in northern India is maximum in May and that it starts to decrease in July (Gautam et al., 2010). Further examinations are, however, needed to confirm the impact of pre-existing aerosols.
The tendency of the decreased pressure around tropical zones except for the Pacific region (Figures 5A–C) can be related to the activated formation of deep convective clouds, and it may be causing positive feedback to the promotion of cloud activity by the GCRs by enhancing the encounters between ions and aerosol precursory materials. It has been suggested that aerosol particles could prolong the lifetime of deep convective clouds by enhancing smaller ice crystals with smaller fall velocities (Grabowski & Morrison, 2020) and by increasing freezing water droplets to enhance the release of latent heat (Rosenfeld et al., 2008), resulting in the extension of associated anvils. Then, the extended thin anvil clouds over the proximate area would increase the net radiative forcing (warming) (Koren et al., 2010). It has been speculated that the enhancement of latent heat release may even strengthen deep convection (Rosenfeld et al., 2008), although this factor may only be significant for the altitudes below the freezing level (Grabowski & Morrison, 2020). The latent heat release is also expected to increase in the case the collisional processes in clouds are promoted by the electrification of aerosols and cloud drops by GCRs (Tinsley and Deen, 1991). Enhancement of latent heat then contributes to stronger and/or longer updrafts. The synchronized prolongation/activation of convections over land in tropical regions should result in a tendency of decreased pressure around the area. Note that while the correlations between clouds and GCRs were observed most significantly at the high altitudes, the process behind the intensification of deep convective cloud activities may also act at the middle layer of deep convective clouds. As mentioned in the Introduction, deep convection may transport the newly-formed cloud condensation nuclei to the lower altitudes.
The pressure decrease is more prominent over oceans and is significantly weaker over land (Figure 5B), and this might be related to the more pronounced diurnal cycle over land (Yang and Slingo, 2001), which may mask the signals of the transient pressure decreases in monthly averaged data. However, the diurnal cycle over land is probably playing an essential role in sustaining convective activity and supplying aerosol precursors to the upper troposphere, even under enhanced cloud formation. In fact, the precipitation pattern indicates increased precipitation around the areas where high-altitude clouds are increased (see Supplementary Figure S14), supporting this tendency. Increased precipitation might also contribute to removing pre-existing aerosols from the atmosphere.
The changed pressure gradient then affects atmospheric circulation (see Supplementary Figure S9), allowing the change in the SST gradient over the Pacific Ocean (Figures 4A–E). The reduced formation of high-altitude clouds over the western Pacific (Figures 1A, B) can be associated to the westward relocation of deep convections around the area. Low-altitude clouds, instead, are likely increased around the western Pacific (see Supplementary Figures S15G, H), consistent with the previously found correlation between GCRs and low-altitude clouds in this region (Marsh and Svensmark, 2003). It is worth noting that this is a region of typhoon generation (Bloemendaal et al., 2020). While less typhoon activity is suggested for the higher GCR flux at this region, more high-altitude clouds are expected for the higher GCR flux around the areas where hurricanes are generated, as suggested by the positive relationship over the low latitude regions of the North Atlantic (Figure 1B).
The westward extension of trade wind over the Pacific eventually warms the ocean around Indonesian maritime continent and off the northeast coast of Australia, and this warming is maximized with a lag of 2–3 years (Figures 4C, D). The enhancement of high-altitude clouds around the area with a lag of 2–3 years can be related to this increased SST. The correlation between the GCRs and the SST in the northern part of the Pacific Ocean with a lag of ∼2 years suggests that the altered atmospheric circulation pattern may also eventually contribute to modulating the Pacific Decadal Oscillation, although the mechanism behind the connection to the Pacific Decadal Oscillation remains unknown and thus needs further examination.
The responses of atmospheric circulation and SST to the GCR cycles are similar to those suggested as a response to TSI cycles in previous studies; however, there are two notable differences. The first is the overall slower responses of atmospheric circulation and SST to TSI than when compared to GCR (Figures 4H–L; Figures 5G–J), consistent with the ∼1-year delay of GCRs to TSI. The second is the warming of the eastern Indian Ocean as an immediate response to TSI (Figures 4H, N). This feature, however, contradicts the weakening of the easterly wind in the western Pacific and the cooling tendency around the region suggested for the TSI maxima, as seen for the lag of 2–4 years (Figures 4J–L). Instead, it is more likely that this warming is related to the positive response of this region to GCR with a lag of ∼4 years (Figure 4E), which is a remnant of the impact around the Indonesian maritime continent (Figure 4D). Note that the areas responding positively to GCR with a lag of 4 years could indicate an apparent negative correlation to TSI with a lag of ∼5.4 years because GCR lags ∼1.4 years behind and correlates inversely with TSI. Five years are then nearly 180 degrees of a decadal solar cycle; thus, it could result in an apparent immediate positive response to TSI.
5 Concluding remarks
The possible solar influence pathway on climate systems through the variation of GCRs can be summarized as follows. First, GCRs impact the deep convective cloud activities in the tropics, primarily over the land areas, resulting in a decrease in pressure around the area, possibly giving positive feedback to cloud formation. Second, the reduced pressure intensifies atmospheric circulations and changes the SST pattern over the Pacific. Finally, the altered SST pattern activates the high-altitude cloud formation around the Indonesian maritime continent. Note that although the suggested characteristic response of clouds to GCRs seems to support the existence of GCR’s impact through the formation of aerosols, it is possible that they also affect clouds by the other paths, such as promoting the collisions between aerosols and cloud droplets (Tinsley, 2000; Zhou et al., 2009; Tinsley, 2022). Further investigations on the response of deep convective clouds to the GCR variations, especially over tropical land areas, should contribute to elucidate the contribution of ions, possibly through multiple mechanisms, and to realize the physics-based simulations to quantitatively evaluate the GCR’s impacts on cloud activities and global climate.
It is noteworthy that no correlation was observed in SST around the eastern Pacific region, where the El Niño–Southern Oscillation is most prominent. It was, however, found that the areas showing response to GCRs include the regions where periodic behaviors are often observed in SST, such as El Niño Modoki, the Indian Ocean Dipole, and the Pacific Decadal Oscillation. It is, therefore, possible that the GCRs may enhance the variability of the decadal component in such periodic behaviors, but with one to a few years of time lag. Further investigations on the proposed impacts of GCRs on cloud activity and atmospheric circulation may shed light on the variability or the phase changes of the decadal-scale components in such unresolved oceanic variations.
Data availability statement
Publicly available datasets were analyzed in this study. This data can be found here: The OLR data are available at https://www.ncei.noaa.gov/products/climate-data-records/outgoing-longwave-radiation-daily. ISCCP-HGM series is available at https://www.ncei.noaa.gov/products/international-satellite-cloud-climatology. The Oulu and Climax neutron data are available at http://cr0.izmiran.ru/clmx/main.htm and http://cr0.izmiran.ru/oulu/main.htm, respectively. The NOAA OI SST V2 data are provided by NOAA/OAR/ESRL PSL on their website: https://psl.noaa.gov/data/gridded/data.noaa.oisst.v2.html. Japanese 55-year Reanalysis data are available at https://rda.ucar.edu/datasets/ds628.1/. The ESRL/NOAA Niño 4 index is available at https://psl.noaa.gov/data/correlation/nina4.data. The NCEI Pacific Decadal Oscillation index is available at https://www.ncei.noaa.gov/access/monitoring/pdo/. CMAP Precipitation data are provided by NOAA/OAR/ESRL PSL on their website: https://psl.noaa.gov/data/gridded/data.cmap.html. The NOAA Climate Data Record of TSI are available at https://www.ncei.noaa.gov/access/metadata/landing-page/bin/iso?id=gov.noaa.ncdc:C00828. The data of NOAA adjusted solar radio flux at 10.7 cm is available at https://lasp.colorado.edu/lisird/data/noaa_radio_flux/. The Penticton radio flux data are available at https://lasp.colorado.edu/lisird/data/penticton_radio_flux/.
Author contributions
HM designed the study with input from KK and HM performed data analyses and wrote the manuscript with input from all of the other authors. All authors contributed to the article and approved the submitted version.
Funding
This work was supported by JSPS KAKENHI grand number 15H05816 and the research scholarship provided to Musashino Art University by Mr. Haruo Suzuki.
Acknowledgments
We thank S. Masuda, H. Yamada, Y. Yamashiki, K. Munakata, for discussions. HM thanks Okinawa Institute of Science and Technology for hosting her sabbatical visit.
Conflict of interest
The authors declare that the research was conducted in the absence of any commercial or financial relationships that could be construed as a potential conflict of interest.
Publisher’s note
All claims expressed in this article are solely those of the authors and do not necessarily represent those of their affiliated organizations, or those of the publisher, the editors and the reviewers. Any product that may be evaluated in this article, or claim that may be made by its manufacturer, is not guaranteed or endorsed by the publisher.
Supplementary material
The Supplementary Material for this article can be found online at: https://www.frontiersin.org/articles/10.3389/feart.2023.1157753/full#supplementary-material
References
Almeida, J., Schobesberger, S., Kürten, A., Ortega, I. K., Kupiainen-Määttä, O., Praplan, A. P., et al. (2013). Molecular understanding of sulphuric acid–amine particle nucleation in the atmosphere. Nature 502, 359–363. doi:10.1038/nature12663
Ashok, K., Behera, S. K., Rao, S. A., Weng, H., and Yamagata, T. (2007). El Niño modoki and its possible teleconnection. J. Geophys. Res. 12, C11007. doi:10.1029/2006jc003798
Bloemendaal, N., Haigh, I. D., de Moel, H., Muis, S., Haarsma, R. J., and Aerts, J. C. J. H. (2020). Generation of a global synthetic tropical cyclone hazard dataset using STORM. Sci. Data 7, 40. doi:10.1038/s41597-020-0381-2
Bond, G. C., Kromer, B., Beer, J., Muscheler, R., Evans, M. N., Showers, W., et al. (2001). Persistent solar influence on North Atlantic climate during the holocene. Science 294, 2130–2136. doi:10.1126/science.1065680
Carslaw, K. S., Harrison, R. G., and Kirkby, J. (2002). Cosmic rays, clouds, and climate. Science 298, 1732–1737. doi:10.1126/science.1076964
Coddington, O., Lean, J. L., Lindholm, D., Pilewskie, P., and Snow, M.NOAA CDR Program (2015). NOAA climate data record (CDR) of total solar irradiance (TSI), NRLTSI version 2, N.O.A.A. Natl. Centers Environ. Inf. doi:10.7289/V55B00C1
De Mendonça, R. R. S., Raulin, J.-P., Echer, E., Makhmutov, V. S., and Fernandez, G. (2013). Analysis of atmospheric pressure and temperature effects on cosmic ray measurements. J. Geophys. Res. Space Phys. 118, 1403–1409. doi:10.1029/2012JA018026
Dickinson, R. E. (1975). Solar variability and the lower atmosphere. Bull. Am. Meteorological Soc. 56, 1240–1248. doi:10.1175/1520-0477(1975)056<1240:svatla>2.0.co;2
Dima, M., and Voiculescu, M. (2016). Global patterns of solar influence on high cloud cover. Clim. Dyn. 47, 667–678. doi:10.1007/s00382-015-2862-0
Domingo, V., Ermolli, I., Fox, P., Fröhlich, C., Haberreiter, M., Krivova, N., et al. (2009). Solar surface magnetism and irradiance on time scales from days to the 11-year cycle. Space Sci. Rev. 145, 337–380. doi:10.1007/s11214-009-9562-1
Dunne, E. M., Gordon, H., Kürten, A., Almeida, J., Duplissy, J., Williamson, C., et al. (2016). Global atmospheric particle formation from CERN CLOUD measurements. Science 354, 1119–1124. doi:10.1126/science.aaf2649
Ebita, A., Kobayashi, S., Ota, Y., Moriya, M., Kumabe, R., Onogi, K., et al. (2011). The Japanese 55-year Reanalysis “JRA-55”: An interim report. Sola 7, 149–152. doi:10.2151/sola.2011-038
Ermakov, V. I., Bazilevskaya, G. A., Pokrevsky, P. E., and Stozhkov, Y. I. (1997). Ion balance equation in the atmosphere. J. Geophys. Res. Atmos. 102, 23413–23419. doi:10.1029/97jd01388
Evan, A. T., Heidinger, A. K., and Vimont, D. J. (2007). Arguments against a physical long-term trend in global ISCCP cloud amounts. Geophys Res. Lett. 34, L04701. doi:10.1029/2006gl028083
Forbush, S. E. (1938). On cosmic-ray effects associated with magnetic storms. J. Geophys. Res. 43, 203–218. doi:10.1029/TE043i003p00203
Gautam, R., Hsu, N. C., and Lau, K.-M. (2010). Premonsoon aerosol characterization and radiative effects over the Indo-Gangetic Plains: Implications for regional climate warming. J. Geophys. Res. 115, D17208. doi:10.1029/2010JD013819
Gleisner, H., and Thejll, P. (2003). Patterns of tropospheric response to solar variability. Geophys. Res. Lett. 30, 1711. doi:10.1029/2003GL017129
Grabowski, W. W., and Morrison, H. (2020). Do ultrafine cloud condensation nuclei invigorate deep convection? J. Atmos. Sci. 77, 2567–2583. doi:10.1175/jas-d-20-0012.1
Gray, L. J., Beer, J., Geller, M., Haigh, J. D., Lockwood, M., Matthes, K., et al. (2010). Solar influences on climate. Rev. Geophys. 48, RG4001. doi:10.1029/2009RG000282
Gray, L. J., Woollings, T. J., Andrews, M., and Knight, J. (2016). Eleven-year solar cycle signal in the NAO and Atlantic/European blocking. Q. J. R. Meteorological Soc. 142, 1890–1903. doi:10.1002/qj.2782
Huffman, G. J., Adler, R. F., Arkin, P., Chang, A., Ferraro, R., Gruber, A., et al. (1997). The global precipitation Climatology Project (GPCP) combined precipitation dataset. Bull. Amer Meteor Soc. 78, 5–20. doi:10.1175/1520-0477(1997)078<0005:tgpcpg>2.0.co;2
Jokipii, J. R., and Thomas, B. (1981). Effects of drift on the transport of cosmic rays. IV. Modulation by a wavy interplanetary current sheet. Astrophysical J. 243, 1115–1122. doi:10.1086/158675
Kazil, J., Lovejoy, E. R., Barth, M. C., and O’Brien, K. (2006). Aerosol nucleation over oceans and the role of galactic cosmic rays. Atmos. Chem. Phys. 6, 4905–4924. doi:10.5194/acp-6-4905-2006
Kirkby, J. (2007). Cosmic rays and climate. Surv. Geophys. 28, 333–375. doi:10.1007/s10712-008-9030-6
Kirkby, J., Curtius, J., Almeida, J., Dunne, E., Duplissy, J., Ehrhart, S., et al. (2011). Role of sulphuric acid, ammonia and galactic cosmic rays in atmospheric aerosol nucleation. Nature 476, 429–433. doi:10.1038/nature10343
Kobayashi, S., Ota, Y., Harada, Y., Ebita, A., Moriya, M., Onoda, H., et al. (2015). The JRA-55 Reanalysis: General specifications and basic characteristics. J. Meteorological Sciety Jpn. 93, 5–48. doi:10.2151/jmsj.2015-001
Kodera, K., and Kuroda, Y. (2002). Dynamical response to the solar cycle. J. Geophys. Res. 107, 4749. doi:10.1029/2002jd002224
Kodera, K. (2002). Solar cycle modulation of the North atlantic oscillation: Implication in the spatial structure of the NAO. Geophys. Res. Lett. 29, 59-1–59-4. doi:10.1029/2001GL014557
Koffi, B., Schulz, M., Bréon, F. M., Dentener, F., Steensen, B. M., Griesfeller, J., et al. (2016). Evaluation of the aerosol vertical distribution in global aerosol models through comparison against CALIOP measurements: AeroCom phase II results. J. Geophys. Res. Atmos. 121, 7254–7283. doi:10.1002/2015jd024639
Koldobskiy, S. A., Kähkönen, R., Hofer, B., Krivova, N. A., Kovaltsov, G. A., and Usoskin, I. G. (2022). Time lag between cosmic-ray and solar variability: Sunspot numbers and open solar magnetic flux. Sol. Phys. 297, 38. doi:10.1007/s11207-022-01970-1
Koren, I., Remer, L. A., Altaratz, O., Martins, J. V., and Davidi, A. (2010). Aerosol-induced changes of convective cloud anvils produce strong climate warming. Atoms. Chem. Phys. 10, 5001–5010. doi:10.5194/acp-10-5001-2010
Kuroda, Y., Kodera, K., Yoshida, K., Yukimoto, S., and Gray, L. (2022). Influence of the solar cycle on the North Atlantic oscillation. J. Geophys. Res. Atmos. 127, e2021. doi:10.1029/2021jd035519
Land, P. E., Shutler, J. D., Bell, T. G., and Yang, M. (2014). Exploiting satellite Earth observation to quantify current global oceanic DMS flux and its future climate sensitivity. J. Geophys. Res. Oceans 119, 7725–7740. doi:10.1002/2014JC010104
Lee, H. T.NOAA CDR Program (2001). NOAA climate data record (CDR) of daily outgoing Longwave radiation (OLR), version 1.2. NOAA National Climatic Data Center. (Date of access: 15/01/2022). doi:10.7289/V5SJ1HH2
Mantua, M. K., Hare, S. R., Zhang, Y., Wallace, J. M., and Francis, R. C. (1997). A Pacific interdecadal climate oscillation with impacts on salmon production. Bull. Am. Meteorological Soc. 78, 1069–1079. doi:10.1175/1520-0477(1997)078<1069:apicow>2.0.co;2
Mantua, N. J. (1999). “The pacific decadal oscillation and climate forecasting for north America,” in Climate risk solutions. Editor M. Golnaraghi (Seattle: University of Washington), 10–13.
Marsh, N., and Svensmark, H. (2003). Galactic cosmic ray and el Niño–southern oscillation trends in international satellite cloud Climatology Project D2 low-cloud properties. J. Geophys. Res. Atmos. 108, 2001JD001264. doi:10.1029/2001JD001264
Matthes, K., Kuroda, Y., Kodera, K., and Langematz, U. (2006). Transfer of the solar signal from the stratosphere to the troposphere: Northern winter. J. Geophys. Res. 111, D06108. doi:10.1029/2005jd006283
Meehl, G. A., Arblaster, J. M., Branstator, G., and van Loon, H. (2008). A coupled air–sea response mechanism to solar forcing in the Pacific region. J. Clim. 21, 2883–2897. doi:10.1175/2007jcli1776.1
Misios, S., Gray, L. J., Knudsen, M. F., Karoff, C., Schmidt, H., and Haigh, J. D. (2019). Slowdown of the walker circulation at solar cycle maximum. Proc. Natl. Acad. Sci. U. S. A. 116, 7186–7191. doi:10.1073/pnas.1815060116
Miyahara, H., Yokoyama, Y., and Masuda, K. (2008). Possible link between multi-decadal climate cycles and periodic reversals of solar magnetic field polarity. Earth Planet. Sci. Lett. 272, 290–295. doi:10.1016/j.epsl.2008.04.050
Myssowsky, L., and Tuwim, L. (1926). Unregelmassige intensitätsschwankungen der Hohenstrahlung in geringer seehohe. Zeitschrift für Physik A – Hadrons Nucl. 39, 146–150. doi:10.1007/bf01321981
Neff, U., Burns, S. J., Mangini, A., Mudelsee, M., Fleitmann, D., and Matter, A. (2001). Strong coherence between solar variability and the monsoon in Oman between 9 and 6 kyr ago. Nature 411, 290–293. doi:10.1038/35077048
Obrochta, S. P., Miyahara, H., Yokoyama, Y., and Crowley, T. J. (2012). A re-examination of evidence for the North Atlantic “1500-year cycle” at Site 609. Quat. Sci. Rev. 55, 23–33. doi:10.1016/j.quascirev.2012.08.008
Reynolds, R. W., Rayner, N. A., Smith, T. M., Stokes, D. C., and Wang, W. (2002). An improved in situ and satellite SST analysis for climate. J. Clim. 15, 1609–1625. doi:10.1175/1520-0442(2002)015<1609:aiisas>2.0.co;2
Rosenfeld, D., Lohmann, U., Raga, G. B., O'Dowd, C. D., Kulmala, M., Fuzzi, S., et al. (2008). Flood or drought: How do aerosols affect precipitation? Science 321, 1309–1313. doi:10.1126/science.1160606
Rossow, W. B., Walker, A., Golea, V., Knapp, K. R., and Young, A. (2016). NOAA's climate data record Program (2016). International satellite cloud Climatology Project climate data record. H-Series HGM NOAA Natl. Centers Environ. Inf. doi:10.7289/V5QZ281S
Scott, C. J., Harrison, R. G., Owens, M. J., Lockwood, M., and Barnard, L. (2014). Evidence for solar wind modulation of lightning. Environ. Res. Lett. 9, 055004. doi:10.1088/1748-9326/9/5/055004
Svensmark, H., Enghoff, M. B., and Pedersen, J. O. P. (2013). Response of cloud condensation nuclei (>50 nm) to changes in ion-nucleation. Phys. Lett. A 377, 2343–2347. doi:10.1016/j.physleta.2013.07.004
Svensmark, H., and Friis-Christensen, E. (1997). Variation of cosmic ray flux and global cloud coverage—a missing link in solar-climate relationships. J. Atmos. Solar-Terrestrial Phys. 59, 1225–1232. doi:10.1016/S1364-6826(97)00001-1
Tinsley, B. A., and Deen, G. W. (1991). Apparent tropospheric response to MeV-GeV particle flux variations: A connection via electrofreezing of supercooled water in high-level clouds? J. Geophys. Res. 96, 22283–22296. doi:10.1029/91JD02473
Tinsley, B. A. (2000). Influence of solar wind on the global electric circuit, and inferred effects on cloud microphysics, temperature, and dynamics in the troposphere. Space Sci. Rev. 94, 231–258. doi:10.1023/a:1026775408875
Tinsley, B. A. (2022). Uncertainties in evaluating global electric circuit interactions with atmospheric clouds and aerosols, and consequences for radiation and dynamics. J. Geophys. Res. Atmos. 127, e2021JD035954. doi:10.1029/2021jd035954
Trenberth, K. E., and Stepaniak, D. P. (2001). Indices of el Niño evolution. J. Clim. 14, 1697–1701. doi:10.1175/1520-0442(2001)014<1697:lioeno>2.0.co;2
Twohy, C. H., Clement, C. F., Gandrud, B. W., Weinheimer, A. J., Campos, T. L., Baumgardner, D., et al. (2002). Deep convection as a source of new particles in the midlatitude upper troposphere. J. Geophys. Res. Atmos. 107, AAC 6-1–AAC 6-10. AAC 6–AAC 1. doi:10.1029/2001JD000323
Usoskin, I. G., Gladysheva, O. G., and Kovaltsov, G. A. (2004). Cosmic ray-induced ionization in the atmosphere: Spatial and temporal changes. J. Atmos. Solar-Terrestrial Phys. 66, 1791–1796. doi:10.1016/j.jastp.2004.07.037
Usoskin, I. G., Mursula, K., Kananen, H., and Kovaltsov, G. A. (2001). Dependence of cosmic rays on solar activity for odd and even solar cycles. Adv. Space Res. 27, 571–576. doi:10.1016/s0273-1177(01)00084-9
van Loon, H., Meehl, G. A., and Arblaster, J. M. (2004). A decadal solar effect in the tropics in July–August. J. Atmos. Solar-Terrestrial Phys. 66, 1767–1778. doi:10.1016/j.jastp.2004.06.003
Vandenbussche, S., Callewaert, S., Schepanski, K., and De Mazière, M. (2020). North African mineral dust sources: New insights from a combined analysis based on 3D dust aerosol distributions, surface winds and ancillary soil parameters. Atmos. Chem. Phys. 20, 15127–15146. doi:10.5194/acp-20-15127-2020
Voiculescu, M., Usoskin, I., and Condurache-Bota, S. (2013). Clouds blown by the solar wind. Environ. Res. Lett. 8, 045032. doi:10.1088/1748-9326/8/4/045032
Voiculescu, M., Usoskin, I. G., and Mursula, K. (2006). Different response of clouds to solar input. Geophys. Res. Lett. 33, L21802. doi:10.1029/2006gl027820
Wang, Y., Cheng, H., Edwards, R. L., He, Y., Kong, X., An, Z., et al. (2005). The holocene asian monsoon: Links to solar changes and North Atlantic climate. Science 308, 854–857. doi:10.1126/science.1106296
White, W. B. (2006). Response of tropical global ocean temperature to the Sun’s quasi-decadal UV radiative forcing of the stratosphere. J. Geophys. Res. 111, C09020. doi:10.1029/2004jc002552
Williamson, C. J., Kupc, A., Axisa, D., Bilsback, K. R., Bui, T. P., et al. (2019). A large source of cloud condensation nuclei from new particle formation in the tropics. Nature 574, 399–403. doi:10.1038/s41586-019-1638-9
Yamaguchi, Y. T., Yokoyama, Y., Miyahara, H., Sho, K., and Nakatsuka, T. (2010). Synchronized Northern Hemisphere climate change and solar magnetic cycles during the Maunder Minimum. Proc. Natl. Acad. Sci. U. S. A. 107, 20697–20702. doi:10.1073/pnas.1000113107
Yang, G.-Y., and Slingo, J. (2001). The diurnal cycle in the tropics. Mon. Weather Rev. 129, 784–801. doi:10.1175/1520-0493(2001)129<0784:tdcitt>2.0.co;2
Yu, F. (2002). Altitude variations of cosmic ray induced production of aerosols: Implications for global cloudiness and climate. J. Geophys. Res. 107, 1118. doi:10.1029/2001ja000248
Yu, F., and Turco, R. P. (2001). From molecular clusters to nanoparticles: Role of ambient ionization in tropospheric aerosol formation. J. Geophys. Res. Atmos. 106, 4797–4814. doi:10.1029/2000jd900539
Yu, F., Wang, Z., Luo, G., and Turco, R. (2008). Ion-mediated nucleation as an important global source of tropospheric aerosols. Atmos. Chem. Phys. 8, 2537–2554. doi:10.5194/acp-8-2537-2008
Keywords: sun-climate connection, cosmic rays, clouds, atmospheric circulation, sea surface temperatures
Citation: Miyahara H, Kusano K, Kataoka R, Shima S-i and Touber E (2023) Response of high-altitude clouds to the galactic cosmic ray cycles in tropical regions. Front. Earth Sci. 11:1157753. doi: 10.3389/feart.2023.1157753
Received: 03 February 2023; Accepted: 06 July 2023;
Published: 19 July 2023.
Edited by:
Siming Liu, Southwest Jiaotong University, ChinaReviewed by:
Sergey Alexander Pulinets, Space Research Institute (RAS), RussiaMirela Voiculescu, Dunarea de Jos University, Romania
Copyright © 2023 Miyahara, Kusano, Kataoka, Shima and Touber. This is an open-access article distributed under the terms of the Creative Commons Attribution License (CC BY). The use, distribution or reproduction in other forums is permitted, provided the original author(s) and the copyright owner(s) are credited and that the original publication in this journal is cited, in accordance with accepted academic practice. No use, distribution or reproduction is permitted which does not comply with these terms.
*Correspondence: Hiroko Miyahara, bWl5YWhhcmFAbXVzYWJpLmFjLmpw