 Yao Liang1,2
 Tongtong Xie3,4
 Zhanwu Lu1,2*
 Qiusheng Li1,2Xinyan Zhang1,2
 Guangwen Wang1,2Guan Wang1,2Si Chen1,2
 Chang Chang1,2
- 1Key Laboratory of Deep-Earth Dynamics of Ministry of Natural Resources, Institute of Geology, Chinese Academy of Geological Sciences, Beijing, China
- 2Institute of Geology, Chinese Academy of Geological Sciences, Beijing, China
- 3State Key Laboratory of Lithospheric Evolution, Institute of Geology and Geophysics, Chinese Academy of Sciences, Beijing, China
- 4University of Chinese Academy of Sciences, Beijing, China
The middle segment of the Xiaojiang fault zone consists of strike-slip faults with frequent strong and medium–strong earthquakes under the joint influence of NE-trending faults and deep structural characteristics. The distribution characteristics of the deep subfaults of each branch need to be revealed. Two short-period dense array survey lines are deployed in the area. Shear wave velocity structures are obtained using ambient noise tomography. The results reveal that the faults in each branch dip nearly eastward, with strike-slip characteristics in the north‒south direction. Strong velocity lateral variation infer imply that the deformation characteristics of the upper crust may be brittle. NE faults are observed, which are characterized by typical compression. The high-velocity zone in the Songming Basin may be related to the deeper upwelling of high-velocity strata in the upper crustal flow.
1 Introduction
The Xiaojiang fault zone (XJFZ), located at the contact between the South China block and the Sichuan Yunnan block, is the southeastern boundary of the Tibetan Plateau (Figure 1B) and an important part of the strong sinistral strike-slip activity of the Tibetan Plateau (Molnar and Tapponnier, 1975; Tapponnier and Molnar, 1977; Tapponnier et al., 1982). Since the late Quaternary, the structural deformation and seismicity of the XJFZ have been very active (Deng et al., 2003; Zhang, 2013; Guo et al., 2021). Therefore, the XJFZ is an important part of the north‒south seismic belt in China (Wang, 1998; Wang and Wang, 2005).
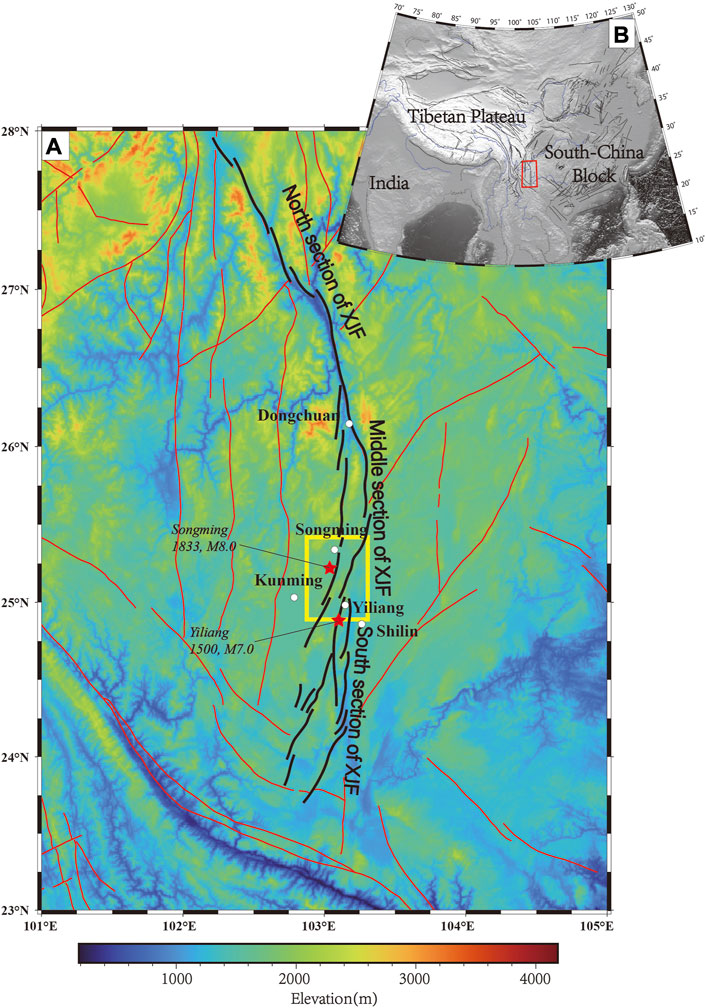
FIGURE 1. Topographic map of the location of the XJFZ (A) and regional tectonic setting (B) The black line denotes the main fault of the XJFZ. Red lines denote other faults. The fault dataset was obtained from Deng (2007). Historical earthquakes are denoted by red stars. The yellow box is the study area.
The crust in the southeast margin of the Tibetan Plateau rotates clockwise around the eastern Himalayan tectonic knot, which results in a strong stress concentration area along the XJFZ. Based on GPS data (Li et al., 2021b), tectonic stress field inversion (Pei et al., 2022; Zhou et al., 2022) and numerical simulation (Zhu et al., 2015; Kong et al., 2022), the results have shown that the tectonic stress field around the XJFZ is generally NW‒SE compressive stress. Under this tectonic background, the XJFZ and its surrounding areas has mainly a left-lateral strike-slip-type focal mechanism, and strong stress concentration leads to high seismic risk. Seismic anisotropy research shows that the fast wave direction is nearly perpendicular to the fault strike around the XJFZ (Gao et al., 2020), which may suggest that it is strongly affected by the east‒west direction of the South China block.
Many geophysical studies have been carried out in the XJFZ to describe its large scale and deep structural characteristics. The deep geophysical structures show that there are low-velocity (LV) (Yao et al., 2008; Chen et al., 2014; Zheng et al., 2016; Fu et al., 2017; Qiao et al., 2018), low-resistivity (Bai et al., 2010; Li et al., 2019; Yu N. et al., 2022) and high-attenuation (Zhao et al., 2013) anomalies in the middle and lower crust of the XJFZ. At present, researchers speculate that these anomalies are caused by two weak-material channels in the crust with a low velocity, high conductivity and high melting ratio. One branch in the east is distributed approximately along the Xianshuihe–XJFZ. High-resolution imaging results show that low-velocity (Zheng et al., 2016) and low-resistivity (Yu N. et al., 2022) anomalies are more obvious in the middle section of the XJFZ.
The middle section of the XJFZ, located in the area from Dongchuan to Fuxian Lake, is composed of the eastern and western branches. The structural characteristics are extremely complex. Current geological research is mostly based on GPS measurements, surface fault characteristics, etc., Fine underground structure detection must still be carried out to describe the fault and basin distributions. Short-period dense array technology is an important method for detecting underground structures due to its high observation density and convenient acquisition (Lin et al., 2013; Mordret et al., 2019). Ambient noise imaging can obtain the underground fine shear wave (S-wave) velocity structure by observing the environmental noise for ∼30 days. It has advantages in revealing the deep morphological structural information and describing the strikes of deep concealed faults (Schmandt and Clayton, 2013; Ben-Zion et al., 2015; Mordret et al., 2019). Ambient noise imaging also has good applications in deep mineral resource exploration (Du et al., 2020; Xie et al., 2021; Zheng et al., 2022).
Several subfaults and pull-apart basins are located in the middle section of the XJFZ. The seismogenic structures are all related to subfaults. Most of the current research focuses on large-scale deep structures. A better understanding of the deep structural characteristics of the faults and basins in the middle section of the XJFZ is needed. In this paper, using short-period dense array data, we obtained a high-precision S-wave velocity structure. The results reveal the deep characteristics of the subfaults in the middle section of the XJFZ and the basin distribution. We then discussed the relationship between the shallow structural characteristics and the deep geophysical anomalies.
2 Geological setting
The Xiaojiang faults have multiple stages of tectonic movement. Since the middle Pleistocene, the faults have been dominated by left-lateral strike-slip motion (Wang, 1998; Tang et al., 2006). The extension of the XJFZ is more than 400 km from north to south (Figure 1). Based on active tectonic and geomorphic data, the XJFZ is generally divided into three segments from north to south (Shen et al., 2003; Guo et al., 2021). The northern segment is between Qiaojia and Dongchuan, with only one main fault. The middle section is located in the area from Dongchuan to Fuxian Lake and consists of two branch faults in the east and west. The southern segment is from southern Fuxian Lake to northern Jianshui Basin and is composed of multiple branch faults. Among the segments, the middle section of the XJFZ is the key zone where the XJFZ transitions from a near north‒south strike to a near southwest strike. The two branches of the XJFZ are divided into many branches in the southern Yangzong Basin and Yiliang Basin (Li et al., 2018; Yu H. et al., 2022), which leads to a relatively complex geometry and structural characteristics of the faults (Li et al., 2020).
The middle segment of the XJFZ refers to the section from the Daduo to Yangzonghai Basins and the southern Yiliang Basin, including the eastern and western branch faults and the blocks between them. This section is a typical zone that contains rapid changes in the XJFZ (Figure 1A) (Yu H. et al., 2022). Because of its geographical location, the middle segment of the XJFZ is a strike-slip fault zone with frequent strong and medium-strong earthquakes under the joint influence of NE-trending faults and deep structural characteristics (Shen and Yu, 1997). Historically, the Songming M8 earthquake occurred in 1833 (Yu et al., 1996; Yu H. et al., 2022), the Yiliang M7 earthquake occurred in 1,500 (Yu and Shen, 1995; Cao and Shen, 1996; Chang et al., 2021) and other shear-type earthquakes have occurred (Pei et al., 2022). These earthquakes released energy accounting for 96% of the energy in the whole XJFZ. The seismogenic structure that generated the Songming M8 earthquake is speculated to be an internal tension shear fault in the Songming Basin (Teng, 1978; Yu N. et al., 2022), and the seismogenic structure that generated the Yiliang earthquake is supposedly the eastern branch of the XJFZ on the western edge of the Yiliang Basin (Chang et al., 2021).
In this study, we focus mainly on the Songming–Yiliang area (Figure 2), where the main structure is formed by the parallel arrangement of eastern and western branch faults. The western branch faults include the Luliangshan fault (F1), which extends across the Songming Basin, Yanglin–Qiansuo fault (F2) and Fugang–Haifenyuan fault (F3). The eastern branch faults consist of the Yiliang Basin western edge fault (also called the Xiaoxinjie–Yiliang fault, F4), Yiliang–Xujiadu fault (F5), Tangzi–Xiaoxinjie fault (F6), Mopanshan–Fenglecun fault (F7) and Majie–Nanyangjie fault (F8). The Wanshoushan fault (F9), Kuanglanghe–Yaolingshan fault (F10), and Dachunhe–Yiduoyun (F11) fault are NE-trending normal faults in the study area.
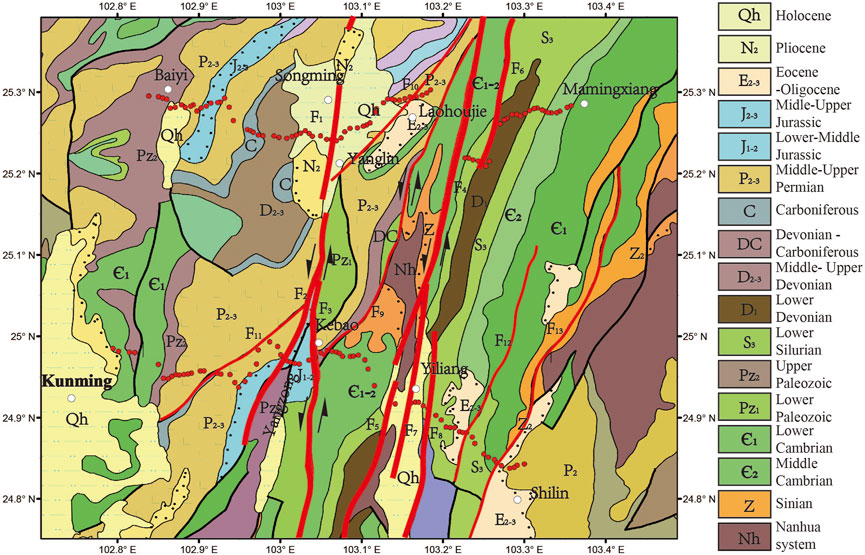
FIGURE 2. Structural geological map of the middle section of the XJFZ (Zuo et al., 2018) and the location of the survey lines. The thick red line represents the faults of the XJFZ, and the thin red line represents other subfaults in the area. Black dot represents Stratigraphic unconformity. The faults are modified from previous researchers (Shen and Yu, 1997; Shen et al., 2003; Deng, 2007; Du et al., 2009; Zuo et al., 2018; Chang et al., 2021). Arrows indicate the strike-slip direction of the faults. The red dots represent the measuring point positions. F1: Luliangshan fault. F2: Yanglin–Qiansuo fault. F3: Fugang–Haifenyuan fault. F4: Xiaoxinjie–Yiliang fault. F5: Yiliang–Xujiadu fault. F6: Tangzi–Xiaoxinjie fault. F7: Mopanshan–Fenglecun fault. F8: Majie–Nanyangjie fault. F9: Wanshoushan fault. F10: Kuanglanghe–Yaolingshan fault. F11: Dachunhe–Yiduoyun fault. F12 and F13 are annotated structural faults.
Along the western branch faults in the area (Figure 2), the Songming Basin and Yangzong Basin, which are pull-apart basins controlled by the subfaults, are present. The eastern branch faults are separated by the Yiliang Basin, which is also deformed by the subfaults. The areas between the eastern and western branches are the Kebao Basin and Laohoujie Basin. The main boundary of the Laohoujie Basin is a non-faulted basin. The Kebao Basin is a half-graben faulted basin that developed in the early Pleistocene and is controlled by the XJFZ and Wanshoushan fault (F9).
The structural area contains two large-scale sinistral stepped areas of the eastern and western branch faults: the Songming–Xiaoxinjie and Yangzong–Yiliang areas. The two areas are the main discontinuous areas of the entire XJFZ, which easily form a structural area locked by ruptures (Zhou et al., 2022) with high local stress levels and earthquake risks. The epicenter of the 1,833 Songming M8.0 earthquake is speculated to be in the Songming Basin (Teng, 1978; Shen et al., 2003). The epicenter of the 1,500 Yiliang M7.0 earthquake is located at the intersection of the NNE-trending Yiliang Xujiadu shear fault and the nearly north-south-trending tensile shear fault in the basin on the western side of the Yiliang Basin (Yu and Shen, 1995; Cao and Shen, 1996). A risk of major earthquakes still exists in the future (Qian and Qin, 2008).
The outcropping strata in the study area are the Cenozoic Nanhua system to the Quaternary system. The strata are divided into eastern and western regions. Generally, the Sinian to Devonian strata in the eastern branch are relatively complete, mainly including the Sinian, Cambrian, Ordovician, Devonian and other strata. The strata outcrop near faults or stratigraphic sedimentary boundaries, which are distributed in a belt shape and are associated with the structure. Carboniferous and Jurassic strata are missing. Quaternary cover is mainly distributed in the Yiliang Basin, with an overall thickness of 358 m. In addition, some strata in South China crop out in the middle of the study area. The outcropping strata of the western branch fault are relatively complex, mainly including the middle and lower Cambrian system, a detected lower system, the Devonian system, the Carboniferous system, the Jurassic system and other strata. The Quaternary deposits are mainly distributed in the Songming Basin, with a total thickness of approximately 800 m.
3 Data and methods
3.1 Data acquisition
In 2020, two short-period dense array survey lines were deployed (Figure 2) in the middle of the XJFZ using Z-land3C node seismometers with a dominant frequency of 5 Hz. The length of the survey line is approximately 50 km, and the interval between stations is approximately 500 m. 72 seismometers are arranged along the southern line (Line 1), and 83 are arranged along the northern line (Line 2). The sampling interval is 2 ms, and the observation period is 29 days. The survey lines cross the eastern and western branches of the middle section of the XJFZ. Line 1 mainly covers the eastern Kunming Basin, Yangzong Basin, Kebao Basin, Yiliang Basin, and western Shilin. Line 2 starts from Baiyi in the west, passes Songming, and reaches Mamingxiang in the east.
The vertical component data of the Z-land3c node seismometer are used for ambient noise tomography (Shapiro et al., 2005) to obtain the S-wave velocity structure under lines. In this paper, the empirical Green’s function (Yao et al., 2006; Yao et al., 2008) is extracted by using the cross-correlation method, and then the Rayleigh surface wave group velocity dispersion curve is picked. Based on the direct surface wave inversion method (Fang et al., 2015), the shallow surface velocity structure is obtained.
3.2 Data preprocessing
We first converted the FCNT format of the vertical component of the data into the SAC format. During the conversion, the integrity of the continuous data was checked. The continuous signal of one station is divided into hour-long segments. Then, mean value removal, linear trend attenuation and filtering were performed to eliminate the impact of zero drift and long-period trends in the data on subsequent data processing (Bensen et al., 2007). Low-pass filtering was carried out to obtain signals below 5 Hz, and the data were resampled down to a 100 ms sampling interval. We normalized the data in the time domain to reduce the impact of seismic signals. Then, the data were whitened to weaken the influence of some continuous monochromatic sources and balance the strength of signals at various frequencies.
3.3 Cross-correlation function (CCF)
In this paper, the cross-correlation method of ambient noise is used to extract the surface wave empirical Green’s function (EGF) between pairs of stations (Sabra et al., 2005; Campillo et al., 2014). We combine all stations on the same line into pairs and use the corresponding single-hour segment for cross-correlation calculation. As the survey line passes through an urban area with strong city noise, methods based on linear and phase-weighted stacks (PWS) are applied. The PWS method is a non-linear stack method that can effectively remove incoherent noise and enhance coherent signals (Schimmel and Paulssen, 1997). When stacking, every sample of the linear stack will be weighted by the coherency of its instantaneous phases. The stacking value g at time t can be calculated as,
Where N is the number of traces used,
Figure 3 shows that the cross-correlation function of Line 2 recovered well. Benefitting from PWS, the data signal-to-noise ratio (SNR) is effectively improved within the station spacing range of 20–35 km. The signals of the negative half-branch signal are obviously stronger than those of the positive half-branch signal. It is speculated that the noise source is mainly from an area to the east of the survey lines.
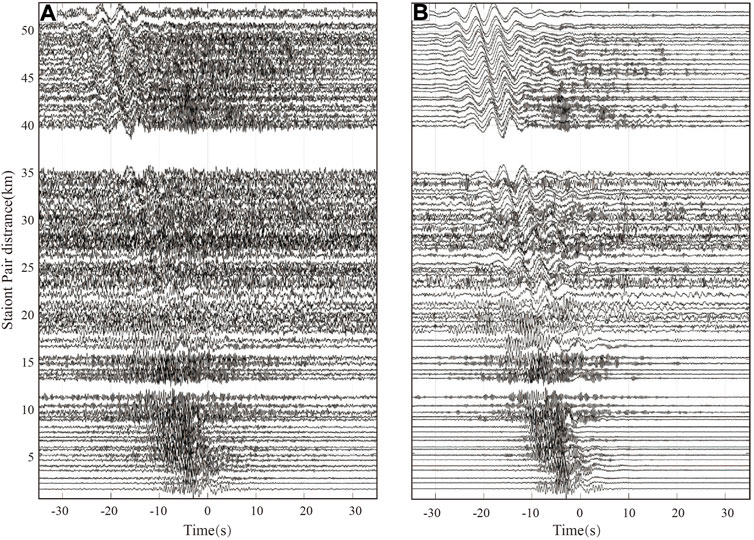
FIGURE 3. CCFs between station 2001 and other stations in Line 2. (A) CCFs calculated using the liner stack. (B) CCFs calculated using PWS.
We then perform bandpass filtering at 1–6 s 6–8s and 9–15 s. The process effectively improves the SNR (Figure 4). The valid signal is basically within the 1–8 s band (Figures 4A, B). Signals can also be observed at 9–15 s (Figure 4C). Considering that Zland seismometers have a corner frequency of 5 HZ, we abandon the signal at 8–15 s for higher data reliability and more stable picking Therefore, 1–8 s bandpass filtering is applied to both Line 1 and Line 2 in this processing (Figure 5).
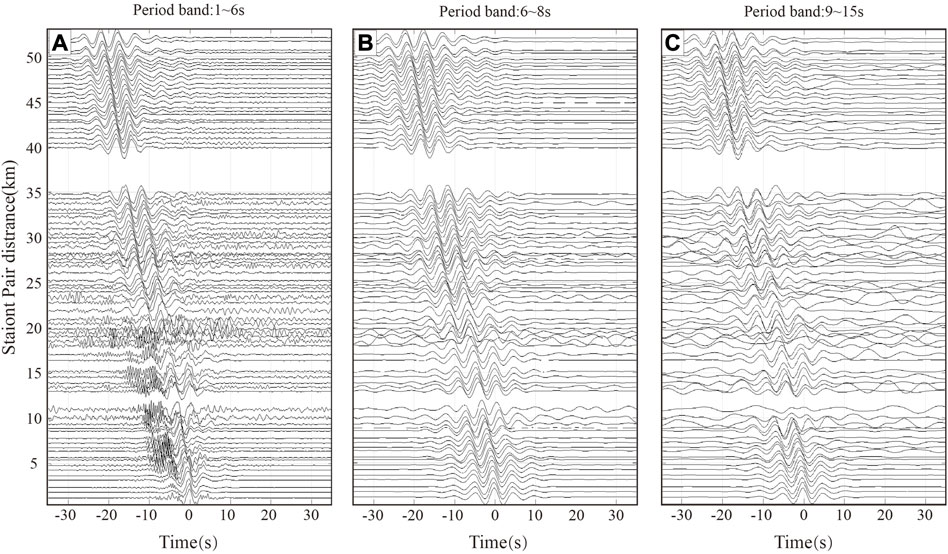
FIGURE 4. CCFs between station 2001 and other stations along Line 2. The original CCFs are bandpass-filtered in three bands with different periods: (A) 1–6 s (B) 6–8 s and (C) 9–15 s.
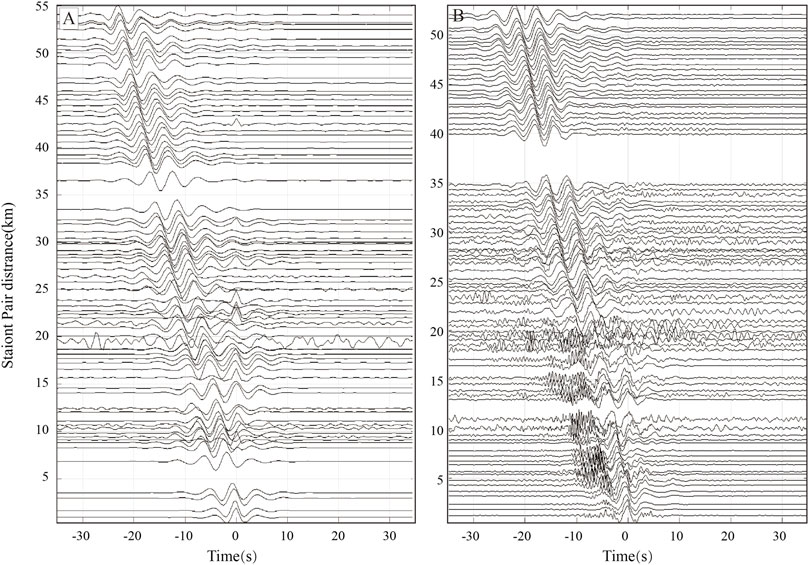
FIGURE 5. Bandpass-filtered CCFs in bands with periods of 1–8 s. (A) CCFs between station 1,001 and other stations along Line 1. (B) CCFs between station 2001 and other stations along Line 2.
3.4 Group velocity dispersion curve extraction
The frequency–time analysis method is performed to extract Rayleigh surface wave dispersion signals from the cross-correlation between stations (Figure 6) (Yao et al., 2006; Yao et al., 2008). This method can adjust the parameters of the surface wave velocity range, filtering frequency band, station spacing and wavelength relationship in real time to obtain high-quality dispersion curves. We preliminarily choose the cross-correlation with a SNR greater than 5. Based on the far-field approximation (the distance between stations is greater than twice the wavelength) and SNR (Zeng and Ni, 2011; Yu et al., 2020), we screen the dispersion curve with a distance greater than 10 km. Since the rational velocity gradient in this area is less than 0.3 km/s, unreasonable dispersion curves with a fast change and low SNR are deleted to obtain smooth dispersion curves for geological rationality (Xie et al., 2021). We also eliminate the dispersion curves with large differences from the average value of the dispersion curve. When picked the dispersion curves, we found signals above 8s were difficult to pick with small quantity. So the automatic picking process was performed within the range of 1–8 s periods. Finally, 980 dispersion curves are obtained for Line 1, and 919 are obtained for Line 2 (Figures 7A, B). Due to the low SNR signal in the intervals of 1–2 s and 6–8 s, the 2–6 s period dispersion curve is selected for this processing. The dispersion curve number at every period is shown in Figures 7C, D.
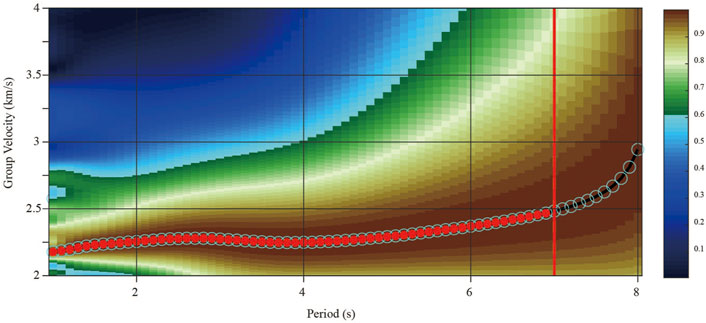
FIGURE 6. Group velocity dispersion extraction using the image transformation technique. The color bar represents the normalized surface wave envelope amplitude. Gray circles represent dispersion points satisfied with the chosen conditions, and solid red points are the final reserved dispersion points.
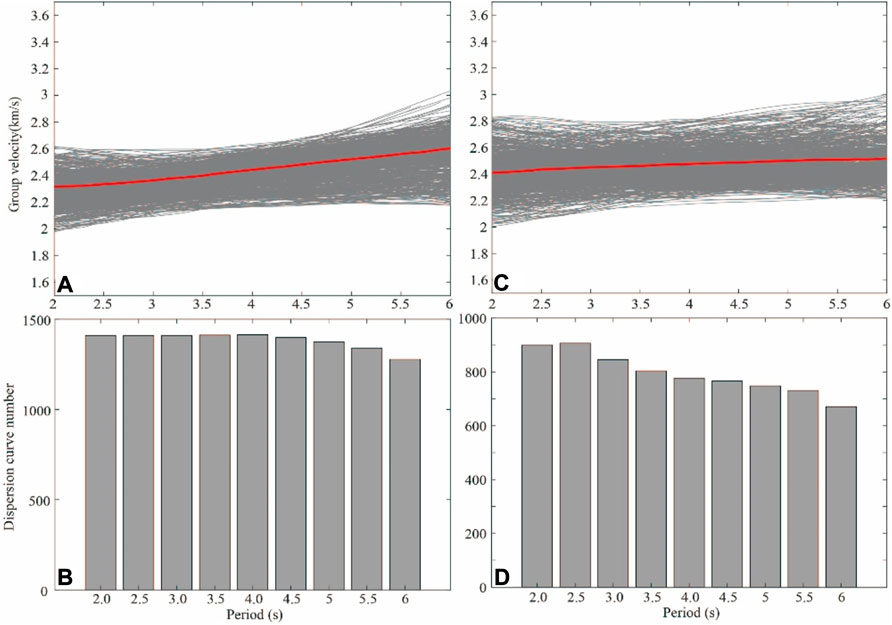
FIGURE 7. Group velocity dispersion extraction results. (A,C) are the group velocity dispersion curves extracted from the EGFs in Line 1 and Line 2, respectively. The red solid line denotes the average velocity dispersion curve of all station pairs. The gray solid lines show randomly selected dispersion curves. (B) and (D) are the number of phase velocity dispersion nodes at each period for Line 1 and Line 2.
3.5 S-wave velocity inversion
In this paper, the direct surface wave tomography method (Fang et al., 2015) based on ray tracing is utilized to obtain the S-wave velocity structures under Line 1 and Line 2. Compared with the traditional inversion method, the direct inversion method of surface waves avoids the intermediate step of phase velocity map or group velocity map inversion, directly uses the finite difference travel time of the eikonal equation to calculate the ray path, and continuously updates its sensitive core matrix and the ray path of different periods. Considering the influence of ray bending in complex media on surface wave tomography, the approach is more suitable for shallow complex areas and accurately obtains the fine velocity structure of a smaller area.
We used 0.006° as the horizontal grid spacing for Line1 and Line2. According to ambient noise tomography result on the southeast edge of the Tibet Plateau (Qiao et al., 2018), the S-wave velocity range from 0 to 10 km is 2.8–3.2 km/s at XJFZ. Considering shallow LV Quaternary coveravge, we adopt a simple initial S-wave velocity model that is 2 km/s at 0 km and increases with depth with a 0.1 km gradient. In the inversion process, to ensure the stability of inversion and avoid boundary effects, the inversion depth is set to 10 km. Minimum and maximum velocity are set as 1.5 km/s and 4 km/s respectively. We tested different weights and take 6 as the best weight. The damp value is 0.1 and sablayers is 3 during this inversion. After 10 iterations, the inversion finally converges (the convergence curve is provided in Supplementary Figuer S1).
4 Results
4.1 Checkerboard tests
The checkerboard test is an effective way to demonstrate the resolution and reliability of inversion results. Because of the linear array deployment in this paper, it is difficult to carry out the standard detection plate test. The array survey line is nearly perpendicular to the structural strike of the XJFZ, and the ray path is less affected by the lateral heterogeneity of the velocity structure. Therefore, the use of surface wave tomography can ensure that the velocity structure below the survey line is effectively constrained. To analyze the horizontal resolution of the linear array in this paper, a strip detection plate (Figures 8A, F) is designed. The strip has a positive north‒south trend that is close to the actual tectonic trend, and the horizontal grid spacing is 0.006°. We generate a real detection plate model by adding 40% of the average velocity to the background velocity model to disturb the positive and negative forms of the structure. The background velocity gradually increases with depth (the gradient is 0.1). The velocity disturbance is generated by a sine function, and all inversion parameters are the same as those of the actual data.
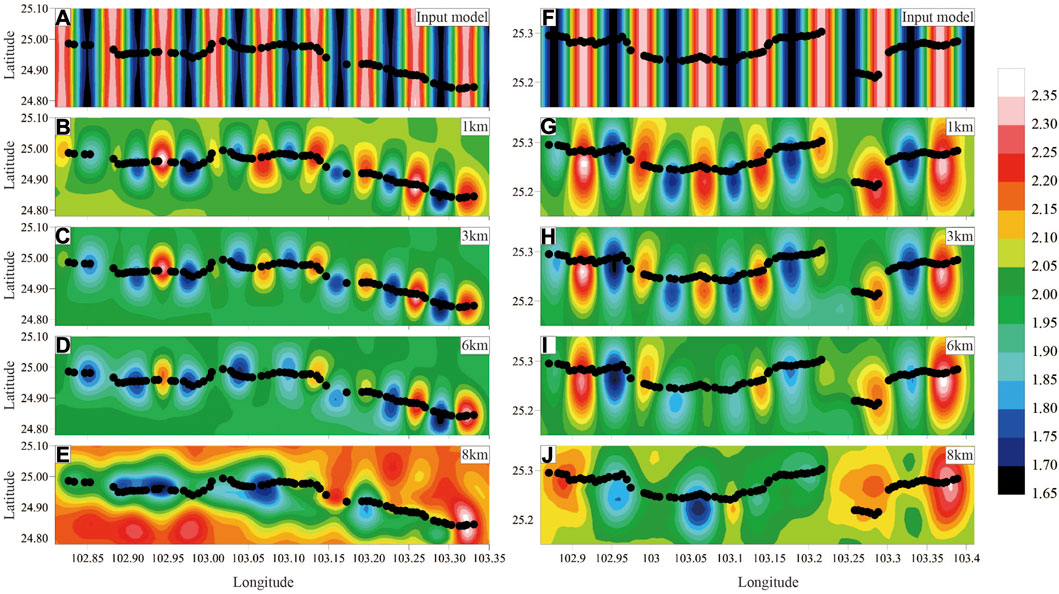
FIGURE 8. Lateral checkerboard resolution tests for Line 1 (A–E) and Line 2 (F–J). (A,F): input checkerboard model, in which the anomaly size is approximately 0.006°. Output models at different depths are as follows: (B,G): 1 km; (C,H): 3 km; (D,I): 6 km; (E,J): 8 km. The small black dot denotes the survey.
Figure 8 b-e and g-j show the recovery results of the checkerboards of Line 1 and Line 2 at depths of 1, 3, 6, and 8 km, respectively. Most of the shallow layers (<=6 km) within the observation range have recovered well. At the edge of the study area and the location of the survey line dislocation (especially between 103.2oE and 103.3oE along Line 2), the recovery results are relatively poor due to the sparse ray coverage. The recovery result of the 8 km depth slice can reflect only the positive and negative trends of velocity, and the form of the specific velocity disturbance cannot be completely recovered. The recovery quality of the checkerboard at each depth shows a trend of decreasing gradually with increasing depth, but the overall recovery is shown by quality data. The shallow area of 6 km is an area of reliable data, indicating that the imaging results are reliable.
4.2 Shear wave velocity
S-wave velocity inversion is carried out for Line 1 and Line 2 to obtain the velocity profile. We intercept the shallow area of 6 km because it is the reliable inversion area and discuss the velocity structure below the profile.
The inversion results (Figures 9, 10) show that the S-wave velocity values in the study area are in the range of 2–3.6 km/s. The velocity distribution corresponds with the elevation. Mountains with large overall elevations have higher velocities, while basins have lower velocities. In terms of longitudinal characteristics, the LV of the velocity profile is generally approximately 2 km/s, corresponding to the Quaternary overburden (Figure 3) and shallow weathered layers. Generally, the LV layer of Line 1 is thicker than that of Line 2 and corresponds more to the distribution of the basin. The inversion results below a depth of 5 km are generally above 3.0 km/s, which corresponds well with the larger regional inversion results (Zheng et al., 2016; Yang et al., 2020). Our results reveal more details of the velocity variations. In terms of the horizontal distribution, benefitting from the low-density spacing between stations, the imaging resolution is high, which can reveal the strong lateral velocity variations in the region. The overall velocity is low in the west and high in the east.
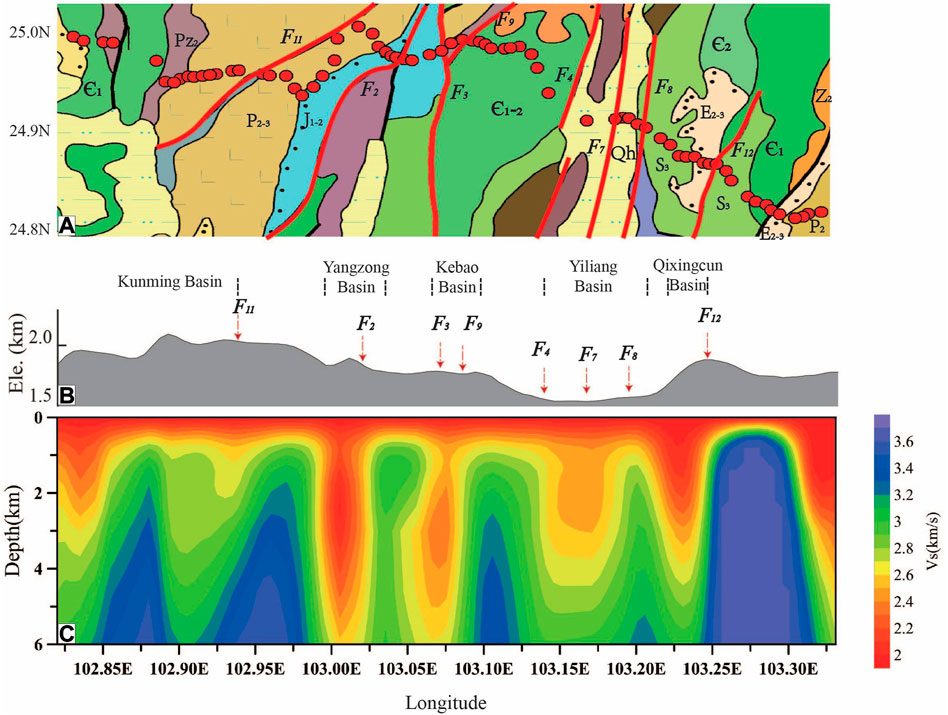
FIGURE 9. Group velocity imaging result of Line 1. (A) Simplified geological map. (B) Altitude profile. (C) S-wave inversion profile.
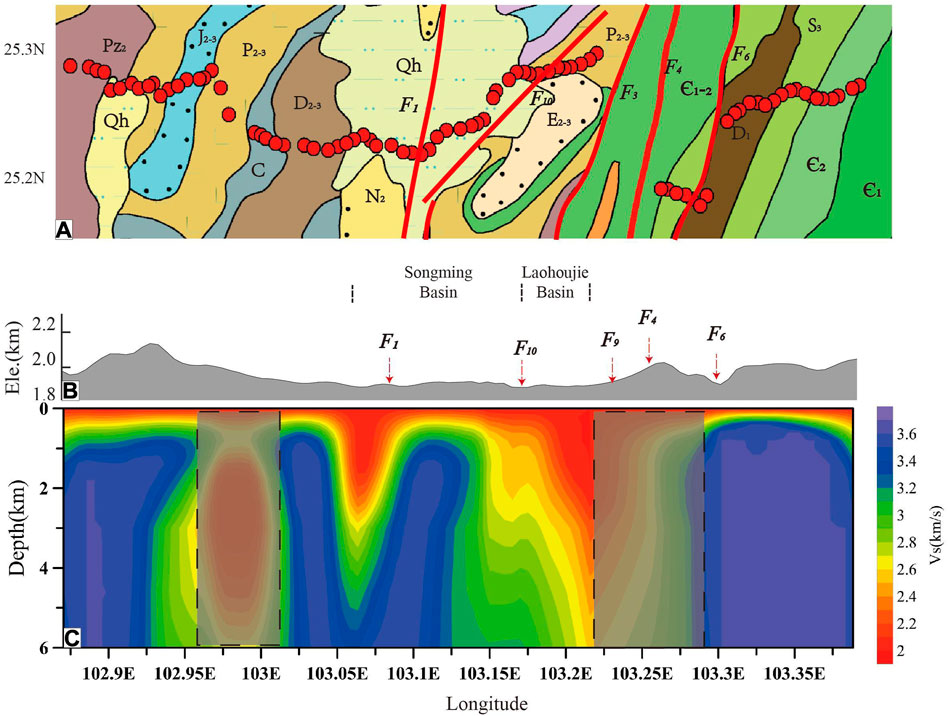
FIGURE 10. S-wave velocity imaging result of Line 2. (A) Simplified geological map. (B) Altitude profile. (C) S-wave inversion profile. The shadow rectangle indicate unreliable results.
Various low-velocity areas can be observed in the Line 1 and Line 2 profiles, which are consistent with the basins. The main basins in the area include the Songming Basin, Yiliang Basin, Yangzong Basin, etc. The inversion results show that the thickness of the sedimentary layer is consistent with that of the sedimentary basins in the study area (Song et al., 1997; Shen et al., 1998). In the Shilin, Baiyi, Songming and Mamingxiang Basins, the high-velocity features are obvious, and the velocity reaches 3 km/s at 1 km in the shallow part. It is worth noting that there is a large LV anomaly along the western part of Line 2 (102.95oE-103oE), and the eastern branch of the XJFZ (103.2oE-103.3oE) may be an LV area due to sparse ray coverage and insufficient imaging resolution.
5 Discussion
5.1 Faults in the middle segment of the XJFZ
In the middle section of the XJFZ, the direction of the rhombic Sichuan–Yunnan block movement is from SSE to S (Kong et al., 2022), and the tectonic stress generally intersects with the tectonic direction, resulting in relatively concentrated stress (Shen and Yu, 1997). Each segment or secondary fault in the area has formed a strong deformation zone. Basins and mountains are distributed alternately, indicating complex topographic features.
We obtained the S-wave velocity structure in this area, in which the LV anomaly corresponds well with the eastern and western branch secondary faults in the middle section of the XJFZ and the NE- and NNE-trending subfaults (Figures 11, 12). A comparison of the velocity structures of Line 1 and Line 2 reveals that Line 1 spans multiple secondary faults and multiple basins, and the lateral velocity changes are generally more intense. The LV and HV areas are relatively obvious, indicating that the area has undergone a strong tectonic deformation process. The Songming–Yiliang area is a section where the XJFZ has been divided from two to many branches (Zhang and Xie, 2001), indicating rapid changes in the structural characteristics.
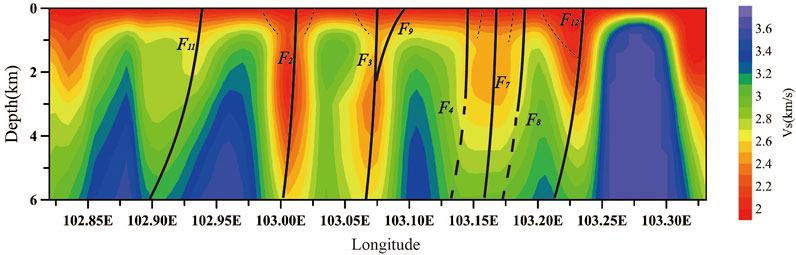
FIGURE 11. Interpreted results based on the S-wave velocity structure of Line 1. The black solid lines denote the faults. The thick black dotted lines denote the predicted faults. The thin black dotted lines denote inferred small faults in basins.
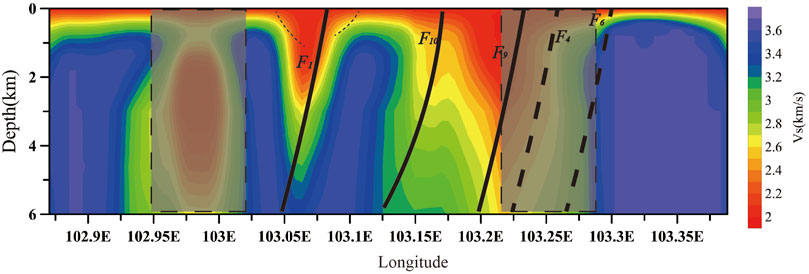
FIGURE 12. Interpreted results based on the S-wave velocity structure of Line 2. The black solid lines denote the faults. The thick black dotted lines denote the predicted faults. The thin black dotted lines denote inferred all faults in basins.
The velocity corresponding to the subfaults (F1∼F8) of the XJFZ is relatively low, i.e., generally 2 km/s, indicating that a strong compression fracture zone along the fault was formed in the process of left-lateral strike slip. At the same time, the LV areas usually show nearly vertical dips with a slightly eastward tilt. The fault dip direction is consistent with the tectonic stress direction in the area. The results illustrate that the depth of the secondary faults of the XJFZ extends to 6 km. According to deeper imaging studies, the eastern‒western branch converges at a depth of approximately 25 km and cuts through the whole crust (Chunyong et al., 2009). F4 and F8 in this area are north of the faults (Figure 2), which may be shown as the junction between high and low velocities (black dashed line in Figure 11). Combined with the velocity structure inversion in this paper, we conclude that the lateral variation in the velocity structure of the upper crust in the study area is strong, showing obvious strike-slip brittle deformation characteristics, and the fault dips are nearly eastward.
The NE-trending faults (F10 and F9 in Figure 12) that are sandwiched by the XJFZ in the study area are cut off morphologically by the subfaults. The corresponding S-wave velocities are low (2.4–2.8 km/s), but the lateral velocity structure shows obvious compressional characteristics, such as LV inversion under F9 (103.2E in Figure 12) and obvious lateral fluctuation at the F10 fault (103.15E in Figure 12). Tectonically and geomorphologically, Yaoling Mountain has clear sinistral strike-slip characteristics (Shen and Yu, 1997). The compressional environment caused the rhombus fault block on the north side of the Yaolingshan fault to rotate counterclockwise under the anti-clockwise torsion of the faults on the east and west sides. Influenced by F1 blocking, the Xiaojiang fault is closed or locked at this location (Li et al., 2021a), placing the southern end of the Songming Basin in a compressional uplift environment, which is one of the high-velocity anomaly factors in the Songming Basin. The results are consistent with the polarization directions of fast horizontal waves (Li et al., 2021a).
It is worth noting that the main seismogenic structure and location of the Songming earthquake that occurred in the Yanglin area have not yet been determined due to the long earthquake occurrence time. This result reveals that the F1 fault has the characteristics of a strong LV anomaly (Figure 12). Previous studies have inferred that the earthquake-generating area of the Songming earthquake is located in the Luliangshan (F1) area (Yu et al., 1996; Zhang and Wang, 2018) or at the intersection of the F1 and Yanglin Nanthrust (F2) faults (Zhang and Xie, 2001), which corresponds to the LV anomaly inversion in this paper. This paper speculates that F1, which is located in the interior of the Songming Basin, may be the main earthquake-generating fault.
F11, which is located west of Line 1, is in the Sichuan–Yunnan block and is hidden under the hills and mountains on the southeast edge of the Kunming Basin; the LV (2.6–3 km/s) and lateral velocity change twist, indicating that the area shows obvious torsional compressional characteristics. The fault dip is relatively low and was formed before the Pliocene. Its main active time was the early Pleistocene, and Holocene activity has been weak (Yu et al., 2004). The velocity structure indicates that the fault shape is affected by torsional pressure due to the left-lateral strike slip of the XJFZ, and there is an obvious creep slip feature. The LV anomaly along the western part of Line 2 can be observed (Figure 12). We speculate that it may caused by a hidden fault or the irregularities of Line2 at this area.
The inversion results in this paper indicate that the main secondary faults of the XJFZ show nearly vertical strike-slip characteristics, and the secondary faults in the Sichuan Yunnan block clamped by the eastern‒western branch show obvious compressional creep slip characteristics. In general, the secondary faults are mainly strike-slip and have compressional characteristics, which conforms to the view that the XJFZ compresses and slides along large-scale strike-slip faults. The velocity structure laterally changes dramatically. The deformation characteristics of the upper crust are brittle, and the deformation mechanism conforms to the rigid block extrusion model.
In recent years, more deep structural features of the XJFZ have been revealed. According to magnetotelluric and seismological studies, two weak material flows may be present in the middle and lower crust, and these flows are considered crustal flows (Bai et al., 2010; Li et al., 2021a; Yu N. et al., 2022). Among the low-velocity and low-resistivity anomalies, a low-velocity and low-resistivity zone is located along the Xianshuihe–Xiaojiang fault zone, and the low-velocity zone is relatively obvious in the range of 24-26oE (Zheng et al., 2016; Zhao et al., 2020).
In the upper crust, the area held by the eastern and western branches of the XJFZ (especially the inner part of the Songming Basin) has obvious high-velocity anomalies (Figure 12), in addition to the high-velocity characteristics caused by strike-slip compression.
We propose that the XJFZ is comprehensively affected by the upwelling of crustal flow and mantle flow. In this area, because of the influence of weak material flows, some of the molten fluid formed by crust and mantle upwelling along the Xiaojiang fault, which has formed low-resistance and low-velocity characteristics in the middle and lower crust of the XJFZ (Fu et al., 2017; Li et al., 2021a; Yu N. et al., 2022). In the middle and upper crust, it is possible that the upwelling along the XJFZ caused the upwelling of the high-velocity strata in the upper part of the crustal flow and finally led to the existence of the HV anomaly zone. HV materials may be jointly affected by F1 and F10 faults (Figure 12), forming a uplift area in the Songming Basin.
5.2 Basins in the middle segment of the XJFZ
Several basins are located in the study area. Most of the basins have good correspondence with the LV zones. The Yangzong Basin, Kebao Basin, Yiliang Basin and Qixingcun Basin all have LV zones. The interior of the Yiliang Basin shows a high-velocity anomaly. Except that the main boundary of the Laohoujie Basin is not controlled by faults, the genetic mechanism of the basin in the study area is closely related to the regional crustal movement and the characteristics of the Xiaojiang fault activity (Song et al., 1997). The origin of the basins is basically controlled by the left-lateral strike-slip movement of the Xiaojiang fault. The shape, structure and distribution of the basins reflect the characteristics of the left-lateral strike-slip movement of the XJFZ (Shen et al., 1998).
The Yiliang Basin is composed of strike-slip pull-apart double-step areas that are controlled by F4, F5, F7 and F8. F4 and F8 extend into the basin basement from the north, forming the east‒west boundary of the basin. The western area of the basin is a left-stepping extensional zone composed of F4 and F5, while the eastern area is a left-stepping extensional zone composed of F8 and F7. The seismogenic structure of the Yiliang earthquake in 1,500 is considered F5. The velocity in the Yiliang Basin is low over a large scale, the crust is relatively thin, and the fault that cuts through the basement is the main fault controlling geothermal resources in the Yiliang Basin (Ba et al., 2019).
The Yangzong Basin is a left-stepping extensional zone composed of F2 and F3, while the Kebao Basin is a trigeminal extensional zone composed of F3 and NW-trending fault F9. The Yangzong Basin shows a strong LV anomaly, which is speculated to be due to the influence of lake water, and it is also possible that the high slip rate in this area leads to a high degree of fragmentation of upper crustal strata (Li et al., 2013), which comprehensively explains the activity in this region.
The shape of the Yiliang Basin is irregular. The dominant faults are F1 on the north side and F2 on the south side. The Songming Basin has a high-velocity anomaly area. Previous studies have considered that the Songming area is an area of uplift (Teng, 1978). The regional crustal movement in the Cenozoic era has been mainly characterized by large-scale uplift. There is strong horizontal differential movement along the fault, while vertical differential movement is still weak. The movement is mainly shown in the step area of the secondary shear fault (Song et al., 1997).
6 Conclusion
In this paper, based on short-period dense array data and the ambient noise imaging method, the S-wave velocity structure profile of the middle section of the shallow XJFZ is obtained. The results better reveal the velocity structure of the upper crust, the distribution characteristics of the eastern‒western branch subfaults and the basin distribution in this area.
The inversion results show a strong LV zone at each subfault in the middle section of the XJFZ, which can reflect its strike-slip characteristics in the north‒south direction. The faults in each branch have nearly eastward dips. The strong lateral velocity variation characterizes the brittle deformation of the upper crust, indicating that the movement and deformation mechanism of the middle and upper crust conform to the rigid block extrusion model. In addition, the middle section of the XJFZ experienced more severe structural deformation from north to south.
The changes in the fault shape and velocity also represent local compression slip in the large-scale strike-slip process. Especially in the Sichuan–Yunnan block and the east‒west block, the faults and stratum variation are characterized by typical compression.
The fault in the Songming Basin has LV values and extends to deeper areas, which is speculated to be related to the 1833 Songming earthquake.
A comprehensive analysis of basin distribution and deep velocity structure characteristics reveals that during the upwelling process of deep crustal flow, anomalies such as a significant LV, low resistance and strong attenuation in the middle and lower crust were produced, and upwelling along the XJFZ led to the upwelling of high-velocity strata in the upper part of the crustal flow and finally led to the existence of high-velocity anomaly areas.
Data availability statement
The original contributions presented in the study are included in the article/Supplementary Material, further inquiries can be directed to the corresponding author.
Author contributions
The author contributions are as follows, YL contributed to data processing, interpretation and wrinting (original draftpreparation). TX contributed to data processing and result quality assessment. ZL and QL contributed to geological interpretation and revision. XZ and GgW contributed to survey design. GW, SC, and CC contributed to data collecting, format conversion and preprocess. All authors contributed to manuscript revision, read, and approved the submitted version.
Funding
This study was financially supported by the Fund from the Key Laboratory of Deep-Earth Dynamics of Ministry of Natural Resources, Grant No. J1901-38, by the National Natural Science Foundation of China, Grant (No.41904096), by the China Geological Survey Project, No. DD20220047 and DD20230008, National key research and development program (No. 2022YFF0800903-1).
Acknowledgments
We would like to thank Tao Xu (Institute of Geology and Geophysics, Chinese Academy of Sciences) for the program support and the comments during the data processing.
Conflict of interest
The authors declare that the research was conducted in the absence of any commercial or financial relationships that could be construed as a potential conflict of interest.
Publisher’s note
All claims expressed in this article are solely those of the authors and do not necessarily represent those of their affiliated organizations, or those of the publisher, the editors and the reviewers. Any product that may be evaluated in this article, or claim that may be made by its manufacturer, is not guaranteed or endorsed by the publisher.
Supplementary material
The Supplementary Material for this article can be found online at: https://www.frontiersin.org/articles/10.3389/feart.2023.1161989/full#supplementary-material
References
Ba, J., Xu, S., and Su, C. (2019). Basic characteristics and Genesis of Yiliang geothermal field, Yunnan[J]. Glob. Geol. (in Chin. 38 (2), 556–564.
Bai, D., Unsworth, M. J., Meju, M. A., Ma, X., Teng, J., Kong, X., et al. (2010). Crustal deformation of the eastern Tibetan plateau revealed by magnetotelluric imaging. Nat. Geosci. 3 (5), 358–362. doi:10.1038/ngeo830
Ben-Zion, Y., Vernon, F. L., Ozakin, Y., Zigone, D., Ross, Z. E., Meng, H., et al. (2015). Basic data features and results from a spatially dense seismic array on the San Jacinto fault zone. Geophys. J. Int. 202 (1), 370–380. doi:10.1093/gji/ggv142
Bensen, G., Ritzwoller, M., Barmin, M., Levshin, A. L., Lin, F., Moschetti, M. P., et al. (2007). Processing seismic ambient noise data to obtain reliable broad-band surface wave dispersion measurements. Geophys. J. Int. 169 (3), 1239–1260. doi:10.1111/j.1365-246x.2007.03374.x
Campillo, M., Roux, P., and Romanowicz, B. (2014). Seismic imaging and monitoring with ambient noise correlations[J]. Treatise Geophys. 1, 256–271.
Cao, Z., and Shen, X. (1996). Seismogenic structure of yunnan Yiliang earthquake in 1500[J]. J. Seismol. Res. (in Chinese) 19 (2), 184–191.
Chang, Y., Chen, L., and Li, X. (2021). The late quaternary activity of the fault along the Western marginof the Yiliang Basin of the Xiaojiang fault zone[J]. Journal of Seismological Research (in Chinese) 44 (2), 152–161.
Chen, M., Huang, H., Yao, H., van der Hilst, R., and Niu, F. (2014). Low wave speed zones in the crust beneath SE Tibet revealed by ambient noise adjoint tomography. Geophysical Research Letters 41 (2), 334–340. doi:10.1002/2013gl058476
Chunyong, W., Hai, L., Xili, W., Qin, J., Yang, R., and Zhao, J. (2009). Crustal structure in Xiaojiang fault zone and its vicinity. Earthquake Science 22 (4), 347–356. doi:10.1007/s11589-009-0347-0
Deng, Q., Zhang, P., Ran, Y., Yang, X., Min, W., Chu, Q., et al. (2003). Basic characteristics of active tectonics of China[J]. Science in China Series D Earth Sciences 46 (4), 356–372.
Du, P., Wu, J., Li, Y., Wang, J., Han, C., Lindsay, M. D., et al. (2020). Imaging karatungk Cu-Ni mine in xinjiang, western China with a passive seismic array. Minerals 10 (7), 601–616. doi:10.3390/min10070601
Du, Y., Jing, Z., and Xie, F. (2009). The quaternary tectonic stress field of the Kunming Basin and its surrounding areas[J]. Earthquake Research in China (in Chinese) 25 (1), 31–40.
Fang, H., Yao, H., Zhang, H., Huang, Y. C., and van der Hilst, R. D. (2015). Direct inversion of surface wave dispersion for three-dimensional shallow crustal structure based on ray tracing: Methodology and application. Geophysical Journal International 201 (3), 1251–1263. doi:10.1093/gji/ggv080
Fu, Y. V., Gao, Y., Li, A., Li, L., and Chen, A. (2017). Lithospheric structure of the southeastern margin of the Tibetan Plateau from Rayleigh wave tomography. Journal of Geophysical Research Solid Earth 122 (6), 4631–4644. doi:10.1002/2016jb013096
Gao, Y., Shi, Y., and Wang, Q. (2020). Seismic anisotropy in the southeastern margin of the Tibetan Plateau and its deep tectonic significances[J]. Chinese Journal of Geophysics (in Chinese) 63 (3), 802–816.
Guo, P., Han, Z., Dong, S., Mao, Z., Hu, N., Gao, F., et al. (2021). Latest Quaternary Active Faulting and Paleoearthquakes on the Southern Segment of the Xiaojiang fault zone, SE Tibetan Plateau[J]. Lithosphere 2021 (1), 1–17. doi:10.2113/2021/7866379
Kong, W., Huang, L., Yao, R., and Yang, S. (2022). Contemporary kinematics along the Xianshuihe-Xiaojiang fault system: Insights from numerical simulation. Tectonophysics 839, 229545. doi:10.1016/j.tecto.2022.229545
Li, K., Li, J., and Ma, X. (2020). The Application of Multi-source Remote Sensing Image in the Study of Active Faults - Taking Xiaojiang Fault Zone as an Example[J]. Urban Geology (in Chinese) 15 (3), 342–350.
Li, L., Chen, Q., Niu, F., He, J., Fu, H., et al. (2013). Estimates of deep slip rate along the Xiaojiang fault with repeating microearthquake data[J]. Chinese Journal of Geophysics (in Chinese) 56 (10), 3373–3384. doi:10.6038/cjg20131013
Li, X., Bai, D., Ma, X., Chen, Y., Varentsov, I. M., Xue, G., et al. (2019). Electrical resistivity structure of the Xiaojiang strike-slip fault system (SW China) and its tectonic implications. Journal of Asian Earth Sciences 176, 57–67. doi:10.1016/j.jseaes.2019.01.031
Li, X., Ran, Y., Wu, F., Ma, X. Q., et al. (2018). Rupture characteristics of late Quaternary strong earthquakes on the Western branch of the Xiaojiang Fault Zone[J]. Seismology and Geology 40 (6), 1180–1203. doi:10.3969/j.issn.0253-4967.2018.06.001
Li, Y., Gao, Y., Shi, Y., and Wu, P. (2021a). Preliminary seismic anisotropy in the upper crust of the south segment of Xiaojiang faults and its tectonic implications. Earthquake Science 34 (1), 64–76. doi:10.29382/eqs-2020-0059
Li, Y., Hao, M., Song, S., Zhu, L., Cui, D., Zhuang, W., et al. (2021b). Interseismic fault slip deficit and coupling distributions on the Anninghe-Zemuhe-Daliangshan-Xiaojiang fault zone, southeastern Tibetan Plateau, based on GPS measurements. Journal of Asian Earth Sciences 219, 104899. doi:10.1016/j.jseaes.2021.104899
Lin, F.-C., Li, D., Clayton, R. W., and Hollis, D. (2013). High-resolution 3D shallow crustal structure in Long Beach, California: Application of ambient noise tomography on a dense seismic array. Geophysics 78 (4), Q45–Q56. doi:10.1190/geo2012-0453.1
Molnar, P., and Tapponnier, P. (1975). Cenozoic Tectonics of Asia: Effects of a Continental Collision: Features of recent continental tectonics in Asia can be interpreted as results of the India-Eurasia collision. Science 189 (4201), 419–426. doi:10.1126/science.189.4201.419
Mordret, A., Roux, P., Boué, P., and Ben-Zion, Y. (2019). Shallow three-dimensional structure of the San Jacinto fault zone revealed from ambient noise imaging with a dense seismic array. Geophysical Journal International 216 (2), 896–905. doi:10.1093/gji/ggy464
Pei, W., Yang, Z., and Zhou, S. (2022). Source Mechanisms of Small Earthquakes and Tectonic Stress Field in Xiaojiang, Yunnan[J]. Acta Scientiarum Naturalium Universitatis Pekinensis 58 (4), 602–608. (in Chinese). doi:10.13209/j.0479-8023.2022.043
Qian, X., and Qin, J. (2008). Strong earthquake risk analysis of Xiaojiang Fault Zone and surrounding areas[J]. Journal of Seismological Research (in Chinese) 31 (4), 8.
Qiao, L., Yao, H., Lai, Y. C., Huang, B. S., and Zhang, P. (2018). Crustal Structure of Southwest China and Northern Vietnam From Ambient Noise Tomography: Implication for the Large-Scale Material Transport Model in SE Tibet. Tectonics 37 (5), 1492–1506. doi:10.1029/2018tc004957
Sabra, K. G., Gerstoft, P., Roux, P., Kuperman, W. A., Fehler, M. C., et al. (2005). Extracting time-domain Green's function estimates from ambient seismic noise. Geophysical research letters 32 (3), L03310. doi:10.1029/2004gl021862
Schimmel, M., and Paulssen, H. (1997). Noise reduction and detection of weak, coherent signals through phase-weighted stacks. Geophysical Journal International 130 (2), 497–505. doi:10.1111/j.1365-246x.1997.tb05664.x
Schmandt, B., and Clayton, R. W. (2013). Analysis of teleseismicPwaves with a 5200-station array in Long Beach, California: Evidence for an abrupt boundary to Inner Borderland rifting. Journal of Geophysical Research Solid Earth 118 (10), 5320–5338. doi:10.1002/jgrb.50370
Shapiro, N. M., Campillo, M., Stehly, L., and Ritzwoller, M. H. (2005). High-Resolution Surface-Wave Tomography from Ambient Seismic Noise. Science 307 (5715), 1615–1618. doi:10.1126/science.1108339
Shen, J., Wang, Y., and Song, F. (2003). Characteristics of the active Xiaojiang fault zone in Yunnan, China: a slip boundary for the southeastward escaping Sichuan–Yunnan Block of the Tibetan Plateau. Journal of Asian Earth Sciences 21 (10), 1085–1096. doi:10.1016/s1367-9120(02)00185-2
Shen, J., Wang, Y., and Song, F. (1998). The evolution stages of the Late Cenozoic tectonic basins in the central part of the Xiaojiang Fault Zone[J]. Journal of Seismological Research (in Chinese) 21 (1), 58–64.
Shen, J., and Yu, W. (1997). The NE-trending faults and block structure in the central section of the Xiaojiang Fault Zone[J]. Journal of Seismological Research (in Chinese) 19 (3), 203–210.
Song, F., Wang, Y., Shen, J., Zhongquan, C., Shen, X., Yu, W., et al. (1997). The development stages of the basins along the Middle segment of the Xiaojiang fault zone and its relation to regional tectonic movement[J]. Seismology and Geology (in Chinese) 19 (3), 211–217.
Tang, W., Liu, Y., Chen, Z., Zhang, Q., Zhao, J., et al. (2006). Modern activity in the southern and central parts of the Xiaojiang fault in Yunnan[J]. Sedimentary Geology and Tethyan Geology (in Chinese) 26 (2), 21–24.
Tapponnier, P., and Molnar, P. (1977). Active faulting and tectonics in China. Journal of Geophysical Research 82 (20), 2905–2930. doi:10.1029/jb082i020p02905
Tapponnier, P., Peltzer, G., Dain, A., Armijo, R., and Cobbold, P. (1982). Propagating extrusion tectonics in Asia: New insights from simple experiments with plasticine. Geology 10 (12), 611. doi:10.1130/0091-7613(1982)10<611:petian>2.0.co;2
Teng, D. (1978). Basic characteristics of seismogeology in the middle section of Xiaojiang fault zone in Yunnan Province[J]. Journal of Seismological Research 02, 57–66. (in Chinese).
Wang, E. (1998). Late cenozoic xianshuihe-xiaojiang, red river, and dali fault systems of southwestern sichuan and central yunnan, China. Geological Society of America.
Wang, G., and Wang, E. (2005). Extensional structures within the compressional orogenic belt and its mechanism: a case study for the late Cenozoic deformation in central Yunnan[J]. Seismology and Geology (in Chinese) 27 (2), 188–199.
Xie, T., Xu, T., Ai, Y., Zeng, Q., Zhang, W., and Zheng, F. (2021). Imaging the shallow crustal velocity structure of the Qingchengzi ore field on the Liaodong Peninsula, China, with a short-period dense array using ambient noise tomography. Tectonophysics 813, 228913. doi:10.1016/j.tecto.2021.228913
Yang, Y., Hu, S., Yao, H., Fang, L., and Wu, J. (2020). Crustal shear wave velocity and radial anisotropy in the Xiaojiang fault zone system (SE Tibet) revealed by ambient noise interferometry. Tectonophysics, 792, 792, doi:10.1016/j.tecto.2020.228594
Yao, H., Beghein, C., and Van Der Hilst, R. D. (2008). Surface wave array tomography in SE Tibet from ambient seismic noise and two-station analysis - II. Crustal and upper-mantle structure. Geophysical Journal International 173 (1), 205–219. doi:10.1111/j.1365-246x.2007.03696.x
Yao, H., van Der Hilst, R. D., and De Hoop, M. V. (2006). Surface-wave array tomography in SE Tibet from ambient seismic noise and two-station analysis - I. Phase velocity maps. Geophysical Journal International 166 (2), 732–744. doi:10.1111/j.1365-246x.2006.03028.x
Yu, G., Xu, T., Liu, J., Ai, Y., et al. (2020). Late Mesozoic extensional structures and gold mineralization in Jiaodong Peninsula, eastern North China Craton: an inspiration from ambient noise tomography on data from a dense seismic array[J]. Chinese Journal of Geophysics (in Chinese) 63 (5), 1878–1893. doi:10.6038/cjg2020N0446
Yu, H., Hu, F., Xu, J., Zhang, Z., Chen, X., et al. (2022a). Dynamic Rupture Simulation of the 1833 Songming, Yunnan, China, M 8.0 Earthquake: Effects From Stepover Location and Overlap Distance[J]. Earth and Space Science 9 (2), e2021EA002100. doi:10.1029/2021EA002100
Yu, N., Wang, X., Li, D., Wang, E., Kong, W., et al. (2022b). The mechanism of deep material transport and seismogenic environment of the Xiaojiang fault system revealed by 3-D magnetotelluric study. Science China Earth Sciences 65 (6), 1128–1145. doi:10.1007/s11430-021-9914-3
Yu, W., and Shen, X. (1995). Textural research on surface dormation belt of Yiliang earthquake in 1500[J]. Journal of Seismological Research (in Chinese) 18 (4), 408–411.
Yu, W., Wang, Y., and Song, F. (1996). Survey study on surface rupture zone to Yunnans' Songming M8 earthquake in 1833[J]. Journal of Seismological Research (in Chinese) 19 (4), 385–390.
Yu, W., Xie, Y., and Zhang, J. (2004). Age studies of major active faults around Kunming Basin[J]. Journal of Seismological Research (in Chinese) 27 (4), 357–362.
Zeng, X., and Ni, S. (2011). Correction to A persistent localized microseismic source near the Kyushu Island, Japan[J]. Geophysical Research Letters 38 (16).
Zhang, P.-Z. (2013). A review on active tectonics and deep crustal processes of the Western Sichuan region, eastern margin of the Tibetan Plateau. Tectonophysics 584, 7–22. doi:10.1016/j.tecto.2012.02.021
Zhang, S., and Xie, F. (2001). Seismo-tectonic divisions of strong earthquakes with MS≥7.0 and their tectonic geomorphology along Xianshuihe-Xiaojiang fault zone[J]. Acta Seismologica Sinica (in Chinese) 23 (1), 36–44.
Zhang, Z., and Wang, J. (2018). Seismic density around the epicenter of the Songming M8.0 earthquake in 1833[J]. Earthquake Research in China 34 (2), 303–311. (in Chinese).
Zhao, L.-F., Xie, X.-B., He, J.-K., Tian, X., and Yao, Z. X. (2013). Crustal flow pattern beneath the Tibetan Plateau constrained by regional Lg-wave Q tomography. Earth and Planetary Science Letters 383, 113–122. doi:10.1016/j.epsl.2013.09.038
Zhao, Y., Guo, L., Guo, Z., Chen, Y. J., Shi, L., and Li, Y. (2020). High resolution crustal model of SE Tibet from joint inversion of seismic P-wave travel-times and Bouguer gravity anomalies and its implication for the crustal channel flow. Tectonophysics, 792, 792, doi:10.1016/j.tecto.2020.228580
Zheng, C., Ding, Z., and Song, X. (2016). Joint inversion of surface wave dispersion and receiver functions for crustal and uppermost mantle structure in Southeast Tibetan Plateau[J]. Chinese Journal of Geophysics (in Chinese) 59 (9), 3223–3236.
Zheng, F., Xu, T., Ai, Y., et al. (2022). Metallogenic potential of the Wulong goldfield, Liaodong Peninsula, China revealed by high-resolution ambient noise tomography[J]. Ore Geology Reviews 142 (2022), 1–13.
Zhou, Y., Yue, H., Zhou, S., Fang, L., Xu, L., et al. (2022). Microseismicity along Xiaojiang Fault Zone (Southeastern Tibetan Plateau) and the characterization of interseismic fault behavior. Tectonophysics 833, 229364. doi:10.1016/j.tecto.2022.229364
Zhu, A., Zhang, D., and Jiang, C. (2015). Numerical simulation of the segmentation of the stress state of the Anninghe-Zemuhe-Xiaojiang faults[J]. Science China Earth Sciences 45, 1839–1852. (in Chinese).
Keywords: Xiaojiang fault zone, shear wave velocity structure, ambient noise tomography, songming basin, structural characteristics and evolution
Citation: Liang Y, Xie T, Lu Z, Li Q, Zhang X, Wang G, Wang G, Chen S and Chang C (2023) Shear wave velocity structure in the middle segment of the Xiaojiang fault zone using ambient noise tomography. Front. Earth Sci. 11:1161989. doi: 10.3389/feart.2023.1161989
Received: 09 February 2023; Accepted: 06 March 2023;
Published: 16 March 2023.
Edited by:
Xiaoyu Guo, Sun Yat-sen University, ChinaReviewed by:
Xuzhang Shen, Sun Yat-sen University, ChinaPan Zhang, Jilin University, China
Lun Li, School of Earth Sciences and Engineering, Sun Yat-sen University, China
Copyright © 2023 Liang, Xie, Lu, Li, Zhang, Wang, Wang, Chen and Chang. This is an open-access article distributed under the terms of the Creative Commons Attribution License (CC BY). The use, distribution or reproduction in other forums is permitted, provided the original author(s) and the copyright owner(s) are credited and that the original publication in this journal is cited, in accordance with accepted academic practice. No use, distribution or reproduction is permitted which does not comply with these terms.
*Correspondence: Zhanwu Lu, bHV6aGFud3U3OEAxNjMuY29t