 Changyu Wu
 Jingjing Dai
 Aorigele Zhou2
- 1School of Earth Sciences and Resources, China University of Geosciences (Beijing), Beijing, China
- 2MNR Key Laboratory of Metallogeny and Mineral Assessment, Institute of Mineral Resources, Chinese Academy of Geological Sciences, Beijing, China
- 3No 6 Geological Party, Tibet Bureau of Geology and Mineral Exploration and Development, Lhasa, Tibet, China
- 4Zhongkai Mineral Industry Co., Ltd., Tibet, Lhasa, Tibet, China
Methods for extracting mineralized alteration information using remote sensing images have recently become both efficient and cost-effective. Technology involving the extraction of alteration information based on multi-spectral data has been widely practiced and effectively verified. In recent years, research on fine mineral extraction methods based on hyperspectral data has also been rapidly developing. The Yulong copper belt is a porphyry copper belt located in China with high prospects for mineralization. However, most previous studies focused on the northern section of the Yulong copper belt, with limited exploration of the southern section. In this study, alteration information of the southern section of the Yulong copper belt was extracted from remote sensing data from Landsat-8 OLI, ASTER, and ZY1-02D, and the prospecting potential of this area was evaluated. Principal component analysis was used to extract iron oxide and hydroxyl alteration from Landsat-8 data, in addition to Al hydroxyl and propylitic alterations from ASTER data. Considering the challenge of the extraction of too many pseudo-anomalies using traditional methods, the mixture-tuned matched filtering (MTMF) method was used to more accurately extract iron oxide alterations. Regarding hyperspectral data, the minimum noise fraction and pure pixel index algorithms were used to extract white mica and carbonatite endmembers. The MTMF method was also used for alteration mapping, which took advantage of sub-pixel abundance mapping to finely divide the white mica and carbonatite alterations into five classes. The extraction results of multi-source remote sensing data were then compared and analyzed to avoid occasional single-image extraction results, which confirmed the superiority of the hyperspectral remote sensing and MTMF methods. Combined with field verification, the mineralization alteration information coincided with the spatial location of the Secuo, Mamupu, and Jicuo deposits, which confirmed the accuracy of alteration information extraction. The results of this study confirmed the application potential of remote sensing alteration information extraction in the field of mineral resource exploration. The results have important reference significance for further geological prospecting and exploration in the southern section of the Yulong copper belt.
1 Introduction
Remote sensing technology has recently been widely used for identification and prospecting in lithology given its advantages in efficiency and cost-effectiveness (Liu et al., 2013; Cardoso-Fernandes et al., 2019; Dai et al., 2019; Dai et al., 2020). Multispectral remote sensing can objectively reflect geological elements such as geological bodies, tectonics, and mineralization alterations according to the responses of different spectral characteristics to ground objects, while also playing an important role in geological prospecting (Zhang et al., 2017; Aali et al., 2022). Landsat-8 provides some of the most widely used multispectral remote sensing data worldwide and has previously been used to extract alteration information and track favorable mineralization targets (Pour and Hashim, 2015; Bolouki et al., 2019). Additionally, ASTER data have a relatively high spectral resolution in the visible-near infrared (VNIR), short-wave infrared (SWIR), and thermal infrared (TIR) bands, which can more accurately distinguish spectral differences between rocks and minerals. ASTER data are more widely used and effective than other types of deposits in searching for porphyry copper–gold–molybdenum deposits (Tommaso and Rubinstein, 2006; Alimohammadi et al., 2015; Liu et al., 2018; Atif et al., 2022; Shirazi et al., 2022). In recent years, there have been rapid developments in hyperspectral remote sensing technology. Dozens of minerals can now be identified in the VNIR and SWIR bands with their nanoscale spectral resolutions (Clark et al., 2007). Therefore, hyperspectral data are also widely used in the study of mineralization and alteration information extraction, with significant progress and strong results when used in combination with traditional geological prospecting (Gersman et al., 2008; Jain and Sharma, 2019; Huang et al., 2020; Hajaj et al., 2023). Although much theoretical research and prospecting practices have been carried out in the extraction of alteration information from remote sensing images, most research has focused on the extraction of alteration information using single-image data or a single method (Du et al., 2022). Considering the different types of remote sensing satellite sensors, the types of image data in the same research area may also vary. The results of different extraction methods for varying images are also superior and inferior. However, the accurate extraction of alteration information is necessary to ensure the smooth implementation of subsequent survey work. How to select remote sensing data and corresponding methods for alteration mapping in different regions remains unanswered. This study applied multi-source remote sensing data to perform alteration mapping in the same area and compared different mapping results obtained by different methods to provide a reference for the future application of remote sensing alteration mapping.
The Yulong copper belt in Tibet is located on the southeast edge of the Tibetan Plateau and is a porphyry copper belt that presents some of the most significant prospects for mineralization in China (Rui et al., 1984). The Yulong copper belt is approximately 300 km long and 15–30 km wide, with one super-large porphyry copper deposit (Yulong), two large porphyry copper deposits (Duoxiasongduo and Malasongduo), two medium-sized porphyry copper deposits (Manzong and Zalagao), and more than 20 mineralization points (Zhang et al., 2022). Following the discovery of the Yulong copper belt, many domestic scholars have studied its ore-forming age, tectonics, and geological characteristics (Chen et al., 2009; Wu et al., 2013; Lin et al., 2018; Zhang et al., 2022). However, this research has primarily been concentrated on the northern section of the Yulong copper belt. Only Mamupu, Secuo, and Jicuo deposits, along with some small mineralization points, have so far been described in the southern section of the Yulong copper belt. Considering the small scale of mineralization here, this area has not yet been studied in detail. The southern section represents an important part of the Yulong copper belt and is a prospective area with good metallogenic potential. At present, the low degree of exploration is restricting our understanding of the metallogenic potential of this belt. Therefore, it is of great significance to apply economical and efficient remote sensing technology to the preliminary prospecting and exploration analysis of the southern section of the Yulong copper belt.
In this study, data on the mineralization and alteration of the southern section of the Yulong copper belt were extracted by combining Landsat-8 OLI, ASTER multispectral, and ZY1-02D hyperspectral data. The traditional PCA method and the more advanced MTMF method were also used to obtain accurate results on the alteration distribution in this region. The alteration results obtained using different data and methods were subsequently compared and discussed. Finally, the most favorable areas for mineralization in the southern section of the Yulong copper belt were analyzed in combination with field verification.
2 Geological setting
The Yulong copper belt in Tibet is located in the center of the Sanjiang tectonics in the Qiangtang body, within the northern extension of the Honghe-Ailao Mountain fault system. Additionally, it is controlled by a series of NNW fractures and strike-slip pull-out basins. It is bordered on the west by Tuoba-Mangkang Fault, and on the east by the Gongjue Basin and Ziga Fault. The porphyry copper belt was formed by the shallow intrusion of several moderately acidic magmas in the Eocene and Oligocene (Chen et al., 2016). The study area was located in the southern section of the Yulong copper belt (Figure 1).
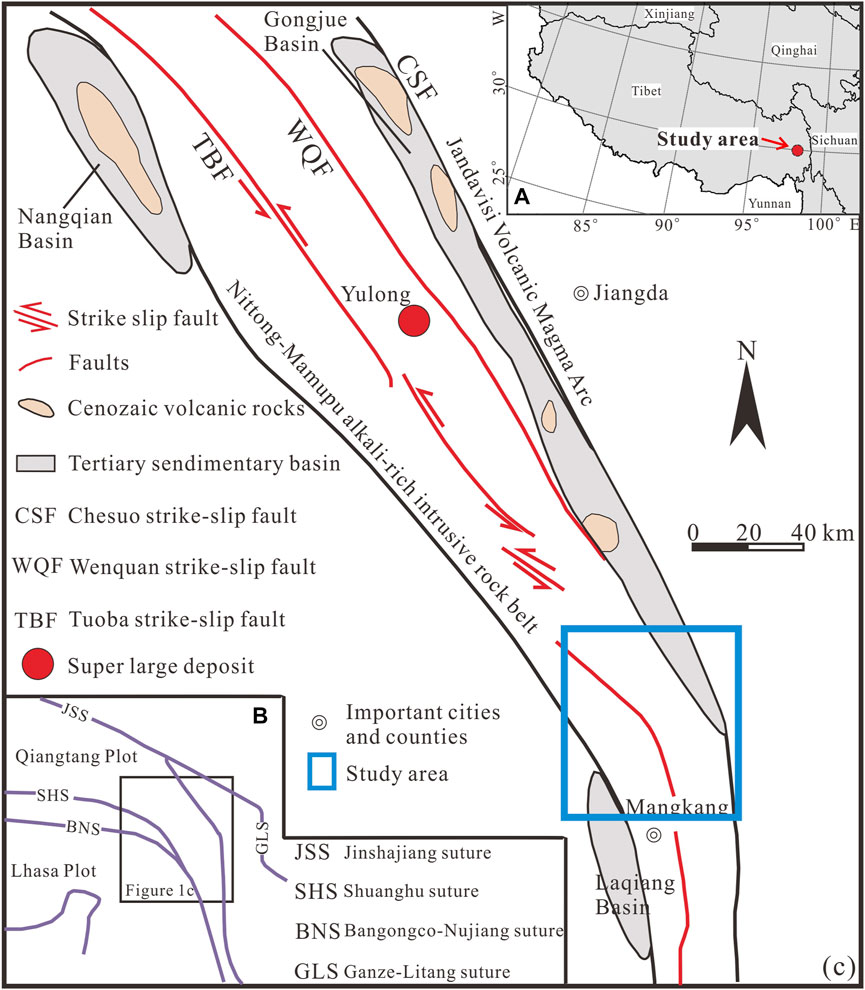
FIGURE 1. (A) Geographical location of the study area in China. (B) Tectonic framework of northeastern Tibet. (C) Brief geological map of the Yulong copper belt (modified from Zhang et al., 2022).
The exposed strata in this area ranged from the Carboniferous to the Cenozoic Quaternary, among which Permian, Triassic, Upper Triassic, and Jurassic strata were the most widely distributed (Chen et al., 2009; Lin et al., 2018; Zhang et al., 2022), (Figure 2). The Quaternary (Qh) was mainly composed of various loose sediments consisting primarily of gravel, sand, peat, and ice water deposits, which were only exposed in a small area in the north of the study area. The lower part of the Neogene Lawula Formation (Nl) was composed of andesitic agglomerate, andesite, and coarse facies. Meanwhile, the upper part was purple–red and gray–yellow tuffaceous sandstone, with siltstone and feldspathic quartz sandstone, which was mainly distributed throughout the southwest of the study area, alongside the Cretaceous (K2n, K1j) sandstone, conglomerate-bearing sandstone, and coarse sandstone. The Upper, Middle, and Lower Jurassic formations were all developed in this area. The Upper Jurassic was dominated by brownish-red mudstone with sand salts, alongside mudstone gray–black–green mud shale near the bottom. The Middle Jurassic Dongdaqiao Formation (J2d) was dominated by dark purple thick-layered sandstones interbedded with mudstones. Meanwhile, the Lower Jurassic Wangbu Formation (J1w) was dominated by gray–green and purple–brown mudstones and siltstones, which were interbedded with sandstones, thin conglomerates, and dolomitic mud crystal tuffs. The Upper Triassic was primarily distributed throughout the central part of the study area, among which the Adula Formation (T3a), Duogaila Formation (T3d), and Jiapila Formation (T3j) were mainly quartz sandstone and fine sandstone with shale interbeds. Furthermore, the Upper Triassic Bolila Formation (T3b) was mainly gray–white dolomite and tuffs, and the Xiaodingxi Formation (T3x) consisted of amygdaloidal basalt, andesitic basalt, and crystalline tuff. The gray–black sandstone and shale of the Permian Tuoba Formation (P3t) and the gray–green andesite of the Xiayacun Formation (P3x), as well as andesitic tuffs and shales, were mainly exposed in the south of the study area. Additionally, the lower section of the Lower Carboniferous Machala Formation (C1m) was a coal-bearing clastic section, the upper area of which was a tuff section, with the gray medium-thick laminated crystalline tuff of the Upper Carboniferous Aoqu Formation (C2a) exposed to a small extent in the southern part of the study area.
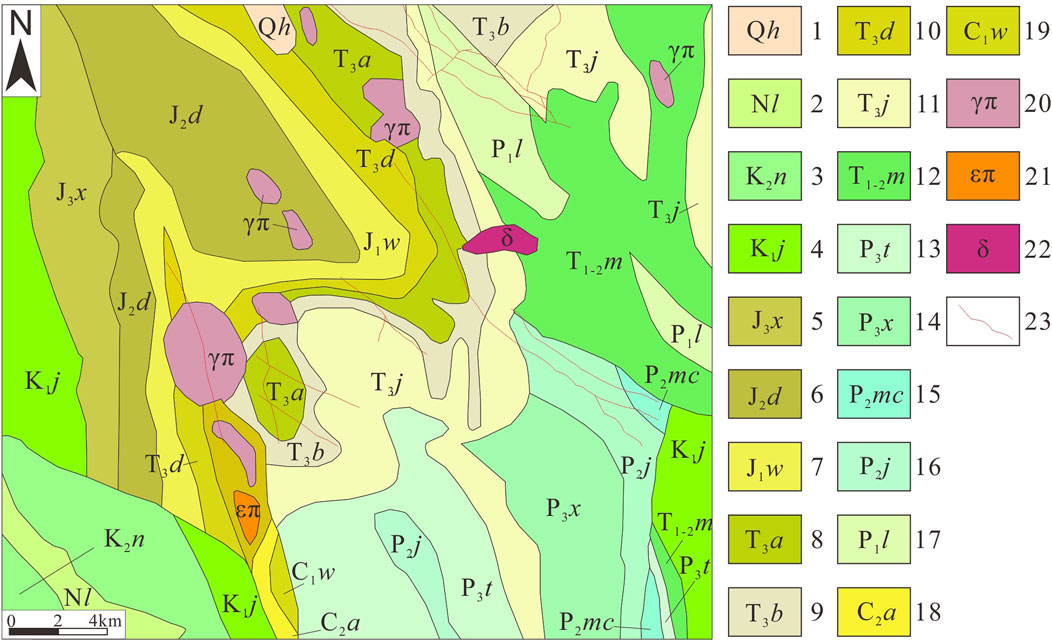
FIGURE 2. Geological map of the study area. 1–19: strata of different ages; 20: granite porphyry; 21: orthoclase; 22: amphibolite; 23: faults.
The magmatic activity within the study area was also relatively strong between the Haixi and Xishan periods. The intrusive activity lasted from the Indosinian until the Xishan period and could be characterized by medium-acidic small porphyritic intrusions (Chen et al., 2016). Granite porphyry, syenite porphyry, and diorite intrusions were exposed in this area. These were primarily located within the central and western parts of the study area. The outcrops were distributed in a north-south direction, with a scale of several to dozens of square kilometers.
The study area was located in the Sanjiang Fold System, which is part of the massive Tethys-Himalayan tectonic domain (Wu et al., 2013). This fold system is sandwiched between the Yarlung Zangbo and Jinshajiang deep major fault zones, with the Yangtse landmass in the east and the Indian landmass in the west (Lin et al., 2018). Furthermore, the main body consisted of the southeastern part of two micro-landmasses, Qiangtang-Changdu and Gangdis-Nyingchi Tanggula. The study area was also separated by the Nujiang Deep Fault Zone, and the main fault structures were distributed in a NW-SE direction, located in the north, east, and center of the study area.
3 Data and methods
3.1 Data sources
On 11 February 2013, Landsat-8 was launched from Vandenberg Air Force Base, California, carrying two sensors: the OLI and the TIRS (Thermal Infrared Sensor). Landsat-8 has a total of 11 bands: bands 1–7 and 9–11 with a spatial resolution of 30 m, and band 8 with a panchromatic resolution of 15 m (Roy et al., 2014). This satellite can achieve global coverage every 16 days. Two additional bands that represent the difference between Landsat-7 ETM+ and Landsat 8 are the short-wave infrared cirrus band and the deep blue coastal/aerosol band (Howari et al., 2020). The Landsat-8 data used in this study were imaged on 15 December 2020, with data identifier LC81330392020350LGN00. Furthermore, the image quality for the study area was excellent and largely free of clouds and snow.
ASTER was launched in 1999; however, it is still extensively used in geological studies due to its reasonable coverage of VNIR (15 m pixel size), SWIR (30 m), and TIR (90 m) regions (El-Desoky et al., 2022) (Table 1). Level 1 ASTER L1T (V003) precision terrane and crosstalk-corrected granules were downloaded in 2022 from the NASA Earth Explorer platform. The two images were taken on 19 December 2001 and 12 November 2005 and achieved basic coverage of the study area while containing a small amount of cloudy snow.
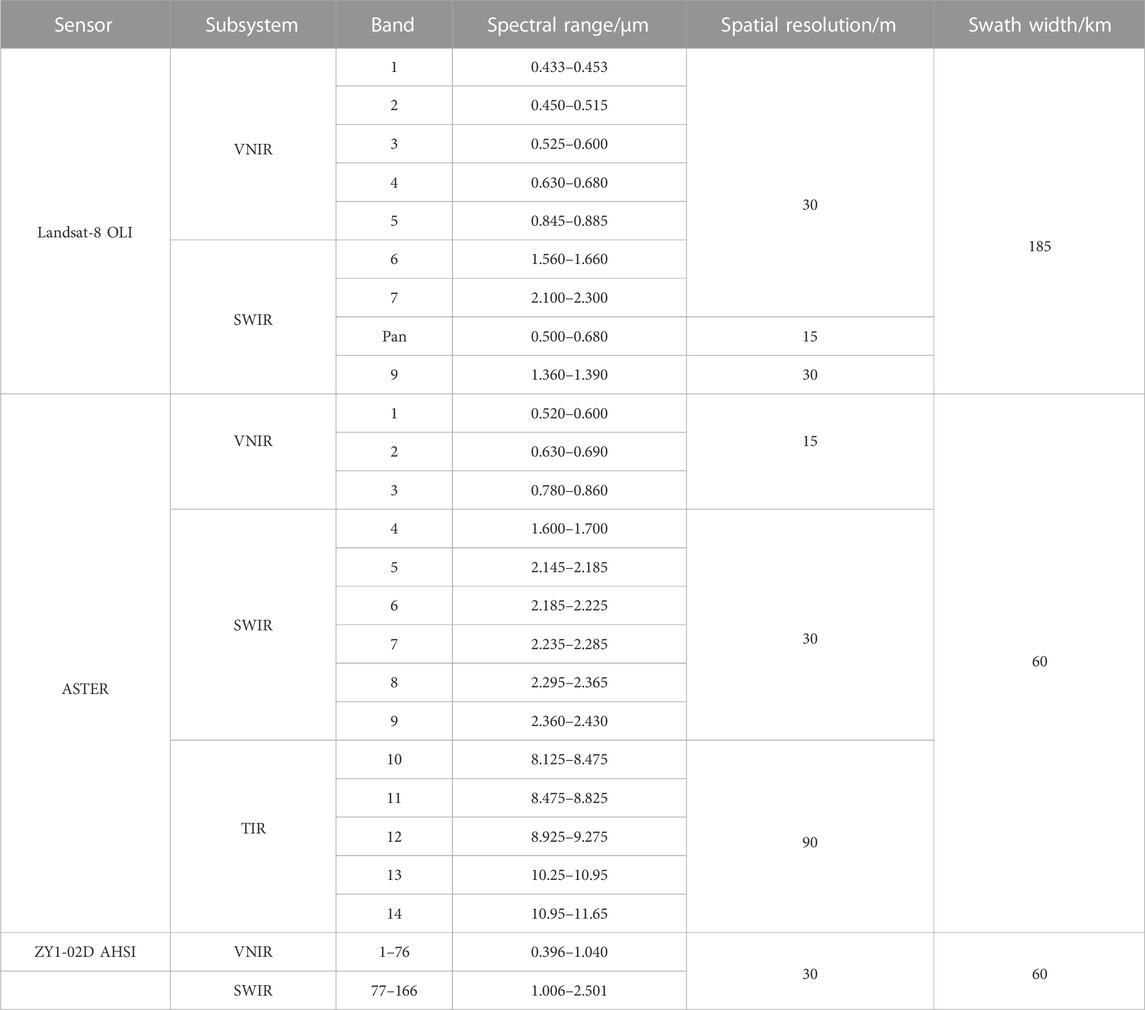
TABLE 1. Technical characteristics of the Landsat-8 OLI, Advanced Spaceborne Thermal Emission and Reflection Radiometer (ASTER), and ZY1-02D AHSI.
The ZY1-02D satellite was launched in China in 2019 and was the first civil hyperspectral operational satellite built and successfully operated by China. The AHSI sensor of the ZY1-02D contains a total of 166 hyperspectral data bands, including VNIR bands with a spectral resolution better than 10 nm and SWIR bands with a spectral resolution better than 20 nm (Table 1). A total of two scenes of ZY1-02D images were used in this study, with imaging taking place on 9 January 2021, and 8 March 2021, both at product level L1A with generally good image quality.
3.2 Data preprocessing
The remote sensing data were first preprocessed; next, the corresponding method was selected for alteration mapping (Figure 3). The preprocessing of multispectral images (Landsat-8 and ASTER) focused on radiometric calibration and atmospheric correction. The ground radiation information obtained by the sensor is subject to a series of systematic errors, such as recording noise and detector errors, in addition to the interference of atmospheric radiation. All these can combine to distort the spectral brightness. Therefore, to obtain accurate radiation information, a quantitative conversion relationship must be established between the sensor output and incident radiation brightness values through radiation calibration. Additionally, radiometric calibration is also a preparatory process for atmospheric correction, which is the process of eliminating these radiometric errors caused by atmospheric influences and inverting the true surface reflectance of the feature (Rumora et al., 2021). ASTER data, for example, must first be packaged in the VNIR and SWIR bands before being resampled for spatial resolution.
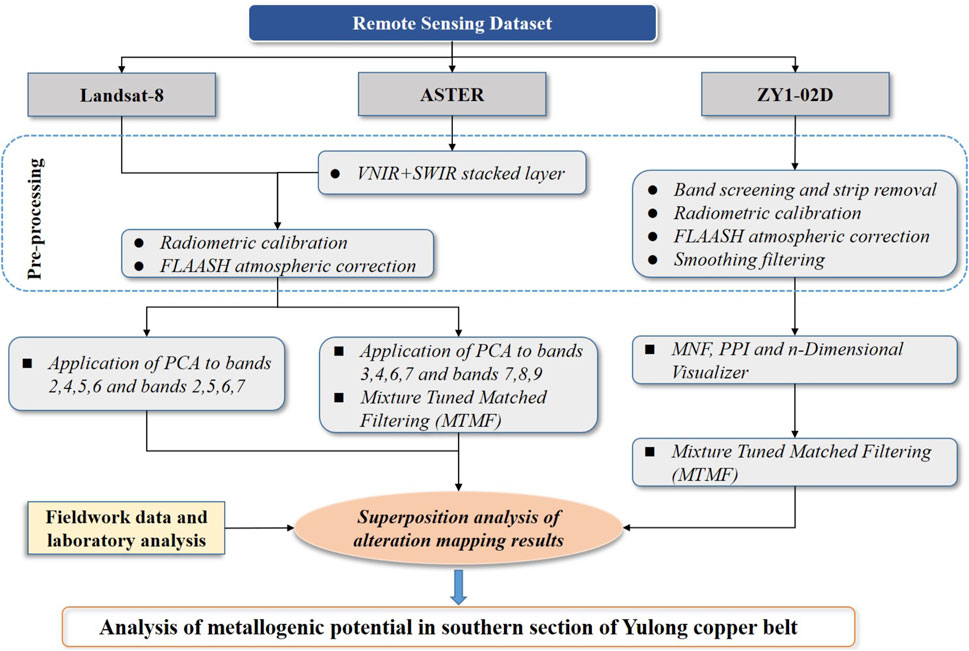
FIGURE 3. Overview of the methodological flowchart used in this study.
For hyperspectral images, in addition to radiometric calibration and atmospheric correction, band screening, strip removal, and smoothing filtering are also required. Band screening is used to eliminate the uncalibrated bands with zero value and the bands that are greatly affected by water vapor and rarely contain ground information in the image pixel while retaining the valid bands. The specific elimination of bands is dependent on different data sources. This ZY1-02D image processing eliminated the coincidence bands VN: 72–76, water vapor influence bands SW: 22–27, 48–59, 82–83, and low signal-to-noise ratio bands: 88–90. Hyperspectral data are affected by the sensor because not only will several bad lines be present but also some bands will have a number of striping effects that seriously affect the quality of the data and its subsequent applications. No bad lines were found in the ZY1-02D data used in this study, although the striping effect was observed after the minimum noise fraction (MNF) rotation. Therefore, a combination of the principal component analysis method and filtering process was used to filter the striping noise. Sometimes, because the instrument signal-to-noise ratio does not work optimally or because of the combined effect of dark current and other interference factors, a certain amount of noise is present in the spectral reflectance of different bands, resulting in the sawtooth characteristics of the reflectance of adjacent bands. Therefore, after completing the radiometric calibration and atmospheric correction, Savitzky–Golay (SG) filtering was used for spectral smoothing. SG filtering is a method based on a local polynomial least-squares fit in the time domain that filters out noise while ensuring that the shape and width of the signal remain unchanged (Savitzky and Golay, 2002). Five left- and right-side points were selected in the filter kernel, and two smoothing polynomials were chosen.
3.3 Principal component analysis
Principal component analysis (PCA) is a dimensionality reduction technique used to simplify data sets (Howari et al., 2020; Sekandari et al., 2020; Sekandari et al., 2022). This technique involves a mathematical transformation of the original data, which are rearranged according to the axes of greatest variability, creating new non-correlated components (Pazand and Pazand, 2022). The lengths of the principal axes are defined by a set of quantities called eigenvalues, which measure the variability of the data along orthogonal directions. The direction of each axis is defined by another set of data called eigenvectors, which define the correlation between the principal components (PCs) and the original bands. Principal component analysis is the most common and stable method used to extract mineralized alteration information. PCA is applied to highlight specific geological content through certain mathematical reorganizations to form principal components that are more reasonable or clearer in their intrinsic connections in multi-spectral data (Guha et al., 2018).
3.4 Mixture-tuned matched filtering
The mixture-tuned matched filtering (MTMF) method (Boardman et al., 1995) was applied for the sub-pixel mapping of target minerals (Modabberi et al., 2017). The MTMF method consists of two parts: the mixed tuning (MT) and matched filtering (MF) phases. The former estimates the subpixel end abundance, while the latter identifies and suppresses pseudo-anomalies (Pour et al., 2018; Noori et al., 2019). This method uses a combination of linear spectral unmixing and matched filtering models that map the target abundances in the presence of unknown spectra of mixed background (Wang et al., 2007). It can maximize the response of known endpoint members and suppress the response of compound unknown backgrounds. The linear spectrum mixing theory is used to constrain the feasible mixing results and reduce the probability of false signals by assuming that the content of each end element in the pixel is positive and the sum is 1. The MF provides a rapid means of detecting specific materials based on matches to library or image endmember spectra and does not require a knowledge of all endmembers within an image scene (Schott, 2007). Furthermore, the MTMF model reduces the detection limit of minerals, thus identifying trace mineral components that are difficult to detect through other methods, and is well suited for the extraction of the abundance of alteration information at the sub-pixel scale (Zhang et al., 2015).
4 Results
4.1 Results of the extraction of alteration information from Landsat-8 data
Landsat-8 image information extraction technology based on principal component analysis (PCA) has been widely used, with its reliability having been verified (Zalaky et al., 2018; Fotze et al., 2019; Sulemana et al., 2020; Ishagh et al., 2021; Jiang et al., 2021). In this study, the traditional empirical method was used based on the Landsat-8 spectral curve corresponding to the different characteristics of iron oxide and hydroxyl-altered minerals. Bands 2, 4, 5, and 6 of Landsat-8 were selected for PCA, and the principal components of bands 2, 5, and 4 with the inverse sign of eigenvector were used to extract iron oxide anomalies (Table 2A). Bands 2, 5, 6, and 7 were selected for PCA, with principal components of bands 5, 6, and 7 being used to extract hydroxyl anomalies (Table 2B).
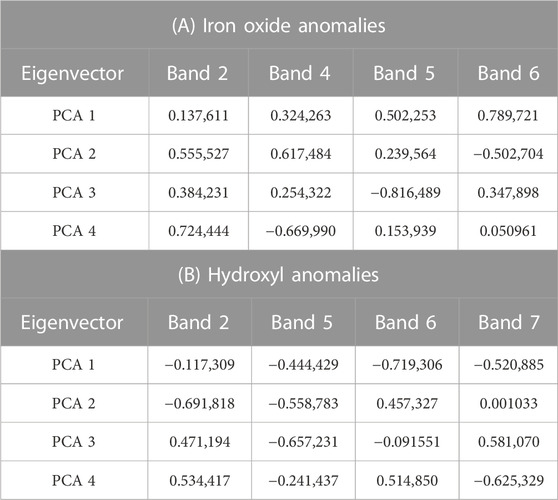
TABLE 2. The eigenvector loading matrix of Landsat-8 bands calculated by principal component analysis to extract iron oxide (A) and hydroxyl (B) anomalies.
The Quick Stats function in ENVI5.3 was used to check the maximum, minimum, and variance of the corresponding principal components of iron oxide and hydroxyl alteration. The alteration classification was then carried out. Generally, the method of “mean + N × standard variance σ)” was adopted to segment the threshold of the principal component anomaly level. For iron oxide anomaly alteration, the N values were 2, 2.5, and 3. For the hydroxyl anomaly information, the N values were 2.5, 3, and 3.5, with iron oxide and hydroxyl anomalies divided into three grades. Finally, the abnormal noise points were removed by median filtering with a threshold of 5, and the alteration information of Landsat-8 was subsequently extracted (Figure 4).
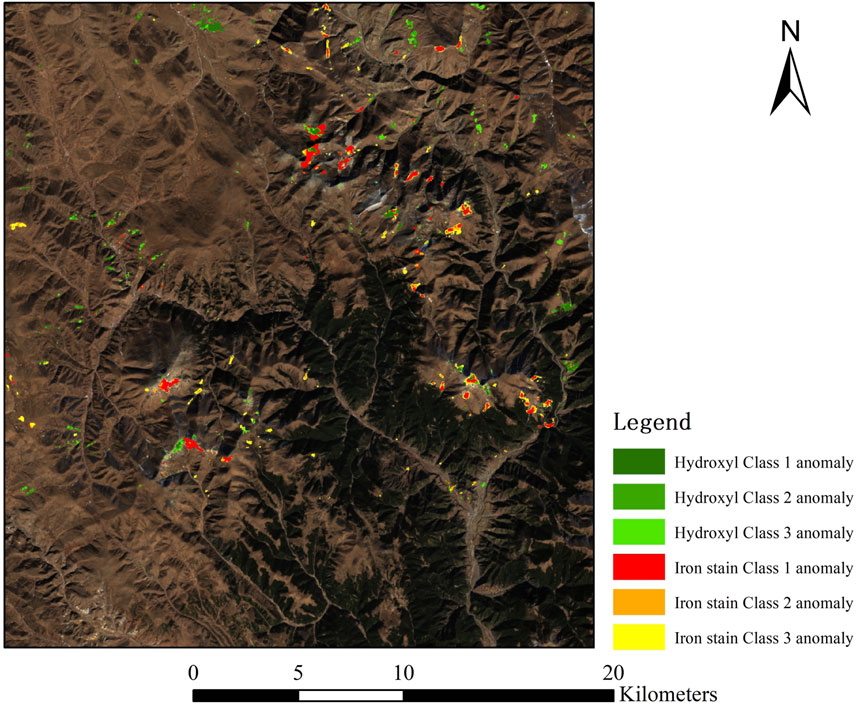
FIGURE 4. Results of the extraction of alteration information from Landsat-8 data.
4.2 Results of the extraction of alteration information from ASTER data
ASTER data have more short-wave infrared (SWIR) bands than Landsat-8, and most hydroxyl alterations have diagnostic absorption characteristics between 2.2 and 2.5 μm of SWIR. A larger number of bands means a higher spectral resolution and a finer distinction can be made for different altered minerals. Figure 5A shows the spectral curves of common altered minerals in the USGS Library, which were resampled to nine bands of ASTER. The Mg hydroxyl minerals, such as chlorite and epidote, along with carbonate minerals such as calcite, have notable absorption characteristics in the eighth band of ASTER. However, Al hydroxyl minerals such as muscovite, illite, and kaolinite have notable absorption characteristics in the sixth band of ASTER. Therefore, in this study, ASTER bands 3, 4, 6, and 7 were selected for PCA, and the principal components of bands 4, 6, and 7 with the inverse sign of eigenvector were used to extract Al hydroxyl anomalies (Table 3A). Previous studies used ASTER bands 7, 8, and 9 to extract carbonate alteration, and bands 1, 3, 4, and 8 or 1, 3, 5, and 8 to extract the Mg hydroxyl alteration. This study considered that the absorption characteristics of chlorite, epidote, and calcite minerals in bands 7, 8, and 9 of ASTER were too similar; therefore, they were not further subdivided. Bands 7, 8, and 9 were selected for PCA, and the principal component of the eigenvector bands 7, 8, and 9 with the inverse sign was used to extract the propylitic alteration (Table 3B).
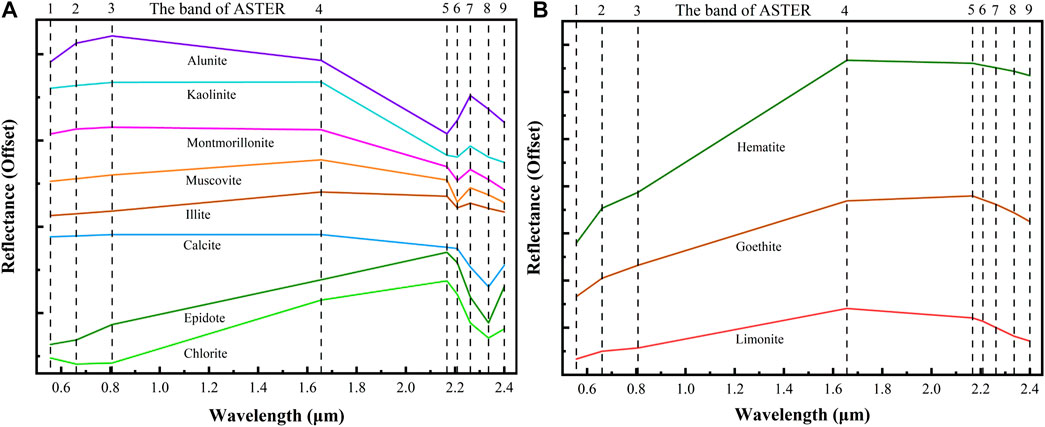
FIGURE 5. Spectral curves of altered minerals in the USGS Library, which are resampled to nine ASTER bands. (A) Spectral curves of common hydroxyl minerals. (B) Spectral curves of iron oxide minerals.
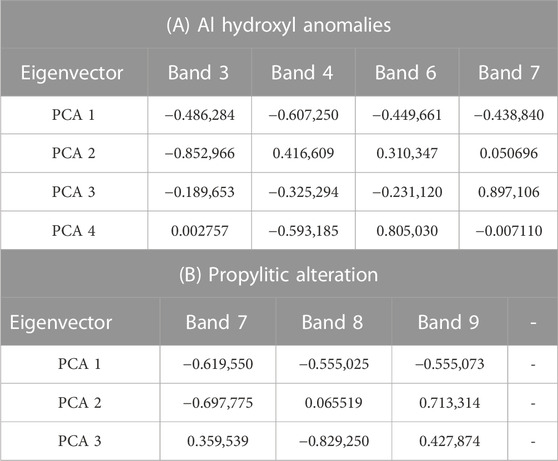
TABLE 3. The eigenvector loading matrix of ASTER bands calculated by principal component analysis to extract Al hydroxyl anomalies (A) and propylitic alterations (B).
Figure 5B shows the nine bands of the ASTER resampling of the standard spectral curve of iron oxide alteration in the USGS Library. For iron stain alteration, PCA extraction is typically performed using ASTER bands 1, 2, 3, and 4. However, the characteristics of the first four bands of iron oxide minerals are not easy to distinguish from other minerals by observing the resampled curve. The actual results also contain many pseudo-anomalies, and the extraction effect is also severe. Therefore, this study did not use the traditional PCA method; rather, the MTMF method was instead adopted to extract iron oxide alteration information from ASTER data. The most advantageous aspect of MTMF over the MF method is the MT stage. The results of MF answer the question of the proportion of existing matter in this pixel; however, MT uses the spectral mixing of a high-dimensional convex geometry model to effectively suppress the appearance of pseudo-anomalies. The results of MT also provide a good answer to the question of how likely it is that the pixel is a mixture of the target substance and the background (Abubakar et al., 2019).
The resampled standard spectral curves of hematite, limonite, and goethite were mapped by MTMF. The MTMF results consisted of matched filtering (MF) scores and infeasibility images for the three endmembers representing alteration regions of hematite, limonite, and goethite. The MF score indicates the sub-pixel abundance of each endmember; however, MT (mixture tuned) must also be used to eliminate pseudo-anomalies (errors) to obtain the exact abundance of iron oxides. This is generally achieved by plotting the MF fraction and infeasibility of the endmember in a 2-D scatter plot. The vertical coordinate represents the MF fraction of the endmember, which ranges from 0 to 1, and represents the proportion of the endmember within a pixel ranging from 0% to 100%. The horizontal coordinate represents its unfeasibility, which should be as low as possible. All pixels with a high MF score value and low infeasibility are circled and areas of interest are generated as the mapping result of this mineral. An MF of the circled area of interest above 0.6 means that each pixel will have more than 60% of this mineral. The results of alteration extraction based on MTMF could more accurately reflect the abnormal data for iron oxide in this region. Figure 6 shows the final results of the alteration mapping from ASTER data.
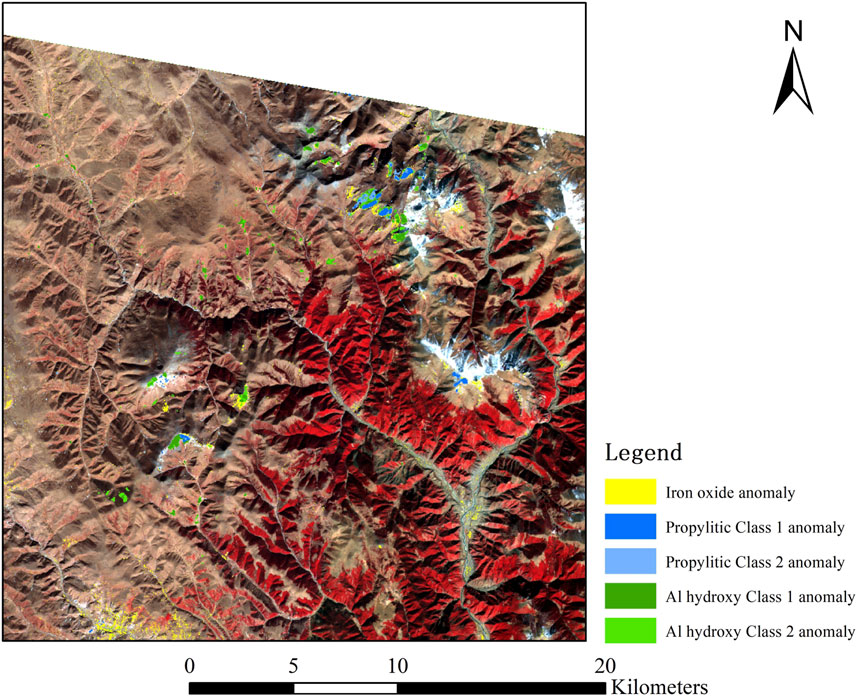
FIGURE 6. Results of the extraction of alteration information from ASTER data.
4.3 Results of the extraction of alteration mineral information from ZY1-02D data
Owing to the low spatial resolution of ZY1-02D remote sensing images, the images generally contain many mixed pixels. The spectral curve of pure pixels is more accurate than the matching standard of the corresponding mineral. Therefore, the first step of the alteration information extraction from the hyperspectral image is the endmember extraction. The minimum noise fraction (MNF) rotation was performed on the pre-processed hyperspectral images. Hyperspectral data have many dimensions and require a huge amount of computation. The MNF rotation tool is used to determine the intrinsic dimensions of image data (i.e., the number of bands), separate the noise in the data, and reduce the computational requirements in subsequent processing (Lorenz et al., 2021). Next, the endmember is extracted based on the pure pixel index (PPI), which is calculated from the results of the MNF transformation. Subsequently, the threshold range is selected to obtain the region of interest from the PPI image. The pixels contained in the region of interest are relatively pure. Finally, the spectral curve of the extracted pure pixel is compared with the standard spectral curve of minerals in the USGS spectrum library, and the mineral type represented by the extracted endmember is finally determined. Two kinds of alteration minerals, white mica and carbonatite, were extracted from the study area. White mica is an umbrella term that usually refers to muscovite, paragonite, illite, illite-montmorillonite, or any coexisting occurrence of these minerals (Dalm et al., 2017). These different white mica species can be distinguished from each other using SWIR in 2.0–2.5 μm, although this is difficult. They all have diagnostic absorption characteristics at approximately 2.2 μm. Furthermore, carbonatite contains calcite and dolomite, which have diagnostic absorption characteristics at approximately 2.35 μm. Figure 7 shows the comparison between the extracted endmember spectra and the standard mineral spectra in the USGS Library.
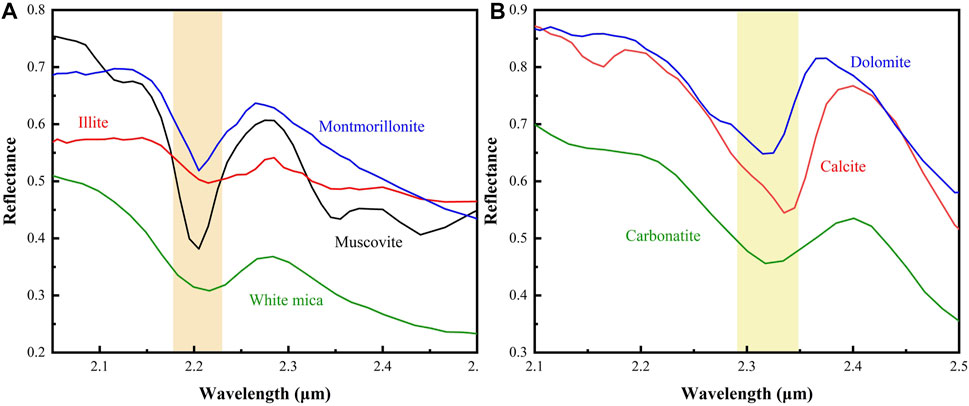
FIGURE 7. Endmember spectra. (A) Spectra of white mica endmember and corresponding minerals in the USGS Library. (B) Spectra of carbonatite endmember and corresponding minerals in the USGS Library.
After extracting the endmember spectra, the next step was alteration mapping. The MTMF method was also used for alteration mapping, although it differed from the previous ASTER mapping. For higher-resolution hyperspectral images, the spectral features can reflect a particular mineral or class of minerals specifically. Therefore, only the MF score band to be considered can be mapped accurately when using MTMF. Meanwhile, the abundance was classified into five levels of 0.1–0.2, 0.2–0.4, 0.4–0.6, 0.6–0.8, and 0.8–1.0 using the characteristics of MTMF based on sub-pixel abundance mapping. The fine classification mapping results of alteration based on hyperspectral data are shown in Figures 8, 9.
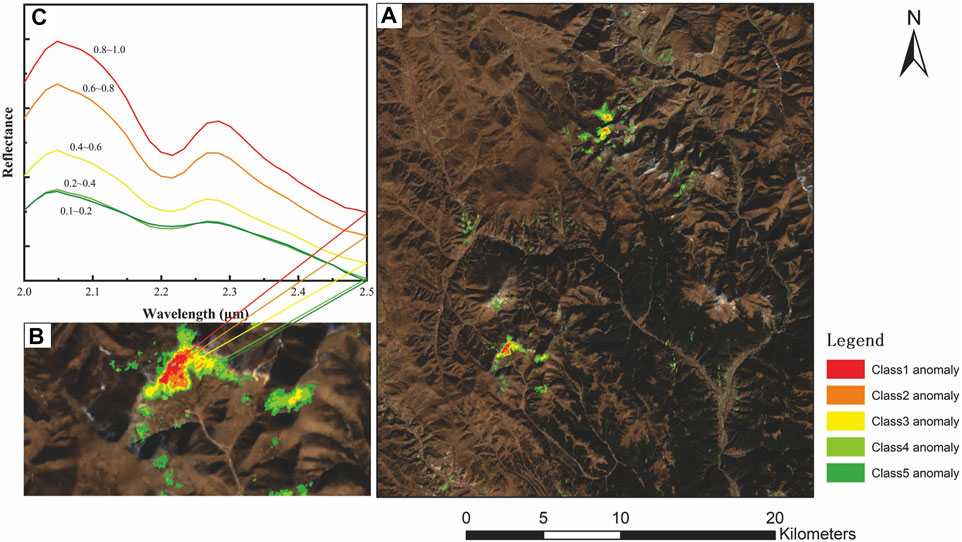
FIGURE 8. (A) Results of mapping of white mica alteration. (B) Partially enlarged details. (C) Typical spectral curves corresponding to different classes.
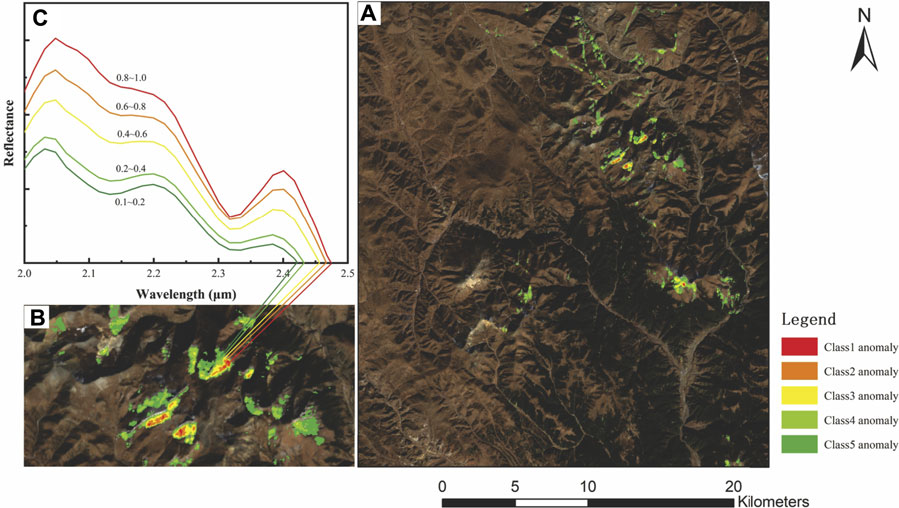
FIGURE 9. (A) Results of carbonatite alteration mapping. (B) Partially enlarged details. (C) Typical spectral curves corresponding to different classes.
5 Discussion
5.1 Analysis of the results of multi-source remote sensing data
In this study, the iron oxide and hydroxyl anomalies in the southern section of the Yulong copper belt were extracted using the traditional PCA method with Landsat-8 multispectral data. They were primarily found in the northeastern, eastern, and center western parts of the study area. Many iron oxide anomalies appeared as small clusters of spots, and the primary strong anomalies and secondary weak anomalies were in concentric rings. The hydroxyl anomalies were smaller in area than the iron oxide anomalies and mostly appeared in conjunction with the iron oxide anomalies, or both overlapped in output.
The ASTER data used in this study were missing for the northern part of the study area. The Al hydroxyl group and the propylitic alteration anomaly were both extracted using the traditional PCA method, while the iron oxide anomaly was extracted using the MTMF method. The selection of areas with a high MF score and low infeasibility values successfully avoided the excessive pseudo-anomalies that would be extracted by PCA. Most of the extracted anomalies appeared as small clusters, with the three anomalies appearing more frequently together in the northeastern part of the study area. ASTER data use more bands than Landsat-8, and the SWIR band can reflect the diagnostic absorption characteristics of many common alteration minerals; therefore, it can better distinguish the Al hydroxyl group and further classify the hydroxyl alteration. In addition, owing to the diagnostic absorption characteristics of Mg hydroxyl and carbonate minerals at band 8 of ASTER, it is possible to extract the propylitic alteration that cannot be identified by Landsat-8.
In this study, a total of two pure endmembers were extracted using ZY1-02D hyperspectral data, which were white mica and carbonate alteration minerals. Jain and Sharma (2019) previously verified that the mapping accuracy of the MTMF algorithm was higher than that of the spectral angle mapping (SAM) algorithm. Therefore, the traditional SAM method was not used in this study; rather, the MTMF method was instead adopted to map altered minerals. MTMF is also a mapping method that is based on a subpixel scale. In this study, the abundance of sub-pixel white mica and carbonatite alterations was categorized into five classes. The classification results were then verified at the pixel scale using the ENVI5.3 Z-profile function. A higher classification represented a higher abundance of alteration mineral sub-pixels contained in one of its pixels. A higher abundance was expressed as a deeper depth of characteristic absorption in the spectral curve of the overall blend of that pixel. Figures 8, 9 show a good correspondence between the different classifications and the corresponding spectral curves. Additionally, the MTMF method can allow the fine mapping of alteration minerals based on the abundance of sub-pixel wells. The results showed that the white mica alteration was mainly distributed in the northern and center-western parts of the study area, while carbonatite was more frequently distributed in the northeastern and eastern parts, with a low output in the middle western part. Hyperspectral data have more bands and a higher spectral resolution to finely delineate the absorption characteristics of each mineral class. Al hydroxyl alterations can be further identified as white mica minerals through hyperspectral analysis. For Mg hydroxyl and carbonate alterations that ASTER cannot accurately distinguish, hyperspectral identification can instead be used to accurately identify carbonate minerals in the area.
Owing to the different types of remote sensing satellite sensors, the data obtained from various types of images within the same study area will differ. In addition, the results of alteration information obtained through different extraction methods will also differ. Therefore, the study of single images or single extraction methods in the same region is often inadequate (Du et al., 2022). Hyperspectral data provide greater advantages for the fine identification of alteration minerals, and the superiority of the MTMF method was verified in this study. Furthermore, multispectral and hyperspectral data were combined with the traditional PCA method and the advanced MTMF method to extract alteration information of the study area to obtain more accurate results. In general, the anomalies extracted by the three data sources were primarily distributed throughout the northeastern, eastern, and middle western parts of the study area. The same types of alteration anomalies extracted from different data corresponded well with the spatial locations (Figure 10).
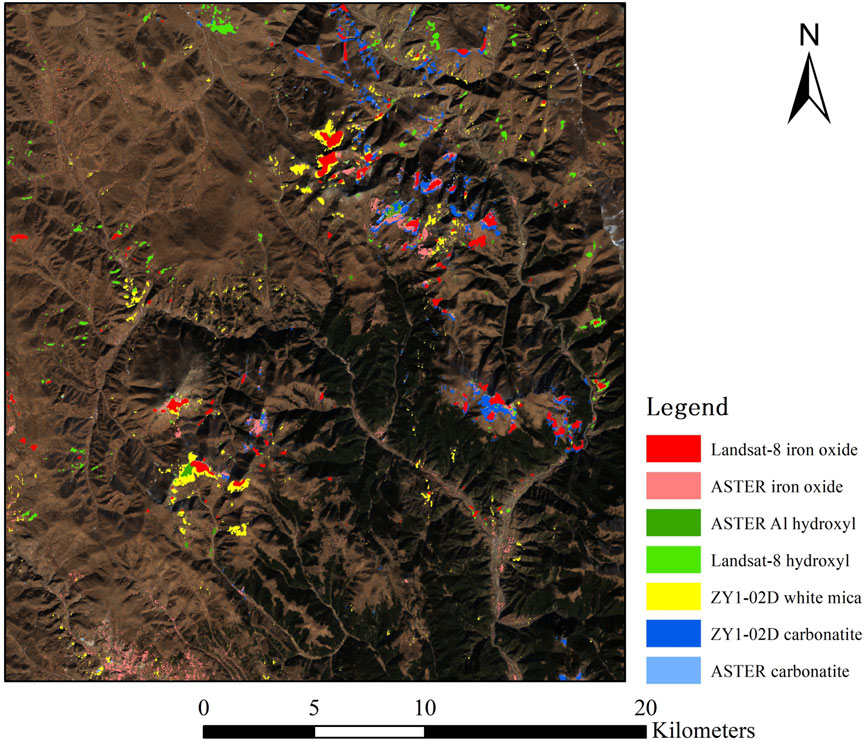
FIGURE 10. Results of the extraction of multi-source remote sensing alteration information in the southern section of the Yulong copper belt.
5.2 Prospect analysis and field verification
The Yulong copper belt is one of the most important metallogenic belts in the Sanjiang area. Porphyry Cu (Mo) and Au (Ag) deposits are common in this area. Porphyry deposits represent the world’s largest repositories of copper and molybdenum and are also major sources of gold and silver. Typically, a central domain of potassic alteration develops in and around the mineralizing stock. This domain is generally the host to high-grade mineralization and is the principal target in porphyry exploration (Cooke et al., 2020). This may be overprinted by sericitic alteration, which tends to be more abundant in porphyry Cu–Mo deposits, whereas chlorite–sericite alterations develop preferentially in porphyry Cu–Au deposits (Sillitoe, 2010). Porphyritic hydrothermal systems may form large lithocaps, which generally have argillic alterations dominated by kaolinite, illite, and montmorillonite and advanced argillic alteration dominated by alunite and dickite (Faesal et al., 2022). In addition, skarn forms in the contact zone between the porphyry intrusion and the regional carbonate rocks due to the contact metamorphism of high-temperature hydrothermal fluids. This may result in the formation of skarn-type deposits in the periphery of the porphyry system. Therefore, the carbonate alteration extracted in this study indicated the possibility of skarn deposits in the porphyry system in the southern section of the Yulong copper belt. The white mica and hydroxyl alterations have certain spatial indication significance for the exploration of porphyry deposits. Iron oxide is closely related to metal mineralization and is an important sign in the search for sulfide deposits (Wei et al., 2010). The comprehensive results indicated that the overlapping alteration areas in the east, north, and southwest of the study area are optimal prospecting areas.
The field verification showed that the alteration characteristics in the north, west, and southwest regions of the study area corresponded with the Secuo, Jicuo, and Mamupu mining areas in the Yulong copper belt, respectively. The Secuo mining area also had skarn, which is a porphyry-skarn-type deposit. Furthermore, the ASD spectrometer was used to measure the samples collected in the field, and the measured spectrum was compared with the USGS standard spectrum (Figure 11). The carbonate and white mica minerals identified by the hyperspectral satellite were verified in the field. Iron oxides also have obvious absorption characteristics in the near-infrared band. The accuracy of remote sensing extraction of alteration information was verified through field observations. In addition, the large amounts of alteration in the western region of the Secuo mining area and in the eastern part of the study area could be the subjects of further studies.
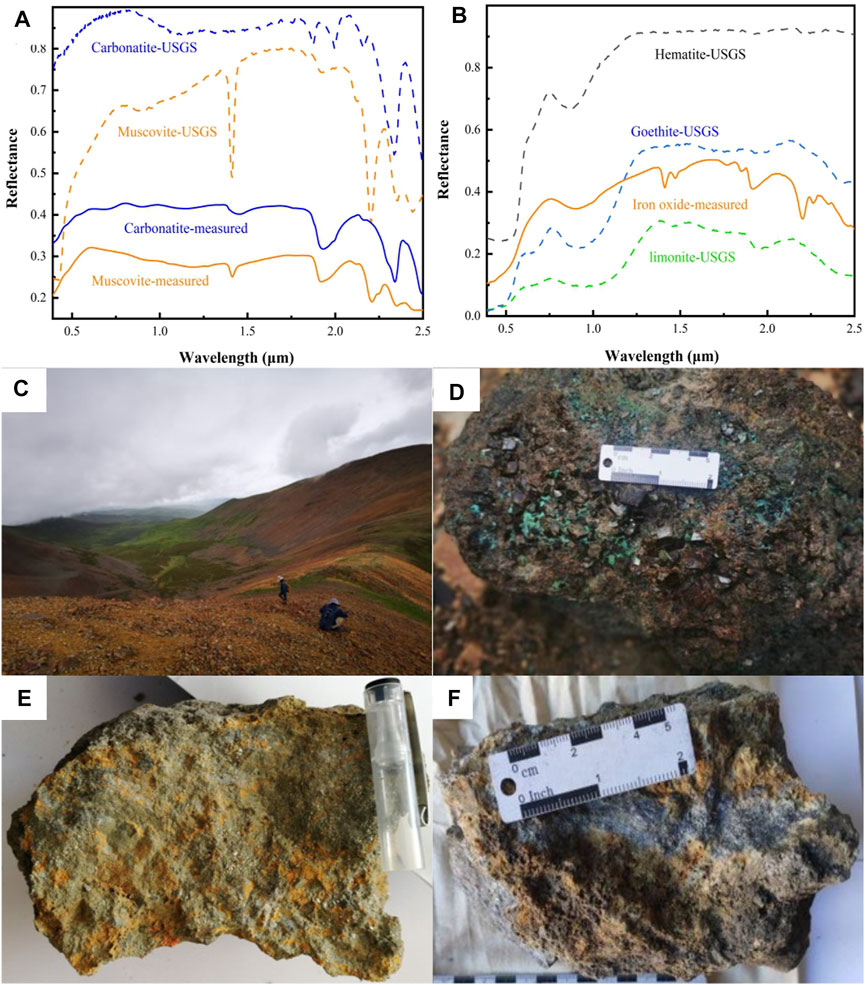
FIGURE 11. Field-measured spectrum and field verification photos. (A) Comparison of the spectra of muscovite and carbonate minerals measured in the field with USGS standard spectra. (B) Comparison between the field-measured iron oxide mixture spectrum and USGS standard spectra. (C) Iron oxide anomaly in the Secuo mining area. (D) Skarn in the Secuo mining area. (E) Au orebody in southern Jicuo. (F) Galena vein in southern Jicuo.
5.3 Limitations and prospects
Based on multi-source remote sensing data, this study carried out alteration mapping of the southern section of the Yulong metallogenic belt. These research results have significance as a reference for the selection of remote sensing data sources and image processing methods in other regions. However, the data used in this study were space remote sensing data, which are characterized by low resolution and are easily affected by the atmosphere. For example, the spatial resolution of Landsat-8 and ZY1-02D is only 30 m. This is unfavorable for the fine mapping of alteration minerals. Owing to the limitation of remote sensing data sources, this study could only map the southern section of the Yulong mineralized belt on a large regional scale. In the future, high spatial resolution and high spectral resolution airborne remote sensing can be further used for the fine mapping of key areas of potential mineralization, which may lead to more meaningful discoveries. In addition, the field validation performed only field spectra measurements and related petrographic analyses. XRD experiments that can accurately analyze the mineral composition are yet to be tested.
6 Conclusion
1. As an important part of the Yulong copper belt, the southern section of the Yulong copper belt is a prospective area with good mineralization potential; however, its current exploration is low. In addition, selecting appropriate remote sensing data and the best mapping method are also challenges. Therefore, it is important to use multi-source remote sensing data to analyze the mineralization-favorable areas in the southern section of the Yulong copper belt and compare the advantages and disadvantages of different data and methods.
2. The results of this study confirmed that hyperspectral remote sensing more accurately identified mineral species compared to multispectral remote sensing by comparing the extraction methods and extraction results of different data sources. Compared with the traditional methods, the MTMF method showed greater superiority in alteration mapping. Meanwhile, the extraction results of the multi-source remote sensing data were superimposed to analyze the mineral search potential of the southern section of the Yulong copper belt. The field validation results also proved the accuracy of the extraction results of alteration information based on multi-source remote sensing data.
3. Owing to the limitation of the resolution of remote sensing data sources, only the preliminary alteration zoning mapping can be carried out in a large area. In the future, it is necessary and more meaningful to use remote sensing data with higher spatial and spectral resolution to carry out detailed mineral subclass identification and mapping research.
Data availability statement
The original contributions presented in the study are included in the article/Supplementary Material. Further inquiries can be directed to the corresponding author.
Author contributions
CW was responsible for part of the data processing and paper writing; JD provided ideas for the paper and supervised the writing; ZARGL, LH, BT, and WL were responsible for sampling and data analysis; TZ and LB were responsible for data acquisition and part of the data processing. All authors contributed to the article and approved the submitted version.
Funding
This study was funded by the National Key Research and Development Program of China (2022YFC2905001), the National Natural Science Foundation of China (42172332), the Horizontal Project of Zhongkai Mineral Industry Co., Ltd., Tibet (HE2226), the Fundamental Research Funds for the Institute of Mineral Resources, the Chinese Academy of Geological Sciences (KK2102), and the China Geological Survey Project (DD20230054, DD20230033).
Acknowledgments
The authors would like to thank Editage (www.editage.com) for English language editing.
Conflict of interest
Author BT and WL were employed by Zhongkai Mineral Industry Co., Ltd., Tibet.
The remaining authors declare that the research was conducted in the absence of any commercial or financial relationships that could be construed as a potential conflict of interest.
The authors declare that this study received funding from Zhongkai Mineral Industry Co., Ltd., Tibet. The funder had the following involvement in the study: data collection and analysis.
Publisher’s note
All claims expressed in this article are solely those of the authors and do not necessarily represent those of their affiliated organizations, or those of the publisher, the editors, and the reviewers. Any product that may be evaluated in this article, or claim that may be made by its manufacturer, is not guaranteed or endorsed by the publisher.
References
Aali, A. A., Shirazy, A., Shirazi, A., Pour, A. B., Hezarkhani, A., Maghsoudi, A., et al. (2022). Fusion of remote sensing, magnetometric, and geological data to identify polymetallic mineral potential zones in chakchak region, yazd, Iran. Remote Sens. 14 (23), 6018. doi:10.3390/rs14236018
Abubakar, A. J. A., Hashim, M., and Pour, A. B. (2019). Remote sensing satellite imagery for prospecting geothermal systems in an aseismic geologic setting: Yankari Park, Nigeria. Int. J. Appl. Earth Observation Geoinformation 80, 157–172. doi:10.1016/j.jag.2019.04.005
Alimohammadi, M., Alirezaei, S., and Kontak, D. J. (2015). Application of ASTER data for exploration of porphyry copper deposits: A case study of daraloo-sarmeshk area, southern part of the kerman copper belt, Iran. Ore Geol. Rev. 70, 290–304. doi:10.1016/j.oregeorev.2015.04.010
Atif, Y., Soulaimani, A., Ait lamqadem, A., Pour, A. B., Pradhan, B., Nouamane, E. A., et al. (2022). Identifying hydrothermally altered rocks using ASTER satellite imageries in eastern anti-atlas of Morocco: A case study from imiter silver mine. Int. J. Image Data Fusion 13 (4), 337–361. doi:10.1080/19479832.2021.1958928
Boardman, J. W., Kruse, F. A., and Green, R. O. (1995). Mapping target signatures via partial unmixing of AVIRIS data. Summ. Fifth JPL Airborne Earth Sci. Workshop 1, 23–26.
Bolouki, S. M., Ramazi, H. R., Maghsoudi, A., Beiranvand Pour, A., and Sohrabi, G. (2019). A remote sensing-based application of Bayesian networks for epithermal gold potential mapping in Ahar-Arasbaran Area, NW Iran. Remote Sens. 12 (1), 105. doi:10.3390/rs12010105
Cardoso-Fernandes, J., Teodoro, A. C., and Lima, A. (2019). Remote sensing data in lithium (Li) exploration: A new approach for the detection of Li-bearing pegmatites. Int. J. Appl. Earth Observation Geoinformation 76, 10–25. doi:10.1016/j.jag.2018.11.001
Chen, J. P., Tang, J. X., Cong, Y., Dong, Q. J., and Hao, J. H. (2009). Geological characteristics and metallogenic model in the Yulong porphyry copper deposit, East Tibet. Acta Geol. Sin. 83 (12), 1887–1900.
Chen, X. L., Huang, W. T., Zou, Y. Q., Liang, H. Y., Zhang, J., and Zhang, Y. Q. (2016). Zircon U-Pb geochronology and geochemistry of ore-bearing porphyries in the southern Yulong porphyry copper belt, and factors resulting in the differences in scale of mineralization between the southern and northern Yulong porphyry copper belt. Acta Petrol. Sin. 32 (8), 2522–2534.
Clark, R. N., Swayze, G. A., Wise, R. A., Livo, K. E., Hoefen, T. M., Kokaly, R. F., et al. (2007). USGS spectral library splib06a: US geological survey. Digital data series 231. Available at: http://speclab.cr.usgs.gov/spectral-lib.html.
Cooke, D. R., Agnew, P., Hollings, P., Baker, M., Chang, Z., Wilkinson, J. J., et al. (2020). Recent advances in the application of mineral chemistry to exploration for porphyry copper–gold–molybdenum deposits: Detecting the geochemical fingerprints and footprints of hypogene mineralization and alteration. Geochem. Explor. Environ. Anal. 20 (2), 176–188. doi:10.1144/geochem2019-039
Dai, J. J., Wang, D. H., and Wang, H. Y. (2019). A review of the three type rare mineral resources survey in China using remote sensing. Acta Geol. Sin. 93 (06), 1270–1278. doi:10.19762/j.cnki.dizhixuebao.2019155
Dai, J. J., Zhao, L. X., Jiang, Q., Wang, H. Y., and Liu, T. Y. (2020). Review of thermal-infrared spectroscopy applied in geological ore exploration. Acta Geol. Sin. 94 (8), 2520–2533. doi:10.19762/j.cnki.dizhixuebao.2020172
Dalm, M., Buxton, M. W. N., and Van Ruitenbeek, F. J. A. (2017). Discriminating ore and waste in a porphyry copper deposit using short-wavelength infrared (SWIR) hyperspectral imagery. Miner. Eng. 105, 10–18. doi:10.1016/j.mineng.2016.12.013
Du, X. C., Lou, D. B., Zhang, C. Q., Xu, L. G., Liu, H., et al. (2022). Study on extraction of alteration information from GF-5, Landsat8 and GF-2 remote sensing data: A case study of ningnan lead-zinc ore concentration area in sichuan province. Mineral. Deposits 41 (04), 839–858. doi:10.16111/j.0258-7106.2022.04.011
El-Desoky, H. M., Shebl, A., Abdel-Rahman, A. M., Fahmy, W., El-Awny, H., El-Sherif, A. M., et al. (2022). Multiscale mineralogical investigations for mineral potentiality mapping of ras el-kharit-wadi khashir district, southern eastern desert, Egypt. Egypt. J. Remote Sens. Space Sci. 25 (4), 941–960. doi:10.1016/J.EJRS.2022.09.001
Faesal, A., Aminuddin, M. I. K. A., and Ubaidillah, A. S. (2022). Host rock petrology, hydrothermal alteration characteristics & ore mineralogy of porphyry copper-gold deposit, Brambang, Lombok, West Nusa Tenggara Indonesia. Mater. Today Proc. 66, 3071–3076. doi:10.1016/J.MATPR.2022.07.373
Fotze, Q. M. A., Lordon, A. E. D., Penaye, J., Sep, J. P., and Fru, M. I. N. (2019). Mapping hydrothermal alteration targets from Landsat 8 OLI/TIRS and magnetic data using digital image processing techniques in Garoua, North Cameroon. J. Geosciences 7 (1), 28–41. doi:10.12691/jgg-7-1-4
Gersman, R., Ben-Dor, E., Beyth, M., Avigad, D., Abraha, M., and Kibreab, A. (2008). Mapping of hydrothermally altered rocks by the EO-1 Hyperion sensor, northern Danakil depression, Eritrea. Int. J. Remote Sens. 29 (13), 3911–3936. doi:10.1080/01431160701874587
Guha, S., Govil, H., Tripathi, M., and Besoya, M. (2018). Evaluating crosta technique for alteration mineral mapping in malanjkhand copper mines, India. The international archives of photogrammetry. Remote Sens. Spatial Inf. Sci. 42, 251–254. doi:10.5194/isprs-archives-XLII-5-251-2018
Hajaj, S., El Harti, A., Jellouli, A., Pour, A. B., Himyari, S. M., Hamzaoui, A., et al. (2023). HyMap imagery for copper and manganese prospecting in the east of Ameln valley shear zone (Kerdous inlier, Western Anti-Atlas, Morocco). J. Spatial Sci., 1–22. doi:10.1080/14498596.2023.2172085
Howari, F. M., Ghrefat, H., Nazzal, Y., Galmed, M. A., Abdelghany, O., Fowler, A. R., et al. (2020). Delineation of copper mineralization zones at wadi ham, northern Oman mountains, united Arab emirates using multispectral landsat 8 (OLI) data. Front. Earth Sci. 8, 578075. doi:10.3389/FEART.2020.578075
Huang, W. X., Zhang, L. M., Si, X. L., Xu, H. Y., Chen, H. Y., Li, X., et al. (2020). On-orbit performance evaluation of on-board calibration component of GF-5 visible and infrared multispectral imager. Acta Opt. Sin. 40 (20), 2029001. doi:10.3788/AOS202040.2029001
Ishagh, M. M., Pour, A. B., Benali, H., Idriss, A. M., Reyoug, S. A. S., Muslim, A. M., et al. (2021). Lithological and alteration mapping using landsat 8 and ASTER satellite data in the reguibat shield (west african craton), north of Mauritania: Implications for uranium exploration. Arabian J. Geosciences 14 (23), 2576. doi:10.1007/S12517-021-08846-X
Jain, R., and Sharma, R. U. (2019). Airborne hyperspectral data for mineral mapping in Southeastern Rajasthan, India. Int. J. Appl. Earth Observation Geoinformation 81, 137–145. doi:10.1016/j.jag.2019.05.007
Jiang, Q., Dai, J. J., Wang, D. H., and Tian, S. F. (2021). Application of optical remote sensing to identifying granite pegmatite lithium deposits. Mineral. deposits 40 (04), 793–804. doi:10.16111/j.0258-7106.2021.04.009
Lin, B., Wang, L., Tang, J., Song, Y., Cao, H., Baker, M. J., et al. (2018). Geology, geochronology, geochemical characteristics and origin of Baomai porphyry Cu (Mo) deposit, Yulong Belt, Tibet. Ore Geol. Rev. 92, 186–204. doi:10.1016/j.oregeorev.2017.10.025
Liu, L., Li, Y., Zhou, J., Han, L., and Xu, X. L. (2018). Gold-copper deposits in wushitala, southern tianshan, northwest China: Application of ASTER data for mineral exploration. Geol. J. 53 (SI2), 362–371. doi:10.1002/gj.2989
Liu, L., Zhou, J., Jiang, D., Zhuang, D. F., Mansaray, R. L., and Zhang, B. (2013). Targeting mineral resources with remote sensing and field data in the Xiemisitai area, West Junggar, Xinjiang, China. Remote Sens. 5 (7), 3156–3171. doi:10.3390/rs5073156
Lorenz, S., Ghamisi, P., Kirsch, M., Jackisch, R., Rasti, B., and Gloaguen, R. (2021). Feature extraction for hyperspectral mineral domain mapping: A test of conventional and innovative methods. Remote Sens. Environ. 252, 112129. doi:10.1016/j.rse.2020.112129
Modabberi, S., Ahmadi, A., and Tangestani, M. H. (2017). Sub-pixel mapping of alunite and jarosite using ASTER data; a case study from north of Semnan, north central Iran. Ore Geol. Rev. 80, 429–436. doi:10.1016/j.oregeorev.2016.07.014
Noori, L., Pour, A. B., Askari, G., Taghipour, N., Pradhan, B., Lee, C. W., et al. (2019). Comparison of different algorithms to map hydrothermal alteration zones using ASTER remote sensing data for polymetallic vein-type ore exploration: Toroud–Chahshirin Magmatic Belt (TCMB), North Iran. Remote Sens. 11 (5), 495. doi:10.3390/rs11050495
Pazand, K., and Pazand, K. (2022). Identification of hydrothermal alteration minerals for exploring porphyry copper deposit using ASTER data: A case study of varzaghan area, NW Iran. Geol. Ecol. Landscapes 6 (3), 217–223. doi:10.1080/24749508.2020.1813371
Pour, A. B., and Hashim, M. (2015). Hydrothermal alteration mapping from Landsat-8 data, Sar Cheshmeh copper mining district, south-eastern Islamic Republic of Iran. J. Taibah Univ. Sci. 9 (2), 155–166. doi:10.1016/j.jtusci.2014.11.008
Pour, A. B., Park, T. Y. S., Park, Y., Hong, J. K., Zoheir, B., Pradhan, B., et al. (2018). Application of multi-sensor satellite data for exploration of Zn–Pb sulfide mineralization in the Franklinian Basin, North Greenland. Remote Sens. 10 (8), 1186. doi:10.3390/rs10081186
Roy, D. P., Wulder, M. A., Loveland, T. R., Woodcock, C. E., Allen, R. G., Anderson, M. C., et al. (2014). Landsat-8: Science and product vision for terrestrial global change research. Remote Sens. Environ. 145, 154–172. doi:10.1016/j.rse.2014.02.001
Rui, Z. Y., Huang, C. K., Qi, G. M., Xu, J., and Zhang, H. T. (1984). The porphyry Cu (Mo) deposits in China. Beijing: Geological Publishing House.
Rumora, L., Miler, M., and Medak, D. (2021). Contemporary comparative assessment of atmospheric correction influence on radiometric indices between Sentinel-2A and Landsat 8 imagery. Geocarto Int. 36 (1), 13–27. doi:10.1080/10106049.2019.1590465
Savitzky, A., and Golay, M. J. E. (2002). Smoothing and differentiation of data by simplified least squares procedures. Anal. Chem. 36 (8), 1627–1639. doi:10.1021/ac60214a047
Schott, J. R. (2007). Remote sensing. The image Chain approach. 2nd. New York: Oxford University Press, 688.
Sekandari, M., Masoumi, I., Pour, A. B., Muslim, A. M., Hossain, M. S., and Misra, A. (2022). ASTER and WorldView-3 satellite data for mapping lithology and alteration minerals associated with Pb-Zn mineralization. Geocarto Int. 37 (6), 1782–1812. doi:10.1080/10106049.2020.1790676
Sekandari, M., Masoumi, I., Pour, A. B., Muslim, A. M., Rahmani, O., Hashim, M., et al. (2020). Application of landsat-8, sentinel-2, ASTER and WorldView-3 spectral imagery for exploration of carbonate-hosted Pb-Zn deposits in the central Iranian terrane (CIT). Remote Sens. 12 (8), 1239. doi:10.3390/rs12081239
Shirazi, A., Hezarkhani, A., Pour, A. B., Shirazy, A., and Hashim, M. (2022). Neuro-fuzzy-AHP (NFAHP) technique for copper exploration using advanced Spaceborne thermal emission and reflection radiometer (ASTER) and geological datasets in the sahlabad mining area, east Iran. Remote Sens. 14 (21), 5562. doi:10.3390/rs14215562
Sillitoe, R. H. (2010). Porphyry copper systems. Econ. Geol. 105 (1), 3–41. doi:10.2113/gsecongeo.105.1.3
Sulemana, I. A., Quaye-Ballard, J., Ntori, C., Awotwi, A., Adeyinka, O. M., Okrah, T. M., et al. (2020). Location mapping of hydrothermal alteration using landsat 8 data: A case of study in prestea huni valley district, Ghana. Int. J. Geogr. Geol. 9 (1), 13–37. doi:10.18488/journal.10.2020.91.13.37
Tommaso, I. D., and Rubinstein, N. (2006). Hydrothermal alteration mapping using ASTER data in the Infiernillo porphyry deposit, Argentina. Ore Geol. Rev. 32, 275–290. doi:10.1016/j.oregeorev.2006.05.004
Wang, R. S., Yang, S. M., and Yan, B. K. (2007). A review of mineral spectral identification methods and models with imaging spectrometer. Remote Sens. Nat. Resour. (01), 1–9.
Wei, Y. M., Yang, D. G., and Luo, C. (2010). Limonitization that cannot be ignored in ore prospecting. Jilin Geol. 29 (03), 66–67.
Wu, W. Z., Xia, B., Zhang, Y. Q., Dong, B. H., and Xia, Z. X. (2013). Geochemical characteristics and metallogenic mechanism of the porphyry Cu-Mo deposits in the Yulong ore belt, eastern Tibet: A case study of the Yulong and duoxiasongduo porphyries. Geotect. Metallogenia 37 (3), 440–454. doi:10.16539/j.ddgzyckx.2013.03.013
Zalaky, A., Essam, M., and Arafy, A. (2018). Assessment of band ratios and feature-oriented principal component selection (FPCS) techniques for iron oxides mapping with relation to radioactivity using landsat 8 at Bahariya Oasis. Egypt Res. 10 (4), 1–10. doi:10.7537/marsrsj100418.01
Zhang, B., Zheng, Y., Li, Q. Y., et al. (2017). Remote sensing anomaly information extraction method based on OLI remote sensing data. J. Henan Polytech. Univ. Nat. Sci. 36 (3), 47–53. doi:10.16186/j.cnki.1673-9787.2017.03.008
Zhang, C., Ye, F. W., Xu, Q. J., Liu, H. C., and Meng, S. (2015). Extraction of alteration information from SASI hyperspectral images based on MTMF. Geol. Rev. 61 (S1), 428–429.
Keywords: Yulong copper belt, alteration information extraction, Landsat-8, ASTER, ZY1-02D, mixture-tuned matched filtering
Citation: Wu C, Dai J, Zhou A, He L, Tian B, Lin W, Zhao T and Bai L (2023) Mapping alteration zones in the Southern section of Yulong copper belt, Tibet using multi-source remote sensing data. Front. Earth Sci. 11:1164131. doi: 10.3389/feart.2023.1164131
Received: 12 February 2023; Accepted: 05 May 2023;
Published: 23 May 2023.
Edited by:
Claudia Belviso, National Research Council (CNR), ItalyReviewed by:
Yusen Dong, China University of Geosciences Wuhan, ChinaAmin Beiranvand Pour, INOS University Malaysia Terengganu, Malaysia
Copyright © 2023 Wu, Dai, Zhou, He, Tian, Lin, Zhao and Bai. This is an open-access article distributed under the terms of the Creative Commons Attribution License (CC BY). The use, distribution or reproduction in other forums is permitted, provided the original author(s) and the copyright owner(s) are credited and that the original publication in this journal is cited, in accordance with accepted academic practice. No use, distribution or reproduction is permitted which does not comply with these terms.
*Correspondence: Jingjing Dai, ZGFpamluZ2ppbmc4NjNAc2luYS5jb20=