 Delin Li
 Ziniu Xiao
 Jianjun Xu
 Liang Zhao
- 1South China Sea Institute of Marine Meteorology, Guangdong Ocean University, Zhanjiang, China
- 2State Key Laboratory of Numerical Modeling for Atmospheric Sciences and Geophysical Fluid Dynamics, Institute of Atmospheric Physics, Chinese Academy of Sciences, Beijing, China
- 3Shenzhen Research Institute of Guangdong Ocean University, Shenzhen, China
- 4Joint Laboratory for Marine Meteorology, China Meteorological Administration-Guangdong Ocean University, Zhanjiang, China
The impacts of solar activity on the tropical Pacific climate have been widely reported. However, few studies focus on the effects of solar activity on the tropical cyclone (TC). Based on the observational and reanalysis data for 1979–2020, this study investigated the solar modulation of TC frequency over the western North Pacific in different solar cycle phases. Results suggest that the regressions of TC frequency to solar activity are asymmetric in the high- and low-solar activity years (HS and LS). Specifically, the intensified solar activity could markedly induce more TCs in HS; however, no significant modulation can be found in LS. Further exploration reveals a possible air–sea coupled mechanism for this interesting phenomenon. The relatively cloud-free area in the western North Pacific could receive more incoming solar radiation at the surface in HS than in LS. This increased regional surface net solar radiation in HS could produce a stronger surface upward latent heat flux and, thus, greater evaporation. Along with that, the local upward motion is dramatically enhanced over the TC source. Then, for compensation, the regional sea level pressure is reduced, and the low-level winds become cyclonic over the TC origin. All of these solar-caused regional atmospheric anomalies in HS contribute to more TC generations. The key to this possible mechanism is the increased regional solar forcing at the ocean surface that is amplified by regionally enhanced upward latent heat flux and evaporation.
1 Introduction
A tropical cyclone (TC) is an intense warm-cored cyclonic vortex that generates over tropical oceans. The rainstorm, strong breeze, storm surge, and other disastrous weather conditions induced by TCs often bring serious economic losses and casualties to the affected areas. TCs generally form on the ocean surface with a high sea surface temperature (SST) exceeding 26.5°C and suitable dynamic conditions such as low-level pressure disturbance and weak tropospheric vertical wind shear (Gray, 1968). The western North Pacific, including the South China Sea, is the most important source region of TCs. Due to the influence and restriction of large-scale air–sea backgrounds, the TC frequency over the western North Pacific is characterized by seasonal, interannual, and interdecadal variations (Chan, 2005; Li and Zhou, 2018; Zhan et al., 2019). The generation of TCs could be influenced by some large-scale air–sea coupled systems over the tropical Pacific inside the climate system, such as the ENSO, Intertropical Convergence Zone, and western Pacific subtropical high. Meanwhile, previous studies have reported that, as the external forcing of the earth system, solar activity can significantly affect these systems that are closely tied to TC formation. For instance, the peak of the 11-year solar cycle in the tropical Pacific showed a La Nina-like event, and the Intertropical Convergence Zone and local Hadley cell were strengthened (van Loon et al., 2004; 2007; van Loon and Meehl, 2008; Meehl et al., 2008; Bal et al., 2011). While Roy and Haigh (2010) reported that the El Nino-like pattern appeared in the tropical Pacific with increased solar forcing at an interannual timescale, Huo et al. (2021) and Wang et al. (2019) found a lagged El Nino Modoki in response to decadal solar peaks. Duan (2008) pointed out that, in solar cycle peaks, the East Asian summer monsoon intensified, and the western Pacific subtropical high strengthened and shifted westward. Based on these aforementioned factors, it suggests that solar activity might modulate TC generation by affecting the regional air–sea conditions over the tropical Pacific.
It is believed that the contribution of solar activity to weather and climate change cannot be ignored (Haigh, 1996; Gray et al., 2010; Xiao et al., 2017). Based on satellite observations, the solar radiation output in a quasi-11-year solar cycle varies by approximately 1% (Kopp and Lean, 2011). Previous studies have revealed the marked responses of tropical Pacific air–sea systems to the initially small solar forcing; thus, there must exist the amplification mechanisms of solar forcing on the tropical Pacific, namely, the “top–down” solar ultraviolet radiation mechanism and the “bottom–up” total solar irradiance mechanism (Meehl et al., 2009; Gray et al., 2010). In the “top–down” mechanism, stratospheric ozone can dramatically respond to the solar ultraviolet variability, changing the thermal and dynamic conditions in the stratosphere, and then, the solar signal can be amplified and transferred downward to the troposphere by the wave mean flow interactions (Kodera and Kuroda, 2002; Haigh et al., 2005; Haigh and Blackburn, 2006; Matthes et al., 2006; Kodera et al., 2016; Li et al., 2019). In the “bottom–up” mechanism, due to the greater solar energy input at the ocean surface in the cloud-free areas, the small solar irradiance variability can be manifested by the dynamic air–sea coupling over the tropical-to-subtropical Pacific (van Loon et al., 2004; van Loon et al., 2007; Meehl et al., 2008). The combined effects of the “top–down” and “bottom–up” mechanisms can amplify the initially small solar variability and cause significant changes in the tropical Pacific air–sea systems.
The generation of TCs over the western North Pacific depends on the thermal and dynamic conditions over the tropical Pacific. The impacts of solar activity on the tropical Pacific climate have been widely investigated in many previous studies. Understanding the modulation of solar activity on a severe air–sea coupled system such as TC is important. However, little attention has been paid to the solar effect on TCs over the western North Pacific. Tian (2005) pointed out that in low (high)-solar activity years, more TCs were generated in the western North Pacific when the quasi-biennial oscillation was in the westerly (easterly) phase. Based on the observations from 1977 to 2016, Kim et al. (2017) found that in the solar maximum period, compared with the solar minimum period, TCs over the western North Pacific tended to form southward and eastward and lasted longer with lower central pressure. The recent work of Li et al. (2023) indicated that in El Niño (La Niña) years during declining (ascending) phases of the solar cycle, strong positive (negative) TC genesis frequency anomalies occurred in the southeastern part of the western North Pacific. We, thus, notice that there are no specialized studies on solar effects on TC generations over the western North Pacific.
Despite previous efforts, there may still be a lack of information revealing the specific influence of solar activity on TCs over the western North Pacific. Therefore, the present study focuses on the solar modulation of the TC frequency over the western North Pacific and the possible mechanism. Section 2 describes the data and method used in this analysis. In Section 3, we examine the asymmetric relationship between solar activity and TC frequency in different solar phases and try to further explain the mechanism. We end with a brief conclusion and discussion in Section 4.
2 Data and methods
2.1 Data
On the one hand, TC activity over the western North Pacific may enter a new period after the abrupt climate change that occurred in the mid-late 1970s. On the other hand, considering the higher credibility and accuracy of satellite observations since 1979, we selected the period 1979–2020 for analysis. The best-track data of TCs over the western North Pacific, including the South China Sea, for the period 1979–2020 were obtained from the China Meteorological Administration (CMA) Tropical Cyclone Data Center (http://tcdata.typhoon.org.cn) (Ying et al., 2014; Lu et al., 2021). Similar to most previous studies, we used the sunspot number (SSN) as solar activity proxy data. Monthly SSNs could be downloaded from the World Data Center Sunspot Index and Long-term Solar Observations (SILSO) of the Royal Observatory of Belgium (http://sidc.oma.be/silso/). The gridded monthly data of sea level pressure (SLP), wind, Ω, total cloud cover, surface upward latent heat flux, and precipitable water of the entire atmosphere for 1979–2020 with 2.5° × 2.5° horizontal resolution were taken from the National Centers for Environmental Prediction/Department of Energy (NCEP/DOE) Reanalysis II dataset (Kanamitsu et al., 2002). The monthly gridded SST analysis was based on the Met Office Hadley Centre Sea Ice and Sea Surface Temperature (HadISST) dataset (Rayner et al., 2003) with 1° × 1° horizontal resolution for the same period. The Nino 3.4 index (mean SSTs over 5°S–5°N latitudes and 170°–120°W longitudes) calculated by the HadISST dataset was used to represent ENSO variability.
2.2 Methods
The high-solar activity years and low-solar activity years are defined depending on whether the SSN is higher or lower than the mean value. The correlation and regression analyses were adopted to examine the asymmetric relationship between solar activity and TC frequency over the western North Pacific. The linear trends of these gridded meteorological data were removed before analysis. When investigating the solar asymmetric impacts on the air–sea backgrounds for TC generation, the ENSO signal was removed from the meteorological variables to avoid its interference in the tropics. First, the linear regression of the original variable field against the standardized Nino 3.4 index is performed to get the ENSO-related field. Second, the ENSO-related field is subtracted from the original variable field to get the meteorological variable without the ENSO signal.
3 Results
3.1 Asymmetric relationship between solar activity and tropical cyclone frequency over the western North Pacific
The time series of yearly SSN and yearly TC frequency for the period 1979–2020 are shown in Figure 1. The SSN varies with a quasi-11-year cycle, spanning from the solar cycle 21 to 24. The TC frequency is characteristic of interannual and interdecadal variations. There are some similarities between the variations of SSN and TC frequency in Figure 1, especially on the interdecadal timescale. Notably, the correlation coefficient between yearly SSN and TC frequency is 0.329 at a 95% confidence level, suggesting that stronger solar activity might induce more TCs over the western North Pacific.
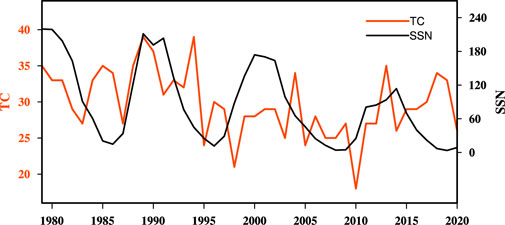
FIGURE 1. Time series of the annual mean SSN (black) and yearly TC frequency (red) for the period 1979–2020.
Divided by the mean value of the SSN, the whole 42 years from 1979 to 2020 are stratified into HS (18 years) and LS (24 years). HS and LS are listed in Table 1. Table 2 shows the average TC number over the western North Pacific and the average SSN in HS and LS. Although the average TC frequency in HS (30.72) is higher than that in LS (29.12), their difference (1.6) is not very significant. To compare the relationships between solar activity and TC frequency in different solar cycle phases, the standardized yearly TC frequency is linearly regressed on the standardized yearly SSN in HS and LS, respectively (Figure 2A). As shown in Figure 2A, the regression coefficient between yearly SSN and TC frequency in HS is 0.883 with a 99% confidence level, while the regression coefficient in LS is merely 0.263 without reaching a high level of significance. Considering over 60% of TCs generated in July–August–September (JAS), we employ the same analyses in JAS (Figure 2B). Similar asymmetric results can be noticed in Figure 2B. The regression coefficient of JAS TC frequency against SSN in the whole period is 0.260 at a 90% confidence level, and the regression in HS is 0.885 with a 99% confidence level, whereas the regression in LS is insignificant (r = 0.055). This investigation reveals that the responses of TC frequency over the western North Pacific to solar activity are asymmetric. Specifically, the increased solar activity could markedly induce more TCs over the western North Pacific in HS, while no significant modulation can be found in LS.

TABLE 1. HS and LS for the period 1979–2020. The number in bracket represents the total of HS (LS).
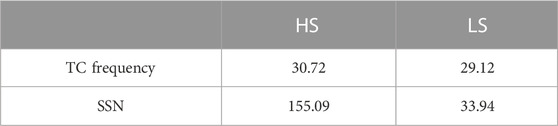
TABLE 2. Average TC frequency over the western North Pacific and the average SSN in HS and LS.
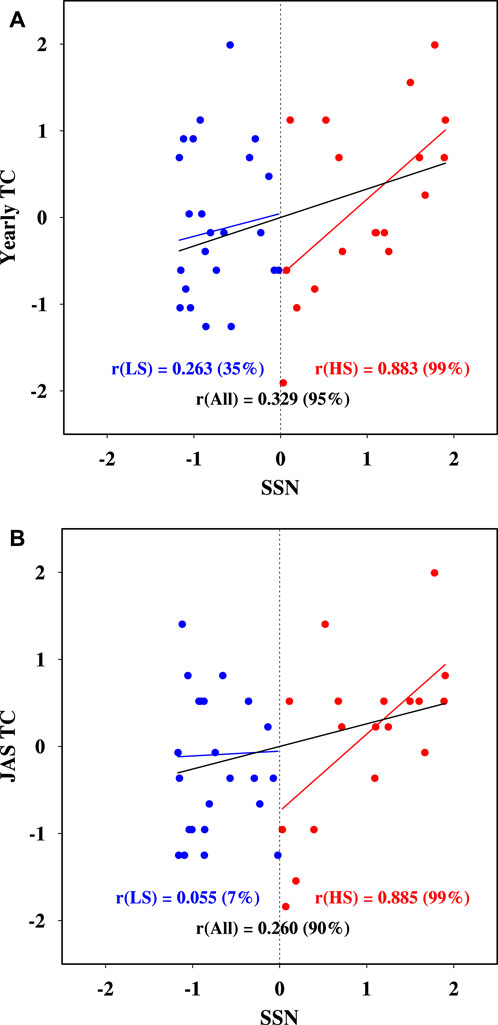
FIGURE 2. (A) Scatterplot of standardized yearly SSN and yearly TC frequency in HS (red) and LS (blue). The three lines indicate the regression lines of TC frequency on the SSN in the whole period (black), HS (red), and LS (blue), respectively. Here, “r” represents the slope of the regression line. (B) Same as (A) but for the JAS TC frequency.
3.2 Asymmetric modulation of solar activity on tropical cyclone generation over the western North Pacific
Since the asymmetric responses of JAS TC frequency to solar activity are also very striking, we focus on JAS in this section for convenience. In order to compare solar asymmetric modulation on TC generation in HS and LS, we first need to clarify the basic air–sea conditions that are closely connected to TC frequency for 1979–2020. The linear trends of these gridded meteorological variables were removed before analysis. Several important large-scale air–sea backgrounds related to JAS TC generation are exhibited in Figure 3.
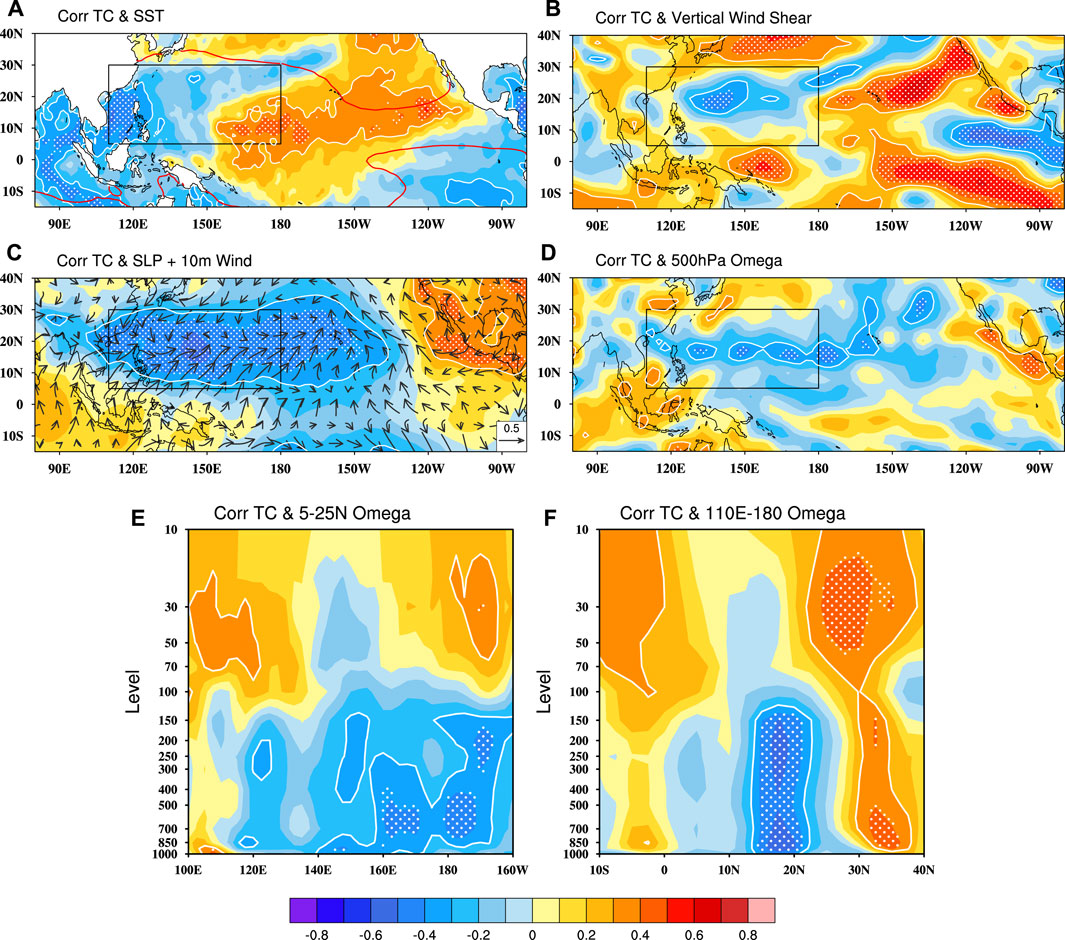
FIGURE 3. Correlations between JAS TC frequency and JAS (A) SST, (B) vertical wind shear, (C) SLP and 10 m wind (arrows), (D) 500 hPa Ω, (E) 5°–25°N meridional-mean Ω, and (F) 110°E–180° zonal-mean Ω for 1979–2020. Correlation coefficients above the 99% (95%) confidence level are indicated by white dots (white contours). The black box represents the TC origin (5°–30°N, 110°E–180°). Red contours in (A) denote the climatological SST exceeding 26.5°C.
The SST is an indispensable thermal condition for TC formation, and the correlations of JAS SST with TC frequency are shown in Figure 3A. Within the TC origin (black box in Figure 3A), the significant positive correlations appear in the central tropical Pacific and the significant negative correlations appear in the South China Sea. Meanwhile, the SSTs in the TC source sector exceed the threshold value of 26.5°C (red contours in Figure 3A). It indicates that, as long as the basic SST condition (≥26.5°C) is satisfied, the local SST anomalies might have little impact on TC frequency over the western North Pacific.
The tropospheric vertical wind shear, also known as convection ventilation, is an important influence factor for TC generation. The weak vertical wind shear can facilitate the concentration of potential heat in a limited space and, thus, prompt the formation of a TC warm core. Following the work of Chen and Ding (1979), the vertical wind shear is represented by the absolute value of the weighted average zonal wind of the upper part of the troposphere (600–200 hPa) minus that of the lower part (1000–600 hPa). As displayed in Figure 3B, the remarkable weaker vertical wind shear appears over the main TC source region, suggesting the weaker vertical wind shear contributes to TC formation.
The atmospheric circulation anomalies are crucial to the formation and development of TC. Figure 3C exhibits the correlations of JAS SLP and 10 m wind with TC frequency. The TC-related lower SLP markedly occupies the whole TC origin, and anomalous cyclonic circulation at 10 m lies over the western North Pacific. It is without doubt that the lower SLP and anomalous low-level wind convergence are conducive to the formation of an initial low-pressure disturbance for TC. Furthermore, the correlations between JAS TC frequency and 500 hPa Ω are shown in Figure 3D. The marked negative correlations are present over the main TC origin. Moreover, the cross sections of correlations of JAS 5°–25°N meridional-mean and 110°E–180° zonal-mean Ω with TC frequency are displayed in Figures 3E,F. We can see the pronounced negative Ω appearing over the main TC source region in the whole troposphere. It indicates that the stronger ascending motion could facilitate TC generation.
Therefore, among these air–sea backgrounds, the weaker tropospheric vertical wind shear, the lower SLP, the anomalous low-level wind convergence, and the stronger upward motion can actually contribute to more TC generations over the western North Pacific. In addition, the regional SST anomalies do not affect TC formation when reaching the threshold value (≥26.5°C) of the thermal condition.
In Section 3.1, we find that solar modulation on TC frequency over the western North Pacific is asymmetric, but the reason for this interesting phenomenon remains to be explained. We will detect the asymmetric influences of solar activity on the air–sea backgrounds of TC generation and further illustrate why the regression of TC frequency to solar activity is much more significant in HS than in LS. Ruzmaikin (1999) pointed out that, as a stochastic driver, the ENSO can make the solar forcing on climate feasible. Hence, before analysis, the ENSO signal was removed from the meteorological variables to avoid its interference in the tropics.
Figure 4 provides the regressions for JAS SST against standardized SSN in HS and LS, respectively. In HS, the significant colder SST responses appear in the west of the TC origin, and the pronounced warmer SST responses lie in the north of the TC origin (Figure 4A). In LS, the whole TC source region is occupied by negative regressions, and few significant areas are present in the TC origin (Figure 4B). Both the climatological SSTs in HS and LS exceed the threshold value (≥26.5°C). The roles of these local SST anomalies in HS and LS in TC formation might be unnecessary. Combined with Figure 3A, it suggests that the solar influence on regional SST cannot explain the solar asymmetric modulation on TC frequency over the western North Pacific.
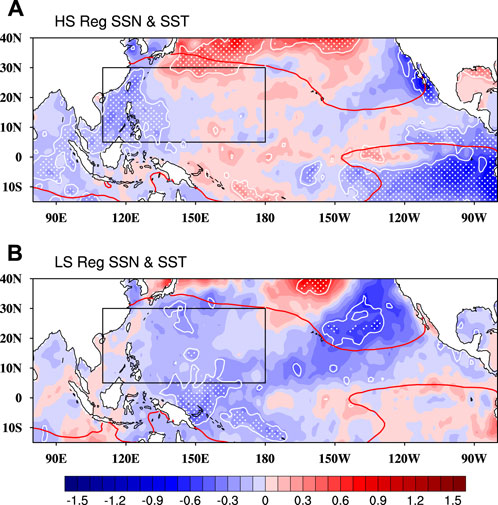
FIGURE 4. Regressions for JAS SST (unit: °C) (with the ENSO signal removed) against standardized SSN in (A) HS and (B) LS. Regression coefficients above the 95% (90%) confidence level are highlighted by white dots (white contours). The black box indicates the source region of TC. Red contours in (A) and (B), respectively, denote the climatological SST exceeding 26.5°C in HS and LS.
The responses of JAS tropospheric vertical wind shear to standardized SSN in HS and LS are shown in Figure 5. In LS, the significant enhanced vertical wind shear lies over the central-east part of the TC source, and the markedly weakened vertical wind shear appears over the northwest and southwest of the TC origin (Figure 5B). In HS, few pronounced responses can be observed within the TC source (Figure 5A). It indicates that the solar impacts on tropospheric vertical wind shear cannot be the reason for solar asymmetric modulation on TC frequency over the western North Pacific.
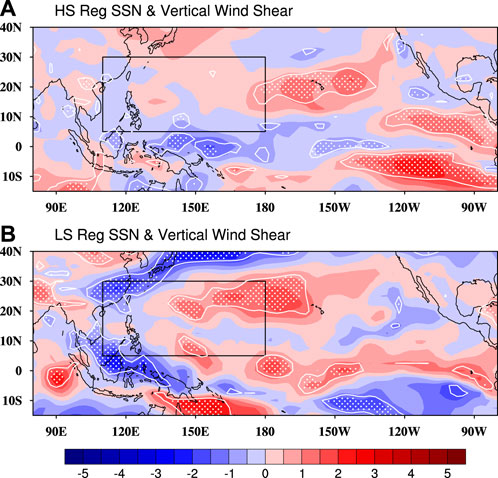
FIGURE 5. Same as Figure 4 but for the regressions of vertical wind shear (unit: m/s) against standardized SSN in (A) HS and (B) LS.
To examine the solar asymmetric impacts on near-surface atmospheric circulation, the regressions for JAS SLP and 10 m wind against standardized SSN in HS and LS are presented in Figure 6. In HS, the remarkable negative SLP anomalies with a maximum reduction of 1 hPa, together with the anomalous cyclonic wind at 10 m, occupy the central-west part of the TC origin (Figure 6A). However, neither a significant response of SLP nor abnormal near-surface wind convergence can be noticed in the TC source in LS (Figure 6B). As displayed in Figure 6A, the SSN-induced lower SLP and near-surface cyclonic wind anomaly in HS are conducive to TC generation, which could be one of the reasons for the distinct solar modulation on TC frequency in HS.
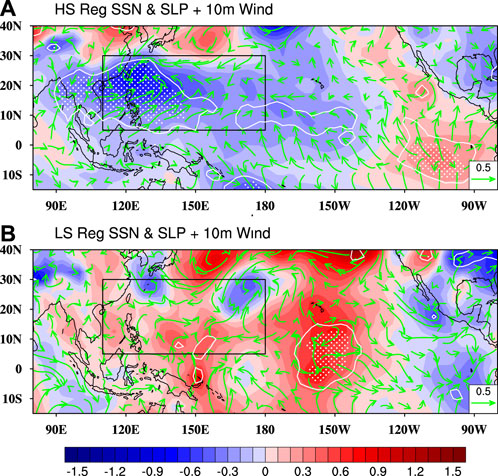
FIGURE 6. Same as Figure 4 but for the regressions of SLP (color shading, unit: hPa) and 10 m wind (green arrows, unit: m/s) against standardized SSN in (A) HS and (B) LS.
In order to reveal the solar asymmetric modulation on the tropospheric vertical wind over the western North Pacific, Figure 7 and Figure 8 exhibit the responses of JAS 500 hPa Ω, 5°–25°N meridional-mean, and 110°E–180° zonal-mean Ω to standardized SSN in HS and LS. In HS, the significant negative 500 hPa Ω anomalies with a maximum reduction of 2 x 10⁻² Pa/s dominate the main TC origin sector (Figure 7A), and this anomalous local upward motion can avail the TC formation. In LS, the significant areas are small and scattered in the TC source (Figure 7B). In addition, as shown in the cross sections in Figure 8, the prominent enhanced upward motions appear over (13°–23°N, 140°E–175°W) in the whole troposphere in HS, whereas no significant features can be observed over the TC origin in LS. Results indicate that the noteworthy solar asymmetric effects on the regional vertical motion over the TC source could be one of the main reasons for solar asymmetric modulation on the TC frequency.
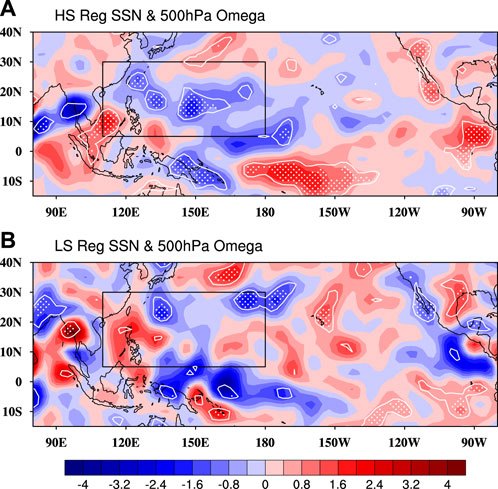
FIGURE 7. Same as Figure 4 but for the regressions of 500 hPa Ω (unit: 10−2 Pa/s) against standardized SSN in (A) HS and (B) LS.
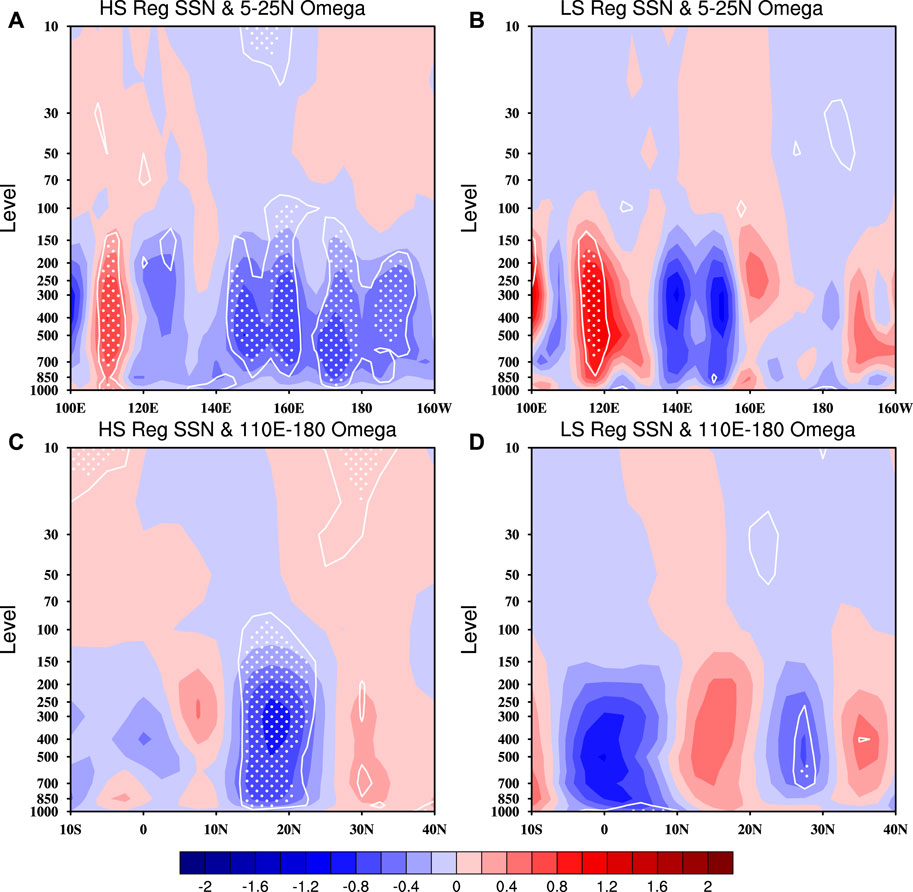
FIGURE 8. Same as Figure 4 but for the regressions of 5°–25°N meridional-mean Ω against standardized SSN in (A) HS and (B) LS; the regressions of 110°E–180° zonal-mean Ω against standardized SSN in (C) HS and (D) LS. Unit: 10−2 Pa/s.
To sum up, in HS, the increased solar activity could significantly produce lower SLP, low-level cyclonic wind anomalies, and anomalous upward motion over the TC origin, all of which are conducive to TC generation. However, no obvious features can be found in LS. In other words, the remarkable and sensitive responses of regional atmospheric circulation to solar activity in HS are crucial to explaining solar asymmetric modulation on TC frequency over the western North Pacific. Based on that, we will focus on why this marked solar signal in local circulation only shows up in HS to further clarify the possible mechanism.
3.3 Possible air–sea coupled mechanism
In Section 3.2, we find an interesting phenomenon that the western North Pacific might be a sensitive area for solar effects on atmospheric circulation in HS. To detect the particularity of this area, we first give the climatological June–October (JJASO) total cloud cover for 1979–2020 in Figure 9A. It is worth noting that relatively less total cloud cover (<55%) than surrounding subtropics and tropics appears over (10°–30°N, 120°E–180°) within the TC source region. It is a cloud-free area. Then, Figure 9B shows the climatological JJASO surface net solar radiation flux for 1979–2020. The relatively higher net solar radiation flux at the surface (>220 W/m2) can be observed over the region (10°–30°N, 120°E–180°) that finely lies in the TC origin. The region of increased surface net solar radiation corresponds perfectly with this cloud-free area (Figure 9). Hence, we hypothesize that this relatively cloud-free area could facilitate more incoming solar radiation at the surface over the TC source in HS than that in LS, subsequently causing regional changes in air–sea backgrounds over the western North Pacific.
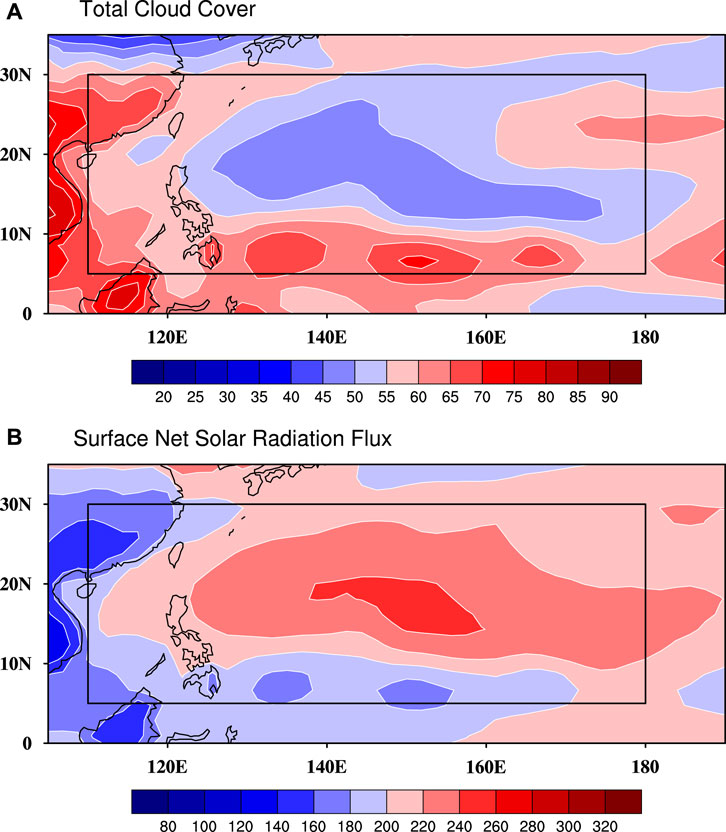
FIGURE 9. Climatological JJASO (A) total cloud cover (unit: %) and (B) surface net solar radiation flux (unit: W/m2, downward is positive) for 1979–2020. The black box represents the TC origin (5°–30°N, 110°E–180°).
Furthermore, the responses of JAS surface upward latent heat flux and precipitable water for the entire atmosphere (with the ENSO signal removed) against standardized SSN in HS and LS are displayed in Figure 10. The significant intensified surface upward latent heat flux on the order of 9–15 W/m2 is located in the central region of the TC source in HS (Figure 10A). While in LS, most of the TC origin shows weakened upward latent heat flux (Figure 10B). The precipitable water in the entire atmosphere can represent the amount of water vapor contained in the air column. In HS, the precipitable water for the entire atmosphere increases markedly in the TC origin, with the maximum anomaly exceeding 2.5 kg/m2 (Figure 10C). However, no marked features can be found in LS (Figure 10D). It indicates the evaporation is dramatically intensified in HS compared to LS. Along with the solar-induced stronger upward latent heat flux and greater evaporation at the ocean surface in the TC source in HS (Figures 10A,C), the local upward motion is visibly enhanced (Figure 7A; Figure 8A,C). Then, for compensation, the regional SLP is reduced and the low-level winds become cyclonic (Figure 6A), resulting in more TCs over the western North Pacific in HS.
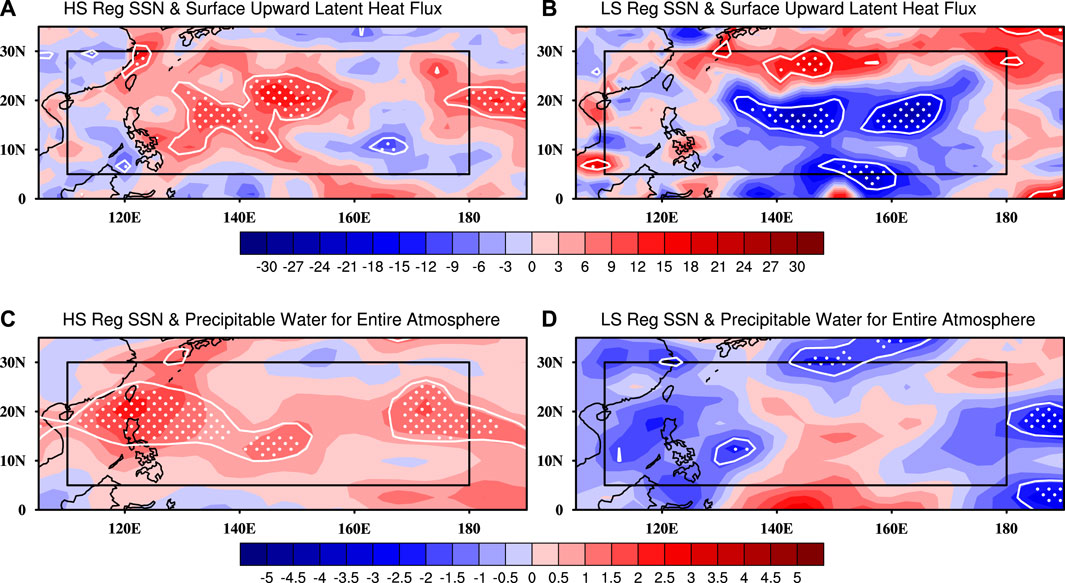
FIGURE 10. Regressions of JAS surface upward latent heat flux (unit: W/m2, upward is positive) against standardized SSN in (A) HS and (B) LS; Regressions of JAS precipitable water for the entire atmosphere (unit: kg/m2) against standardized SSN in (C) HS and (D) LS. The ENSO signal was removed from these meteorological variables before analyzing. Regression coefficients above the 95% (90%) confidence level are highlighted by white dots (white contours). The black box indicates the TC origin.
Based on these analyses, we finally provide a schematic illustration for the possible air–sea coupled mechanism of this significant solar modulation on TC frequency over the western North Pacific in HS (Figure 11). The relatively cloud-free area over the western North Pacific could absorb more incoming solar radiation at the surface in HS than in LS (Figure 11A). This increased surface net solar radiation in HS could produce a stronger surface upward latent heat flux and, thus, greater evaporation over the TC source (Figure 11B). Along with that, the local upward motion is visibly strengthened (Figure 11C). Then, the regional SLP is reduced, and the low-level winds become cyclonic over the TC origin (Figure 11C). All of these solar-caused anomalies in atmospheric circulation in HS are in favor of TC generation over the western North Pacific.
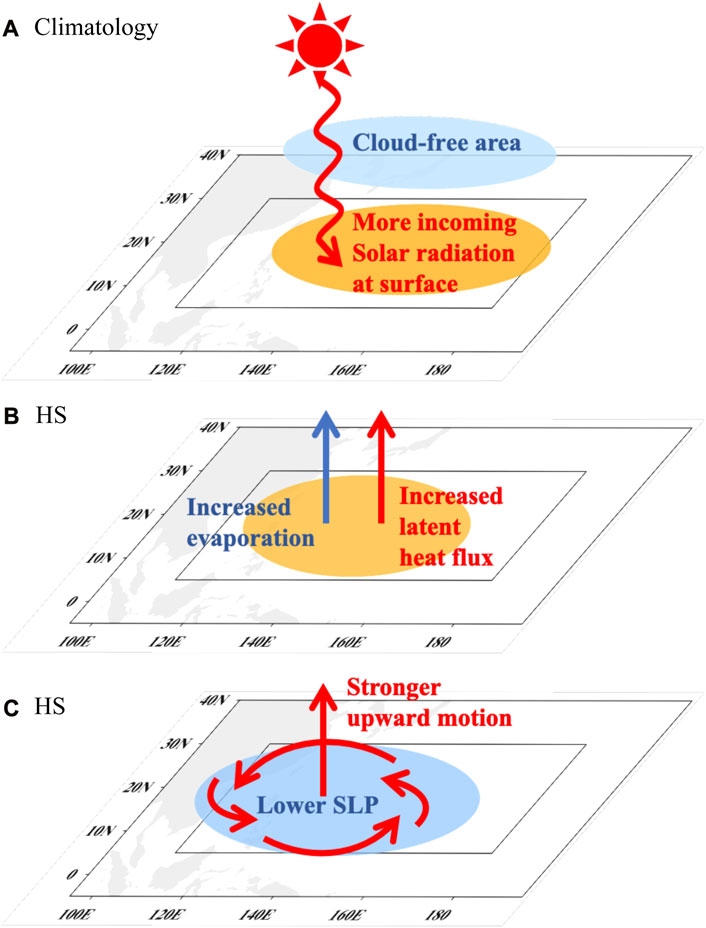
FIGURE 11. Schematic illustration for the possible air–sea coupled mechanism of the significant solar modulation on TC frequency over the western North Pacific in HS. (A) Climatological total cloud cover and downward solar radiation at the surface. (B) Solar-induced regional increased surface upward latent heat flux and evaporation in HS. (C) Solar-caused anomalous local atmospheric circulation (low-level cyclonic wind convergence, lower SLP, and stronger upward motion) in HS. The black box represents the TC source region.
This possible mechanism involves the increased surface solar forcing in the cloud-free area that is manifested by regionally enhanced upward latent heat flux and evaporation. Therefore, it seems like an air–sea coupled amplification mechanism in HS. In climatology, the combined actions of the North Pacific subtropical gyre in the ocean and the Northwest Pacific subtropical high in the atmosphere could maintain the cloud-free region. As for ocean circulation, although the local ocean surface receives more solar radiation in HS, the effect of regional solar shortwave radiation on large-scale ocean circulation is very limited. Thus, the influence of ocean circulation has not been explored in this study. As for the atmosphere, we find the weakened Northwest Pacific subtropical high in HS (Figures 6–8), which is not conducive to the maintenance of cloud-free areas. So, there might be a restraining factor that makes the mechanism more complex.
4 Conclusion and discussion
The impacts of solar activity on the tropical Pacific and the possible underlying mechanisms have been widely reported in prior studies. However, few studies focus on the effects of solar activity on the TC over the western North Pacific. Based on the observations from the CMA and SILSO and the reanalysis data from the NCEP/DOE and Hadley Centre for the period of 1979–2020, we examine the solar asymmetric modulation on TC frequency over the western North Pacific in different solar phases and further illustrate the possible mechanism.
We first find a significant positive correlation with the 95% confidence level between yearly SSN and TC frequency for 1979–2020. It suggests that stronger solar activity might induce more TCs over the western North Pacific. It is worth noting that the responses of TC frequency to solar activity are obviously asymmetric when dividing the whole period into HS and LS. Specifically, the increased solar activity could markedly produce more TCs in HS (with a 99% confidence level); however, no significant modulation can be found in LS.
Then, we detect the asymmetric effects of solar activity on the air–sea backgrounds of TC generation. In HS, the stronger solar activity significantly causes lower SLP, near-surface cyclonic wind anomalies, and anomalous upward motion over the TC origin, all of which are conducive to more TC generation. However, no obvious features can be found in LS. It seems that the remarkable and sensitive responses of regional atmospheric circulation to increased solar activity in HS are crucial to explaining solar asymmetric modulation on TC frequency over the western North Pacific.
Further investigation reveals a possible air–sea coupled mechanism for this significant solar modulation on TC frequency over the western North Pacific in HS. The relatively cloud-free area in the western North Pacific could absorb more incoming solar radiation at the surface in HS than in LS. This increased regional surface net solar radiation in HS could produce a stronger surface upward latent heat flux and, thus, greater evaporation in the TC source. Along with that, the local upward motion is dramatically strengthened over the TC origin. Then, for compensation, the regional SLP is reduced and the near-surface winds become cyclonic. All of these solar-caused regional anomalies in atmospheric circulation in HS contribute to more TCs over the western North Pacific.
The key to this feasible mechanism is that the increased regional solar forcing at the ocean surface in the cloud-free area could be manifested by the regionally strengthened upward latent heat flux and evaporation. This air–sea coupled mechanism has some similarities with the “bottom–up” mechanism (Meehl et al., 2008; Meehl et al., 2009). The “bottom–up” mechanism is used to explain the La Nina-like response of the tropical Pacific to the 11-year solar cycle peaks (van Loon et al., 2004; van Loon et al., 2007; Meehl et al., 2008). However, we neither selected the solar decadal peaks nor separated solar activity into different timescales, so the results were different from these previous studies. Moreover, some unknown restraining factors in the atmosphere and ocean might be underestimated. Furthermore, the “top–down” mechanism of solar modulation on TC has not been explored in this work. We think the phases of quasi-biennial oscillation should be considered when investigating the “top–down” transfer of the solar signal into the TC in further studies.
Data availability statement
Publicly available datasets were analyzed in this study. These data can be found at the China Meteorological Administration Tropical Cyclone Data Center for the best-track data of tropical cyclones over the western North Pacific (http://tcdata.typhoon.org.cn); the World Data Center Sunspot Index and Long-term Solar Observations of Royal Observatory of Belgium for the sunspot number data (http://sidc.oma.be/silso/); the National Centers for Environmental Prediction/Department of Energy Reanalysis II for the gridded meteorological data (https://psl.noaa.gov/data/gridded/data.ncep.reanalysis2.html); and the Met Office Hadley Centre Sea Ice and Sea Surface Temperature Dataset for the gridded sea surface temperature data (https://www.metoffice.gov.uk/hadobs/hadisst/).
Author contributions
DL contributed to data analysis. ZX and JX designed the research idea and process. DL and LZ contributed to drafting this manuscript. All authors contributed to the article and approved the submitted version.
Funding
This work is jointly supported by the National Natural Science Foundation of China (42205025, 42075040, 42130605), the program for scientific research start-up funds of Guangdong Ocean University (060302032102), and the Guangdong Basic and Applied Basic Research Foundation (2019A1515111009).
Acknowledgments
We thank the reviewers for the helpful suggestions and the editor for the supervision of this article.
Conflict of interest
The authors declare that the research was conducted in the absence of any commercial or financial relationships that could be construed as a potential conflict of interest.
Publisher’s note
All claims expressed in this article are solely those of the authors and do not necessarily represent those of their affiliated organizations, or those of the publisher, the editors, and the reviewers. Any product that may be evaluated in this article, or claim that may be made by its manufacturer, is not guaranteed or endorsed by the publisher.
References
Bal, S., Schimanke, S., Spangehl, T., and Cubasch, U. (2011). On the robustness of the solar cycle signal in the Pacific region. Geophys. Res. Lett. 38, L14809. doi:10.1029/2011GL047964
Chan, J. C. L. (2005). Interannual and interdecadal variations of tropical cyclone activity over the Western North Pacific. Meteorology Atmos. Phys. 89, 143–152. doi:10.1007/s00703-005-0126-y
Chen, L., and Ding, Y. (1979). Introduction to the western pacific typhoon. Beijing, China: Science Pres.
Duan, C. C. (2008). Impacts of solar activities on abnormality of general circulation and Yunnan rainfall in summer. Plateau Mt. Meteorology Res., 28(3): 37–43. doi:10.3969/j.issn.1674-2184.2008.03.006
Gray, L. J., Beer, J., Geller, M., Haigh, J. D., Lockwood, M., Matthes, K., et al. (2010). Solar influences on climate. Rev. Geophy. 48, RG4001. doi:10.1029/2009RG000282
Gray, W. M. (1968). Global view of the origin of tropical disturbances and storms. Mon. Weather Rev. 96, 669–700. doi:10.1175/1520-0493(1968)096<0669:GVOTOO>2.0.CO;2
Haigh, J. D., Blackburn, M., and Day, R. (2005). The response of tropospheric circulation to perturbations in lower stratospheric temperature. J. Clim. 18, 3672–3685. doi:10.1175/JCLI3472.1
Haigh, J. D., and Blackburn, M. (2006). Solar influences on dynamical coupling between the stratosphere and troposphere. Space Sci. Rev. 125, 331–344. doi:10.1007/s11214-006-9067-0
Haigh, J. D. (1996). The impact of solar variability on climate. Science 272, 981–984. doi:10.1126/science.272.5264.981
Huo, W., Xiao, Z., Wang, X., and Zhao, L. (2021). Lagged responses of the tropical Pacific to the 11-yr solar cycle forcing and possible mechanisms. J. Meteorol. Res. 35, 444–459. doi:10.1007/s13351-021-0137-8
Kanamitsu, M., Ebisuzaki, W., Woollen, J., Yang, S.-K., Hnilo, J. J., Fiorino, M., et al. (2002). NCEP-DOE AMIP-II reanalysis (R-2). B. Am. Meteorol. Soc. 83, 1631–1643. doi:10.1175/BAMS-83-11-1631
Kim, J. H., Kim, K. B., Chang, H. Y., Cho, M. H., Ahn, Y. H., Choi, H. J., et al. (2017). Long-term repeated rituximab treatment for childhood steroid-dependent nephrotic syndrome. J. Astronomy Space Sci. 34, 257–263. doi:10.23876/j.krcp.2017.36.3.257
Kodera, K., and Kuroda, Y. (2002). Dynamical response to the solar cycle. J. Geophys. Res. 107, 4749. doi:10.1029/2002JD002224
Kodera, K., Thiéblemont, R., Yukimoto, S., and Matthes, K. (2016). How can we understand the global distribution of the solar cycle signal on the Earth’s surface? Atmos. Chem. Phys. 16, 12925–12944. doi:10.5194/acp-16-12925-2016
Kopp, G., and Lean, J. L. (2011). A new, lower value of total solar irradiance: evidence and climate significance. Geophys. Res. Lett. 38, L01706. doi:10.1029/2010GL045777
Li, D., Xiao, Z., and Zhao, L. (2019). Preferred solar signal and its transfer in the Asian–Pacific subtropical jet region. Clim. Dyn. 52, 5173–5187. doi:10.1007/s00382-018-4443-5
Li, R. C., and Zhou, W. (2018). Revisiting the intraseasonal, interannual and interdecadal variability of tropical cyclones in the western North Pacific. Atmos. Ocean. Sci. Lett. 11 (2), 198–208. doi:10.1080/16742834.2018.1459460
Li, S., Li, Z., and Ling, S. (2023). Combined effect of the solar activity and ENSO on the tropical cyclone genesis frequency in the southeastern part of the western North Pacific. Front. Earth Sci. 11, 1139699. doi:10.3389/feart.2023.1139699
Lu, X. Q., Yu, H., Ying, M., Zhao, B. K., Zhang, S., Lin, L. M., et al. (2021). Western North pacific tropical cyclone database created by the China meteorological administration. Adv. Atmos. Sci. 38 (4), 690–699. doi:10.1007/s00376-020-0211-7
Matthes, K., Kuroda, Y., Kodera, K., and Langematz, U. (2006). Transfer of the solar signal from the stratosphere to the troposphere: northern winter. J. Geophys. Res. 111, D06108. doi:10.1029/2005JD006283
Meehl, G. A., Arblaster, J. M., Branstator, G., and van Loon, H. (2008). A coupled air-sea response mechanism to solar forcing in the Pacific region. J. Clim. 21 (12), 2883–2897. doi:10.1175/2007JCLI1776.1
Meehl, G. A., Arblaster, J. M., Matthes, K., Sassi, F., and van Loon, H. (2009). Amplifying the Pacific climate system response to a small 11-year solar cycle forcing. Science 325, 1114–1118. doi:10.1126/science.1172872
Rayner, N. A., Parker, D. E., Horton, E. B., Folland, C. K., Alexander, L. V., Rowell, D. P., et al. (2003). Global analyses of sea surface temperature, sea ice, and night marine air temperature since the late nineteenth century. J. Geophys. Res. 108 (D14), 4407. doi:10.1029/2002jd002670
Ruzmaikin, A. (1999). Can El Nińo amplify the solar forcing of climate? Geophys. Res. Lett. 26, 2255–2258. doi:10.1029/1999GL900535
Tian, R. X. (2005). Solar effect on the relationship between tropical cyclone activity over the west of North Pacific and the stratospheric quasi-biennial oscillation. J. Zhejiang Univ. Sci. Ed. 32 (3), 350–354. doi:10.3321/j.issn:1008-9497.2005.03.024
van Loon, H., Meehl, G. A., and Arblaster, J. M. (2004). A decadal solar effect in the tropics in July–August. J. Atmos. Solar-Terr. Phys. 66, 1767–1778. doi:10.1016/j.jastp.2004.06.003
van Loon, H., Meehl, G. A., and Shea, D. J. (2007). Coupled air-sea response to solar forcing in the Pacific region during northern winter. J. Geophys. Res. 112, D02108. doi:10.1029/2006JD007378
van Loon, H., and Meehl, G. A. (2008). The response in the Pacific to the sun’s decadal peaks and contrasts to cold events in the Southern Oscillation. J. Atmos. Solar-Terr. Phys. 70, 1046–1055. doi:10.1016/j.jastp.2008.01.009
Wang, W., Matthes, K., Tian, W., Park, W., Shangguan, M., and Ding, A. (2019). Solar impacts on decadal variability of tropopause temperature and lower stratospheric (LS) water vapour: A mechanism through ocean–atmosphere coupling. Clim. Dynam. 52, 5585–5604. doi:10.1007/s00382-018-4464-0
Xiao, Z., Li, D., Zhou, L., Zhao, L., and Huo, W. (2017). Interdisciplinary studies of solar activity and climate change. Atmos. Ocean. Sci. Lett. 10, 325–328. doi:10.1080/16742834.2017.1321951
Ying, M., Zhang, W., Yu, H., Lu, X., Feng, J., Fan, Y., et al. (2014). An overview of the China Meteorological Administration tropical cyclone database. J. Atmos. Ocean. Technol. 31, 287–301. doi:10.1175/JTECH-D-12-00119.1
Keywords: solar activity, tropical cyclone, asymmetric modulation, western North Pacific, air–sea coupled amplification mechanism
Citation: Li D, Xiao Z, Xu J and Zhao L (2023) Asymmetric modulation of solar activity on tropical cyclone frequency over the western North Pacific and the possible mechanism. Front. Earth Sci. 11:1169685. doi: 10.3389/feart.2023.1169685
Received: 19 February 2023; Accepted: 23 August 2023;
Published: 08 September 2023.
Edited by:
Teng Wu, University at Buffalo, United StatesReviewed by:
Marni Pazos, National Autonomous University of Mexico, MexicoDiana Francis, Khalifa University, United Arab Emirates
Copyright © 2023 Li, Xiao, Xu and Zhao. This is an open-access article distributed under the terms of the Creative Commons Attribution License (CC BY). The use, distribution or reproduction in other forums is permitted, provided the original author(s) and the copyright owner(s) are credited and that the original publication in this journal is cited, in accordance with accepted academic practice. No use, distribution or reproduction is permitted which does not comply with these terms.
*Correspondence: Ziniu Xiao, eGlhb3puQGxhc2cuaWFwLmFjLmNu