 Emanuele Intrieri1*
 Pierluigi Confuorto1
 Silvia Bianchini1
 Carlo Rivolta2Davide Leva2Samuele Gregolon1Vincenzo Buchignani3Riccardo Fanti1
- 1Earth Science Department, University of Studies of Florence, Florence, Italy
- 2Ellegi s.r.l.—LiSALab, Como, Italy
- 3Independent Researcher, Camaiore, Italy
Introduction: Sinkholes are ground collapses that can cause significant damage to infrastructure and buildings. Part of the risk represented by sinkholes is related to their abruptness and the difficulty in spotting in advance their exact location within a sinkhole-prone area. For this reason, urban planning informed by an accurate risk mapping and monitoring is one of the most effective ways to reduce the risk.
Methods: In this study, we propose a two-folded procedure based on the examination of ground displacement data measured by a ground-based interferometric radar and on the generation of a sinkhole risk zonation map. We examined 11 years’ worth of ground displacement data measured by a ground-based interferometric radar to search for sinkhole precursors. The analysis was based on averaged displacement time series retrieved from high-coherence pixels scattered around Camaiore, Italy, a test site where a catastrophic sinkhole occurred in 1995. To generate a sinkhole risk map, we evaluated the susceptibility map as derived from a set of predisposing environmental parameters, the vulnerability derived from the thickness of the sedimentary cover that can be linked to the abruptness of the collapse, and the value of the elements at risk from the Italian Real Estate Market Observatory integrated with land cover information for the non-built up areas.
Results: The analysis of ground displacement data revealed that Camaiore had not experienced subsidence relatable to incoming sinkholes in the monitored period. However, few cm of vertical movements, which are well correlated with water table oscillations, have been measured and are expected to be of the same order of magnitude of sinkhole precursor deformations. This implies that a phenomenon of the size and velocity of the 1995 event could have likely been detected before its final collapse. The sinkhole risk map identified specific areas that should be closely monitored using in situ and remote sensing instrumentation.
Discussion: The sinkhole risk zonation map generated in this study can be used to inform urban planning and risk management strategies. The study also shows the potential of ground-based interferometric radar to detect sinkhole precursors and the importance of integrating different mitigation approaches. Overall, this study can provide insights for sinkhole risk assessment and management in sinkhole-prone areas.
1 Introduction
1.1 Rationale for the study
The occurrence of sinkholes in sinkhole-prone areas is a serious threat for human lives, structures, infrastructures, and human activities in general, as sinkholes can develop suddenly and cause extensive damage to anything upon them.
The underground origin and the abruptness of these phenomena represent the most critical issues when it comes to risk mitigation and urban planning, since the time and the exact location of a sinkhole are extremely difficult, if not impossible, to forecast. While there are some factors that predispose, with different degrees, the occurrence of a sinkhole (like the presence of karst bedrock and circulating groundwater, especially if acidic), the actual early warning and prediction of an imminent collapse is still a matter of few isolated cases (Intrieri et al., 2015; Nof et al., 2019). Therefore, the aim of this work is to present an integrated approach to deal with these issues in order to provide the early warning and risk mapping of sinkholes. This methodology includes the monitoring of ground displacements performed with a ground-based interferometric synthetic aperture radar (GBInSAR; see Section 3.1) and a risk mapping produced using a scores-and-weights parametric method to assess the susceptibility, a method that links the landcover depth to the abruptness of the collapse for the vulnerability and a land cover and real estate market mapping for the value of the elements at risk.
1.2 Sinkhole definition
A broad, integrated definition of sinkholes includes all those (sub-circular) surfacing depressions or collapse structures initiated from pre-existing natural or anthropic underground cavities (like karst caves, fractures, cellars, catacombs, and artificial cavities in general) (Fairbridge, 1968; Brinkmann et al., 2008; Caramanna et al., 2008). Several sinkhole classifications have been proposed based on the difference between the type of material affected by downward gravitational movement (bedrock, caprock and unconsolidated cover), the mechanism (solution, collapse, suffusion, deep-piping, sagging), the origin (karst, anthropogenic, raveling/evorsion), the evolution (buried sinkholes) (Waltham et al., 2005; Caramanna et al., 2008; Gutiérrez et al., 2008; Gutiérrez et al., 2014). Concerning collapse sinkholes, they are generally associated with an abrupt failure, possibly following a period of slower subsidence (Jones and Blom, 2014; Intrieri et al., 2015; Baer et al., 2018), linked to the progression of the cavity from the deep up to the surface. The diameter of a sinkhole is largely variable as it can range from a few tens of cm to a few hundred meters.
Due to these characteristics, regions affected by sinkholes can experience serious and prolonged damage. For example, in the United States, where 18% of the ground surface is underlain by soluble rocks and sediments with the potential for sinkhole development (Weary and Doctor, 2014), a very conservative estimate of the annual damage related to sinkhole subsidence and collapse on buildings, roads and infrastructures is of at least 300 million USD (Weary, 2015). Other very localized predisposing factors are not related to the type of underground rock but to the presence of artificial (anthropogenic) cavities, like mining tunnels from different epochs (De Bruyn and Bell, 2001; Pellicani et al., 2017) or catacombs (Tufano et al., 2022). Although theoretically such cavities could be explored and mapped, in practice their exact location is often unknown or forgotten and accessing them can be dangerous if not impossible.
1.3 Sinkhole early warning
Providing a sinkhole early warning implies the capability of monitoring ground subsidence with a frequency, accuracy and spatial precision compatible with the actions needed to evacuate one or more buildings and restrict the access to an area. Topographical instruments like total stations and Global Navigation Satellite System (GNSS) antennas can satisfy these requirements but their installation can realistically cover just some elements at risk within the sinkhole-prone area (for example, some buildings or strategic roads) or smaller areas that are known to be subject to the highest probability of occurrence. In fact, another major issue in providing early warnings is that, even if the boundaries of the sinkhole-prone area are known, the location of the next sinkhole can be anywhere within that area.
Therefore, instruments that can monitor over wide areas are more likely to detect precursory ground deformations. Novel instruments like drones are helpful in the detection phase (Lee et al., 2016) but are not suitable for the high frequency monitoring needed for an early warning, mostly due to the time needed to process data. Instead, a commonly used technique to measure ground subsidence is satellite interferometry (Solari et al., 2018), which makes it an obvious candidate for sinkhole early detection as well. The major limitations of satellite interferometry for this application are the temporal resolution (typically in the order of a few days) and the spatial resolution (typically in the order of a few m), which makes this technique suitable for the largest sinkholes.
In most cases, satellite interferometry has proved capable of measuring precursory deformation anticipating the occurrence of sinkholes in areas with a high density of sinkholes, like along the Dead Sea in Israel (Baer et al., 2018; Nof et al., 2019), in the Ebro Valley in Spain (Guerrero et al., 2021) or in underground mining districts (Malinowska et al., 2019; Ferentinou et al., 2020).
Guerrero et al. (2021), using C-band Sentinel-1 satellite data, managed to detect up to 6.5% of the sinkhole population in a 135 km2 sector of the Ebro Valley (23 out of 349), the main bottleneck being the limited spatial resolution of the C-band; one of the algorithms used enabled them to process interferometric in order to obtain a 40 m pixel resolution, which made it impossible to individuate sinkholes with a diameter smaller than 55 m (171 out of 349; 48%). Guerrero et al. (2021) also describe the application of airborne LiDAR (light detection and ranging), that permitted to detect 21 sinkholes out of 38 (success rate of 57%) and to identify 2 new non-inventoried active sinkholes; however, airborne LiDAR this technique is not suitable for a continued monitoring aimed at early warning and only allows for the detection of fast-moving sinkholes due to a vertical displacement precision of ±25 cm. On the other hand, Malinowska et al. (2019), with C-band ENVISAT data, detected sinkholes with dimensions smaller than 25 m, which caused accelerated ground movements within 100 m of their centers. Jones (2021) suggests that NISAR satellite, operating in L-band with a revisit interval of 12 days with a maximum resolution of 6 m, is expected to be capable of identify features as small as 30-m in diameter. Baer et al. (2018) used COSMO-SkyMed (X-band) to measure ground subsidence along the shorelines of the Dead Sea (Israel) where thousands of sinkholes caused by the dissolution of subsurface salt by undersaturated groundwater have been formed since the early 1980s; using this high-resolution satellite (3-m pixels), they found that sinkholes are associated with gradual subsidence preceding their collapse by periods ranging from a few days to almost 5 years, with longer periods directly related to the karst bedrock depth and the gravel fraction of the cover. Similarly, Nof et al. (2019), using the same satellites, were able to detect sinkholes as they were clustered in areas showing subsidence ranging in length and width from less than 100 m to more than 1 km, although the sinkholes themselves ranged from less than a meter to ∼40 m. Theron et al. (2017) individuated the ongoing ground deformation related to a 60-m wide feature interpreted as an evolving sinkhole using TerraSAR-X (X-band) images with a 2.7 m spatial resolution and 11 days revisit time. This area corresponded to only some 20 pixels and the authors stated that deformations smaller than 10 pixels would be hard to identify, thus pointing out that other events (some of unknown width, the other up to 20 m) occurred undetected. Using TerraSAR-X at even higher resolution (0.25 by 0.60 m pixels) Oliver-Cabrera et al. (2020) captured circular subsidence with diameters of roughly 20 m.
All these studies show that sinkholes can be anticipated with radar interferometry, but spatial resolution is a major limitation, although a subsiding area can sometimes be considerably larger than the actual sinkhole diameter; 100-m diameter sinkholes have been shown to be detectable with reasonable confidence using resolutions of few tens of m, while high-resolution satellites (3 m or less) can spot sinkholes with a diameter of 20–30 m. Another problem with satellite interferometry is the decorrelation, that prevents the measurement of displacement in vegetated areas and agricultural terrains. Finally, when the aim is not just detection but early warning, another conceivable limitation lies in the revisit time of the satellites, which makes it difficult to spot precursory deformations lasting for just few days unless the latest acquisition incidentally occurs at the beginning of the deformation.
Both abovementioned drawbacks are reduced using GBInSAR, although the line of sight (LOS), along which the movement can be measured, is more unfavorable. In fact, while the application of GBInSAR (and ground-based interferometry in general; Osasan and Afeni, 2010) to slope-stability-related studies is now a state-of-the-art practice (Casagli et al., 2023), applications to sinkholes are pioneering. Intrieri et al. (2015), for example, describe a sinkhole forecasting done using a GBInSAR by detecting a less than 3 cm downward displacement of a street located in Elba Island (Italy) that allowed the local authorities to close the road and ascertain the presence of a 4-m wide cavity just beneath the tar level, in an area already affected by several sinkholes (Intrieri et al., 2018). Despite some successful experiences such as these, due to the aforementioned difficulties and to the fact that some collapse sinkholes do not exhibit precursory subsidence and not all deformation events lead to a collapse (Rucker et al., 2013), sinkhole monitoring and early warning are not the most common mitigation practice (Intrieri et al., 2015).
1.4 Sinkhole hazard and risk mapping
Early warning reduces the risk by aiming at removing the elements at risk, thus reducing the exposure. This approach can only work with people and movable elements. Reducing the exposure of structures and infrastructures requires a long-term planning and is a more customary approach which consists in mapping the predisposing factors and identifying the possible triggers to draft a susceptibility or even a risk map. Mapping enables to identify the sinkhole-prone areas mostly based on geological, geophysical, hydrogeological data and, when available, on the record of past sinkholes (Intrieri et al., 2018; Pazzi et al., 2018; Kim et al., 2020; Bianchini et al., 2022).
The methods used to fit such parameters into a model can be very different, though. For example, Gao and Alexander (2003) implemented a decision tree model where different features (such as the depth to bedrock or the sinkhole thresholds) are compared with empirical thresholds; if a parameter’s threshold is exceeded, another parameter is compared, and so forth, and a qualitative susceptibility assessment is obtained depending on what thresholds have been passed. A decision tree model is a fast and simple method that can easily be applied to a multitude of contexts, although it needs to be circumstantiated to a specific site, since it struggles to model variants, exceptions, multiple outcomes, or different combinations of predisposing parameters.
Other approaches involve probabilistic methods which correlate the distribution of a particular phenomenon with its contributing factors, assuming that a future sinkhole event is likely to occur under the same conditions as past sinkholes. Kim et al. (2020) used the frequency ratio method, which is based on the calculation of how many sinkholes occurred in an area where a certain parameter assumed a value within a certain range, which is a method that requires a high amount of past events to train the model. Probabilistic approaches can also take advantage of machine learning algorithms; for example, Bianchini et al. (2022) used MaxEnt algorithm which is based on the principle of maximum entropy for the best approximation of a probability distribution (Jaynes, 1957). Such models have the advantage of making hundreds or thousands of iterations to obtain the best validation and can provide statistical parameters to evaluate the reliability of the results but, like the frequency ratio method, have the limitation of requiring large amounts of known past events.
While early warning works in a short-term time frame, hazard mapping is a tool helpful in a long-term planning action, even more so risk mapping, especially from an operational and administrative (not just scientific) point of view. Considering this, in the present paper we apply both mitigation strategies to the case of Camaiore city (Lucca, Italy), where a catastrophic sinkhole occurred in 1995 (Buchignani et al., 2008): firstly, we examined 11 years’ worth of GBInSAR monitoring; in fact, a radar was installed by the local authority to monitor the city and the resulting data has been analyzed to spot possible sinkhole-related movements and in any case to assess the suitability of this technique for such a purpose; then we proposed a method to map the total sinkhole risk, starting from the susceptibility mapping developed by Buchignani et al. (2015). Even though no other apparent sinkholes occurred during the investigated period, the results show how the GBInSAR is capable of capturing vertical deformations comparable with sinkhole precursory subsidence, despite the unfavorable line of sight. A limitation appears to be the spatial resolution, that prevents or at least hinders the detection of events smaller than some 10 m; in this regard, a risk map can isolate those high-risk areas that deserve a more careful data check, in order to reduce the possibility of missing an event.
2 Case study
Camaiore (Lucca Province, Italy) is located in the NW part of Tuscany region (Figure 1), about 8 km from the sea, SW of the Apuan Alps. The inhabited area rises in a small plain, stretching in the NW-SE direction with a length of about 3 km and a width varying between 0.5 and 1.2 km.
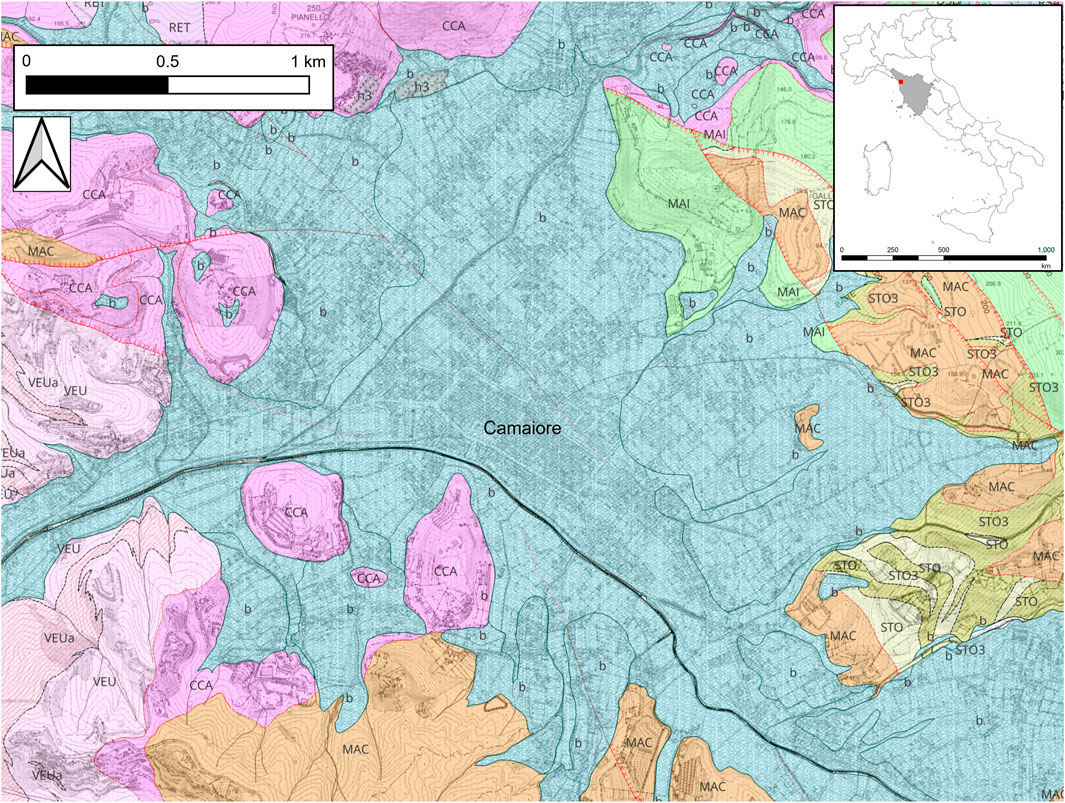
FIGURE 1. Geological framing of Camaiore plain (shown as a red square in the framed picture). VEU and VEUa, Verruca formation (quartzite and phyllite); STO and STO3, Scaglia Toscana formation (calcarenites); MAI, Maiolica formation (micritic limestone); MAC, Macigno formation (flysch); CCA, Calcare Cavernoso formation (dolomite and limestone); b, gravel; h3, limestone cave breakdown deposits. In the top-right inset, in grey the boundaries of Tuscany region.
2.1 Geological and geomorphological setting
Tectonically, the evolution of the area is related to that of the Northern Apennines, a complex fold-and-thrust chain that has been characterized by compressive stresses from the Upper Cretaceous to the Upper Miocene, giving rise to the stacking of several tectonic units, and then by extension, producing several basins subsequently filled by marine and continental sediments (Elter et al., 1975; Conti et al., 2004; Conti and Lazzarotto, 2004).
The basin is tectonically active, as witnessed by the occurrence of generally weak earthquakes centered in the area. Three sets of direct faults exist, with NW-SE, NW-SW and EO strike directions, respectively. These intersections locally cause the lowering of the bedrock, whose maximum depth corresponds with the center of Camaiore. In particular, the plain matches with a tectonic depression (graben) connected to the tensional phase started in the Upper Miocene. To the NE, the graben is bounded by a W-dipping normal fault, and to the SW by an E-dipping normal fault, producing a listric-type geometry (D’Amato Avanzi et al., 2004). This tectonic evolution has favored the deposition of alluvial and colluvial sediments coming from the surrounding hills, whose heights are around 500–600 m a.s.l. The presence of faults also affects the geometry of the hydrographical network.
The city of Camaiore is mostly built on the already mentioned Quarternary alluvial deposits, consisting of silt, sand and gravel, with a variable thickness that can reach a few tens of m (Figure 1). Underneath lies the Middle-Upper Triassic formation called Calcare Cavernoso (literally “cavernous limestone”), which owes its name to its typical sponge-like texture and to the presence of karst phenomena, being constituted of dolomite and limestone. This formation is a valuable hydrogeological asset, due to its high porosity and permeability and an estimated thickness of 500–700 m, and in fact feeds the alluvial aquifer, which is extensively exploited by wells.
2.2 1995 sinkhole event
Reportedly, during the night between October 14th and 15th 1995, a young man coming back home from a nightclub was alerted by smelling a gas leak in the area NW of the city center (near Fratelli Cervi Street and Antonio Gramsci Street) and called the firefighters. Shortly after it was apparent that the leak was owing to a larger phenomenon. During the night, a 2 m-deep funnel-shaped subsidence took place until the sinkhole opened at 7 a.m., with a 15–20 m diameter and groundwater rising to just 2–3 m below the ground surface. Then, a few hours later, the sinkhole further enlarged until reaching a diameter of 30 m and a depth of about 18 m, with the water table that stabilized at 4–5 m below the surface (Buchignani et al., 2008) (Figure 2).
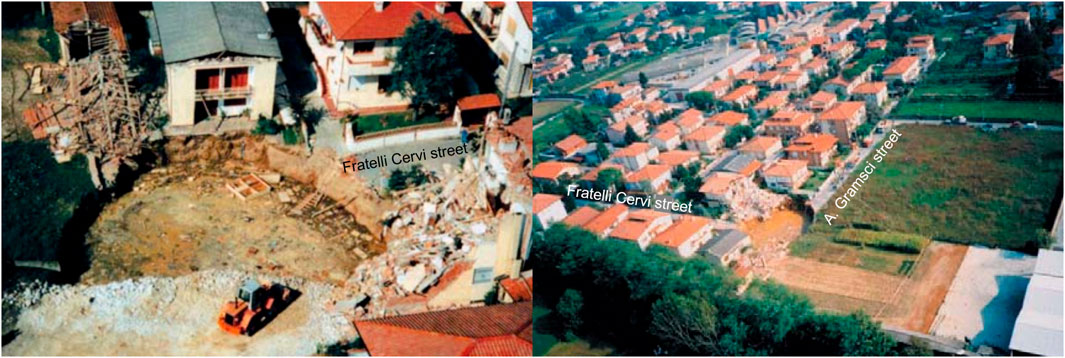
FIGURE 2. Photographs of the 1995 sinkhole in Camaiore (from D’Amato Avanti et al., 2004; and from Buchignani et al., 2015; photograph by Luigi Micheli).
The event caused the partial collapse of two residential buildings; other buildings were damaged and subsequently demolished. Since the first serious deformations started around 6 h before the final collapse, this allowed the evacuation of the interested area and no injuries or fatalities occurred.
Although the cause of the sinkhole has never been solidly proven, Buchignani et al. (2008) blame a combination between the aftermaths of the 10 October 1995 earthquake (M 4.8, epicenter 50 km from Camaiore) and the high concentration of CO2 coming through tectonic fractures that could have enhanced the dissolution processes in the bedrock. Supporting the earthquake theory, misalignments of the house gates and small fractures in house walls were observed by some of the inhabitants of the collapse area after the seismic event but before the sinkhole occurrence, suggesting the possible failure of an underground cavity. At the same time, any trigger related to a possible overexploitation of the groundwater seems unlikely, since the pumping was carried out from within the alluvial deposits and it was compatible with the recharge capacity of the aquifer (Buchignani et al., 2008).
Right after the event, the cavity was filled with rocks taken from the near marble caves in the Apuan Alps. Furthermore, to check the existence of the same sinkhole predisposing conditions elsewhere in the Camaiore plain, a detailed study involving borehole surveys, seismic tomographies, an endogenetic-gas analysis (Buchignani et al., 2008), a microgravimetric campaign (Di Filippo and Toro, 2004), and electrical tomographies (D’Amato Avanzi et al., 2002) was carried out, and a monitoring network had been installed in the attempt to prevent possible human injuries (since this system is no longer in place since several years, the Authors were unable to recover information about the exact location of the instruments). The system included:
• A GBInSAR to measure the displacements in the plain of Camaiore.
• A Global Positioning System (GPS) network to continually measure ground displacements in the areas indicated as potentially hosting ground cavities, as resulting from the microgravimetric and geoelectric campaigns.
• A network of 3 geophones to measure seismic signals which might be related to underground spalling.
• Two stations for the measurement of CO2 concentration in groundwater.
• An inclinometer to measure ground displacement.
• A settlement gauge to measure ground displacement.
This network constituted one of the most advanced monitoring systems in the world regarding sinkhole risk. However, over the years, due to funding problems and to a diminished risk perception thanks to the fortunate lack of further catastrophic events, it has been gradually dismantled, the longest-lasting instrument being the GBInSAR.
Indeed, a survey performed by the Authors in February 2015 revealed a 2.5 m wide, 0.3 m deep circular depression which appeared in a sports field near the city center, in the same location where a stump was removed (Figure 3A), at the opposite end of Cervi street where the 1995 sinkhole occurred. Whether this local subsidence could be due to the settlement following the stump eradication or if it had a deeper origin connected with the karst bedrock is uncertain and the GBInSAR was not able to provide further clues since the location was concealed by a building. Around the same period, a series of smaller (few tens of cm wide, far too small to be possibly detected by the GBInSAR) cavities have been reported in private courtyards of an undisclosed location (Figure 3B).
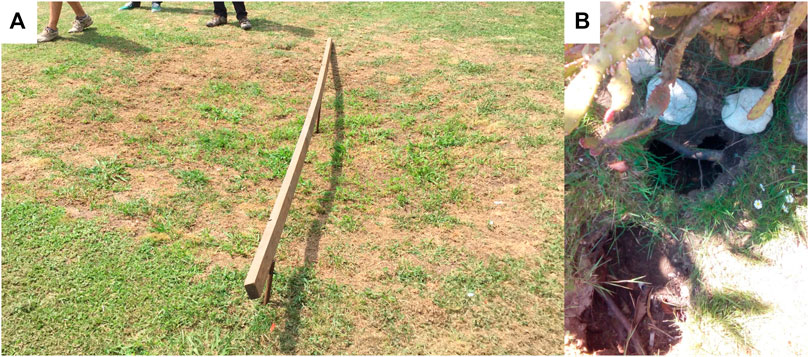
FIGURE 3. (A) localized subsidence spotted in 2015, 300 m from the 1995 event (see Figure 4); (B) small cavities occurred in Camaiore.
3 Materials and methods
3.1 Early warning: GBInSAR
GB-InSAR instruments are based on the interferometric principle, originally developed for satellite platforms, by which two electromagnetic waves are sent at different times towards a target and their echoes are registered. If the two backscattered waves come back with a phase shift between each other, this phase difference, under certain circumstances (mostly involving stable atmospheric conditions and absence of fast, chaotic movements of the scenario, and identical starting point of the waves), is linearly dependent on the displacement experienced by the target in the elapsed time between the two acquisitions. To measure ground deformation, the microwave spectrum is used, although different wavelengths can be employed depending on the specific band adopted, typically L-band (∼23.5 cm), C-band (∼5.6 cm), X-band (∼3.1 cm), Ku-band (∼1.7 cm). Shorter wavelengths allow for higher accuracy, sensitivity, and resolution but can experience phase ambiguity more easily in case of relatively fast movements. To avoid the use of large antennas to improve the resolution, the synthetic aperture technique (SAR) can be employed, which consists in moving the sensor, equipped with small antennas, along a path (for example, along a rail in the case of ground-based apparatuses) while making the acquisitions, in order to achieve a resolution equal to that obtainable with an antenna as large as the whole distance travelled. The difference between the synthetic aperture and the actual size of the antennas could be several orders of magnitude.
Some of the first ground-based applications have been made to monitor the displacement of human-made structures, such as viaducts and dams—very reflective targets (high signal-to-noise ratio) typically experiencing very small deformations (Tarchi et al., 1999; Pieraccini et al., 2000)—for which the Ku-band was optimal. In a matter of few years GBInSAR applications almost entirely transitioned to the monitoring of slope stability (Tarchi et al., 2003; Del Ventisette et al., 2011; Ferrigno et al., 2017), but the Ku band was customarily maintained (Luzi, 2022) and certified by public authorities.
GBInSAR produces 2d displacement maps of the observed scenario. Each pixel of the map is defined by two resolutions: the range resolution (Δr; Eq. 1), parallel to the LOS, and the azimuth resolution (Δa; Eq. 2), perpendicular to the LOS and worsening as the distance increases:
where c is the speed of light, B the bandwidth used, R the distance (range) between the sensor and the pixel, L the length of the synthetic aperture, fc the central frequency of the signal.
An intrinsic limitation of every interferometric technique is that the measured displacement can only be referred to the component of the movement that is parallel to the LOS of the sensor. This means that movements perpendicular to the LOS cannot be detected.
The radar employed in Camaiore whose data are studied in this paper was a LiSALab apparatus, continuously operating from 1 February 2007 to 30 April 2018 (Table 1).
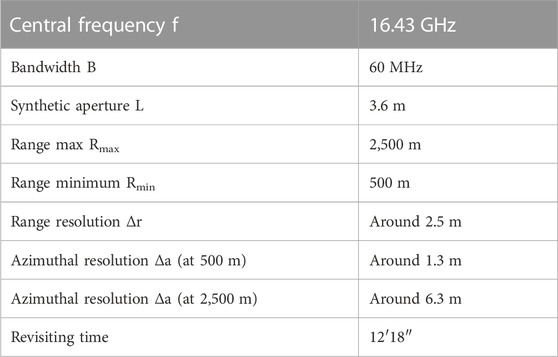
TABLE 1. Technical parameters of the GBInSAR installed in Camaiore and used in this paper.
The installation point of the GBInSAR was chosen assuming future events with similar characteristics to the 1995 sinkhole, such as:
• A subsidence of a few centimeters.
• A subsidence area larger than the actual sinkhole, reaching a diameter of several tens or even a few hundred meters.
• The frequency of occurrence (one every few years).
• The presence of precursory displacements lasting for a few days before the collapse.
Therefore, the location of the monitoring system required:
• A good coverage (field of view) over Camaiore.
• To be stable and not affected by slope movements or subsidence.
• An average distance not too far from the city in order not to lose resolution (ideally within 1 km, preferably within 2 km).
• The best possible line of sight, that is, since subsidence is vertical, the GBInSAR needs to observe the ground as vertically as possible.
All considered, the system was installed using antennas with a main lobe at −3 dB (equal to about 45° field of view in the horizontal plane and about 20° in the vertical plane) to ensure a sufficient coverage over the area and the location was chosen along the road connecting Camaiore to Greppolungo, inside a specifically constructed building located about 285 m above sea level (Figure 4). In this way, the GBInSAR is placed about 250 m above Camaiore plain, is about 1,175 m away from the location of the 1995 sinkhole and about 1,335 m from the center of the city. The cosine function of the angle between the sensor LOS and the vertical direction (assuming that the ground deformation is only subsidence) can be used to calculate, as a percentage, the component of the vertical movement vector parallel to the LOS; as a consequence, as the targets are farther from the sensor the LOS becomes more horizontal and less favorable to detect vertical movements, therefore the sensitivity to subsidence ranges from 45% (range 500 m, azimuth 0 m)—meaning that a 1 cm vertical movement is measured as 0.45 cm—to 9% (range 2,500 m, azimuth ±1,000 m), with a percentage around 15%–22% in the middle of the scene. This phenomenon can affect the detecting capability; in fact, small displacements measured with unfavorable LOS angles can end up below the precision of the instrument unless they are cumulated over longer time periods.
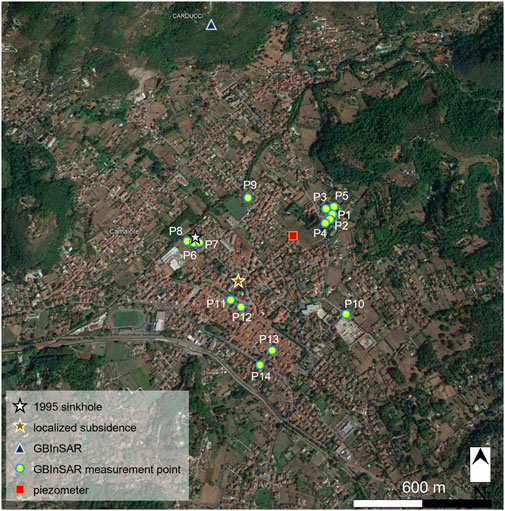
FIGURE 4. Location of the measurement points selected from the entire field of view of the GBInSAR, whose position is also represented, along with the piezometer the 1995 sinkhole and the localized subsidence visible in Figure 3A. Photo from Google Earth.
Atmospheric noise, vegetation and urban traffic can significantly reduce the quality of radar data, so to increase the signal-to-noise ratio, sets of acquisitions have been averaged over a fixed time window. Since the movements measured in this area were very small, in this paper monthly averages are used to maximize the data quality and provide a better reconstruction of the deformations detected over Camaiore.
From the monitored scenario a set of significant monitoring points with their respective displacement time series has been selected following these criteria:
• High radar coherence of the pixels.
• Spatial representativity of the point (that is the displacement time series is indicative of a broad area and it is not an isolated, anomalous point).
• High signal-to-noise ration of the time series.
3.2 Risk mapping: sinkhole risk zonation
The sinkhole risk of Camaiore area was elaborated in a GIS environment starting from different layers representing the susceptibility (i.e., the spatial probability), the vulnerability (the degree of damage) and the value of the elements at risk.
The susceptibility is derived from a previous work by Buchignani et al. (2015) meant as support to the urban planning of Camaiore (see Section 4.2). They developed a heuristic parametric method based on the attribution of scores and weights, according to an expert-judgment approach, to a set of predisposing factors, which are seismicity (distance from past hypocenters), the presence of a limestone bedrock, the distance from fault intersections, the presence of endogenous CO2 and Radon (linkable to earthquake activity or to possible hypogenic speleogenesis of the sinkhole; Klimchouk, 2009), the presence of anomalies in geoelectrical tomographies (relatable to underground cavities), microgravimetric values (also relatable to underground cavities), cumulated subsidence measured by the GBInSAR. Since the considered factors are all spatial variables, they can be represented as matrix layers and elaborated in a GIS environment. Buchignani et al. (2015) empirically assigned a weight to each factor reflecting their respective importance in terms of favoring the occurrence of sinkholes, then each pixel was assigned a score representing the value for that factor in that point. In this way, each pixel has a final score obtained by the sum of each score multiplied by each respective weight. This final score has been used to classify the area into susceptibility classes. This map has been used in conjunction with the vulnerability and the elements at risk maps (see Section 4.2), whose values have been rescaled from 0 to 1 and then multiplied to obtain the total risk zonation map.
4 Results
4.1 GBInSAR monitoring
Since the GBInSAR is capable of measuring only a percentage of the vertical movements due to its LOS limitation (see Section 3.1).
An overview of the cumulated displacement measured over the whole city highlights the areas showing the most relevant trends (Figure 4). Isolated pixels displaying some movements are scarcely significant and typically represent residual noise or structural movements concerning individual buildings.
Within each investigated area, a set of pixels has been selected to carry out a specific analysis of the displacement time series. To improve the readability of data (that are originally referred to the LOS direction), these have been reprojected along the vertical direction, dividing the cumulated displacement measured for a pixel by the respective LOS sensitivity (which is the cosine of the angle between the LOS and the expected direction of movement, i.e., vertical); in this way, every displacement value is referred to the vertical direction. This LOS sensitivity correction factor has been applied using a minus sign, so that downward movements conventionally result as negative, while upward movements are positive (Table 2). A higher absolute value of the correction factor means a less favorable LOS.
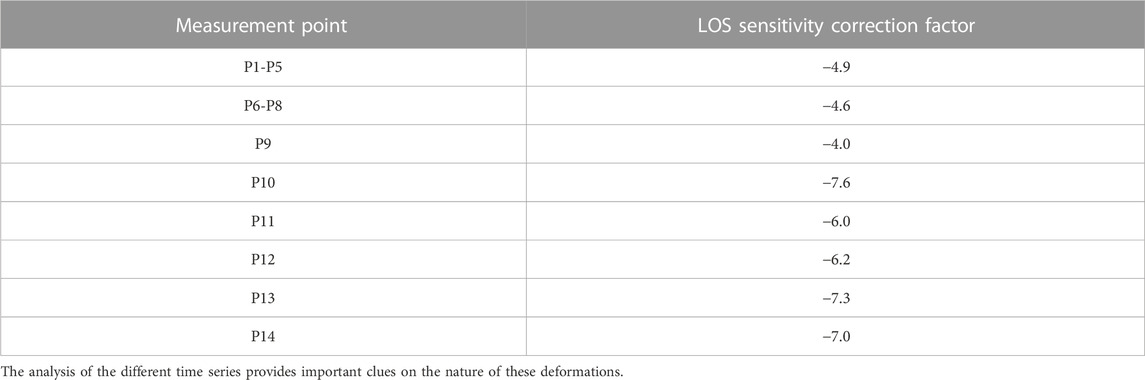
TABLE 2. Correction factors for the LOS sensitivity used for the pixels chosen from the investigated areas as measurement points.
Points P1-P5 share a very similar, almost overlapping, behavior characterized by a cyclic trend with a yearly period (Figure 5) and they are strikingly related to the water table oscillations; positive peaks generally occur at the end of the winter season (January-February, although sometimes they are slightly delayed, such as the positive peak in 2013 occurring in April) after the recharge period of the aquifer, while negative peaks at the end of the summer (dry) season (September-October). The total excursion of the displacement time series is around 15–20 mm for P1, P2, and P4 and 10–15 mm for P3 and P5.
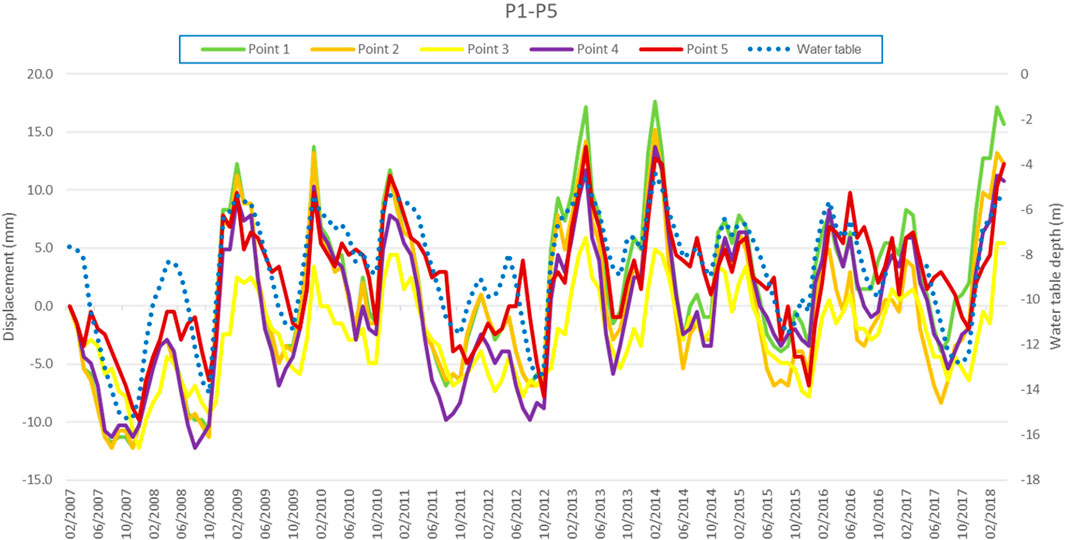
FIGURE 5. Displacement time series of points P1-P5 reprojected along the vertical direction and compared with the piezometric level.
Points P6-P8 are close to the 1995 sinkhole area (Figure 4). In particular, point P7 displays a clear sinking trend marking a total cumulated displacement of −114 mm (Figure 6). The trend is broadly linear, however, it displays several accelerating and decelerating phases; in fact, this point experiences relatively fast subsidence until October 2011, albeit interrupted by an uplift period spanning from February 2010 to October 2010. Then an oscillatory but overall stable trend occurs from October 2011 until December 2014, which gives way to a new subsiding trend; eventually, since December 2015, subsidence takes place at a slower rate. Points P6 and P8 share with P7 most of the positive peaks and display similar general subsidence, although less intense (−49 and −36 mm, respectively) and of shorter duration, since both points display a cyclical but on average stable trend since June 2013.

FIGURE 6. Displacement time series of points P6-P8 reprojected along the vertical direction and compared with the piezometric level.
Points P9 and P10 share some similarities with P1-P5, as they display clear yearly cycles except for a lower excursion (less than 10 mm for P9) and, concerning P10, a superimposing lowering trend of 10–15 mm (Figure 7).
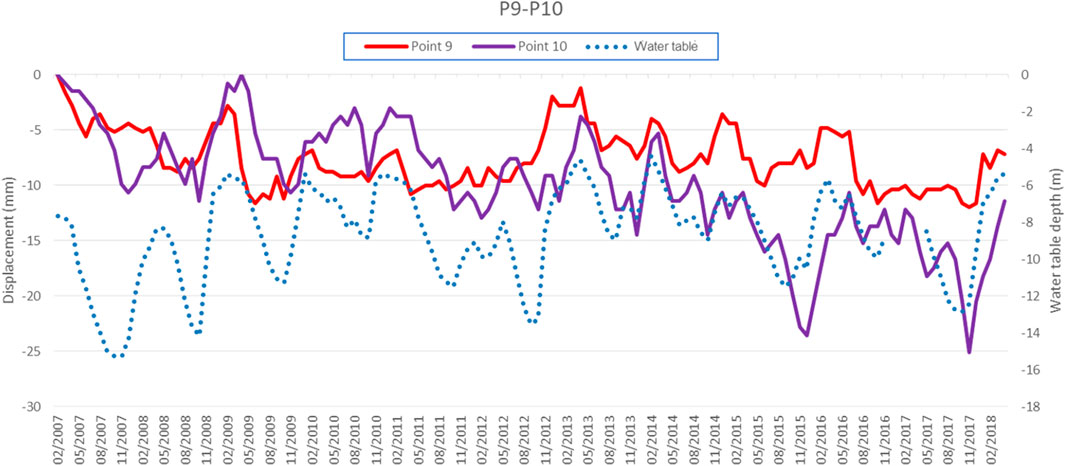
FIGURE 7. Displacement time series of points P9-P10 reprojected along the vertical direction and compared with the piezometric level.
Points P11-P14 are those located in the historical city center of Camaiore (Figure 4). P11 is characterized by very small vertical oscillations, in the order of 5 mm (Figure 8). The positive peaks tend to occur around July-September, instead of January-February as for most of the other points. This averagely stable behavior was only interrupted by a relatively fast downward deformation (−18 mm) taking place from June 2009 to January 2010. On the other hand, P12 shows an apparent upward trend reaching around 30 mm during the whole monitoring time. Cyclic peaks are superimposed and are generally phased with P11. Finally, P13 and P14 display a moderate seasonal periodicity roughly synched with P1-P9 and also a slight downward trend.
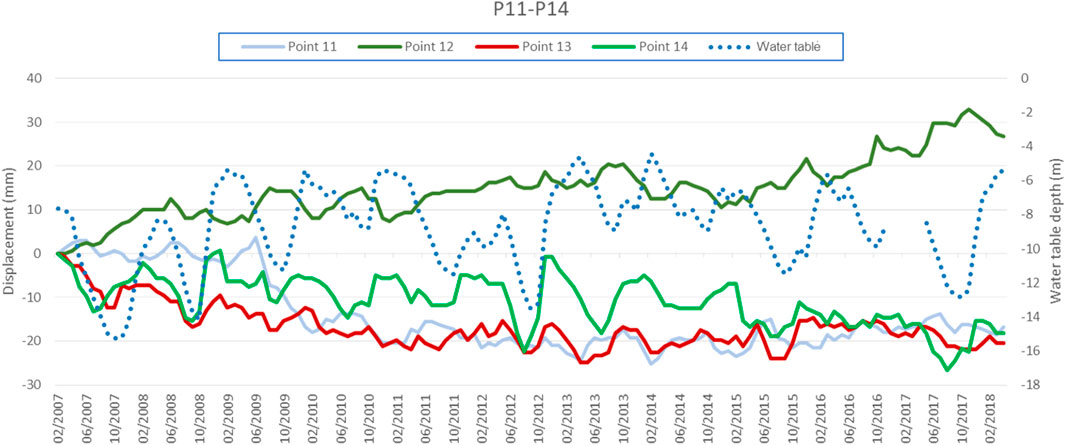
FIGURE 8. Displacement time series of points P11-P14 reprojected along the vertical direction and compared with the piezometric level.
4.2 Risk mapping
Since the susceptibility was already available (Buchignani et al., 2015) Figure 9A, the vulnerability and the elements at risk have been mapped to obtain the total risk.
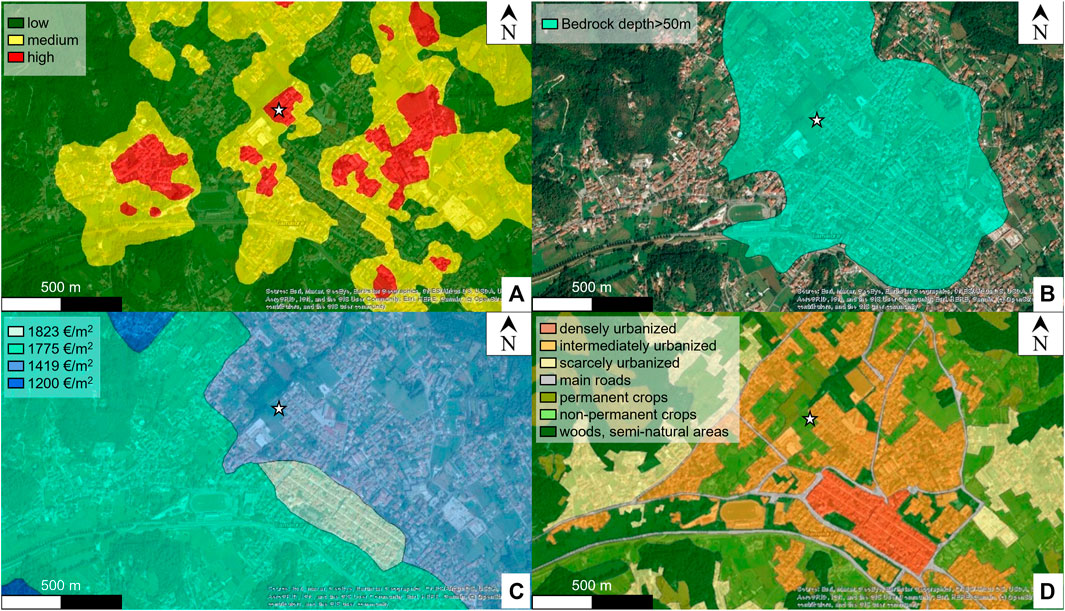
FIGURE 9. (A) sinkhole susceptibility map of Camaiore from Buchignani et al. (2015); (B) vulnerability obtained as an estimation of the abruptness of the expected sinkhole based on the depth of the bedrock; (C) real estate market values of Camaiore; (D) integration of the real estate market values with land cover map.
The vulnerability indicates the degree of loss; in the case of landslides, for example, it is generally a function of the velocity and volume or mass of the considered landslide, which can be translated into the diameter and suddenness of the expected sinkholes. A sinkhole’s diameter is related to the stratigraphy, geotechnical properties of the cover and the depth of the cavity (Parise and Lollino, 2011). In Camaiore plain the stratigraphy and geotechnical properties are considered approximately homogeneous with respect to the thickness of the sedimentary cover (determining the depth of the cavity), which is not uniform. However, apart from the 1995 event, no other sinkhole occurrence allowed us to calibrate the diameter variability of future phenomena that could take place in different parts of the city; therefore, to map the vulnerability, the sinkhole size has not been considered as a spatial variable, which means that the resulting map considers the scenario of sinkholes the size of the 1995 phenomenon.
Vulnerability is usually also a function of the elements at risk and their resistance to damage. In Camaiore, the elements at risk are livelihood and structures. Regarding structures and taking into account the size and abruptness of the 1995 event as a benchmark, it was our assessment that any event of similar magnitude occurring beneath a structure (whether residential or strategic buildings, road, or field) would result in the destruction or render it unusable for security reasons. As a result, we consider that all structures in the Camaiore territory are vulnerable to sinkholes of that size and velocity, scoring a vulnerability rating of 1. On the other hand, for livelihood the vulnerability is influenced by the velocity of occurrence of the event, which has not been considered the same across all the plain. In fact, a relationship developed in volcanic environments for vertical collapses due to deeper magma withdrawal has been adopted, building upon past studies highlighting the structural and kinematic consistency of calderas or pit-craters and non-volcanic sinkholes (Roche et al., 2001). Ruch et al. (2012) proposed a model where both calderas and non-volcanic sinkholes occur as sudden collapses when the depth of the original cavity is at least twice the diameter of the final sinkhole; on the other hand, they experience a continuous collapse (i.e., the velocity during collapse is similar to the subsidence velocity) when the ratio between depth and diameter is smaller than 2.
Since, by definition, the risk is defined with respect to a given event of a given magnitude, a diameter similar to the 1995 event (30 m) was considered as the worst-case scenario for future possible collapses. This means that sudden collapses are expected to take place where the bedrock is deeper than 60 m (Figure 9B). This is consistent with the observed event, which occurred suddenly and in a location with a >60 m-thick alluvial cover. Sudden sinkholes reduce the possibility to evacuate people (and, to a certain extent, other mobile elements at risk) and are therefore associated with a higher vulnerability.
For the definition of the elements at risk in Camaiore an integration between two thematic maps was made. The first one represents the OMI (Osservatorio del Mercato Immobiliare—Real Estate Market Observatory) values of the area as of the first semester of 2022 (Figure 9C). OMI is a branch of the Revenue Agency which takes care of the collection and processing of economic information relating to real estate values and the rental market; real estate quotations are semi-annual and referred to homogeneous territorial areas (OMI areas), represented as average values per unit of surface area expressed in €/m2 or in an arbitrary scale ranging from 0 to 255. In the territory of Camaiore, 4 different OMI areas exist, with the historical center being the most valuable (1,823 €/m2), and the others having a value of 1,775 €/m2, 1,419 €/m2, and 1,200 €/m2, in decreasing order.
Similar to the procedure followed by Bianchini et al. (2022), the OMI values have then been integrated with information from the 2019 update of the CORINE land cover (CLC) map (Heyman et al., 1994) to have a better estimation of the values of the green areas (woods, crops, courtyards) that the OMI classification does not discriminate. CLC products are based on the photointerpretation of satellite images and adopt a standard nomenclature to define 44 different types of land cover among artificial surfaces, agricultural areas, forest and seminatural areas, wetlands and water bodies.
The integration of these two maps has produced a map (Figure 9D) that has been classified into the following classes (with decreasing values), reflecting the territory of Camaiore (Table 3).
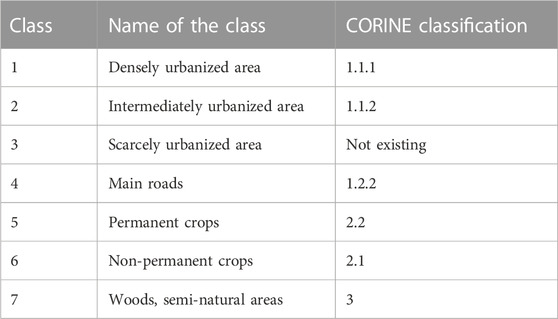
TABLE 3. Classes used for the elements at risk thematic map.
The resulting risk map (Figure 10), obtained from the pixel-by-pixel multiplication of the values of susceptibility, vulnerability and elements at risk rasters normalized from 0 to 1, has been classified into 4 semi-quantitative classes obtained with the Jenks (1977) natural breaks classification method to reduce the variance within classes and maximize the variance between classes, with risk increasing from green (class 1) to red (class 4).
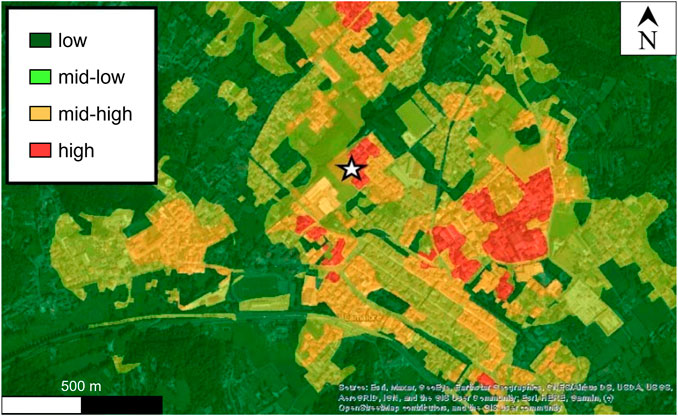
FIGURE 10. Sinkhole risk map of Camaiore.
5 Discussion
The two highest risk classes are all located within densely or intermediately urbanized area, where the density of buildings reflects the probability for a single sinkhole to hit one or more edifices in that area.
Focusing on the class 4 areas only, the two areas N and S of the historical sinkhole correspond to areas identified by Buchignani et al. (2015) as being characterized by microgravimetric anomalies and endogenous gases. The surroundings of the 1995 sinkhole fall in class 4 due to a combination of all factors, including the presence of the intersection of faults which increases the susceptibility; on the other hand, the precise location of the sinkhole is in class 3 since it has been left unbuilt, which effectively reduces the exposure of the elements at risk, and thus the risk. The most extensive class 4 area is influenced by a high vulnerability and the presence of microgravimetric anomalies and fault intersections (Buchignani et al., 2015) increasing the susceptibility. The city center, despite having the highest vulnerability and value, has a relatively low total risk due to the scarcity of predisposing factors (low susceptibility).
This result provides information on possible expansion and land use, helpful for the long-term planning. The displacement monitoring can give insight into the short-term hazard. The displacement data analyzed in this work are a rare example (Intrieri et al., 2015) of a GBInSAR used to monitor subsidence. In fact, if the aim is just subsidence monitoring, other techniques are more suitable for this task (for example, satellite interferometry or topographic instruments); however, if the scope is sinkhole early warning, GBInSAR can both cover large areas and provide frequent acquisitions. Therefore, it is important to understand whether the data gathered in Camaiore are significant for a possible detection of sinkhole precursors.
Since all the displacement data display—with different degrees—seasonality, a comparison with the water table variation has been performed (from Figures 5–8). Possible correlations have been assessed using the piezometer made available by the Hydrological and Geological Service of Tuscany, which is installed 200 m·E of the sinkhole area (Figure 4) and monitors the alluvial aquifer. The maximum recharge is generally reached in January-February (typically coinciding with the period of maximum upward displacement), while the minimum is in September-October (usually coinciding with the periods of maximum subsidence), with a total excursion of up to 4 m. These variations are synched with most of the peaks of the displacement time series measured by the GBInSAR; the clearest overlapping occurs with P1-P5 (Figure 5), where even the sub-seasonal variations of the water table are reflected in the ground movements. The weaker correlation with P9, P10 (Figure 7), P13, and P14 (Figure 8) is probably due to the greater distance between these pixels and the piezometer (300, 450, 540, and 620 m, respectively). Therefore, the GBInSAR has proved able to measure the ground subsidence and uplift due to the seasonal recharge and depletion of the alluvial aquifer.
P6-P8 (Figure 6) are located in the sinkhole area and show a clear subsidence trend superimposed with seasonal oscillations. Since the 1995 sinkhole was filled with boulders, the measured subsidence is likely due to the ground settlement, especially concerning P7, the closest to the center of the collapse area. The effects of the water table variations are still visible but are partially concealed by the strong downward trend.
The seeming upward movement of P12 cannot be explained as an actual uplift, but rather as a horizontal movement toward the GBInSAR due to structural deformations of one or more buildings; in fact, the reprojection along the vertical direction of the measured displacements occurred under the assumption of vertical movements, since interferometry does not enable the reconstruction of the complete movement vector. Under the conditions where all movements are assumed to be vertical, movements toward the sensor can only be interpreted as uplift. This assumption is generally valid for plain non-urbanized areas but does not account for structural displacements affecting the buildings (e.g., differential settlements causing tilting) that can produce movements with a horizontal component.
Notably, the LOS correction factors may introduce an error in the entity of displacements, especially for higher correction values, since this multiplication factor also increases noise and errors. Moreover, whenever the direction of movement is not completely vertical (as in the case of structural settlements of buildings or when the areas surrounding a sinkhole are sucked in toward its center), the correction factor calculated assuming vertical movements is incorrect, as it depends on the angle between the LOS and the (unknown) direction of movement.
All considered, the 11 years old interferometric campaign did not highlight deformations linkable to sinkhole events, although it proved the capability of the GBInSAR to measure small vertical displacements (validated by piezometric measurements) despite the unfavorable LOS and the distance. While at least two small deformations or collapses occurred in 2015, these were either shadowed by buildings or too small in size to be detected (Figure 3). Other events similar or at least of the same order of magnitude of the 1995 collapse did not take place but would have likely been detectable. However, experienced operators would be needed to be able to identify a cluster possibly consisting of a few tens of pixels, in an area affected by seasonal deformation.
Therefore, a complementary approach represented by mapping the areas at risk has been proposed. This mapping compensates for the lack of events (after the one in 1995), that could have helped training a machine learning-based susceptibility map, with an in-depth study of the territory encompassing many surveys in the geophysical, geochemical, geological, kinematical and economical fields.
The points used to monitor the displacements do not fall in the two highest risk classes, except for points P6, P7, P8, confirming that all the movements detected are not related to sinkhole processes apart for the points located in the 1995 sinkhole area.
The circular depression observed in 2015 (Figure 3A) falls in the minimum risk area since there are no valuable elements at risk, however, concerning the susceptibility, it is located at the boundary between the high and intermediate classes. This can provide clues on the origin of the depression, which could indeed be related to a sinkhole.
Overall, this experience suggests the adoption of a best practice for sinkhole risk management based on a combination of early warning, obtained through the monitoring of ground displacement, and risk mapping, to obtain a zonation of sinkhole-prone areas useful for urban planning.
6 Conclusion
An integrated approach to address sinkhole risk has been described using the case history of Camaiore territory, where a 30 m wide sinkhole occurred in 1995 destroying several buildings but causing no victims, thanks to precursor deformations that revealed the incoming collapse.
Such precursors set the premise for the installation of a GBInSAR to monitor the plain and provide early warning. The application of GBInSAR to sinkholes is remarkable as it only has few precedents in literature. This is probably because of some inherent issues of this methodology (especially the difficulty in measuring vertical movements of a flat area). On the other hand, GBInSAR grants the possibility to perform rapid mapping, that is to provide spatially continuous information with an acquisition frequency compatible with sinkhole early warning. Indeed, the ability to produce 2D displacement maps is necessary when the area to be monitored is too wide to allow for the installation of individual measurement devices (such as GNSS antennae or total station prisms).
Although no deformations linkable to developing sinkholes have been observed during the 11 years of interferometric campaign, the radar has proved its ability to catch centimetric vertical ground movements with comparable magnitude and extension of an expected sinkhole. Such measurements have been validated thanks to the comparison with piezometric monitoring, which allowed us to attribute such subsidence and upheave to the oscillations of the water table level.
Detecting precursor displacements for relatively small sinkholes (from decimeters to few meters), like the one occurred in 2015 (Figure 3A), is at best difficult over large areas like Camaiore city, since the distance does not allow for high resolution and the presence of buildings and vegetated areas can cause shadowing or decorrelation effects, respectively. In such cases, the convenience of a permanent monitoring system like a GBInSAR also depends on the expected frequency of the events, assuming that a percentage of the phenomena would be detected, or on a risk mapping highlighting large high-risk areas that could justify the investment on monitoring instrumentation. Notably, precursors of large sinkholes (like the 1995 event) presumably have an area of effect at least as large as the anomalies described in this paper and are likely to occur days before the collapse, thus allowing for a timely recognition, interpretation, warning and response.
While the GBInSAR fits within an early warning perspective, mapping the risk is a solution for a long-term urban planning with implications on the risk mitigation interventions and on the preparation of emergency plans.
It should be noted that other sinkhole mitigation countermeasures to help long-term planning exist and rely on attempting deterministic models to make a preliminary assessment of the stability conditions of a natural or anthropogenic cavity, based on the representation of a physical behavior using dimensionless ratios, which is a common engineering approach that was first adapted to sinkholes by Abdulla and Goodings (1996). To obtain information about the cavity stability, a collection of geometrical and geotechnical data concerning occurred sinkhole is necessary. By plotting such parameters, a sinkhole stability chart can be produced to estimate the threshold between safe and unsafe conditions. However, in cases like Camaiore, where the geometrical features of the underground cavity are unknown and past sinkholes are not recorded, these methods are not usable.
Therefore, complementary to early warning, risk mapping remains a more standard solution to cope with sinkhole hazard. However, in the case of Camaiore, the lack of a sufficient number of past events made it impossible to adopt methods based on past occurrences, so we relied on a set of geophysical and geological data integrated with the estimation of the effects of a sinkhole similar to the 1995 event. The vulnerability was expressed in terms of the abruptness of the collapse, which relates to the warning lead time left by sudden events; this estimation has been done using the model adopted by Ruch et al. (2012), which establishes that sinkholes occur suddenly when the ratio between their depth and their final diameter (assumed equal to the 1995 event) is higher than 2. The value of the elements at risk has been derived by an integration of the real market estate values (for the building areas) with the land cover (for crops and vegetated areas). The resulting map is an urban planning tool inclusive of all the knowledge available for the site. While the geological framework of Camaiore (karst bedrock covered by tens of m of alluvial sediment in a seismically and hydrogeologically active area) is not uncommon for sinkhole-prone areas, the application of this methodology to other sites needs to take into account possible changes; the same goes if the investigated site internally presents significant geological variations, which is not the case for Camaiore.
A synergic use of the risk map with the monitoring and early warning system would enable to mark and narrow down hotspots or areas of interest which should be monitored with in situ instrumentation, thus making the installation of instruments like GPS antennae or total station prisms more feasible, or kept under a closer vigilance with GBInSAR, thus facilitating the detection of anomalies.
Data availability statement
The raw data supporting the conclusion of this article will be made available by the authors, without undue reservation.
Author contributions
EI and RF conceptualized the work. EI, PC, and SB worked on the organization of the paper and polished the original idea. EI and SG wrote the paper. CR and DL provided the GBInSAR data and elaborations. VB provided the geological data and local information. VB, EI, and RF surveyed the area. EI, RF, PC, SB, CR, and DL reviewed the final draft.
Funding
The work was done within the framework of the project “MOSCAS—Modelli e Strumenti per la Caratterizzazione delle cavità Sotterranee” financed by the former Italian Ministry for Environment, Land and Sea Protection of Italy (Ministero dell’Ambiente e della Tutela del Territorio e del Mare—MATTM), now named Ministry of the Environment and the Protection of the Territory and the Sea.
Acknowledgments
We are thankful to the Camaiore Municipality and in particular to Graziano Dalle Luche for granting the permission of using the GBInSAR dataset.
In memoriam
In memory of Vincenzo Buchignani, passionate geologist without whom this work simply would have not been possible.
Conflict of interest
Authors CR and DL were employed by Ellegi s.r.l.—LiSALab.
The remaining authors declare that the research was conducted in the absence of any commercial or financial relationships that could be construed as a potential conflict of interest.
Publisher’s note
All claims expressed in this article are solely those of the authors and do not necessarily represent those of their affiliated organizations, or those of the publisher, the editors and the reviewers. Any product that may be evaluated in this article, or claim that may be made by its manufacturer, is not guaranteed or endorsed by the publisher.
References
Abdulla, W. A., and Goodings, D. J. (1996). Modeling of sinkholes in weakly cemented sand. Journal of geotechnical engineering 122 (12), 998–1005.
Baer, G., Magen, Y., Nof, R. N., Raz, E., Lyakhovsky, V., and Shalev, E. (2018). InSAR measurements and viscoelastic modeling of sinkhole precursory subsidence: Implications for sinkhole formation, early warning, and sediment properties. J. Geophys. Res. Earth Surf. 123 (4), 678–693. doi:10.1002/2017JF004594
Bianchini, S., Confuorto, P., Intrieri, E., Sbarra, P., Di Martire, D., Calcaterra, D., et al. (2022). Machine learning for sinkhole risk mapping in Guidonia-Bagni di Tivoli plain (Rome), Italy. Geocarto Int. 37, 16687–16715. doi:10.1080/10106049.2022.2113455
Brinkmann, R., Parise, M., and Dye, D. (2008). Sinkhole distribution in a rapidly developing urban environment: Hillsborough County, Tampa Bay area, Florida. Eng. Geol. 99 (3-4), 169–184. doi:10.1016/j.enggeo.2007.11.020
Buchignani, V., Avanzi, G. A., Giannecchini, R., and Puccinelli, A. (2008). Evaporite karst and sinkholes: A synthesis on the case of Camaiore (Italy). Environ. Geol. 53 (5), 1037–1044. doi:10.1007/s00254-007-0730-x
Buchignani, V., Dalle Luche, G., Giannecchini, R., Palli, V., and Vagli, R. (2015). Analisi sulla predisposizione al dissesto sinkhole nella Conca di Camaiore (LU), di supporto all’aggiornamento del PAI ed alla pianificazione urbanistica. Mem. Descr. Carta Geol. D’It. XCIX 55, 81–100.
Caramanna, G., Ciotoli, G., and Nisio, S. (2008). A review of natural sinkhole phenomena in Italian plain areas. Nat. hazards 45 (2), 145–172. doi:10.1007/s11069-007-9165-7
Casagli, N., Intrieri, E., Tofani, V., Gigli, G., and Raspini, F. (2023). Landslide detection, monitoring and prediction with remote-sensing techniques. Nat. Rev. Earth Environ. 4 (1), 51–64. doi:10.1038/s43017-022-00373-x
Civita, M., and De Maio, M. (2004). Assessing and mapping groundwater vulnerability to contamination: The Italian combined approach. Geofísica Int. 43 (4), 513–532. doi:10.22201/igeof.00167169p.2004.43.4.776
Conti, P., Carmignani, L., Giglia, G., Meccheri, M., and Fantozzi, P. .L. (2004). “Evolution of geological interpretations in the Alpi Apuane metamorphic complex, and their relevance for geology of the Northern Apennines,” in The ‘Regione Toscana’ project of geological mapping, Spec, vol for the 32nd IGC. Editors D. Morini, and P. Bruni (Italy: Tipografia Martinelli), 241–262.
Conti, P., and Lazzarotto, A. (2004). “Geology of Tuscany: Evolution of the state-of-knowledge presented by geological maps and the new geological map of tuscani, 1:250,000 scale,” in The ‘Regione Toscana’ project of geological mapping, Spec. vol for the 32nd IGC. Editors D. Morini, and P. Bruni (Italy: Tipografia Martinelli), 25–50.
D’Amato Avanzi, G., Puccinelli, A., and Verani, M. (2002). “Geologic features of the Camaiore plain linked to the 15 October 1995 sinkhole,” in Le voragini catastrofiche. Un nuovo problema per la Toscana. Editor R. Toscana (Italy: Regione Toscana Giunta Regionale), 154–175.
D’Amato Avanzi, G. A., Giannecchini, R., Puccinelli, A., and Verani, M. (2004). “Assetto geologico e pericolosità da sinkhole in aree urbane: Il caso di Camaiore (Toscana, italia),” in Stato dell’arte sullo studio dei fenomeni di sinkholes, 331–346. (in Italian).
De Bruyn, I. A., and Bell, F. G. (2001). The occurrence of sinkholes and subsidence depressions in the Far West Rand and Gauteng Province, South Africa, and their engineering implications. Environ. Eng. Geoscience 7 (3), 281–295. doi:10.2113/gseegeosci.7.3.281
Del Ventisette, C., Intrieri, E., Luzi, G., Casagli, N., Fanti, R., and Leva, D. (2011). Using ground based radar interferometry during emergency: The case of the A3 motorway (Calabria Region, Italy) threatened by a landslide. Nat. Hazards Earth Syst. Sci. 11 (9), 2483–2495. doi:10.5194/nhess-11-2483-2011
Di Filippo, M., and Toro, B. (2004). Indagini gravimetriche e microgravimetriche nell’abitato di Camaiore. Available at: https://www.isprambiente.gov.it/files/pubblicazioni/atti/stato-arte-sinkholes/407-414.pdf.
Elter, P., Giglia, G., Tongiorgi, M., and Trevisan, L. (1975). Tensional and compressional areas in the recent (Tortonian to present) evolution of the Northern Apennines. Boll. Geofis. Teor. Appl. 17, 3–18.
Ferentinou, M., Witkowski, W., Hejmanowski, R., Grobler, H., and Malinowska, A. (2020). Detection of sinkhole occurrence, experiences from South Africa. Proc. Int. Assoc. Hydrological Sci. 382, 77–82. doi:10.5194/piahs-382-77-2020
Ferrigno, F., Gigli, G., Fanti, R., Intrieri, E., and Casagli, N. (2017). GB-InSAR monitoring and observational method for landslide emergency management: The montaguto earthflow (AV, Italy). Nat. Hazards Earth Syst. Sci. 17 (6), 845–860. doi:10.5194/nhess-17-845-2017
Gao, Y., and Alexander, E. C. (2003). “A mathematical model for a map of relative sinkhole risk in Fillmore County, Minnesota,” in Sinkholes and the engineering and environmental impacts of karst (U.S. and Canada: ASCE Library), 439–449.
Guerrero, J., Sevil, J., Desir, G., Gutiérrez, F., Arnay, Á. G., Galve, J. P., et al. (2021). The detection of active sinkholes by airborne differential LiDAR DEMs and InSAR cloud computing tools. Remote Sens. 13 (16), 3261. doi:10.3390/rs13163261
Gutiérrez, F., Guerrero, J., and Lucha, P. (2008). A genetic classification of sinkholes illustrated from evaporite paleokarst exposures in Spain. Environ. Geol. 53 (5), 993–1006. doi:10.1007/s00254-007-0727-5
Gutierrez, F., Parise, M., De Waele, J., and Jourde, H. (2014). A review on natural and human-induced geohazards and impacts in karst. Earth Sci. Rev. 138, 61–88. doi:10.1016/j.earscirev.2014.08.002
Heyman, Y., Steenmans, C., Croisille, G., and Bossard, M. (1994). CORINE land cover project technical guide. Brussels- Luxembourg: European Commission, Directorate General Environment, Nuclear Safety and Civil Protection, ECSC-EEC-EAEC, 136.
Intrieri, E., Fontanelli, K., Bardi, F., Marini, F., Carlà, T., Pazzi, V., et al. (2018). Definition of sinkhole triggers and susceptibility based on hydrogeomorphological analyses. Environ. earth Sci. 77 (1), 4–18. doi:10.1007/s12665-017-7179-3
Intrieri, E., Gigli, G., Nocentini, M., Lombardi, L., Mugnai, F., Fidolini, F., et al. (2015). Sinkhole monitoring and early warning: An experimental and successful GB-InSAR application. Geomorphology 241, 304–314. doi:10.1016/j.geomorph.2015.04.018
Jaynes, E. .T. (1957). Information theory and statistical mechanics. Phys. Rev. 106 (4), 620–630. doi:10.1103/physrev.106.620
Jones, C. E., and Blom, R. G. (2014). Bayou Corne, Louisiana, sinkhole: Precursory deformation measured by radar interferometry. Geology 42 (2), 111–114. doi:10.1130/g34972.1
Jones, E. J. (2021). “Capabilities, limitation and opportunities for studying sinkholes using synthetic aperture radar interferometry,” in Proceedings of the 16th Multidisciplinary Conference on Sinkholes and the Engineering and Environmental Impacts of Karst and the 3rd Appalachian Symposium, Puerto Rico, USA, 12–16 April 2021.
Kim, Y. J., Nam, B. H., Shamet, R., Soliman, M., and Youn, H. (2020). Development of sinkhole susceptibility map of east central Florida. Nat. Hazards Rev. 21 (4), 04020035. doi:10.1061/(asce)nh.1527-6996.0000404
Klimchouk, A. (2009). Morphogenesis of hypogenic caves. Geomorphology 106 (1-2), 100–117. doi:10.1016/j.geomorph.2008.09.013
Lee, E. J., Shin, S. Y., Ko, B. C., and Chang, C. (2016). Early sinkhole detection using a drone-based thermal camera and image processing. Infrared Phys. Technol. 78, 223–232. doi:10.1016/j.infrared.2016.08.009
Luzi, G. (2022). Catalan telecommunications technology centre, castelldefels. Barcelona, Spain): Personal communication.
Malinowska, A. A., Witkowski, W. T., Hejmanowski, R., Chang, L., van Leijen, F. J., and Hanssen, R. F. (2019). Sinkhole occurrence monitoring over shallow abandoned coal mines with satellite-based persistent scatterer interferometry. Eng. Geol. 262, 105336. doi:10.1016/j.enggeo.2019.105336
Nof, R. N., Abelson, M., Raz, E., Magen, Y., Atzori, S., Salvi, S., et al. (2019). SAR interferometry for sinkhole early warning and susceptibility assessment along the Dead Sea, Israel. Remote Sens. 11 (1), 89. doi:10.3390/rs11010089
Oliver-Cabrera, T., Wdowinski, S., Kruse, S., and Robinson, T. (2020). InSAR detection of localized subsidence induced by sinkhole activity in suburban west-central Florida. PIAHS 382, 155–159. doi:10.5194/piahs-382-155-2020
Osasan, K. S., and Afeni, T. B. (2010). Review of surface mine slope monitoring techniques. J. Min. Sci. 46 (2), 177–186. doi:10.1007/s10913-010-0023-8
Parise, M., and Lollino, P. (2011). A preliminary analysis of failure mechanisms in karst and man-made underground caves in Southern Italy. Geomorphology 134 (1-2), 132–143. doi:10.1016/j.geomorph.2011.06.008
Pazzi, V., Di Filippo, M., Di Nezza, M., Carlà, T., Bardi, F., Marini, F., et al. (2018). Integrated geophysical survey in a sinkhole-prone area: Microgravity, electrical resistivity tomographies, and seismic noise measurements to delimit its extension. Engineering Geology 243, 282–293.
Pellicani, R., Spilotro, G., and Gutiérrez, F. (2017). Susceptibility mapping of instability related to shallow mining cavities in a built-up environment. Eng. Geol. 217, 81–88. doi:10.1016/j.enggeo.2016.12.011
Pieraccini, M., Tarchi, D., Rudolf, H., Leva, D., Luzi, G., and Atzeni, C. (2000). Interferometric radar for remote monitoring of building deformations. Electron. Lett. 36, 569–570. doi:10.1049/el:20000475
Roche, O., vanWyk de Vries, B., and Druitt, T. H. (2001). Sub-surface structures and collapse mechanisms of summit pit craters. J. Volcanol. Geotherm. Res. 105, 1–18. doi:10.1016/S0377-0273(00)00248-1
Ruch, J., Acocella, V., Geshi, N., Nobile, A., and Corbi, F. (2012). Kinematic analysis of vertical collapse on volcanoes using experimental models time series. J. Geophys. Res. Solid Earth 117 (B7). doi:10.1029/2012jb009229
Rucker, M. L., Panda, B. B., Meyers, R. A., and Lommler, J. C. (2013). Using InSAR to detect subsidence at brine wells, sinkhole sites, and mines. Carbonates Evaporites 28 (1), 141–147. doi:10.1007/s13146-013-0134-9
Solari, L., Del Soldato, M., Bianchini, S., Ciampalini, A., Ezquerro, P., Montalti, R., et al. (2018). From ERS 1/2 to sentinel-1: Subsidence monitoring in Italy in the last two decades. Front. Earth Sci. 6, 149. doi:10.3389/feart.2018.00149
Tarchi, D., Casagli, N., Fanti, R., Leva, D. D., Luzi, G., Pasuto, A., et al. (2003). Landslide monitoring by using ground-based SAR interferometry: An example of application to the tessina landslide in Italy. Eng. Geol. 68 (1-2), 15–30. doi:10.1016/s0013-7952(02)00196-5
Tarchi, D., Rudolf, H., Luzi, G., Chiarantini, L., Coppo, P., and Sieber, A. J., 1999. "SAR interferometry for structural change detection: A demonstration test on a dam", Proc. Geoscience Remote Sens. Symposium, IGARSS, vol. 3, pp. 1525–1527.
Theron, A., Engelbrecht, J., Kemp, J., Kleynhans, W., and Turnbull, T. (2017). Detection of sinkhole precursors through SAR interferometry: Radar and geological considerations. IEEE Geoscience Remote Sens. Lett. 14 (6), 871–875. doi:10.1109/lgrs.2017.2684905
Tufano, R., Guerriero, L., Annibali Corona, M., Bausilio, G., Di Martire, D., Nisio, S., et al. (2022). Anthropogenic sinkholes of the city of naples, Italy: An update. Nat. Hazards 112 (3), 2577–2608. doi:10.1007/s11069-022-05279-x
Waltham, T., Bell, F., and Culshaw, M. (2005). Sinkholes and subsidence. Karst and cavernous rocks in engineering and construction. Chichester: Springer, 382.
Weary, D. .J., and Doctor, D. .H. (2014). Karst in the United States: A digital map compilation and database. United States: U.S. Geological Survey Open.
Weary, D. J. (2015). “The cost of karst subsidence and sinkhole collapse in the United States compared with other natural hazards,” in Proceedings of the 14th Multidisciplinary Conference on Sinkholes and the Engineering and Environmental Impacts o Karst, New Mexico, USA, 433–445. doi:10.5038/9780991000951
Keywords: sinkholes, interferometry, SAR, risk mapping, karst, subsidence, InSAR
Citation: Intrieri E, Confuorto P, Bianchini S, Rivolta C, Leva D, Gregolon S, Buchignani V and Fanti R (2023) Sinkhole risk mapping and early warning: the case of Camaiore (Italy). Front. Earth Sci. 11:1172727. doi: 10.3389/feart.2023.1172727
Received: 23 February 2023; Accepted: 02 May 2023;
Published: 16 May 2023.
Edited by:
Djamil Al-Halbouni, Helmholtz Association of German Research Centres (HZ), GermanyReviewed by:
Osama AlRabayah, Helmholtz Association of German Research Centres (HZ), GermanyMario Parise, University of Bari Aldo Moro, Italy
Copyright © 2023 Intrieri, Confuorto, Bianchini, Rivolta, Leva, Gregolon, Buchignani and Fanti. This is an open-access article distributed under the terms of the Creative Commons Attribution License (CC BY). The use, distribution or reproduction in other forums is permitted, provided the original author(s) and the copyright owner(s) are credited and that the original publication in this journal is cited, in accordance with accepted academic practice. No use, distribution or reproduction is permitted which does not comply with these terms.
*Correspondence: Emanuele Intrieri, ZW1hbnVlbGUuaW50cmllcmlAdW5pZmkuaXQ=