 Mechthild Doll1*
 Miriam Römer1
 Thomas Pape1
 Martin Kölling1
 Norbert Kaul2
 Christian dos Santos Ferreira1
 Gerhard Bohrmann1
- 1MARUM - Center for Marine Environmental Sciences and Faculty of Geosciences, University of Bremen, Bremen, Germany
- 2Faculty of Geosciences, University of Bremen, Bremen, Germany
Mud volcanoes (MVs) are surface structures typically created by episodic discharge of fluids and solids, often associated to onshore and offshore accretionary prisms on convergent plate boundaries. Detailed investigations of ongoing activity and its associated morphological changes, as well as a better understanding of the temporal evolution of these highly dynamic systems, may improve the estimations of material fluxes from MVs drastically. Until today, approximately 70 individual MVs were discovered in the northern Ionian Sea in the Calabrian Arc (Central Mediterranean Sea), but only a few have been analyzed and described in detail. In this study, new evidence for recent recurring eruptive activity of the ∼45 m-high and 1 km-wide Sartori MV situated in the clastic wedge of the Calabrian Arc is presented. High-resolution seafloor mapping as well as sediment temperature, geochemical, and sedimentological data received from two research cruises in 2016 and 2020 are used. Bathymetric and seafloor backscatter data (1 m scale) indicate the presence of two active eruption centers at the flat-topped Sartori MV. Elevated sediment temperature gradients at both eruption centers show that currently heat is transferred to the surface sediments. Pore water analyses indicate that fluids rising below the eruption centers are CH4-rich, Cl−-poor, and SO42−-free. Stable C and H isotopic compositions of methane suggest that it originates from a mix of primary microbial, secondary microbial, and/or thermogenic sources. A relatively shallow position of the sulfate–methane interface at both eruption centers also indicates the presence of upward fluid migration in recent times. Pore water modeling suggests that seawater has penetrated the surface sediments to a greater extent within the last few years. In contrast, centimeter-thick layers of hemipelagic sediments overlying mud breccia in sediment cores taken from both eruption centers show that no solid material has been ejected in recent times. Sediment core analyses combined with high-resolution seafloor mapping show an absence of rim-passing mudflows over the past ∼10 ka. It is concluded that Sartori MV is an episodically active MV from which fluids with a comparatively low flux were released into the bottom water in recent times.
1 Introduction
Mud volcanoes (MVs) are geological structures that occur in onshore and offshore settings but are most abundant in geologically active regions (Higgins and Saunders, 1974; Milkov, 2000; Kopf, 2002; Mazzini and Etiope, 2017). The majority of MVs are distributed in compressional tectonic settings, such as accretionary prisms (Dimitrov, 2002; Kopf, 2002). MVs are fed by one or more feeder channels rooting deep within their source rock (Etiope and Milkov, 2004; Somoza et al., 2012; Menapace et al., 2017b) and are driven by the upward migration of overpressured fluids, ending in the extrusion of solids (mud breccia), liquids, and gases (Revil, 2002; Planke et al., 2003; Etiope, 2015; Mazzini and Etiope, 2017). Mud breccia contain fine-grained mud and clasts of different sizes from strata the material crossed on its way up through the sub-surface (Milkov, 2000; Revil, 2002). The morpho-structural shapes of MVs consist of a broad variety, including crater-like structures, (collapsed) mud cones, and flat-topped edifices (Kopf, 2002; Paull et al., 2015; Mazzini and Etiope, 2017). It has been proposed to divide the activity cycle of a MV into four phases: eruption (episodic overpressured material in the feeder channel with the formation of the MV edifice and the eruption of high volumes of mud breccia), depletion (upward fluid migration and the ejection of small volumes of mud breccia), quiescence (MV subsidence, caldera build-up, accumulation of pore pressure, and ejection of small volumes of mud breccia), and reactivation (resuming of the active phase; Mazzini and Etiope, 2017; Menapace et al., 2017a). Ongoing MV activity is often associated with seafloor discharge of bubble-forming gas originating from overpressured or naturally escaping pore fluids, which are hydroacoustically detectable as flares in the water column (Greinert et al., 2006; Sauter et al., 2006; Sahling et al., 2009; Römer et al., 2014). Further evidence of MV activity comes from temperature and pore water concentration anomalies (Bohrmann et al., 2003; Castellini et al., 2006; Mastalerz et al., 2007; Feseker et al., 2009; Pape et al., 2010; Feseker et al., 2014; Pape et al., 2014), which are, in contrast to gas bubble escape in the water column, also identifiable after the eruptive phase of a MV. When pore water compositions show a significant depth gradient, any transient deviation from stationary conditions may be used to estimate the timing of sediment-disturbing events (Niewöhner et al., 1998; Hensen et al., 2007; Strasser et al., 2013; Pape et al., 2020b).
Marine sediments typically show pore water of dissolved sulfate concentrations to be linearly decreasing with depth until they reach the sulfate–methane interface (SMI), where most of the seawater-derived SO42− is consumed by the microbially mediated anaerobic oxidation of methane (AOM; Claypool and Kaplan, 1974; Boetius et al., 2000). Below the SMI, methanogenesis is the main metabolism and pore waters are characterized by increasing methane concentrations with depth (Castellini et al., 2006). The depth of the SMI is controlled by the flux of organic matter, the intensity of sulfate consumption, and the strength of upward migrating CH4 from buried methane reservoirs in the sediment column (Dickens, 2001; Bhatnagar et al., 2008; Pape et al., 2020b). In advection-dominated regimes (such as MVs), the SMI is situated close to the seafloor when CH4 and other light hydrocarbons migrate rapidly through the channel to the seafloor, driving hydrocarbon oxidation in the shallow seabed (Borowski et al., 1999; Suess et al., 1999). To prove transient SO42− concentration profiles and track the fluid evolution over time, pore water chloride (Cl−) concentrations can be used (Castellini et al., 2006).
More than 500 submarine MVs are known from the Mediterranean Sea so far (Mascle et al., 2014; Miramontes et al., 2023), and the regions of MV activity are influenced by the African–European subduction zone (Dimitrov, 2002; Kopf, 2002). From the northern Ionian Sea, which hosts Sartori MV investigated here, approximately 70 individual MVs were discovered until today (Ceramicola et al., 2014b; Cuffaro et al., 2019). Except from detailed analyses of the active twin-cone Venere MV (Loher et al., 2018a; b, c) and the dormant flat-topped Bortoluzzi MV (Cuffaro et al., 2019), both located in the forearc basins, studies about the Calabrian Arc MVs mainly concentrated on their general distribution and morphologies (Praeg et al., 2009; Panieri et al., 2013; Ceramicola et al., 2014b). In the area of Sartori MV, two sediment cores consisting of chaotic deposits and pebbly mudstones were recovered in 1981 (Morlotti et al., 1982) and referred to MV activity by Sartori (2003), confirmed by Panieri et al. (2013). In 2014, the ∼45 m-high and ∼1 km-wide Sartori MV was first described and named by Ceramicola et al. (2014b).
In this study, new data from Sartori MV that was investigated in detail during two research cruises in May 2016 and October–December 2020 (POS499 with R/V POSEIDON and SO278 with R/V SONNE) are reported. It includes high-resolution seafloor mapping, investigations of in-situ sediment temperatures, geochemical pore water analyses, and sedimentological observations. These data are used to define the timing and extent of mass and pore water egress and the utility of these sampling techniques for constraining active processes in mud volcano settings.
2 Geological setting
The Calabrian Arc subduction complex in the central Mediterranean Sea is the Calabrian Accretionary Prism (CAP; Figure 1). It is formed as a result of the progressive northwest-oriented subduction of the African Plate below the Eurasian Plate, accompanied by slab-rollback and formation of back-arc basins during the past 30 Ma (Malinverno and Ryan, 1986; Wortel and Spakman, 2000; Faccenna et al., 2011). The African–Eurasian convergence in this area is relatively slow, with rates of less than 5 mm/yr (Serpelloni et al., 2007; Palano et al., 2012). The Calabrian subduction zone is assumed to present an area where remnants of the Mesozoic oceanic crust of the Neo-Tethys Ocean are involved in subduction until today (Spakman, 1986; Rosenbaum et al., 2002; Granot, 2016). The CAP consists of up to 10 km of scraped-off sediments which accumulated and formed the overall accretionary complex spanning over 300 km from onshore Calabria to the Ionian Abyssal Plain, where it intersects with the Mediterranean Ridge (Figure 1; Rossi and Sartori, 1981; Minelli and Faccenna, 2010). It is bounded by the Malta escarpment to the southwest and the Apulia escarpment to the northeast. These are the two major structural discontinuities in this area (Cernobori et al., 1996; Gallais et al., 2012). The morphology and structure of the CAP may be divided into three main parts: 1) the post-Messinian external evaporitic wedge, 2) the pre-Messinian internal clastic wedge in which Sartori MV studied herein is located, and 3) the Spartivento–Crotone forearc basins (Figure 1; Polonia et al., 2011; Ceramicola et al., 2014a; Gutscher et al., 2017). The pre-Messinian internal wedge mainly hosts clastic sediments affected by thrusts forming basins and ridges of several hundred meters in relief. The Calabrian Escarpment, which reaches up to 750 m above the seafloor, marks the transition from an inner plateau to an outer, more rugged area (Cernobori et al., 1996; Praeg et al., 2009; Polonia et al., 2011; Gutscher et al., 2017). In contrast, the post-Messinian external wedge hosts evaporites originating from the Messinian salinity crises (Hsü et al., 1977; Roveri et al., 2014). Complex geodynamic processes, strike–slip faulting, and internal deformation of the external and internal wedges are the responses of the steady and ongoing subduction (Gutscher et al., 2019). Low-velocity anomalies of seismic waves are coincident spatially with compressional structures and tectonic thrusting, resulting in mud volcanism associated with fluid and mud expulsion at the surface (Prada et al., 2020). The offshore Spartivento–Crotone forearc basins with accreted Mesozoic–Cenozoic units at their basements are filled with sediments of the Miocene age (i.e., Messinian evaporites) up to Plio-Pleistocene units (Capozzi et al., 2012; Zecchin et al., 2015).
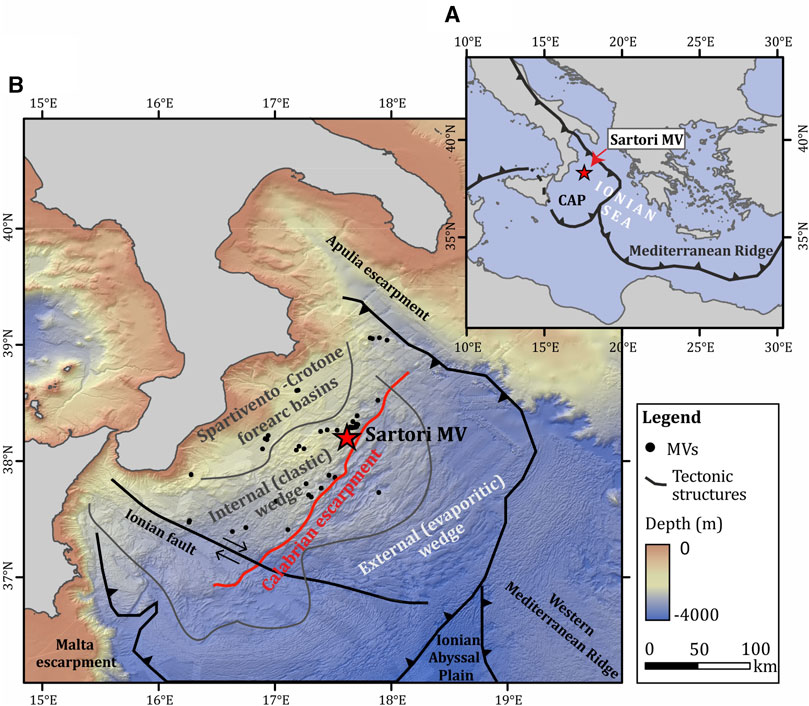
FIGURE 1. (A) Overview map showing the location of Sartori MV (red star) in the northern Calabrian Accretionary Prism (CAP) within the northern-central Ionian Sea. Plate boundaries and the African–Eurasian subduction zone are shown in black (according to Gutscher et al. (2017)). (B) Bathymetric map of the CAP (https://emodnet.ec.europa.eu/en/bathymetry). Sartori MV (red star) is situated within the internal clastic wedge of the CAP, west of the Calabrian escarpment (red line, Ceramicola et al., 2014b). Black dots represent other MVs in this region which are expected, inferred, and partially approved (Ceramicola et al., 2014b; Loher et al., 2018a). Plate boundaries and the African–Eurasian subduction zone are shown in black (according to Gutscher et al., 2017).
3 Materials and methods
3.1 Hydroacoustic seafloor and water column investigations
Swath bathymetry data were obtained during cruise SO278 in 2020 (Bohrmann et al., 2022) using a Kongsberg EM122 (12 kHz) ship-borne hydroacoustic system. The multibeam data included the water column backscatter information, which has been analyzed for anomalies resulting from gas bubble emissions using the QPS Fledermaus midwater tool. During cruise POS499 (Bohrmann et al., 2016), high-resolution swath bathymetry and seafloor backscatter data were collected with a Kongsberg EM 2040 (400 kHz) system mounted on the autonomous underwater vehicle (AUV) MARUM-SEAL 5000. The altitude of the AUV was ∼80 m above seafloor. Post-processing of bathymetric and backscatter data was carried out using the open-source software MB-System (Caress and Chayes, 1996). While the resulting ship-based bathymetric grid has a resolution of 25 m, the AUV-based bathymetry data were gridded at 1 m lateral and decimeter-scale vertical resolution. The AUV-borne grids were tied to the ship-borne bathymetry by setting anchor points at prominent morphological features which shifted the AUV grids both vertically and laterally to its final position with an uncertainty of ∼30 m.
3.2 Sediment sampling, core description, and line scanning
Cores of near-surface sediment from Sartori MV were collected during cruises POS499 and SO278 with a gravity corer (GC) equipped with a 5.75 m-long core barrel (Table 1). For retrieval of sediment cores with almost undisturbed sediment surfaces, a multicorer (MUC) equipped with six tubes (≤50 cm core length) was used.
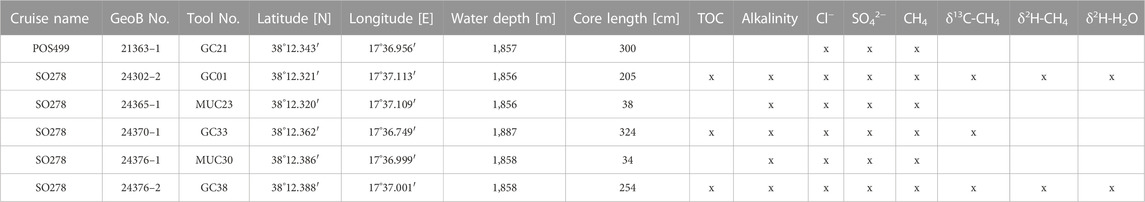
TABLE 1. Specifics of GC and MUC cores collected during cruises POS499 (2016) and SO278 (2020) relevant in this study and geochemical analyses performed for gas and pore water samples.
Individual coring positions were chosen by investigating bathymetric and seafloor backscatter data, focusing on sampling sites as close as possible to the mud extrusion sites (Figure 2). For accurate positioning, the Posidonia underwater navigation system (IXSEA) with a transducer mounted on the cable 50 m above both coring devices was used. Gravity core GC21 was taken in a flexible plastic foil liner, which allowed for rapid access to the sediment. The core was used for core description and pore water sampling. Gravity cores GC01, GC33, and GC38 were taken in rigid plastic liners for transportation and long-term storage in the MARUM core repository. The uppermost (∼5 cm) of very fluidized material of GC01 is not preserved within the core liner and, therefore, not further analyzed. To capture sedimentary structure patterns, such cores were longitudinally split immediatedly after recovery on board during cruise SO278, and the archive halves were photographed at a 500-dpi resolution using the smartCIS1600 line scanner of the MARUM GeoB Core Repository. To investigate the presence of mud breccia and analyze changes in the lithology, macroscopic core descriptions were generated for all cores. These can be found, merged with the line scans, in the Supplementary Material.
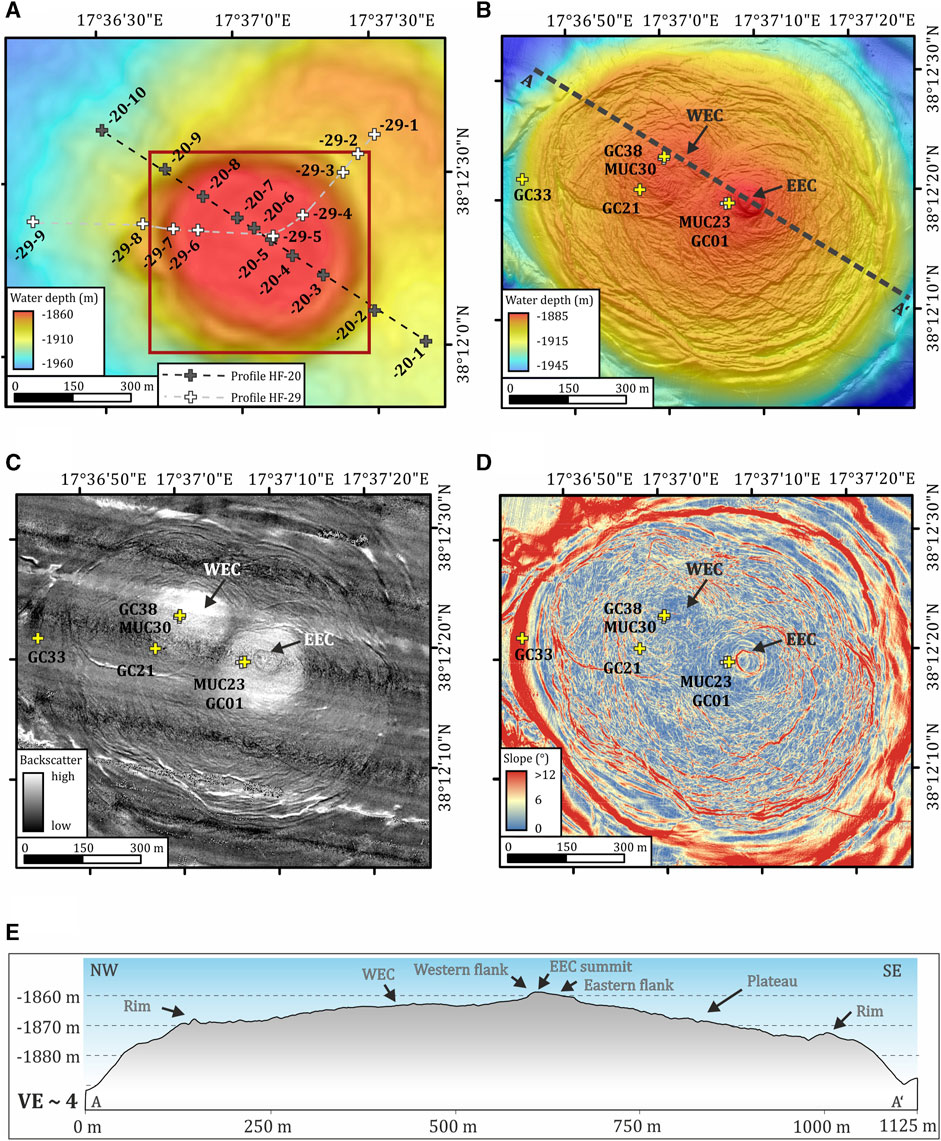
FIGURE 2. (A) Ship-borne bathymetry acquired during cruise SO278 showing the flat-topped Sartori MV at a resolution of 25 m and the positioning of the heat flow probe sites. (B) High-resolution (1 m) AUV-borne bathymetry of the entire edifice of Sartori MV visualizing small-scale seafloor features. Positions of GC and MUC coring sites are also shown. EEC, eastern eruption center; WEC, western eruption center. (C) High-resolution backscatter map showing central high seafloor backscatter areas and GC and MUC sites. (D) Slope data as well as GC and MUC locations. (E) NW–SE-oriented profile across the MV showing major morphological elements (WEC, EEC, plateau, and rim).
3.3 Preparation of headspace gas and pore water samples
For vertical profiling of ex-situ concentrations of dissolved methane and the determination of methane stable C and H isotopic composition, headspace gas samples were prepared from both MUC cores and gravity cores, following a modified method based on Kvenvolden and McDonald (1986), as described in Pape et al. (2014). Approximately 3 mL of bulk sediment was collected from the cores with cut-off plastic syringes and transferred into 22-mL glass vials prefilled with 5 mL of a 1 M NaOH solution. The vials were crimp-capped with a butyl rubber stopper and stored upside-down until analysis. The sampling interval for pore water CH4 measurements was 2 cm in MUC tubes and generally 25 cm in GCs (min. 21 cm to max 50 cm depending on the core characteristics).
Pore water concentrations were used for i) assessment of the modern SMI depth and ii) for modeling the evolution of pore water concentration profiles. Pore water was extracted ex situ from selected sediment depths of four gravity cores (GC01, GC21, GC33, and GC38) and two MUC cores (MUC23 and MUC30). Pore water samples were collected from whole round sediment cores using disposable syringes and rhizon samplers (Seeberg-Elverfeldt et al., 2005; Dickens et al., 2007). Rhizons automatically filter samples at <0.15 µm. Unused rhizons have been soaked in DI water prior to use; to rinse the dead volume (approximately 120 μL) and potential production-related contaminants, the initial volume of the pore water sample has been discarded. The sampling interval for pore water measurements of SO42− and Cl− at MUC cores was every 5 cm, starting from 2 cm (MUC30) and 3 cm (MUC23) core depth. A sampling interval of 10 cm was used for pore water measurements of SO42− and Cl− in GC cores ranging from a core depth of 5 cm (GC21; GC33; and GC38) or 10 cm (GC01) sediment depth. For concentration analysis of anions Cl− and SO42− at the MARUM sediment geochemistry lab, untreated pore water samples of filtered and unacidified aliquots were extracted and stored at 4°C until analysis.
3.4 Gas and pore water analyses and modeling of pore water concentration profiles
Concentrations of dissolved methane in headspace gas samples were either determined onshore (POS499) or on board (SO278) using an Agilent Technologies three-channel 7890B gas chromatograph (Pape et al., 2010). Methane and C2–C6 hydrocarbons were separated and quantified with a capillary column connected to a flame ionization detector. Calibrations and performance checks of the analytical system were conducted regularly using commercial pure gas standards and gas mixtures, which yielded a precision better than 1.5%. Reported concentrations are not corrected for sediment porosity and Bunsen coefficient.
Stable carbon and hydrogen isotope ratios (13C/12C and 2H/1H) of methane were determined for selected headspace gas samples prepared from gravity cores at MARUM as described in Pape et al. (2020a) and Pape et al. (2020b). A Trace GC Ultra-GC IsoLink connected to a MAT 253 isotope ratio mass spectrometer (IRMS) via a ConFlo IV interface (all components Thermo Fisher Scientific Inc.) was used. Methane was separated by gas chromatography and either combusted (1,030°C) or pyrolyzed (1,440°C) to generate CO2 or H2, respectively. CO2 or H2 was then transferred to the IRMS for analysis of 13C/12C or 2H/1H. Reported isotope ratios are arithmetic means of duplicate measurements at least in the δ-notation (in ‰) relative to Vienna PeeDee Belemnite (VPDB) for carbon and Vienna Standard Mean Ocean Water (VSMOW) for hydrogen. Reproducibility was checked daily using commercial methane standards (Isometric Instruments, Canada; Air Liquide GmbH, Germany). The standard deviations of triplicate measurements (δ13C-CH4) were <0.5‰.
Concentrations of Cl− and SO42− in pore water samples were analyzed by ion chromatography (IC) using a Metrohm 882 Compact Ion Chromatograph with an 858 Professional Sample Processor. Standardization was performed against multi-element solutions prepared from commercial single-element standard solutions (National Institute of Standards and Technology Certified Reference Material® NIST CRM). Moreover, IAPSO Standard Seawater from Osil® was used as an external reference material. The precision was 1-σ: < ± 1.0% for Cl− and 1-σ: < ± 2.0% for SO42−.
Depth correction by +10 cm was successfully applied at GC01 only (see Supplementary Material). The alignment is found to be most sensitive by comparing the pore water alkalinity profile (Supplementary Figure S1). The corrected depth of GC01 is used for depth estimation of the SMI and for modeling the pore water concentration profiles of GC01.
Modeling of pore water concentration profiles was performed to mimic the diffusive response to the last disturbance in pore water concentration gradients that may be used to estimate the time that has elapsed since the last MV activity. It is a diffusion-only model in which the initial conditions are prescribed, and the boundary conditions are fixed at the seafloor and at the base of the pore water profile. The method is described in detail in Schulz and Schulz (2005). For modeling, Cl− and SO42− depth-corrected concentrations of GC01 and depth-uncorrected data of GC21 and GC38 were used.
3.5 In-situ sediment temperature measurements
At site GC21 of cruise POS499, five miniaturized temperature data loggers (MTLs; ANTARES Datensysteme GmbH, Germany) attached to the gravity corer were used for measuring in-situ sediment temperatures at an interval of 0.5–1 m (Pfender and Villinger, 2002). An additional logger was mounted on top of the weight to measure bottom water temperature as reference. The gravity corer was left in the seabed for ∼10 min. The accuracy of the MTLs is ∼0.1°C, while the resolution is more than ±0.002 K. During cruise SO278, two in-situ temperature gradient profiles, including 20 individual temperature probe sites, were measured with a conventional 6 m-long giant heat flow probe from the GEOMAR Helmholtz Center for Ocean Research Kiel, Germany. The temperature probe is constructed following the classical “violin bow” design (Bullard, 1954) and described in detail in Hyndman et al. (1979) and Villinger et al. (2010). In total, 22 single thermistors were distributed in an interval of 0.25 m in an oil-filled sensor tube, resulting in an active length of 5.25 m. The resolution of the thermistors is better than 0.002 K over a temperature range from −2 to 60°C. The sensor tube contains a heating wire for heat pulse generation for in-situ thermal conductivity measurements. The sampling interval of temperature readings was set to 1 Hz. A calibrated PT-100 seawater temperature sensor allowed calibrating all thermistors with reference to the seawater. At each site, the heat flow probe was left in the sediment for ∼10 min after penetration to allow the thermistors to adjust to ambient temperatures at each depth. The in-situ sediment temperature in its equilibrium state was calculated afterward by extrapolation from the time series of each individual thermistor. Usually, 21 thermistors were found to work properly.
All temperature data are analyzed and processed after deployment using the program MHFRed, according to Villinger and Davis (1987). A penetration-depth control and tilt correction are included in this program (Villinger and Davis, 1987).
4 Results
4.1 Seafloor morphology
The ship-based multibeam bathymetry of the region around Sartori MV (Figure 2) shows that the MV is a nearly circular, flat-topped topographic structure. The MV has a diameter of ∼1 km and a height of ∼45 m, relative to the surrounding seafloor. In general, the surface of the central area is characterized by a relatively rough and chaotic morphology and is downward sloping from its geometric center toward the outer rim with steep flanks (Figures 2D, E). The high-resolution bathymetry shows two mud eruption centers located approximately 225 m apart from each other in the inner part of the MV to the east and west of the geometrical center of the MV (Figures 2B, E). In the following text, these eruption centers are called the western eruption center (WEC; situated at ∼1,863 m water depth) and the eastern eruption center (EEC; situated at ∼1,853 m water depth).
The EEC is a positive surface feature with a summit (peak) that rises about 3 m above the surrounding area and has a diameter of ∼50 m. It has a smooth and plain surface, which is in contrast to the rough surface structure of the rest of the plateau (Figure 2B). The profile of the EEC (Figure 2E) shows a steeper flank in the west and a flatter side in the east of the summit. The WEC shows a morphologic depression in its inner part, which is bordered by a rim-like frame (Figures 2B, D). Both eruption centers are also identifiable in the AUV-derived seafloor backscatter map which shows pronounced and high backscatter signatures at these sites (Figure 2C). The backscatter amplitudes at the EEC and WEC are significantly higher than those of a relatively low backscatter on the remaining plateau of Sartori MV. The high-resolution bathymetry allows to distinguish numerous topographic ridges and depressions forming concentric mud rings (cf. Dupré et al., 2008) propagating radially and sub-circular as elongated surface features from the two eruption centers to the outer areas of the plateau (Figures 2B, D). The plateau of the MV is surrounded by a pronounced and sub-circular rim, forming its outer edge (Figure 2D).
Emissions of bubble-forming gas migrating from the seafloor to the water column were not observed during research cruises POS499 and SO278.
4.2 Sediment characteristics
The two MUC cores (MUC23 and MUC30) taken from the EEC and WEC, respectively, consist of unconsolidated mud breccia overlain by a hemipelagic sediment cover of 4 cm (MUC23) and 3 cm (MUC30), respectively (Figure 3). The mud breccia contains mud clasts of up to 6 cm in size and is characterized by a strong smell characteristic of H2S. The hemipelagic sediment is composed of brownish foraminifera-bearing silty clay with blackish grains of <1 mm in size (see core description in Supplementary Material).
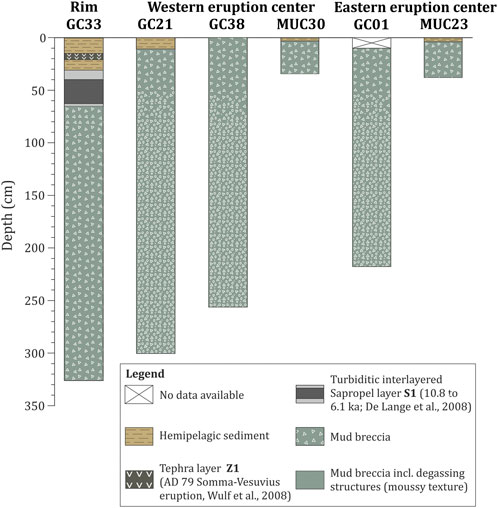
FIGURE 3. Schematic representation of sediment compositions in individual GC and MUC cores from Sartori MV collected during cruises POS499 (2016) and SO278 (2020). Mud breccia recovered from the eastern and western eruption centers is fluidized in the upper part and shows a moussy texture in the deeper parts of the cores. The hemipelagic sediment consists of foraminifera-bearing silty clay. For GC01, depth-corrected data are used. Detailed core descriptions can be found in Supplementary Material.
The mud breccia of gravity core GC21 from the southwestern edge of the WEC is overlain by a ∼11 cm hemipelagic sediment dominated by foraminifera-bearing silty clay. As the hemipelagic sediment cover is strongly fluidized, the thickness might be overestimated. The underlying greenish-gray mud breccia revealed abundant mud breccia clasts of sandstones and carbonates with calcite veins. The mud breccia shows degassing structures (moussy texture) at core depths >50 cm (Figure 3; see core description in Supplementary Material). The two gravity cores recovered close to the EEC and WEC (GC01 ∼50 m southwest of the EEC; GC38 ∼40 m of the WEC) show greenish-gray mud breccia and abundant friable mud breccia clasts in sizes of a few millimeter up to 9 cm throughout the core. Degassing structures (moussy texture) are present below an approximate depth of 50 cm of GC01 and ∼55 cm of GC38. No boundaries indicating individual mud breccia sequences are found (Figure 3; see core description in Supplementary Material). A hemipelagic sediment coverage is virtually absent in GC01 and GC38 due to an overpenetration of the gravity corer at both sites. Gravity core GC33 from the western rim of the MV consists of a greenish-gray mud breccia that is overlain by a ∼66 cm-thick hemipelagic sediment package of foraminifera-bearing silty clay. The hemipelagic sediment may be divided into three groups. The 30 cm-thick, light olive-brown clay layer is interrupted by a ∼5 cm interval of silty fine sand with blackish particles, which is graded to its top. This layer of silty fine sand is referred to as the tephra layer Z1 of the Somma–Vesuvius eruption AD 79 (Wulf et al., 2008; Zanchetta et al., 2011). Underneath, a pronounced and turbiditic interlayered (Polonia et al., 2015), organic-rich, dark greenish-gray clay layer of ∼40 cm thickness is present, which is referred to as sapropel S1, with its age dated back to 10.8 ka to 6.1 ka (De Lange et al., 2008; Polonia et al., 2015). In contrast to cores GC01, GC21, and GC38, no degassing structures are observed within the mud breccia of GC33. Instead, the uppermost ∼159 cm of the mud breccia layer comprises only a few clasts, whereas the clast size and clast content increase to larger fragments up to 5 cm in the lower ∼100 cm of the mud breccia layer (Figure 3; see core description in Supplementary Material).
4.3 Pore water composition and methane stable isotopes
Vertical concentration profiles of pore water Cl− of GC21, GC38 (WEC), and GC01 (EEC) show a general decrease with depth (Figure 9, Supplementary Material). Cl− concentrations of GC21 scatter within the upper 50 cm, with the concentrations ranging between ∼493 and 624 mmol/L. Below 50 cm, Cl− concentrations decrease constantly, reaching ∼206 mmol/L at the maximum sampling depth of 275 cm (Supplementary Figure S2). In GC38, the Cl− concentration is nearly constant within the upper 50 cm, ranging between 612 mmol/L and 627 mmol/L. The concentrations decrease from 50 cm to the maximum sampling depth (245 cm), from ∼617 mmol/L to ∼204 mmol/L. In GC01, the Cl− concentrations in the upper sediment layer show a continuous decrease, with a changing magnitude at a depth of approximately 70 cm, from approximately ∼633 mmol/L at the top to ∼213 mmol/L at the lowermost sampling depth (190 cm). In GC33, the Cl− concentrations are stable between 0 cm and 265 cm sediment depth but slightly decrease from ∼600 mmol/L to ∼462 mmol/L at a sampling depth between 265 cm and 315 cm.
Pore water SO42− concentrations of GC21 are slightly scattering between ∼31 mmol/L and ∼24 mmol/L in a sediment depth from 0 cm to 40 cm (Supplementary Figure S3). In a sediment depth between 40 cm and 60 cm, SO42− concentrations decrease to 0 mmol/L and are stable until reaching the maximum sampling depth of 275 cm. In GC38, the SO42− concentrations of ∼30 mmol/L are stable in the upper 45 cm sediment depth and decrease between 45 cm and 85 cm until reaching 0 mmol/L and are stable until reaching the maximum sampling depth. Pore water SO42− concentrations of GC01 decrease from 0 cm to 70 cm sediment depth to concentrations from ∼32 mmol/L to 0 mmol/L and are stable downcore until reaching the maximum sampling depth. In GC33, the SO42− concentrations are stable at ∼30 mmol/L from 0 cm to 195 cm sediment depth and decrease between 195 mmol/L and 275 mmol/L until reaching 0 mmol/L. The SO42− concentrations are stable downcore until reaching its maximum sampling depth of 315 cm.
Vertical concentration profiles of pore water SO42− and CH4 show that the current SMI at both eruption centers of Sartori MV is positioned at a relatively shallow depth [WEC—GC21: ∼45–75 cm (Figure 4B), GC38: ∼50–70 cm (Figure 4C); EEC—GC01: ∼40–60 cm (Figure 4D)]. At the western rim site (Figure 4A), the SMI is positioned significantly deeper (GC33: ∼250–270 cm). Due to differences in the depth correction (see method section), the position of the SMI at GC01 and GC38 is in approximately the same sediment depth, but depth differences should be mentioned. It is suggested that the SMI of GC38 occurs deeper in the sediment, as indicated by the uncorrected depth data.
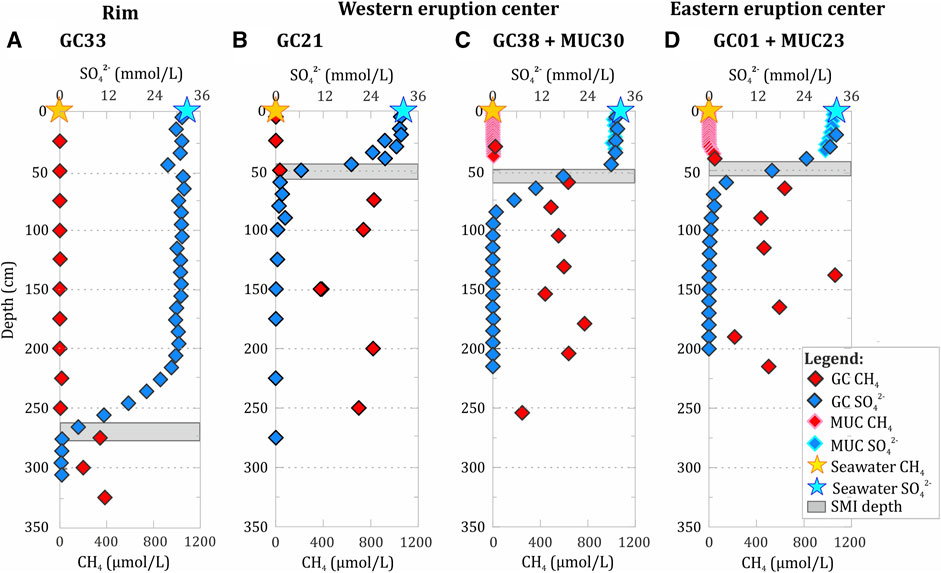
FIGURE 4. Concentrations of pore water sulfate and methane (ex situ concentration) at (A) the western rim, (B, C) the western eruption center, and (D) the eastern eruption center of Sartori MV. Seawater concentrations (stars) are plotted as the reference. Core GC21 was collected in 2016 (cruise POS499), and cores GC01, GC33, and GC38 were recovered in 2020 (cruise SO278).
The highest ex situ CH4 concentration (∼1.06 mmol/L) is present in GC01 from the EEC at a depth of 128 cm below the seafloor (Figure 4). In GC38 and GC21 recovered from the WEC, maximum CH4 concentrations are slightly lower, between ∼0.77 mmol/L and ∼0.83 mmol/L, respectively. GC33 taken from the western rim site shows comparably low CH4 concentrations (maximum 0.38 mmol/L). CH4 concentrations in the two gravity cores [GeoB21366-1, 21367–1; maximum core length 4.89 m; data available on the PANGAEA database; Bohrmann et al. (2016)] taken approximately 0.5–1.0 km west of Sartori MV are lower than 0.003 mmol/L. This demonstrates that mud volcanic activity leads to considerable methane enrichments in near-surface deposits, presumably within the entire MV.
δ13C-CH4 values in headspace samples from GC01 (EEC), GC33 (western rim), and GC38 (WEC) ranged between ∼–56 and −63‰ with an irregular and insignificant negative trend with depth (Figure 5). The only two outliers from the general trend are samples from GC01 at ∼0.5 m and from GC33 at ∼2.7 m, which are depleted in 13C by ∼12‰ and ∼5‰, respectively, compared to the adjacent samples. These samples are positioned close to the SMI (see Figure 4D) and may have been affected by microbial isotope fractionation in the course of AOM. δ2H-CH4 values in headspace samples ∼from GC01 (EEC) and GC38 (WEC) show a steep decrease from ∼–140‰ to ∼–190‰ in the uppermost layer (meter) of sediment. Below that depth, δ2H-CH4 values only slightly decrease with depth, and the most negative δ2H-CH4 value of ∼198‰ is determined for the deepest sample from GC38 at ∼2.6 m.
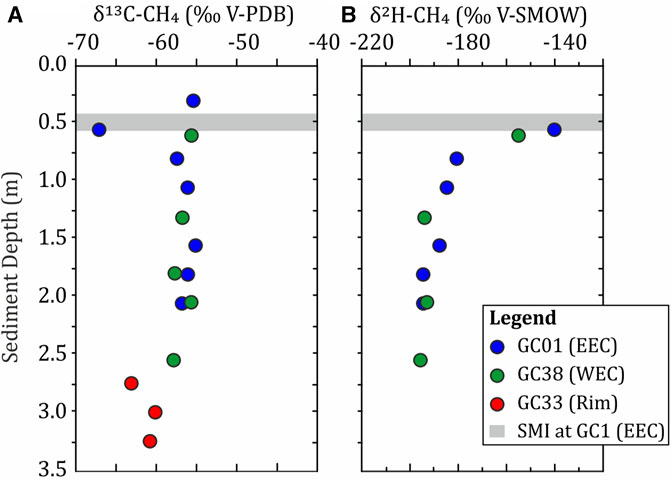
FIGURE 5. (A) Stable carbon and (B) hydrogen isotopic composition of methane in headspace gas samples prepared from gravity cores collected from the western rim (GC33), the western eruption center (GC38; WEC), and the eastern eruption center (GC01; EEC). The depth of the SMI at the eastern eruption center is shown as the horizontal gray bar.
4.4 Temperature distribution in near surface sediments
Temperature gradients from the central area of Sartori MV vary between −15.4 mK/m and 447.2 mK/m (Figures 6A, B). High gradients were restricted to the central area of the MV. Maximum gradients were measured at sites close to the WEC (139.9 mK/m at HF-20-7; Figure 6A) and EEC (367.8 mK/m at HF-20-5 and 447.2 mK/m at HF-29-5; Figures 6A, B). Gradients from the EEC (HF-29-5) were about three times higher than those from the WEC (HF-20-7). Both eruption centers are characterized by generally higher absolute temperatures near the sediment surface and steeper temperature gradients compared to its surrounding sites. The maximum temperature difference is measured at site HF-29-5 and varies from 14.7°C at the seafloor up to 17.4°C at a sediment depth of 5.7 m below the seafloor (Supplementary Figure S4). The temperature gradient of temperature probe site HF-20-6 is about five times smaller compared to that of both temperature probe sites at the EEC (HF-20-5 and HF-29-5; Figures 6A, B). At a distance of ∼100 m from the EEC, vertical temperature gradients decrease from 447.2 mK/m (HF-29-5) to 66.5 mK/m (HF-20-4) and 89.5 mK/m (HF-20-6). This is a difference from the measured temperature gradient of 357.7 mK/m at a distance of less than 100 m (Figures 6A, B). The linear temperature gradient at site GC21 at the southwestern edge of the WEC is moderate with 44.8 mK/m (Figure 6B). Linear temperature gradients in the nearby areas surrounding the MV ranged between 6.6 mK/m and 10.7 mK/m (Figures 6A, B). Negative temperature gradients (−15.4 mK/m to −1.9 mK/m), which are mainly caused by relatively low sediment temperatures below ∼3 m depth, were measured at six sites (HF-20-3, HF-20-8, HF-29-4, HF-29-6, HF-29-7, and HF-29-9) on the plateau and in the surrounding area of Sartori MV (Supplementary Table S1). All measurement sites of negative temperature gradients are distant to the WEC and EEC (Figures 6A, B).
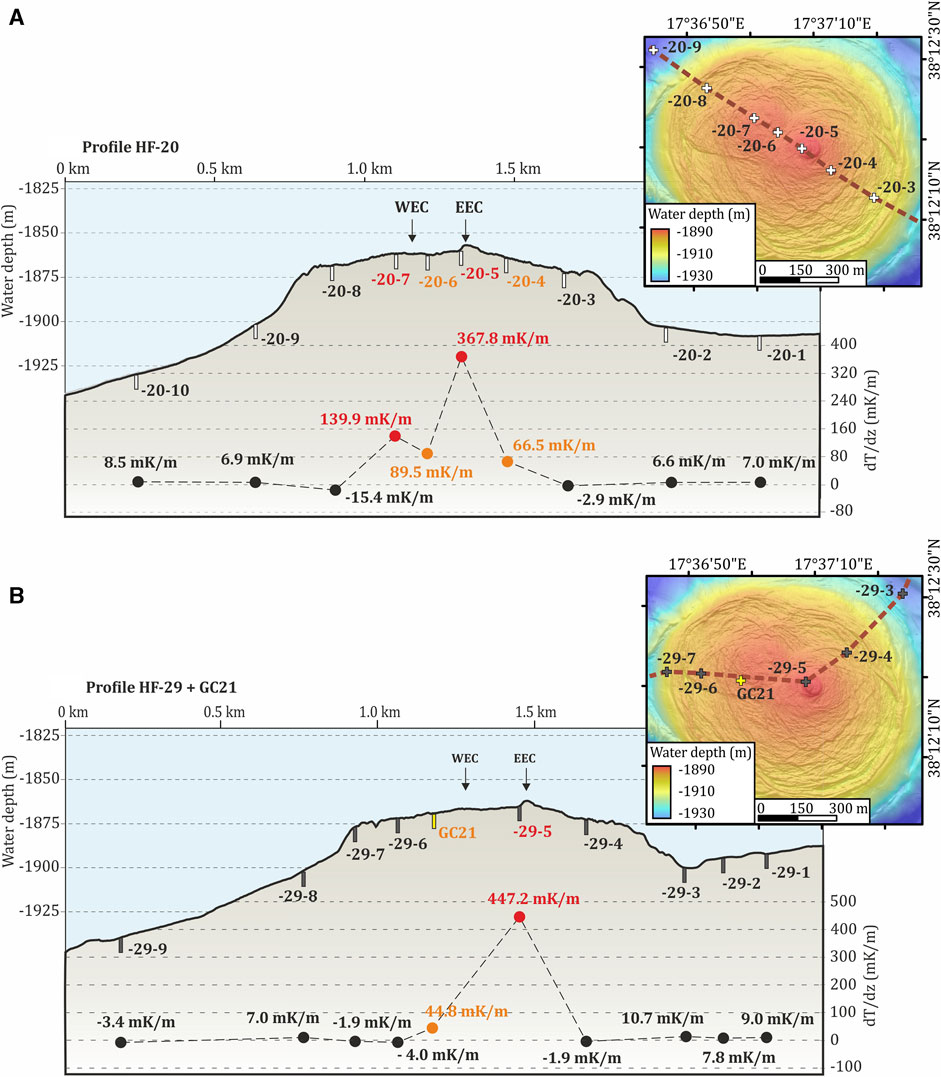
FIGURE 6. Temperature gradient profiles HF-20 (A) and HF-29 (B) from cruise SO278 (2020) and the position of GC21, equipped with MTLs, from cruise POS499 (2016). AUV-derived high-resolution map shows the positioning of temperature sites for the central part of Sartori MV. Positions of all temperature measurement sites including those being located outside the MV are shown in Figure 2A. In-situ temperatures at the central part of Sartori MV are higher compared to background temperatures of the surrounding area.
5 Discussion
5.1 Seafloor topography and episodic MV activity
The flat-topped Sartori MV (Figures 2E, 7) with its steep rim flanks and relatively smooth elevation in its central part can be categorized as a plateau-like MV, according to Mazzini and Etiope (2017). The generally smooth morphology is attributed to intermittent eruption events of highly viscous mud breccia stacking in the most central part of the MV. Ring-like structures are present at the flat top, and the mud builds up a slightly positive morphology (Figure 7A). However, gradually collapsing mud cones, which are typical for plateau-like MVs, prevent the development of significant elevations in the central part (Mazzini and Etiope, 2017). Plateau-like MVs in the Mediterranean Sea that have similar dimensions to the Sartori MV include Isis MV, Amon MV (Dupré et al., 2008; Feseker et al., 2009), and Giza MV that are all located in the Nile deep-sea fan (Feseker et al., 2010).
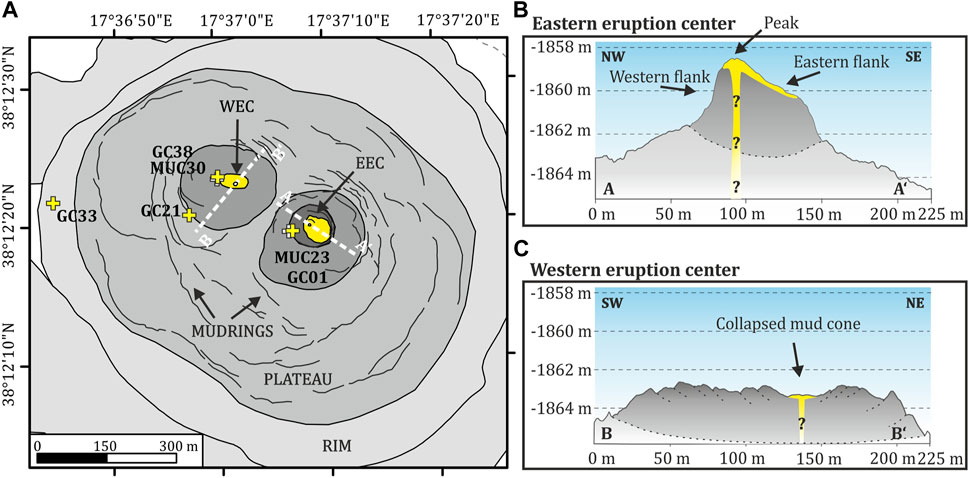
FIGURE 7. (A) Schematic drawing of prominent morphological features of Sartori MV showing positions of the eastern and western eruption centers, mud rings, the plateau, and the rim of the MV. GC and MUC positions are shown for orientation. High backscatter patches of both eruption centers (shaded in dark gray) and the most prominent mud rings derived from slope data are illustrated. Youngest and top-most material is colored in yellow. (B) NW–SE-oriented profile crossing the EEC showing a pronounced peak within its youngest part. The most recent erupted mud breccia was flowing down the peak to the SE. (C) SW–NE-oriented profile crossing the WEC illustrating the central morphologic depression assumed to result from a mud cone collapse.
Bathymetric and seafloor backscatter mapping show a non-damaged and non-disturbed rim of the MV. The most recently erupted mud breccia, which show the thinnest hemipelagic sediment coverage, is deposited near the central part of the EEC and WEC, respectively (see GC01 and GC33). It is assumed that the featureless surface of the cone-like summit (peak) of the EEC (Figure 7B) consists of the freshest, and therefore youngest, material erupted by Sartori MV. From this mud cone, the most recent erupted material would downflow to the east, creating a flat, sloping (∼2.5°) eastern flank of the EEC peak (Figure 7B). The western flank of the EEC is much steeper (∼8.2°), giving rise to the assumption of a constant mud build-up with no layers of downflowing mudflows at the western flank. The morphological profile of the WEC (Figure 7C) indicates a depression in its most central part, which might result from a mud cone collapse, creating a rugged and slightly depressed topography.
The more or less concentric ridges and depressions on the plateau are interpreted as mud rings attributed to the irregular supply of mud breccia from the eruption centers and its lateral transport toward the MV rim (Figure 7A). Such mud rings show superposition and intercalation, pointing to several consecutive eruption events. It is assumed that episodical activity and, therefore, upward migration of fluids and solids within the central parts of the eruption centers push mud breccia within the conduit vertically and mud breccia that has already been expelled (mud rings) to the sides. Sediment (mud) displacement was also reported for, e.g., Håkon Mosby MV on the Barents Sea slope, from which a lateral displacement of 0.4 m per year, triggered by episodical recurring mud eruption events within the central part, is measured (Feseker et al., 2014).
5.2 Sedimentological aspects indicating sub-recent mud eruption
Generally, the dating of hemipelagic sediment above mud breccia provides information on the dynamics, rates, and ages of mud extrusion events and its related fluid flow (Lykousis et al., 2009). Moreover, knowledge of the local sedimentation rate is necessary to constrain the timing of the extrusive activity of Sartori MV. At the investigated sites close to the eruption centers, the moussy mud breccia is covered by hemipelagic sediment of ∼40 mm (MUC23; EEC) and ∼30 mm (MUC30; WEC) in thickness. The sedimentation rate of the Calabrian Arc is estimated to range between 0.04 and 0.26 mm/yr (Kastens, 1984; Polonia et al., 2013a; Ceramicola et al., 2014b; Loher et al., 2018a). At Sartori MV, a sedimentation rate of 0.077 mm/yr is estimated (Morlotti et al., 1982; Ceramicola et al., 2014b). Specific time markers, such as sapropel- (Mercone et al., 2000; Mercone et al., 2001; De Lange et al., 2008) or tephra layers (Keller et al., 1978; Narcisi and Vezzoli, 1999; Wulf et al., 2008), may help delimit the relative age dating in more detail. The pronounced and coarse-grained postglacial tephra layer Z1 of the Somma–Vesuvius eruption in AD 79 (Wulf et al., 2008; Zanchetta et al., 2011) can be found at shallow sediment depth all over the central Mediterranean Sea (Keller et al., 1978). Underneath, the dark and anoxic sapropel S1 layer, which was deposited 10.8 ka to 6.1 ka ago (De Lange et al., 2008; Polonia et al., 2015), is present in sediment cores all over the Mediterranean Sea (Capotondi et al., 2011). By combining the information, it is suggested that the ∼30 mm (MUC30; WEC) and 40 mm (MUC23; EEC) thick hemipelagic sediment layers cover a time span of ∼390 years and ∼520 years, respectively. However, the GC and MUC cores were not taken from the most central part of the eruption centers (Figures 2, 7), which presumably hosts the youngest mud breccia extruded at the MV (Figure 7B). The high-resolution bathymetry shows that the preferred mudflow direction was progressing downslope from the peak of the EEC to the SE rather than flowing to the southwestern direction where the sediment cores are taken (Figures 7A, B). Mudflows in the SE of the EEC are most likely younger than the mud breccia recovered with GC01 and MUC23 ∼50 m SW of the peak of the EEC. Therefore, it is assumed that the recovered sediment cores do not contain the youngest mud breccia ejected at Sartori MV.
The presence of sapropel S1 (10.8–6.1 ka) in GC33 clearly points to an estimated age of maximum 10.8 ka for the underlying mud breccia. Whether the mud breccia deposition ended immediatedly before or during the anoxic phase is beyond the scope of this study. Therefore, an age estimation of ∼10 ka is made for the latest mud breccia deposition at the western rim of Sartori MV. By combining sediment core information with the high-resolution bathymetry of the non-damaged rim, it is assumed that no substantial mudflows were transported beyond the rim of Sartori MV during the past ∼10 ka.
5.3 Temperature anomalies as an indication of recent MV activity
In-situ sediment temperatures show laterally considerable changes. With decreasing distance to both eruption centers of Sartori MV, the gradients increase first gradually and then rapidly towards the center, resulting in a distinct peak of 447.2 mK/m close to the EEC. The highest temperature gradient is observed at the EEC, but its intensity is much lower compared to that determined at other active MV summits in the eastern Mediterranean Sea. For instance, a maximum temperature gradient of 15.5 mK/m was reported from the mud extrusion site of Venere MV in the Calabrian Arc (Loher et al., 2018c). In addition, Feseker et al. (2010) reported temperature gradients of 25,890 mK/m at the active summit site of North Alex MV in the Nile deep-sea fan delta. Nevertheless, a locally restricted anomaly of the temperature gradient on top of Sartori MV is distinguishable from background data (Figure 6; Supplementary Table S1). Compiled background temperature gradients of the study area published in the Global Heat Flow Database are generally low, varying between 0 mK/m and 20 mK/m (Fuchs et al., 2021).
The considerable difference in temperature gradients close to the WEC and EEC suggests that heat transport from below is spatially restricted to areas that are believed to be characterized by most recent mud eruptions as well. Gravity core site GC21 and heat flow sites HF-20-5; HF-20-7, and HF-29-5 missed the most central and, therefore, most active areas of the MV by ∼46 m west of the WEC (HF-20-7), 32 m southwest (HF-20-5), and 18 m west of the EEC (HF-29-5), respectively. Therefore, comparably higher temperature gradients are expected for the summit of the EEC and most central area of the WEC. However, the temperatures are considerably elevated, pointing to the recent activity of the MV. Both eruption centers show elevated temperatures and temperature gradients. We interpret that the EEC was more active in recent times compared to the WEC because it has revealed higher absolute temperatures and also higher temperature gradients with depth.
At some sites, negative temperature gradients, ranging from −15.4 mK/m (HF-20-8) to −1.9 mK/m (HF-29-4, HF-29-7), were measured. In comparison to measured positive temperature gradients, the scatter of negative temperature gradients is relatively small (Supplementary Figure S4). An explanation of negative temperature gradients could be the transient effect of gas hydrate dissociation. Frictional heat generated as the heat flow probe penetrates the seafloor can lead to dissociation of gas hydrates in an endothermic process. In-situ temperature excursions attributed to hydrate decomposition were previously proposed for sites in the Kumano Forearc Basin in Japan (Kinoshita et al., 2015). As Sartori MV is located within the gas hydrate stability zone (GHSZ) close to the phase boundary for sI hydrate (see Section 5.4), hydrate dissociation caused by sediment temperature increase due to frictional heat is possible (Supplementary Figure S5). However, neither intact gas hydrate specimen nor significant anomalies in pore water chloride concentrations, which are indicative of the presence of hydrates, were found in the max. 3.24 m-long gravity cores. Determining if negative temperature gradients are related to the effect of gas hydrate dissociation needs further and more detailed analyses; however this investigation is beyond the scope of this study.
5.4 Flux and sources of methane in the uppermost sediments
Seafloor emission of bubble-forming gas was not observed during the investigations in 2016 and 2020, and it was also not reported from previous studies of Sartori MV (Morlotti et al., 1982; Ceramicola et al., 2014b; Bohrmann et al., 2016; Bohrmann et al., 2022). However, relatively shallow depths of the SMI and substantial CH4 enrichments below it at the four coring stations surveyed within the MV demonstrate activity in the recent past. The shallowest SMI and highest ex situ CH4 concentration (∼1.1 mmol/L, GC01) below suggest that the EEC was the area of most intense and/or recent fluid upward migration. This assumption is supported by the highest sediment temperature gradient being detected at the EEC (see Section 5.3).
Both gravity cores recovered in the WEC area (GC21 and GC38) showed maximum CH4 concentrations in the same range (∼0.8 mmol/L). However, since the cores were obtained with a time interval of almost 4.5 years (spring 2016 and fall 2020) and a spatial distance of ∼100 m from each other, it is unclear whether the similar concentrations originate from one or more fluid ascent pulses.
Calculations of the phase boundary of sI gas hydrate using the HWHyd software by Masoudi and Tohidi (2005) show that Sartori MV (P ∼19 MPa, S ∼15 PSU, T ∼16.5°C) is basically within the GHSZ (Supplementary Figure S5). However, since the in-situ CH4 solubility (141.4 mmol/kg; Tishchenko et al., 2005; Kossel et al., 2013) is more than two orders of magnitude above the measured maximum ex situ CH4 concentrations, the presence of gas hydrates in the sediment sampled is unlikely. Moreover, stable pore water profiles of Cl− concentrations do not show any indication for gas hydrate dissociation. This is in contrast to the sites of the previously described negative temperature anomalies, which might be related to the instant dissociation of gas hydrates within the disturbed sediment by the measurement itself.
In general, maximum CH4 concentrations at each site correlate positively with temperature gradients (Figures 4, 6A, B). However, the maximum concentration at the western rim station (GC33, ∼0.4 mmol/L, Figure 2B) is significantly elevated relative to background values [<0.003 mmol/L, gravity cores GeoB21366-1, 21367-1, Bohrmann et al. (2016)], whereas the temperature gradient at nearby temperature probe sites HF-29-7 and HF-29-8 (Figure 2A) is not. Hence, the data suggest that the methane signal persists longer than the temperature signal after an eruption, which is consistent with thermal conductivity being significantly faster than the diffusion of solutes. In addition, lateral methane propagation might be more effective than temperature propagation.
Very similar stable C and H isotopic compositions of methane in the deepest samples of gravity cores GC01 and GC38 suggest that fluids migrating toward the EEC and WEC are fueled from the same reservoir. These samples are positioned lowest below the SMI and should be least affected by microbial alteration of the AOM. Therefore, their isotopic composition should mostly reflect the isotopic composition of the source(s). In Figure 8A, the fields representative of methane generation pathways based on methane stable C and H isotopic compositions are shown. The deepest samples from GC01 and GC38 plot close to the field representative of methane originating from secondary microbial sources, which are based on methanogenic petroleum biodegradation (Milkov and Etiope, 2018). The presence of secondary microbial methane has also been proposed for submarine and terrestrial MVs in other regions (Stadnitskaia et al., 2008; Etiope et al., 2009; Gilbert et al., 2022). For Sartori MV, stable C isotope signatures of CO2, which would provide better information on the presence of secondary microbial methane (Milkov and Etiope, 2018), are not available. However, relatively low contents of organic carbon (TOC; ∼0.3%; Supplementary Table S2) in the three gravity cores investigated suggest that petroleum degradation is not the main source of methane.
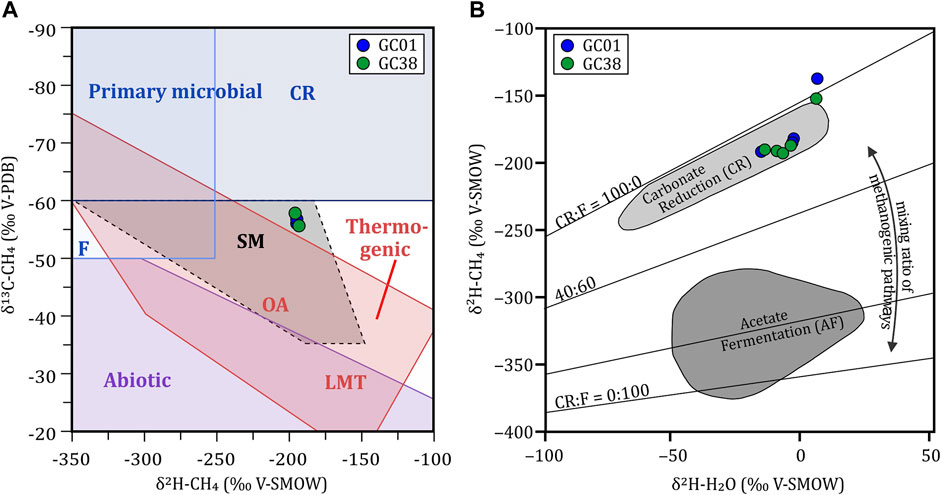
FIGURE 8. (A) Generic diagram based on stable C and H isotopic compositions of methane showing the major methane production pathways at Sartori MV (modified after Milkov and Etiope (2018)). Deepest samples from GC01 (EEC) and GC38 (WEC) plot close to the field assigned for secondary microbial methane, in between the fields representative for primary microbial and thermogenic methane. Given the known depths of MV roots and geometries of internal structures from other submarine MVs (Somoza et al., 2012), the admixture of methane from several sources resulting in measured stable C and H isotope values is likely. (B) Diagram showing δ2H-CH4–δ2H-H2O relationships diagnostic for the two microbial methane generation pathways, carbonate reduction (CR) and acetate fermentation (AF; Whiticar, 1999). All samples from GC01 and GC38 plot within or close to the field assigned for the carbonate reduction pathway.
Alternatively, methane stable C and H isotopic compositions may also reflect the mixture of methane from primary microbial and thermogenic sources to some extent. MVs are typically deeply rooting structures in which fluids are mobilized from several kilometers of depth (Mazzini and Etiope, 2017). In addition, fluids and solids are homogenized during their passage toward the seafloor (Lalk et al., 2022). Therefore, it is plausible to assume that the methane isotopic compositions determined in this study do not reflect a single source but result from the mixture of methane from several sources.
Consequently, methane collected from near-surface sediments at Sartori MV most likely originates from a mix of primary microbial, secondary microbial, and/or thermogenic sources. Figure 8B shows H isotope relationships of methane and pore water typical for the microbial methane generation pathways, including carbonate reduction (CR) of microbial bacteria and acetate fermentation (AF). However, the CR pathway is believed to dominate in marine settings, while the AF pathways appear to predominantly occur in freshwater systems (Whiticar, 1999). Because samples from GC01 and GC38 plot within or close to the field indicative for the CR pathway, it is proposed that low-salinity water potentially released in the course of clay mineral alteration (e.g., Dählmann and De Lange, 2003; Mazzini and Etiope, 2017) does not promote significant methane production via the AF pathway at Sartori MV.
5.5 Diffusive fluid discharge as an indicator of recent MV activity
Pore water Cl− and SO42− concentration profiles show the intrusion of seawater into the uppermost 0.5–1 m of the sediment (Figure 9). A transient diffusive effect of this initial disturbance was calculated to reach the measured concentration distribution for both Cl− and SO42−, as described in detail in Schulz and Schulz (2005), using depth-dependent data for regional porosities and temperatures. In all three sites, an initial situation with no SO42− in the lower layer and an upper event layer with seawater SO42− concentration has been assumed. In order to match the SO42− concentration distribution measured, sulfate reduction rates were fine-tuned individually. For Cl− profiles, an initial situation with seawater chlorinity of 600 mmol/L with a linear decrease to a low chlorinity of approximately 200 mmol/L, most probably due to freshwater input from depth and to a much lesser extent to dilution with crystal water from disintegrating gas hydrates, was assumed. The steep decrease in pore water chlorinity in the uppermost sediment layers is attributed to diffusive seawater infiltration into the mud, as previously reported in other MV systems (Henry et al., 1996; Feseker et al., 2009; Paull et al., 2015; Loher et al., 2018c). Modeling was optimized to match the measured Cl− and SO42− profiles with the modeled time, which has passed from the initial start until measurement, while maintaining the same physical boundary conditions. That modeling curvature, which fits best with measured Cl− and SO42− concentrations, is expected to be the most accurate modeling result for this prescribed scenario.
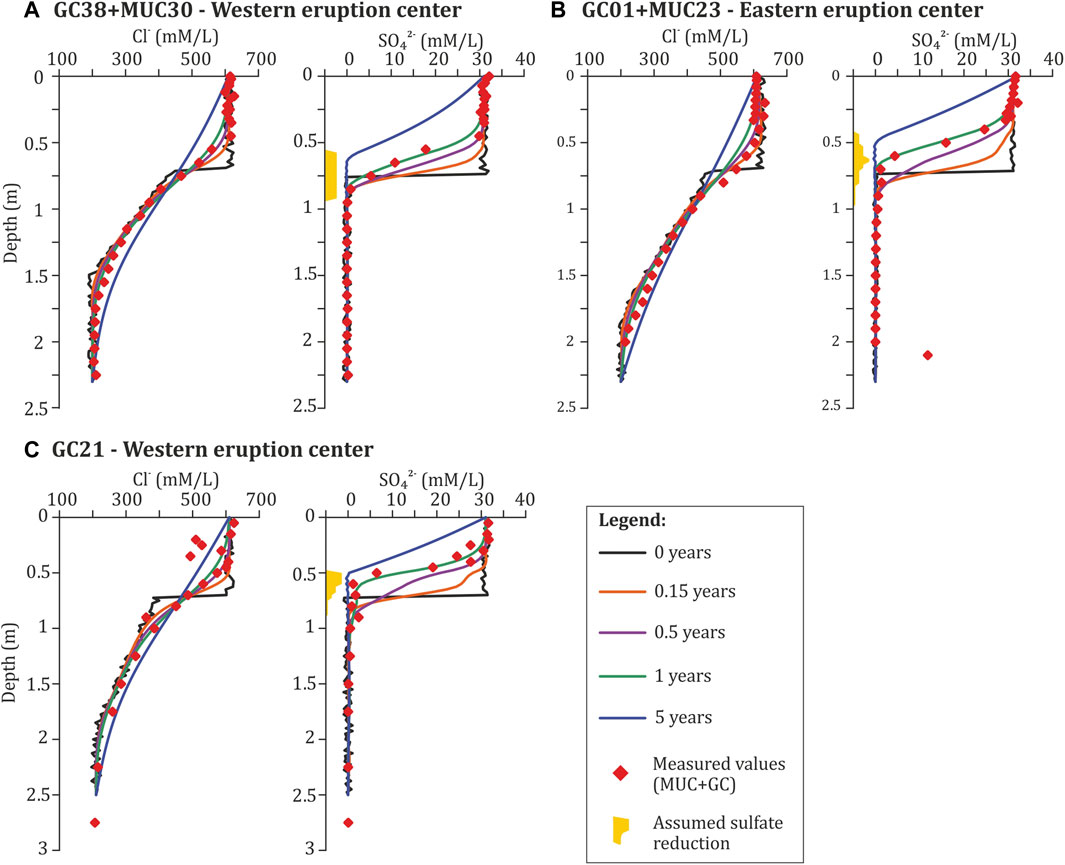
FIGURE 9. Measured and modeled pore water concentration profiles of chloride and sulfate in GC and MUC cores (red squares) taken from (A) the WEC in 2020, (B) the EEC in 2020, and (C) the WEC in 2016. The black lines indicate the start conditions assumed to model the measured transient pore water profiles using in-situ temperatures and porosities. The best fit to the pore water data is reached after approximately 1 year of diffusive readjustment (green line). The yellow fields indicate the location and the relative intensity of sulfate reduction assumed to match the measured data.
The actual transient stage found in the pore water Cl− and SO42− profiles is reached after 1 year or less in all three sites (green and purple lines in Figure 9). The measured steep gradients could be diffusively significantly smoothed within another 4 years (see blue line in Figure 9). On a larger scale, such pore water profiles are typical for slumps overlying background sediments at the slope of continental margins (Niewöhner et al., 1998; Strasser et al., 2013). In this study, the modeling of pore water diffusion might also indicate a very recent and abrupt onset of fluid migration within the conduit of the MV. The pore water data might indicate either a MV activity-related exchange or an intensive mixing with seawater concentrations within the uppermost 0.5–1 m of all three gravity cores (GC21, GC38, and GC01) close to the two eruption centers. The data lead to steep transient pore water profiles in both Cl− and SO42−. Those pore water profiles are created by either a sudden but relatively slow exchange of pore fluid with seawater fluid concentrations due to a low MV activity only or due to a sudden but very active phase of the MV accompanied by the discharge of fluids and solids. The analyzed sediment cores do not show any indication of the extrusion of solids in the past ∼390 years to ∼520 years. In contrast, from pore water analyses, a very recent fluid migration event accompanied by elevated temperatures at the EEW and WEC, is observed. Therefore, it is assumed that a sudden but relatively slow pore fluid exchange with seawater fluid concentration, created due to the low activity of Sartori MV, is responsible for the measured data in 2016 and 2020. The new findings clearly show a decoupling of these processes at Sartori MV. A low activity, responsible for pore fluid and heat anomalies at the EEC and WEC, is episodically ongoing very recently. In contrast, high-active phases, accompanied by degassing to the water column, very high CH4 concentrations, and strong temperature anomalies, as well as the extrusion of high viscous solids, occur episodically in time scales of hundreds of years.
6 Conclusion
Sartori MV in the Calabrian Arc is a flat-topped mud volcano that was virtually dormant in terms of focused gas emission and mud ejection during two research campaigns in 2016 and 2020. High-resolution bathymetry, in combination with seafloor backscatter data, revealed the presence of two eruption centers (WEC and EEC) close to the geometric center of the MV. The EEC shows a peak-like summit, whereas a slight depression was found in the area of the WEC. Fluid migration and the exchange of pore fluid with seawater fluid concentrations within the uppermost sediment layers, in combination with elevated temperatures at both eruption centers, support the assumption of a low activity of the MV in 2016 and 2020. These low active phases were not accompanied by the eruption of solids. Sediment cores from the central part of the MV show a hemipelagic sediment coverage ranging from 30 mm (MUC30) to 40 mm (MUC23), allowing to estimate the age of the youngest mud breccia deposits at the coring position to ∼0.39 and ∼0.52 ka ago, respectively. Potentially, these materials did not reach gravity and MUC core positions located ∼50 m SW to the most central part of the EEC (GC01) and ∼132 m SW (GC21) and ∼44 m W (GC38) to the most central part of the WEC. This might explain the moderate temperature gradients measured at those sites. Higher in-situ sediment temperatures and even less (or missing) hemipelagic sediment coverage are assumed for the most central parts of both eruption centers. We suggest that the low activity of Sartori MV, responsible for diffusive fluid migration, is decoupled from the extrusion of solids (mud breccia), and only pore fluid exchange was occurring in recent times. This could explain the gap between pore water modeling results, pointing to a very recent fluid flux, and sedimentological observations, pointing to only sub-recent material extrusion at the eruption centers. It is proposed that only high active phases of the MV are responsible for the extrusion of solids and that low active phases, responsible for changes in fluid and heat flux, may occur more often. In contrast to those low active phases, stronger activity of the MV is accompanied by very high temperature excursions and very high CH4 concentrations (also identifiable in the water column as gas bubbling) and the formation of new and relocated mud rings. However, these phases of low activity could be categorized to the depletion phase of a MV, whereas high active phases are typical for categorized eruption phases of a MV.
The SMI depth is shallower close to the EEC compared to the WEC. CH4 concentrations in 2020 are higher compared to those in 2016, and they are clearly elevated close to both eruption centers. The highest CH4 concentration was detected at the EEC. Moreover, it is assumed that the EEC (higher CH4 concentrations, flatter SMI, temperature anomaly, and peak-like structure with downflowing mudflow) was active in recent times compared to the WEC. In addition, we assume that relatively small volumes of high-viscous mud breccia have been erupted and deposited in the recent past. The material was not overflowing older mud rings from older eruption events and also not the rim of the MV edifice. The high-resolution bathymetry of the rim shows its non-damaged and undisturbed appearance. Analyses of sediment core GC33 and the presence of sapropel S1 allow us to conclude that no mudflow has overflown the western rim of the MV edifice for the past ∼10 ka.
Data availability statement
The datasets presented in this study can be found in online repositories. The names of the repository/repositories and accession number(s) can be found in the article/Supplementary Material.
Author contributions
MD, MR, and GB conceived this study. MD wrote the draft version of the manuscript, created the illustrations presented here, and analyzed and interpreted the data. MR did the original mapping of AUV-based bathymetry, created the original illustration of AUV-based bathymetry, and supported with proof-reading and editing. TP did geochemical data analyses and interpretation, created original geochemical illustrations, and supported with the writing of geochemical sections, proof-reading, and editing. MK did the pore water modeling, created the original illustration, and provided support with proof-reading and editing. NK participated in the joint expedition SO278 for in-situ sediment temperature data acquisition and the processing of temperature data, proof-reading, and editing. CdSF helped MD with processing the AUV-based bathymetry, did the processing of ship-based bathymetry and navigation adjustment of the data, and supported with proof-reading and editing. GB provided support with proof-reading and editing, funding acquisition, resources, and supervision. All authors contributed to the article and approved the submitted version.
Funding
This study received support by grant no. BO 1049/22-1 from the Deutsche Forschungsgemeinschaft (DFG). The ship-time of expedition POS499 was funded by the DFG through the MARUM cluster of excellence EXC 309: “The Ocean in the Earth System” (grant/award no. 49926684) as an incentive fund proposal grant. Expedition SO278 was supported by the DFG through the MARUM cluster of excellence EXC 2077: “The Ocean Floor—Earth’s Uncharted Interface” (grant/award no. 390741603) and through funds related to the GPF review procedure (GPF 20-1_054, Sartori MV plus).
Acknowledgments
The authors are grateful to the masters and crews of cruises R/V POSEIDON POS499 and R/V SONNE SO278. The team of the AUV MARUM-SEAL 5000 is very much appreciated for their efforts during POS499. The authors are grateful for the help and contributions of Michael Riedel. The authors appreciated the work by Paul Wintersteller and his help during the acoustic acquisition and planning on board POS499. Markus Loher, Janice Malnati, Silvana Pape, Antonia Witzleb, and all cruise participants from POS499 and SO278 are deeply thanked for their support and laboratory work on pore water and isotope data. Vera Bender as well as the GeoB Core Repository at the MARUM - Center for Marine Environmental Sciences, University of Bremen, Germany, are thanked for providing the sediment material used in this study. The authors are thankful for the constructive comments by Stephanie Dupré and the two reviewers who helped improve the manuscript.
Conflict of interest
The authors declare that the research was conducted in the absence of any commercial or financial relationships that could be construed as a potential conflict of interest.
Publisher’s note
All claims expressed in this article are solely those of the authors and do not necessarily represent those of their affiliated organizations, or those of the publisher, the editors, and the reviewers. Any product that may be evaluated in this article, or claim that may be made by its manufacturer, is not guaranteed or endorsed by the publisher.
Supplementary material
The Supplementary Material for this article can be found online at: https://www.frontiersin.org/articles/10.3389/feart.2023.1181380/full#supplementary-material
References
Bhatnagar, G., Chapman, W. G., Dickens, G. R., Dugan, B., and Hirasaki, G. J. (2008). Sulfate-methane transition as a proxy for average methane hydrate saturation in marine sediments. Geophys. Res. Lett. 35 (3), L03611. doi:10.1029/2007gl032500
Boetius, A., Ravenschlag, K., Schubert, C. J., Rickert, D., Widdel, F., Gieseke, A., et al. (2000). A marine microbial consortium apparently mediating anaerobic oxidation of methane. Nature 407 (6804), 623–626. doi:10.1038/35036572
Bohrmann, G., Ahrlich, F., Antoniou, D., Behrendt, N., Innocentini, S., Coulibaly, O., et al. (2022). Fluid-rock interaction at the backstop to the Mediterranean Ridge accretionary complex south of crete: R/V SONNE cruise report SO278 Emden (Germany), 12.10.2020—Emden (Germany), 01.12.2020. FRINGE. Berichte: MARUM–Zentrum für Marine Umweltwissenschaften, Fachbereich Geowissenschaften, Universität Bremen. 326, 208. Bremen, 2021. doi:10.26092/elib/1776
Bohrmann, G., Bachmann, K., Buchheister, S., Candoni, O., Ceramicola, S., Loher, M., et al. (2016). Report and preliminary results of R/V POSEIDON cruise POS499. Calabrian Mud Volcanoes, Catania (Italy)–Catania (Italy) 04 May–22 May, 2016. Berichte: MARUM–Zentrum für Marine Umweltwissenschaften, Fachbereich Geowissenschaften, Universität Bremen 311, 76. Bremen, 2016. Available at: http://nbn-resolving.de/urn:nbn:de:gbv:46-00105556-16
Bohrmann, G., Ivanov, M., Foucher, J.-P., Spiess, V., Bialas, J., Greinert, J., et al. (2003). Mud volcanoes and gas hydrates in the Black Sea: new data from Dvurechenskii and Odessa mud volcanoes. Geo-Marine Lett. 23, 239–249. doi:10.1007/s00367-003-0157-7
Borowski, W. S., Paull, C. K., and Ussler, W. (1999). Global and local variations of interstitial sulfate gradients in deep-water, continental margin sediments: sensitivity to underlying methane and gas hydrates. Mar. Geol. 159 (1-4), 131–154. doi:10.1016/s0025-3227(99)00004-3
Bullard, E. C. (1954). The flow of heat through the floor of the Atlantic Ocean. Proc. R. Soc. Lond. Ser. A. Math. Phys. Sci. 222 (1150), 408–429. doi:10.1098/rspa.1954.0085
Capotondi, L., Vigliotti, L., Bergami, C., and Sangiorgi, F. (2011). The dark side of the mediterranean geological record: the sapropel layers and a case study from the Ionian Sea. Marine Research at CNR. Dipartimento Terra e Ambiente—CNR ed. Roma: CNR, 658–669.
Capozzi, R., Artoni, A., Torelli, L., Lorenzini, S., Oppo, D., Mussoni, P., et al. (2012). Neogene to Quaternary tectonics and mud diapirism in the Gulf of Squillace (Crotone-Spartivento Basin, Calabrian Arc, Italy). Mar. Petroleum Geol. 35 (1), 219–234. doi:10.1016/j.marpetgeo.2012.01.007
Caress, D. W., and Chayes, D. N. (1996). Improved processing of Hydrosweep DS multibeam data on the R/V Maurice Ewing. Mar. Geophys. Res. 18 (6), 631–650. doi:10.1007/bf00313878
Castellini, D. G., Dickens, G. R., Snyder, G. T., and Ruppel, C. D. (2006). Barium cycling in shallow sediment above active mud volcanoes in the Gulf of Mexico. Chem. Geol. 226 (1-2), 1–30. doi:10.1016/j.chemgeo.2005.08.008
Ceramicola, S., Praeg, D., Coste, M., Forlin, E., Cova, A., Colizza, E., et al. (2014a). “Submarine mass-movements along the slopes of the active Ionian continental margins and their consequences for marine geohazards (Mediterranean Sea),” in Submarine mass movements and their consequences advances in natural and technological Hazards research. Editors S. Krastel, J-H. Behrmann, D. Völker, M. Stipp, C. Berndt, R. Urgeleset al. (Springer, Cham) 37, 295–306. doi:10.1007/978-3-319-00972-8_26
Ceramicola, S., Praeg, D., Cova, A., Accettella, D., and Zecchin, M. (2014b). Seafloor distribution and last glacial to postglacial activity of mud volcanoes on the Calabrian accretionary prism, Ionian Sea. Geo-Marine Lett. 34 (2), 111–129. doi:10.1007/s00367-013-0354-y
Cernobori, L., Hirn, A., McBride, J., Nicolich, R., Petronio, L., and Romanelli, M. (1996). Crustal image of the Ionian basin and its Calabrian margins. Tectonophysics 264 (1-4), 175–189. doi:10.1016/s0040-1951(96)00125-4
Claypool, G. E., and Kaplan, I. R. (1974). “The origin and distribution of methane in marine sediments,” in Natural gases in marine sediments marine science. Editor I. R. Kaplan (Boston, MA: Springer) 3. doi:10.1007/978-1-4684-2757-8_8
Cuffaro, M., Billi, A., Bigi, S., Bosman, A., Caruso, C. G., Conti, A., et al. (2019). The Bortoluzzi Mud Volcano (Ionian Sea, Italy) and its potential for tracking the seismic cycle of active faults. Solid Earth. 10 (3), 741–763. doi:10.5194/se-10-741-2019
Dählmann, A., and De Lange, G. (2003). Fluid–sediment interactions at Eastern Mediterranean mud volcanoes: a stable isotope study from ODP Leg 160. Earth Planet. Sci. Lett. 212 (3-4), 377–391. doi:10.1016/S0012-821X(03)00227-9
De Lange, G. J., Thomson, J., Reitz, A., Slomp, C. P., Speranza Principato, M., Erba, E., et al. (2008). Synchronous basin-wide formation and redox-controlled preservation of a Mediterranean sapropel. Nat. Geosci. 1 (9), 606–610. doi:10.1038/ngeo283
Dickens, G. R. (2001). Sulfate profiles and barium fronts in sediment on the Blake Ridge: present and past methane fluxes through a large gas hydrate reservoir. Geochimica Cosmochimica Acta 65 (4), 529–543. doi:10.1016/s0016-7037(00)00556-1
Dickens, G. R., Koelling, M., Smith, D. C., and Schnieders, L. (2007). Rhizon sampling of pore waters on scientific drilling expeditions: an example from the IODP Expedition 302, Arctic Coring Expedition (ACEX). Sci. Drill. 4, 22–25. doi:10.5194/sd-4-22-2007
Dimitrov, L. I. (2002). Mud volcanoes—the most important pathway for degassing deeply buried sediments. Earth-Science Rev. 59 (1-4), 49–76. doi:10.1016/s0012-8252(02)00069-7
Dupré, S., Buffet, G., Mascle, J., Foucher, J.-P., Gauger, S., Boetius, A., et al. (2008). High-resolution mapping of large gas emitting mud volcanoes on the Egyptian continental margin (Nile Deep Sea Fan) by AUV surveys. Mar. Geophys. Res. 29 (4), 275–290. doi:10.1007/s11001-009-9063-3
Etiope, G. (2015). Natural gas seepage. The Earth’s hydrocarbon degassing. Springer International Publishing Switzerland. doi:10.1007/978-3-319-14601-0
Etiope, G., Feyzullayev, A., Milkov, A., Waseda, A., Mizobe, K., and Sun, C. (2009). Evidence of subsurface anaerobic biodegradation of hydrocarbons and potential secondary methanogenesis in terrestrial mud volcanoes. Mar. Petroleum Geol. 26 (9), 1692–1703. doi:10.1016/j.marpetgeo.2008.12.002
Etiope, G., and Milkov, A. V. (2004). A new estimate of global methane flux from onshore and shallow submarine mud volcanoes to the atmosphere. Environ. Geol. 46 (8), 997–1002. doi:10.1007/s00254-004-1085-1
Faccenna, C., Molin, P., Orecchio, B., Olivetti, V., Bellier, O., Funiciello, F., et al. (2011). Topography of the Calabria subduction zone (southern Italy): clues for the origin of Mt. Etna. Tectonics 30 (1), TC1003. doi:10.1029/2010tc002694
Feseker, T., Boetius, A., Wenzhöfer, F., Blandin, J., Olu, K., Yoerger, D. R., et al. (2014). Eruption of a deep-sea mud volcano triggers rapid sediment movement. Nat. Commun. 5 (1), 5385–5388. doi:10.1038/ncomms6385
Feseker, T., Brown, K. R., Blanchet, C., Scholz, F., Nuzzo, M., Reitz, A., et al. (2010). Active mud volcanoes on the upper slope of the western Nile deep-sea fan—first results from the P362/2 cruise of R/V Poseidon. Geo-Marine Lett. 30 (3), 169–186. doi:10.1007/s00367-010-0192-0
Feseker, T., Dählmann, A., Foucher, J.-P., and Harmegnies, F. (2009). In-situ sediment temperature measurements and geochemical porewater data suggest highly dynamic fluid flow at Isis mud volcano, eastern Mediterranean Sea. Mar. Geol. 261 (1-4), 128–137. doi:10.1016/j.margeo.2008.09.003
Fuchs, S., Norden, B., Artemieva, I., Chiozzi, P., Dedecek, P., Demezhko, D., et al. (2021). The global heat flow database: release 2021. GFZ Data Services. doi:10.5880/fidgeo.2021.014
Gallais, F., Gutscher, M.-A., Klaeschen, D., and Graindorge, D. (2012). Two-stage growth of the Calabrian accretionary wedge in the Ionian Sea (Central Mediterranean): constraints from depth-migrated multichannel seismic data. Mar. Geol. 326, 28–45. doi:10.1016/j.margeo.2012.08.006
Gilbert, A., Nakagawa, M., Taguchi, K., Zhang, N., Nishida, A., and Yoshida, N. (2022). Hydrocarbon cycling in the Tokamachi Mud Volcano (Japan): insights from isotopologue and metataxonomic analyses. Microorganisms 10 (7), 1417. doi:10.3390/microorganisms10071417
Granot, R. (2016). Palaeozoic oceanic crust preserved beneath the eastern Mediterranean. Nat. Geosci. 9 (9), 701–705. doi:10.1038/ngeo2784
Greinert, J., Artemov, Y., Egorov, V., De Batist, M., and McGinnis, D. (2006). 1300-m-high rising bubbles from mud volcanoes at 2080 m in the Black Sea: hydroacoustic characteristics and temporal variability. Earth Planet. Sci. Lett. 244 (1-2), 1–15. doi:10.1016/j.epsl.2006.02.011
Gutscher, M.-A., Dellong, D., Dominguez, S., Malavieille, J., Graindorge, D., and Klingelhoefer, F. (2019). “Strike-slip faulting in the calabrian accretionary wedge: using analog modeling to test the kinematic boundary conditions of geodynamic models,“ in Transform plate boundaries and fracture zones. Editor J. C. Duarte (Elsevier), 321–337. doi:10.1016/B978-0-12-812064-4.00013-X
Gutscher, M.-A., Kopp, H., Krastel, S., Bohrmann, G., Garlan, T., Zaragosi, S., et al. (2017). Active tectonics of the Calabrian subduction revealed by new multi-beam bathymetric data and high-resolution seismic profiles in the Ionian Sea (Central Mediterranean). Earth Planet. Sci. Lett. 461, 61–72. doi:10.1016/j.epsl.2016.12.020
Henry, P., Le Pichon, X., Lallemant, S., Lance, S., Martin, J. B., Foucher, J. P., et al. (1996). Fluid flow in and around a mud volcano field seaward of the Barbados accretionary wedge: results from Manon cruise. J. Geophys. Res. Solid Earth 101 (B9), 20297–20323. doi:10.1029/96jb00953
Hensen, C., Nuzzo, M., Hornibrook, E., Pinheiro, L. M., Bock, B., Magalhães, V. H., et al. (2007). Sources of mud volcano fluids in the Gulf of Cadiz—indications for hydrothermal imprint. Geochimica Cosmochimica Acta 71 (5), 1232–1248. doi:10.1016/j.gca.2006.11.022
Higgins, G., and Saunders, J. (1974). Mud volcanoes-their nature and origin. Verhandl Naturforsch Gesellschaft in Basel 84, 101–152. Basel.
Hsü, K. J., Montadert, L., Bernoulli, D., Cita, M. B., Erickson, A., Garrison, R. E., et al. (1977). History of the Mediterranean salinity crisis. Nature 267 (5610), 399–403. doi:10.1038/267399a0
Hyndman, R., Davis, E., and Wright, J. (1979). The measurement of marine geothermal heat flow by a multipenetration probe with digital acoustic telemetry and insitu thermal conductivity. Mar. Geophys. Res. 4 (2), 181–205. doi:10.1007/bf00286404
Kastens, K. A. (1984). Earthquakes as a triggering mechanism for debris flows and turbidites on the Calabrian Ridge. Mar. Geol. 55 (1-2), 13–33. doi:10.1016/0025-3227(84)90130-0
Keller, J., Ryan, W., Ninkovich, D., and Altherr, R. (1978). Explosive volcanic activity in the Mediterranean over the past 200,000 yr as recorded in deep-sea sediments. Geol. Soc. Am. Bull. 89 (4), 591–604. doi:10.1130/0016-7606(1978)89<591:evaitm>2.0.co;2
Kinoshita, M., Fukase, H., Goto, S., and Toki, T. (2015). In situ thermal excursions detected in the Nankai Trough forearc slope sediment at IODP NanTroSEIZE Site C0008. Earth, Planets Space 67 (1), 16–19. doi:10.1186/s40623-014-0171-1
Kopf, A. J. (2002). Significance of mud volcanism. Rev. Geophys. 40 (2), 2–52. doi:10.1029/2000RG000093
Kossel, E., Bigalke, N., Piñero, E., and Haeckel, M. (2013). The SUGAR Toolbox-A library of numerical algorithms and data for modelling of gas hydrate systems and marine environments. GEOMAR Report 8 (N. Ser.). GEOMAR Helmholtz Centre for Ocean Research Kiel. doi:10.3289/GEOMAR_REP_NS_8_2013
Kvenvolden, K. A., and McDonald, T. J. (1986). Organic Geochemistry on the JOIDES Resolution: an assay. Ocean Drilling Program, Technical Note 6, 1–147. College Station, Texas: Texas A&M University.
Lalk, E., Pape, T., Gruen, D. S., Kaul, N., Karolewski, J. S., Bohrmann, G., et al. (2022). Clumped methane isotopologue-based temperature estimates for sources of methane in marine gas hydrates and associated vent gases. Geochimica Cosmochimica Acta 327, 276–297. doi:10.1016/j.gca.2022.04.013
Loher, M., Ceramicola, S., Wintersteller, P., Meinecke, G., Sahling, H., and Bohrmann, G. (2018a). Mud volcanism in a canyon: morphodynamic evolution of the active Venere mud volcano and its interplay with Squillace Canyon, Central Mediterranean. Geochem. Geophys. Geosystems 19 (2), 356–378. doi:10.1002/2017gc007166
Loher, M., Marcon, Y., Pape, T., Römer, M., Wintersteller, P., dos Santos Ferreira, C., et al. (2018b). Seafloor sealing, doming, and collapse associated with gas seeps and authigenic carbonate structures at Venere mud volcano, Central Mediterranean. Deep Sea Res. Part I: Oceanogr. Res. Pap. 137, 76–96. doi:10.1016/j.dsr.2018.04.006
Loher, M., Pape, T., Marcon, Y., Römer, M., Wintersteller, P., Praeg, D., et al. (2018c). Mud extrusion and ring-fault gas seepage - upward branching fluid discharge at a deep-sea mud volcano. Sci. Rep. 8 (1), 6275. doi:10.1038/s41598-018-24689-1
Lykousis, V., Alexandri, S., Woodside, J., De Lange, G., Dählmann, A., Perissoratis, C., et al. (2009). Mud volcanoes and gas hydrates in the Anaximander mountains (Eastern Mediterranean Sea). Mar. Petroleum Geol. 26 (6), 854–872. doi:10.1016/j.marpetgeo.2008.05.002
Malinverno, A., and Ryan, W. B. (1986). Extension in the Tyrrhenian Sea and shortening in the Apennines as result of arc migration driven by sinking of the lithosphere. Tectonics 5 (2), 227–245. doi:10.1029/tc005i002p00227
Mascle, J., Mary, F., Praeg, D., Brosolo, L., Camera, L., Ceramicola, S., et al. (2014). Distribution and geological control of mud volcanoes and other fluid/free gas seepage features in the Mediterranean Sea and nearby Gulf of Cadiz. Geo-Marine Lett. 34 (2), 89–110. doi:10.1007/s00367-014-0356-4
Masoudi, R., and Tohidi, B. (2005). Estimating the hydrate stability zone in the presence of salts and/or organic inhibitors using water partial pressure. J. Petroleum Sci. Eng. 46 (1), 23–36. doi:10.1016/j.petrol.2004.10.002
Mastalerz, V., de Lange, G. J., Dählmann, A., and Feseker, T. (2007). Active venting at the Isis mud volcano, offshore Egypt: origin and migration of hydrocarbons. Chem. Geol. 246 (1-2), 87–106. doi:10.1016/j.chemgeo.2007.09.005
Mazzini, A., and Etiope, G. (2017). Mud volcanism: an updated review. Earth-Science Rev. 168, 81–112. doi:10.1016/j.earscirev.2017.03.001
Menapace, W., Kopf, A., Zabel, M., and de Beer, D. (2017a). “3. Mud volcanoes as dynamic sedimentary phenomena that host marine ecosystems,” in Life at vents and seeps. Editor K. Jens (Berlin, Boston: De Gruyter), 53–84. doi:10.1515/9783110493672-003
Menapace, W., Völker, D., Kaul, N., Tryon, M. D., and Kopf, A. J. (2017b). The role of mud volcanism and deep-seated dewatering processes in the Nankai Trough accretionary prism and Kumano Basin, Japan. Geochem. Geophys. Geosystems 18 (7), 2486–2509. doi:10.1002/2016GC006763
Mercone, D., Thomson, J., Abu-Zied, R., Croudace, I., and Rohling, E. (2001). High-resolution geochemical and micropalaeontological profiling of the most recent eastern Mediterranean sapropel. Mar. Geol. 177 (1-2), 25–44. doi:10.1016/s0025-3227(01)00122-0
Mercone, D., Thomson, J., Croudace, I., Siani, G., Paterne, M., and Troelstra, S. (2000). Duration of S1, the most recent sapropel in the eastern Mediterranean Sea, as indicated by accelerator mass spectrometry radiocarbon and geochemical evidence. Paleoceanography 15 (3), 336–347. doi:10.1029/1999pa000397
Milkov, A. (2000). Worldwide distribution of submarine mud volcanoes and associated gas hydrates. Mar. Geol. 167 (1-2), 29–42. doi:10.1016/s0025-3227(00)00022-0
Milkov, A. V., and Etiope, G. (2018). Revised genetic diagrams for natural gases based on a global dataset of >20,000 samples. Org. Geochem. 125, 109–120. doi:10.1016/j.orggeochem.2018.09.002
Minelli, L., and Faccenna, C. (2010). Evolution of the Calabrian accretionary wedge (central Mediterranean). Tectonics 29 (4). doi:10.1029/2009tc002562
Miramontes, E., Pellegrini, C., Casalbore, D., and Dupré, S. (2023). “Active geological processes in the Mediterranean Sea,” in Oceanography of the Mediterranean Sea. Editors Schroeder, K., and Chiggiato, J. (Elsevier), 453–499. doi:10.1016/B978-0-12-823692-5.00010-8
Morlotti, E., Sartori, R., Torelli, L., Barbieri, F., and Raffi, I. (1982). Chaotic deposits from the external Calabrian Arc (Ionian Sea). Mem. della Soc. Geol. Ital. 24, 261–275.
Narcisi, B., and Vezzoli, L. (1999). Quaternary stratigraphy of distal tephra layers in the Mediterranean—an overview. Glob. Planet. Change 21 (1-3), 31–50. doi:10.1016/s0921-8181(99)00006-5
Niewöhner, C., Hensen, C., Kasten, S., Zabel, M., and Schulz, H. (1998). Deep sulfate reduction completely mediated by anaerobic methane oxidation in sediments of the upwelling area off Namibia. Geochimica Cosmochimica Acta 62 (3), 455–464. doi:10.1016/s0016-7037(98)00055-6
Palano, M., Ferranti, L., Monaco, C., Mattia, M., Aloisi, M., Bruno, V., et al. (2012). GPS velocity and strain fields in Sicily and southern Calabria, Italy: updated geodetic constraints on tectonic block interaction in the central Mediterranean. J. Geophys. Res. Solid Earth 117 (B7). doi:10.1029/2012jb009254
Panieri, G., Polonia, A., Lucchi, R., Zironi, S., Capotondi, L., Negri, A., et al. (2013). Mud volcanoes along the inner deformation front of the Calabrian Arc accretionary wedge (Ionian Sea). Mar. Geol. 336, 84–98. doi:10.1016/j.margeo.2012.11.003
Pape, T., Geprägs, P., Hammerschmidt, S., Wintersteller, P., Wei, J., Fleischmann, T., et al. (2014). Hydrocarbon seepage and its sources at mud volcanoes of the Kumano forearc basin, Nankai Trough subduction zone. Geochem. Geophys. Geosystems 15 (6), 2180–2194. doi:10.1002/2013gc005057
Pape, T., Haeckel, M., Riedel, M., Kölling, M., Schmidt, M., Wallmann, K., et al. (2020a). Formation pathways of light hydrocarbons in deep sediments of the Danube deep-sea fan, Western Black Sea. Mar. Petroleum Geol. 122, 104627. doi:10.1016/j.marpetgeo.2020.104627
Pape, T., Kasten, S., Zabel, M., Bahr, A., Abegg, F., Hohnberg, H.-J., et al. (2010). Gas hydrates in shallow deposits of the Amsterdam mud volcano, Anaximander Mountains, Northeastern Mediterranean Sea. Geo-Marine Lett. 30 (3), 187–206. doi:10.1007/s00367-010-0197-8
Pape, T., Ruffine, L., Hong, W. L., Sultan, N., Riboulot, V., Peters, C. A., et al. (2020b). Shallow gas hydrate accumulations at a Nigerian deepwater pockmark—quantities and dynamics. J. Geophys. Res. Solid Earth 125 (9), e2019JB018283. doi:10.1029/2019jb018283
Paull, C. K., Dallimore, S., Caress, D., Gwiazda, R., Melling, H., Riedel, M., et al. (2015). Active mud volcanoes on the continental slope of the Canadian Beaufort Sea. Geochem. Geophys. Geosystems 16 (9), 3160–3181. doi:10.1002/2015gc005928
Pfender, M., and Villinger, H. (2002). Miniaturized data loggers for deep sea sediment temperature gradient measurements. Mar. Geol. 186 (3-4), 557–570. doi:10.1016/s0025-3227(02)00213-x
Planke, S., Svensen, H., Hovland, M., Banks, D., and Jamtveit, B. (2003). Mud and fluid migration in active mud volcanoes in Azerbaijan. Geo-Marine Lett. 23 (3), 258–268. doi:10.1007/s00367-003-0152-z
Polonia, A., Bonatti, E., Camerlenghi, A., Lucchi, R. G., Panieri, G., and Gasperini, L. (2013a). Mediterranean megaturbidite triggered by the AD 365 Crete earthquake and tsunami. Sci. Rep. 3 (1), 1285. doi:10.1038/srep01285
Polonia, A., Romano, S., Çağatay, M., Capotondi, L., Gasparotto, G., Gasperini, L., et al. (2015). Are repetitive slumpings during sapropel S1 related to paleo-earthquakes? Mar. Geol. 361, 41–52. doi:10.1016/j.margeo.2015.01.001
Polonia, A., Torelli, L., Mussoni, P., Gasperini, L., Artoni, A., and Klaeschen, D. (2011). The Calabrian Arc subduction complex in the Ionian Sea: regional architecture, active deformation, and seismic hazard. Tectonics 30 (5), TC5018. doi:10.1029/2010tc002821
Prada, M., Ranero, C. R., Sallarès, V., Grevemeyer, I., de Franco, R., Gervasi, A., et al. (2020). The structure of Mediterranean arcs: new insights from the Calabrian Arc subduction system. Earth Planet. Sci. Lett. 548, 116480. doi:10.1016/j.epsl.2020.116480
Praeg, D., Ceramicola, S., Barbieri, R., Unnithan, V., and Wardell, N. (2009). Tectonically-driven mud volcanism since the late Pliocene on the Calabrian accretionary prism, central Mediterranean Sea. Mar. Petroleum Geol. 26 (9), 1849–1865. doi:10.1016/j.marpetgeo.2009.03.008
Revil, A. (2002). Genesis of mud volcanoes in sedimentary basins: a solitary wave-based mechanism. Geophys. Res. Lett. 29 (12). doi:10.1029/2001gl014465
Römer, M., Sahling, H., Pape, T., dos Santos Ferreira, C., Wenzhöfer, F., Boetius, A., et al. (2014). Methane fluxes and carbonate deposits at a cold seep area of the Central Nile Deep Sea Fan, Eastern Mediterranean Sea. Mar. Geol. 347, 27–42. doi:10.1016/j.margeo.2013.10.011
Rosenbaum, G., Lister, G. S., and Duboz, C. (2002). Reconstruction of the tectonic evolution of the western Mediterranean since the Oligocene. J. Virtual Explor. 8, 107–130. doi:10.3809/jvirtex.2002.00053
Rossi, S., and Sartori, R. (1981). A seismic reflection study of the external Calabrian Arc in the northern Ionian Sea (eastern Mediterranean). Mar. Geophys. Res. 4 (4), 403–426. doi:10.1007/bf00286036
Roveri, M., Flecker, R., Krijgsman, W., Lofi, J., Lugli, S., Manzi, V., et al. (2014). The Messinian Salinity Crisis: past and future of a great challenge for marine sciences. Mar. Geol. 352, 25–58. doi:10.1016/j.margeo.2014.02.002
Sahling, H., Bohrmann, G., Artemov, Y. G., Bahr, A., Brüning, M., Klapp, S. A., et al. (2009). Vodyanitskii mud volcano, Sorokin trough, Black Sea: geological characterization and quantification of gas bubble streams. Mar. Petroleum Geol. 26 (9), 1799–1811. doi:10.1016/j.marpetgeo.2009.01.010
Sartori, R. (2003). The Tyrrhenian back-arc basin and subduction of the Ionian lithosphere. Episodes 26 (3), 217–221. doi:10.18814/epiiugs/2003/v26i3/011
Sauter, E. J., Muyakshin, S. I., Charlou, J.-L., Schlüter, M., Boetius, A., Jerosch, K., et al. (2006). Methane discharge from a deep-sea submarine mud volcano into the upper water column by gas hydrate-coated methane bubbles. Earth Planet. Sci. Lett. 243 (3-4), 354–365. doi:10.1016/j.epsl.2006.01.041
Schulz, H. N., and Schulz, H. D. (2005). Large sulfur bacteria and the formation of phosphorite. Science 307 (5708), 416–418. doi:10.1126/science.1103096
Seeberg-Elverfeldt, J., Schlüter, M., Feseker, T., and Kölling, M. (2005). Rhizon sampling of porewaters near the sediment-water interface of aquatic systems. Limnol. Oceanogr. Methods 3 (8), 361–371. doi:10.4319/lom.2005.3.361
Serpelloni, E., Vannucci, G., Pondrelli, S., Argnani, A., Casula, G., Anzidei, M., et al. (2007). Kinematics of the Western Africa-Eurasia plate boundary from focal mechanisms and GPS data. Geophys. J. Int. 169 (3), 1180–1200. doi:10.1111/j.1365-246x.2007.03367.x
Somoza, L., Medialdea, T., León, R., Ercilla, G., Vázquez, J. T., Hernández-Molina, J., et al. (2012). Structure of mud volcano systems and pockmarks in the region of the Ceuta Contourite Depositional System (Western Alborán Sea). Mar. Geol. 332, 4–26. doi:10.1016/j.margeo.2012.06.002
Spakman, W. (1986). Subduction beneath Eurasia in connection with the Mesozoic Tethys. Neth. J. Geosciences/Geologie en Mijnbouw 65, 145–153.
Stadnitskaia, A., Ivanov, M. K., Poludetkina, E. N., Kreulen, R., and van Weering, T. C. (2008). Sources of hydrocarbon gases in mud volcanoes from the Sorokin Trough, NE Black Sea, based on molecular and carbon isotopic compositions. Mar. Petroleum Geol. 25 (10), 1040–1057. doi:10.1016/j.marpetgeo.2007.08.001
Strasser, M., Kölling, M., dos Santos Ferreira, C., Fink, H. G., Fujiwara, T., Henkel, S., et al. (2013). A slump in the trench: tracking the impact of the 2011 Tohoku-Oki earthquake. Geology 41 (8), 935–938. doi:10.1130/g34477.1
Suess, E., Torres, M., Bohrmann, G., Collier, R., Greinert, J., Linke, P., et al. (1999). Gas hydrate destabilization: enhanced dewatering, benthic material turnover and large methane plumes at the Cascadia convergent margin. Earth Planet. Sci. Lett. 170 (1-2), 1–15. doi:10.1016/s0012-821x(99)00092-8
Tishchenko, P., Hensen, C., Wallmann, K., and Wong, C. S. (2005). Calculation of the stability and solubility of methane hydrate in seawater. Chem. Geol. 219 (1-4), 37–52. doi:10.1016/j.chemgeo.2005.02.008
Villinger, H., and Davis, E. E. (1987). A new reduction algorithm for marine heat flow measurements. J. Geophys. Res. Solid Earth 92 (B12), 12846–12856. doi:10.1029/jb092ib12p12846
Villinger, H. W., Tréhu, A. M., Grevemeyer, I., Andreassen, K., Mienert, J., Bryn, P., et al. (2010). “Seafloor marine heat flux measurements and estimation of heat flux from seismic observations of bottom simulating reflectors,” in Geophysical characterization of gas hydrates. Editors Riedel, M., Willoughby, E. C., and Chopra, S. (Society of Exploration Geophysicists), 279–300. doi:10.1190/1.9781560802197.ch18
Whiticar, M. J. (1999). Carbon and hydrogen isotope systematics of bacterial formation and oxidation of methane. Chem. Geol. 161 (1-3), 291–314. doi:10.1016/S0009-2541(99)00092-3
Wortel, M., and Spakman, W. (2000). Subduction and slab detachment in the Mediterranean-Carpathian region. Science 290 (5498), 1910–1917. doi:10.1126/science.290.5498.1910
Wulf, S., Kraml, M., and Keller, J. (2008). Towards a detailed distal tephrostratigraphy in the Central Mediterranean: the last 20,000 yrs record of Lago Grande di Monticchio. J. Volcanol. Geotherm. Res. 177 (1), 118–132. doi:10.1016/j.jvolgeores.2007.10.009
Zanchetta, G., Sulpizio, R., Roberts, N., Cioni, R., Eastwood, W. J., Siani, G., et al. (2011). Tephrostratigraphy, chronology and climatic events of the Mediterranean basin during the Holocene: an overview. Holocene 21 (1), 33–52. doi:10.1177/0959683610377531
Keywords: mud volcano, Calabrian Arc, AUV mapping, fluid flux, sediment temperatures, pore water chemistry, methane, stable isotopes of methane
Citation: Doll M, Römer M, Pape T, Kölling M, Kaul N, dos Santos Ferreira C and Bohrmann G (2023) Recent and episodic activity of decoupled mud/fluid discharge at Sartori mud volcano in the Calabrian Arc, Mediterranean Sea. Front. Earth Sci. 11:1181380. doi: 10.3389/feart.2023.1181380
Received: 07 March 2023; Accepted: 19 October 2023;
Published: 21 November 2023.
Edited by:
Stéphanie Dupré, Institut Français de Recherche pour l’Exploitation de la Mer, FranceReviewed by:
Grigorii Georgievich Akhmanov, Lomonosov Moscow State University, RussiaCharles Geoffrey Wheat, University of Alaska Fairbanks, United States
Copyright © 2023 Doll, Römer, Pape, Kölling, Kaul, dos Santos Ferreira and Bohrmann. This is an open-access article distributed under the terms of the Creative Commons Attribution License (CC BY). The use, distribution or reproduction in other forums is permitted, provided the original author(s) and the copyright owner(s) are credited and that the original publication in this journal is cited, in accordance with accepted academic practice. No use, distribution or reproduction is permitted which does not comply with these terms.
*Correspondence: Mechthild Doll, bWRvbGxAbWFydW0uZGU=