 Sheng Ye
 Jiajia Pan
 Jiyu Li2
 Tianxue Yu
 Qihua Ran
- 1Key Laboratory of Hydrologic-Cycle and Hydrodynamic-System of Ministry of Water Resources, Hohai University, Nanjing, China
- 2Institute of Water Science and Engineering, Zhejiang University, Hangzhou, China
Elevated nutrient loading can cause deleterious impacts on aquatic ecosystems such as eutrophication. Seasonal variability and land use change often lead to varied nutrient uptake from streams. However, the impacts of seasonal and spatial variation on stream nutrient transport within the same watershed haven’t been fully understood. Here, we conducted nutrient addition experiments using the Tracer Additions for Spiraling Curve Characterization (TASCC) approach within the Xiaogang Watershed, Zhejiang Province, China. Six of the experiments were conducted in one stream every other month and eight releases in eight different streams to quantify ammonium uptake kinetics across different seasons and land uses. Our findings suggest that the uptake capability increases with both discharge and ambient concentration (C0): seasonal variability of discharge shows small impacts on uptake metrics, except the ambient uptake length (Sw-amb), which increases with discharge; while the change in C0 could have more significant effects on both ambient areal uptake (Uamb) and maximum areal uptake rate parameter (Umax). Downstream the river network, the increase in discharge led to a significant increase in Uamb, ambient uptake velocity (Vf-amb), and Umax. On the other hand, the change in C0 is less influential than discharge along the river network, which may be correlated with the hydraulic geometry. Additionally, there is an optimal temperature (T) for uptake in our study region around 17°C, which may be explained by the growth of chlorophyll a. The positive correlation between Vf-amb and Q at the spatial scale may be attributed to the increase of dissolved organic carbon (DOC) and river chlorophyll a downstream with stream width. In addition, land use had an important effect on ion concentration in streams, and the proportion of agricultural land was positively correlated with nutrient concentration. Our findings could help provide scientific support for land use management and water quality regulation.
1 Introduction
Nutrients such as nitrogen (N) and phosphorus (P), are critical to stream biotic activity (Mulholland and Webster, 2010) and often limit ecosystem productivity (Grimm and Fisher, 1986; Vitousek and Howarth, 1991). From the beginning of the 20th century, nutrient inputs to aquatic ecosystems have increased dramatically owing to expanded human activities globally such as urbanization and fertilizer applications related to agricultural land use (Vitousek et al., 1997; Smil, 2000; Bouwman et al., 2005; Seitzinger et al., 2005). Excess N loading can have harmful impacts on water quality, leading to eutrophication and the loss of biological diversity (Webster, 1975; Bormann and Likens, 1979). While it’s found that about 30% of the soluble phosphate and 37%–76% of the nitrogen nutrients entering the water body are intercepted by small rivers of grade 1 to 4 during the transport in the river basin, confirming that low-grade streams can play an important role in the process of nutrient uptake (Seitzinger et al., 2002; Mulholland, 2004). Therefore, giving full play to the uptake effect and reduction capacity of source streams on nitrogen and phosphorus nutrients can be practically essential to improve and regulate the quality of the water environment.
Nutrient spiraling is an important ecological process characterizing nutrient transport and uptake in a small river system (Newbold et al., 1981; Stream Solutes Workshop, 1990). According to [Webster (1975); Webster and Patten, 1979], nutrients in a stream do not cycle in situ; rather, they are continually pushed downstream as they complete a cycle. This combination of transport and cycling was characterized as “spiraling”: the “tightness” of the spirals indicates how well a stream can use nutrients. The idea of spiraling was discussed by other scholars (Wallace et al., 1977; Meyer, 1979; Naiman and Sedell, 1979; Benke and Wallace, 1980) who also noted the significance of spatially dependent reutilization of nutrients (Ball et al., 1963; Short and Maslin, 1977).
Stream nutrient tracer additions and nutrient spiraling metrics are widely used to quantify lotic ecosystem behavior. Many studies have conducted constant and continuous added tracer experiments and used nutritive salt concentration and spiral indexes under a steady state for quantitative depiction and measurement of nutritive salt uptake abilities, mostly at small-scale water bodies like headwaters (Peterson et al., 2001; Saunders et al., 2006; Alexander et al., 2007). Tank et al. (2008) started to conduct tracer addition experiments in big rivers. Covino et al. (2010b) refined the pulse method, and developed the Tracer Additions for Spiraling Curve Characterization (TASCC) method, using the variable concentration of a highly concentrated pulse to estimate uptake kinetics.
Our current understanding of the processes that drive nutrient uptake in aquatic systems reflects the focus of early studies on understanding ecosystem limitation by macronutrients, particularly on the N or P limitation of biomass growth and production (Meyer and Likens, 1979; Mulholland et al., 2008; Gardner et al., 2011; Hall et al., 2013). Ammonium (NH4+-N) is easy to be adsorbed and used by aquatic plants and can be eliminated from water through nitrification and denitrification (Billen et al., 1991). It is an important index that influences the remediation and improvement of the water environment. Though it has been generally accepted that hydrological regimes and environmental conditions are important drivers for nutrient uptake in streams, there are still a lot of unknowns in nitrogen nutrient cycling due to the complexity and diversity of small river systems and sample number limitations such as the impacts of photosynthesis, heterotroph and so on (Arango et al., 2008; Hall R. O. et al., 2009).
Consequently, parameters such as the rate of biomass accumulation and magnitude of gross primary production at the ecosystem level have been identified as important drivers of nutrient uptake rates in streams (Grimm, 1987; Hall and Tank, 2003; Elser et al., 2007). Researchers have discovered that stream nitrogen (N) uptake kinetics vary with development. Land use/land cover change and fertilization effect were evident, which could lead to increased ash-free dry mass, chlorophyll a, and ambient and maximum uptake rates in developed compared with undeveloped streams. Ash-free dry mass (AFDM) of biofilm, chlorophyll a, and the number of structures in a sub-watershed were significantly correlated to nutrient spiraling and kinetic parameters, while ambient and average annual N concentrations were not (Covino et al., 2012). Seybold and McGlynn (2018) investigated the seasonality of nutrient uptake, detecting that seasonal decrease in dissolved organic carbon (DOC) and nitrate (NO3−) concentration reduced the biotic community’s ability to take up nutrients, and seasonal uptake was consistent with the seasonal dynamics of ecosystem metabolism. During the growing season (from June to August), the biotic community shows its capability of nutrient retention and water quality regulation.
Numerous studies have investigated drivers of the nutrient uptake in streams and rivers (Webster et al., 2003; Ensign and Doyle, 2006; Hall R. O. et al., 2009) and the importance of these uptake processes for downstream water quality and ecosystem health, yet few were conducted to investigate the influence and mechanism of both seasonal and spatial variation on stream nutrient uptake in the same watershed. Seasonal alternation and land use change often lead to varied nutrient loading and uptake (Reisinger et al., 2015; Seybold and McGlynn, 2018). It is necessary to understand the uptake kinetics and their relationship to the physical and biological drivers to better understand the dynamics of nutrient transport and transformation at the watershed scale. To address this, we conducted 13 ammonium addition experiments for a whole year in a hilly watershed. Considering the time and cost, the TASCC method (Covino et al., 2010b; Piper et al., 2017) was applied in this study. Hydrologic and biological characteristics were collected and measured to examine their relationship with uptake metrics.
2 Materials and methods
2.1 Study area
This study was conducted in a hilly watershed, Xiaogang Watershed, in the southwest of Zhejiang Province, China (Figure 1). The dominant climate is subtropical monsoon climate, which is warm and humid, providing abundant rainfall. The mean temperature is 17.7°C. January is the coldest month with a mean temperature of 6.4°C. While the mean temperature in July is 28.4°C, the hottest month. The mean annual precipitation and evaporation in the area are 1,658.6 mm and 1,291 mm respectively. The rainy season is from March to September: 880.5 mm of rainfall comes between March and June, accounting for 53.1% of annual precipitation; while rainfall comes between July and September accounts for 25.6% of annual precipitation. The rainy season is prone to flooding and inducing geological disasters. Xiaogang Watershed drains through a hilly area of 500.3 km2, with elevations ranging from 120 m to 1,493 m. The land use type of the Xiaogang Watershed is dominated by undeveloped natural land.
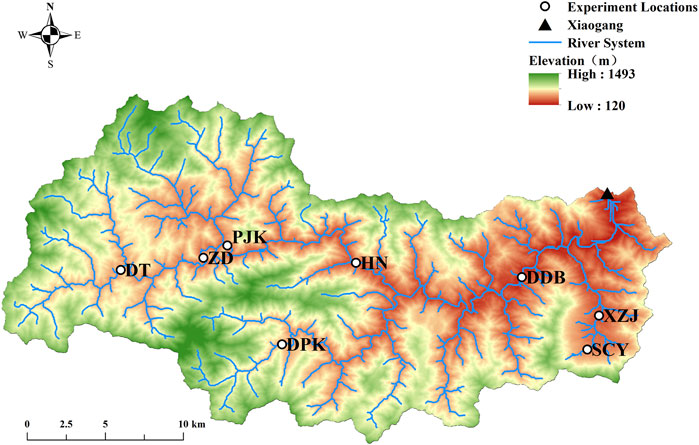
FIGURE 1. Map of the Xiaogang watershed with experimental sites and the Xiaogang Hydrological Station marked with a triangle.
2.2 Experiment design
Our goal here was to measure NH4+-N uptake kinetics across seasonal and spatial scales. A total of six field experiments were conducted in a headwater named Shicangyuan (SCY) Stream every other month from May 2021 to March 2022 to examine the seasonal variation of ammonium uptake kinetics (Table 2). Besides, we conducted eight experiments across Xiaogang Watershed to investigate the spatial distribution of ammonium uptake between March 8 and 16, 2022 at Dadongba (DDB), Huangnan (HN), Paijukou (PJK), Zhudai (ZD), Doutan (DT), Dapankeng (DPK), Xiazhaijie (XZJ), and Shicangyuan (SCY) (Figure 1). The eight experiment sites were distributed along the upper and lower reaches of the watershed and the mainstream tributaries, with watershed areas ranging from 4 km2 to 420 km2 and discharge varying from 42 L s−1–7,224 L s−1 (Table 1). The DDB, HN, PJK, DT, and ZD experimental sites are on the mainstream of Songyang River, and the rest are on the tributaries.
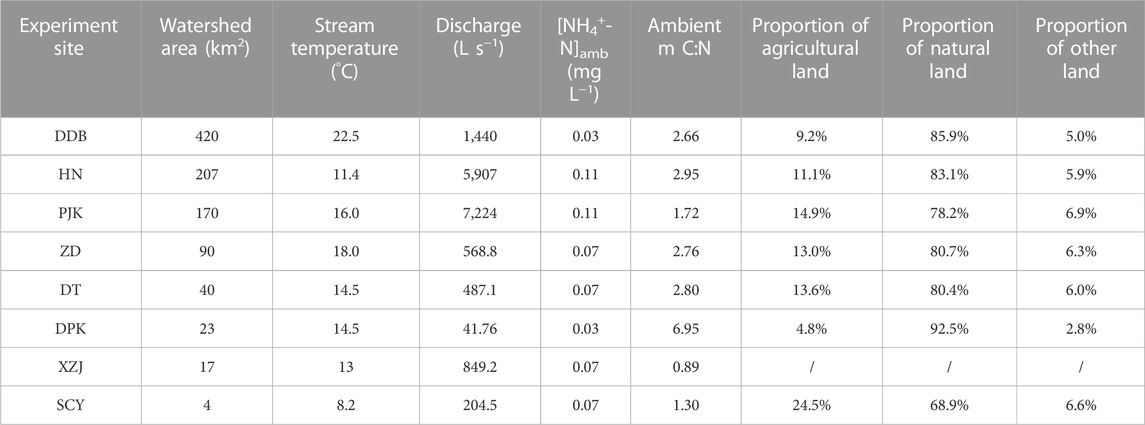
TABLE 1. Characteristics and land use data of the eight experimental streams.
2.3 Watershed characteristic data
To understand the impact of land use on nutrient uptake efficiency, the land use distribution within the study area was collected from the government maps based on satellite images. The proportion of different land use types was estimated for the drainage area of the sampling sites. Topographic characteristics (i.e., topographic gradient) were extracted from the digital elevation model (DEM). Water samples from eight streams during the spatial experiment were collected, filtered, and stored on ice before being sent to the lab for water quality characteristics including DOC, Cl−, TN, NH4+, NO3−, and chlorophyll a to further analyze the potentially influential factors. Two replicates were collected for each sample. Samples were kept in a dark polyethylene bottle with ice and analyzed at the lab within 24 h. Epilithic material was collected from rocks at each stream reach for benthic chlorophyll a and AFDM. Chlorophyll a concentration was measured using the spectrophotometry method; AFDM was measured from samples that were oven-dried at 60°C, weighed, and burned in a muffle furnace. These watershed characteristics were used to assess their potential impacts on uptake kinetics spatially. Since the water samples were not collected during the seasonal experiments at SCY, monthly sampling data of water quality data records at the mouth of the DDB stream were collected from the local government to show the water quality condition at the seasonal scale. The Pearson correlation coefficient was calculated to examine the internal correlation between these characteristics. Linear correlation was applied to examine the relationship between the uptake metrics and watershed characteristics.
2.4 Field experiments
The TASCC approach (Tracer Additions for Spiraling Curve Characterization) uses a slug addition at a single enrichment level and collects samples on the rising and falling limbs to obtain a set uptake rate (Covino et al., 2010b). It provides a rapid and relatively easy technique for quantifying ambient-spiraling parameters, nutrient uptake kinetics and kinetic model parameterization, and assessment of stream proximity to saturation. It could be readily generalized to other catchments including big rivers.
At the beginning of our TASCC experiments, stream measurements (e.g., discharge, width, depth flow velocity, temperature, etc.) were measured and background concentration was sampled first. The velocity was measured by a current meter which was multiplied by cross section area for discharge estimation. Initial specific conductance and water temperature at the downstream endpoints of the 600 m-long stream reach would also be measured before tracer addition (i.e., ambient N and Cl). NaCl (conservative tracer) and (NH4)2SO4 were weighted and dissolved to generate the solution to add to the stream as an instantaneous injection. Real-time specific conductance measurements were collected at the downstream endpoint at a 60 s time-step. The complete breakthrough curve was sampled with a conductivity meter according to specific conductance data. Stream water samples were taken at the downstream endpoint at intervals of 1–10 min depending on the variability of the conductivity curve; more frequent sampling was done when concentrations changed quickly. After the experiments, stream water samples were stored in high-density polyethylene bottles, cooled at 4°C, filtered, and examined in the lab within 24 h. For each sample, chloride (Cl−) values were determined using Ion Chromatography and ammonium-nitrogen (NH4+-N) by Salicylic acid spectrophotometry.
Nutrient spiraling, which is characterized by uptake length (Sw), the cycle length of the typical dissolved molecule flowing downstream, has enhanced the study of stream nutrient dynamics (Newbold et al., 1981). By graphing the natural log of the NH4+-N: Cl ratio of the injectate and each background-corrected sample taken downstream against stream distance, we were able to determine the added nutrient dynamic longitudinal uptake rates (
where Q is the stream discharge (L3 T−1),
The ambient uptake length (
where Q is stream discharge (L3 T−1),
The sum of ambient (background) and added nutrient intake throughout the addition experiment represents total nutrient uptake. Total nutrient uptake (
where
where
where
2.5 Model fitting and uptake metrics estimating
The Michaelis-Menten (M-M) model was used to estimate the maximum areal uptake rate parameter (Umax) and half saturation concentration parameter (Km) for each tracer test (Eq. 10), where
We also estimated ambient uptake length for our experiments based on the discharge and ambient concentration following Eq. 11 derived in Ye et al. (2017) to compare our data with the literature.
3 Results
3.1 Stream characteristics
The monthly discharge data at Xiaogang Hydrometric Station exhibited great seasonality. From April through August, there was a flood period (consistent with the rainy season of the watershed). However, the ammonium-nitrogen concentration measured at Dadongba did not show clear seasonal variation (Figure 2).
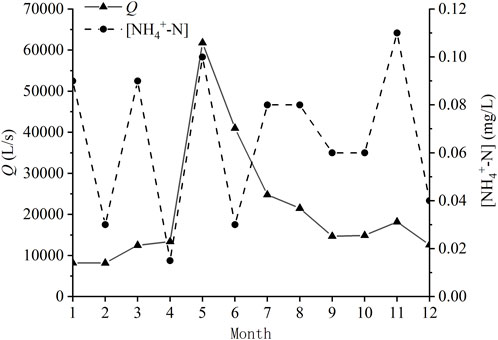
FIGURE 2. The mean monthly discharge (Q) of Xiaogang Hydrological Station in 2021 and the monthly NH4+-N concentrations at Dadongba in 2021.
Agricultural land includes arable land and plantation land. Natural land (unused) includes woodland, wetland, and grassland. Other land includes commercial service land, industrial and mining land, residential land, public administration and public service land, transportation land, special land, and water conservancy facilities. SCY had the highest share of agricultural land (24.5%) and the lowest share of natural land (68.9%) among the seven experimental sites, while DPK had the highest share of natural land (92.5%) and the smallest percentage of agricultural land (4.8%) (Table 1).
Meanwhile, water quality data including NH4+-N, pH, conductance, dissolved oxygen (DO), chemical oxygen demand (CODMn), biochemical oxygen demand (BOD), total nitrogen (TN), total phosphorus (TP), fluoride, and fecal coliform bacteria (FCB) were collected at Dadongba on a monthly basis from local government records, as well as the discharge (Q) and temperature (T) data. Pearson correlation coefficients were calculated between each variable (Figure 3). Results show that DO and T were negatively correlated (p < 0.01) probably due to oxygen solubility with temperature, while Q and FCB had a significantly positive correlation (p < 0.01). What’s more, there was a significant positive correlation between Q and TP (p < 0.05), and a significant negative correlation between FCB and fluoride (p < 0.05). Both CODMn and Q had a positive correlation with T (p < 0.1). NH4+-N and conductance are also positively correlated (p < 0.1).
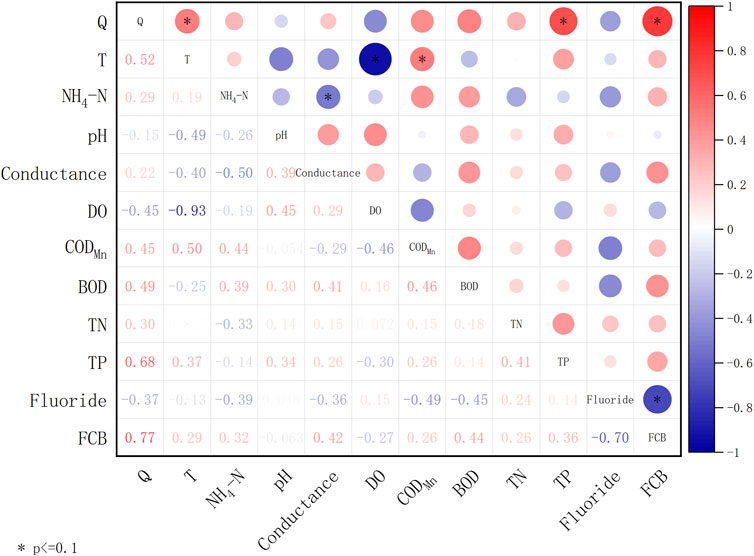
FIGURE 3. Matrix of Pearson correlation coefficients for Q, T and water quality factors at Xiaogang Station (* means p < 0.1).
3.2 Seasonal variation of uptake kinetics
The uptake data were estimated by conducting TASCC experiments every other month at the SCY experimental site. It could be seen that the Sw-amb was larger in summer and winter, smaller in spring and autumn, bottomed in September, and peaked in November (Figure 4). Both ambient [NH4+-N] concentrations (C0) and discharge (Q) peaked in November and Q also reached the lowest point in September (Table 2).
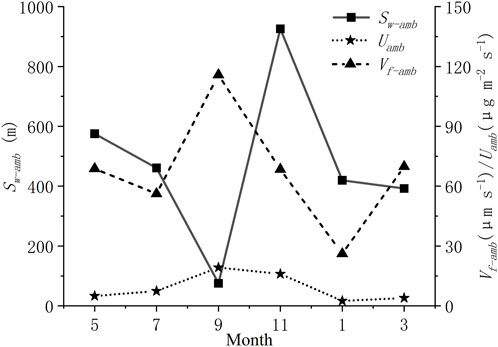
FIGURE 4. Ambient uptake length (Sw-amb), ambient areal uptake rate (Uamb), and ambient uptake velocity (Vf-amb) for ammonium nitrogen.
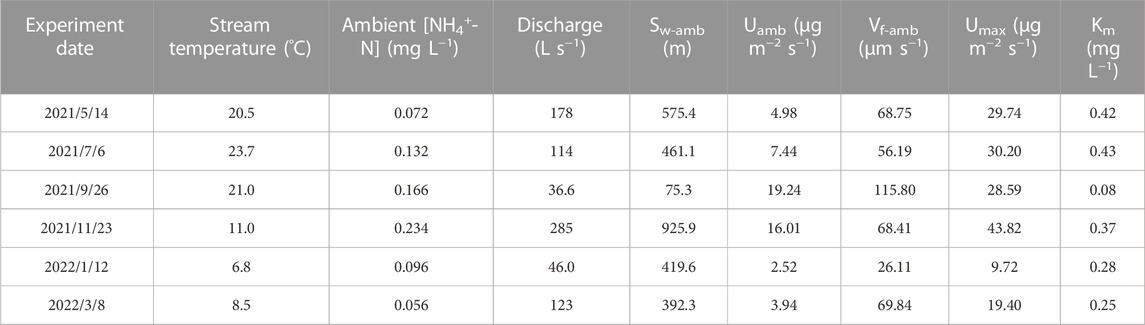
TABLE 2. Nutrient uptake metrics for the seasonal experiments in the shicangyuan (SCY) experiment site.
It is obvious from the chart that the changes in ambient uptake velocity (Vf-amb) and ambient areal uptake rate (Uamb) were consistent in different seasons of the same location. The seasonality of the uptake kinetics characteristics was clear: the uptake capability reached its maximum at the end of the growing season in the fall; it then gradually decreased in the winter, reaching its minimal in January; after which the uptake metrics began to increase during the growing season.
Figure 5 shows the fitted Michaelis-Menten kinetic model for the seasonal experiments. Maximum uptake values (Umax) ranged from 9.72 to 43.82 (μg m−2 s−1). Half saturation constants (Km) ranged from 0.08 to 0.43 (mg L−1) (Table 2). As we can see, there were apparent differences between seasons in Km. The maximum areal uptake rate (Umax) escalated from January to November (Figure 5A). This seasonal trend was also seen in the ambient areal uptake rate (Uamb) value in Figure 4, which was the smallest in January and kept rising until September. The response to nutrient addition was faster in September, presenting a steep rise to Umax (Table 2; Figure 5A). In comparison, Km values from January to July were larger so the curve appeared flat. Curves in May and July were similar and almost overlapped. Km value was larger in summer (May and July), smaller in autumn (September), and gradually recovered in winter and spring (January and March).
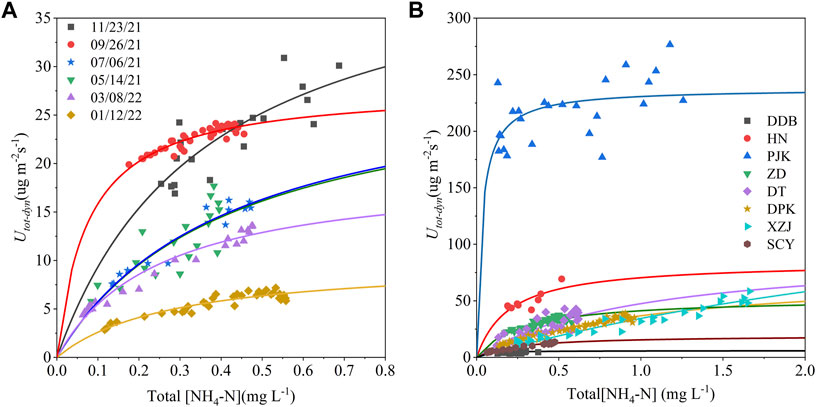
FIGURE 5. (A) Seasonal and (B) spatial variation in total areal uptake rates (
3.3 Spatial heterogeneity of uptake kinetics
Through our addition experiments, discharge (Q) varied from 123 L s−1–5,370 L s−1 and ambient ammonium nitrogen concentration (C0) varied from 0.056 mg L−1 to 0.234 mg L−1 among the eight streams (Tables 1, 3). Maximum uptake values (Umax) among the sites ranged from 5.92 μg m−2 s−1–237.84 μg m−2 s−1 (Table 3). Headwater SCY had the smallest value and PJK had the largest. In addition, half-saturation constants (Km) ranged from 0.03 mg L−1–4.39 mg L−1 spatially (Table 3). PJK on the mainstream had the lowest value, followed by DDB at the watershed outlet, and headwater XZJ had the highest value. Umax values generally increased with greater stream discharge, and PJK had a particularly high Umax value but the lowest Km value, indicating rapid response to increasing nutrient concentration and a high upper limit in uptake.
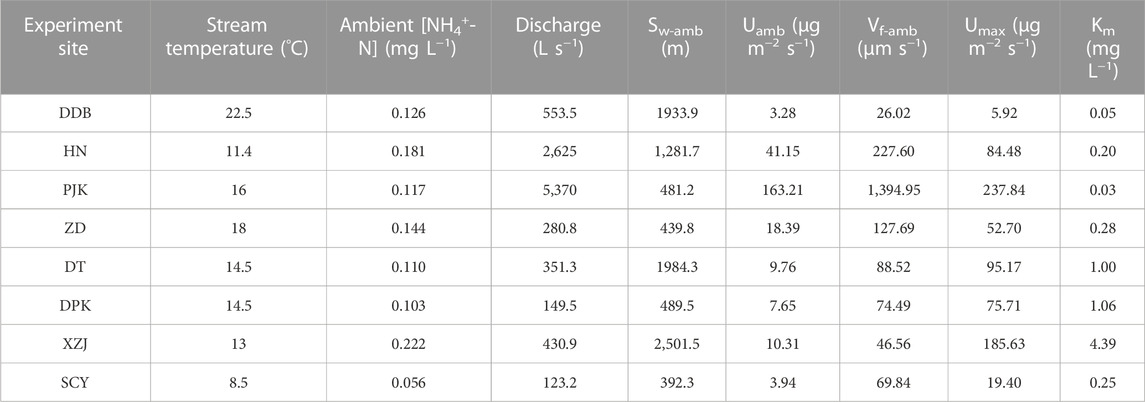
TABLE 3. Nutrient uptake metrics for the spatial experiments in the shicangyuan experiment site.
For spatial scale, mainstream reaches (i.e., DDB, HN, and PJK) reacted more rapidly to increased nutrients, as can be seen in the smaller Km values at DDB, HN, and PJK sites relative to other sites located in tributaries (Table 3; Figure 5B). Umax should also be taken into account when considering Km. Although Utot-dyn at ZD responded more rapidly at lower concentrations, Umax at elevated concentrations was greater at DPK, XZJ, and DT (Figure 5B).
3.4 Relationship between uptake kinetics and watershed characteristics
Relationships between the uptake kinetics (ambient uptake length, ambient areal uptake rate, ambient uptake velocity, maximum uptake rate, half-saturation constant), and stream discharge Q, water temperature T, as well as ambient ammonium nitrogen concentration (i.e., in-stream concentration at the time of the experiment), were shown in Figures 6B,E,F,J–L,N,O. We found a positive correlation between Umax and stream discharge Q among 13 experiments, both seasonally and spatially (Figure 6D). That is, the correlation between uptake metrics and discharge at SCY was consistent both at seasonal and spatial heterogeneity scales. On the other hand, Uamb and Vf-amb were only correlated with discharge downstream at the spatial scale; while the correlation between Sw-amb and discharge was observed at the seasonal scale but not at the spatial scale downstream in the river network. There was a positive correlation between Uamb, Umax, and C0 throughout the year; yet this correlation with C0 was not seen across the watershed. The ambient concentration (C0) was correlated with Km at the spatial scale only (Figure 6M). These relationships were consistent with previously published research (e.g., Mulholland et al., 1990; Hart et al., 1992). Moreover, Uamb, Vf-amb, and Umax increased with temperature first and then decreased around 17°C, this rising and falling trend was more obvious spatially (Figures 6G–I).
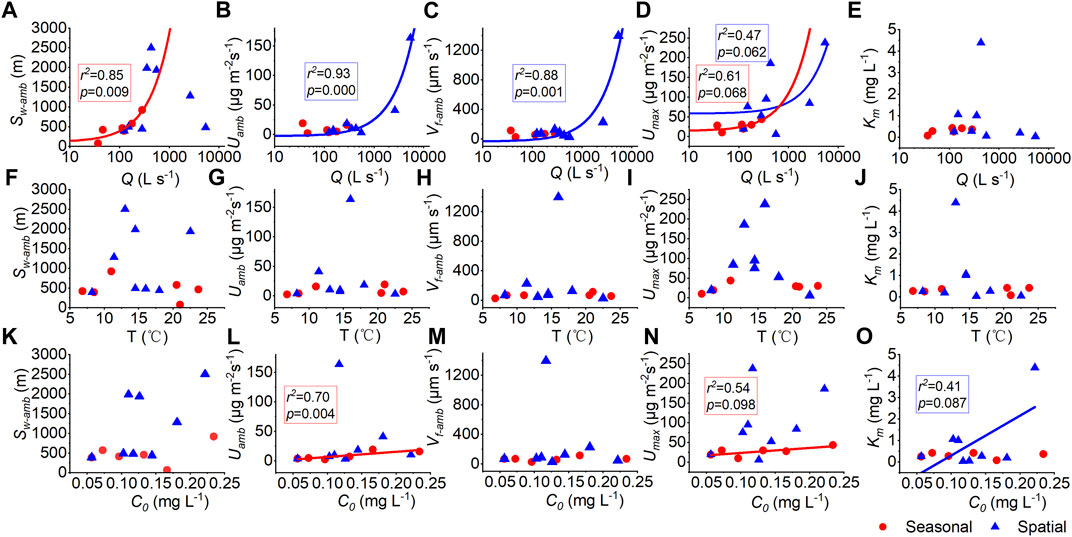
FIGURE 6. Relationships between uptake metrics (ambient uptake length, Sw-amb; ambient areal uptake rate, Uamb; ambient uptake velocity, Vf-amb; the maximum areal uptake rate, Umax; and half-saturation constant, Km) and stream discharge Q (A–E), water temperature T (F–J), and ambient ammonium nitrogen concentration C0 (K–O). Red symbols indicate experiments at SCY through the year and blue symbols indicate experiments across the watershed. Solid lines indicate correlations at 0.1 level.
There is a positive correlation between Sw-amb and Q in Figure 6A through the year in SCY, which is consistent with Figure 7A showing the fitted relationship according to Eq. 11. But this only existed in one site instead of being across the watershed. Vf-amb and Q in Figure 6C are positively related significantly. While the fitted Vf-amb value is relatively stable according to the regressed equation in Figure 7C. In fact, the Vf-amb value rose with the increase of Q, whether seasonally or spatially in the study watershed rivers that didn’t reach saturation. Besides, instead of the predicted uptake length which increased with discharge, the measured ambient uptake length (Sw-amb) increased and then decreased with Q (Figures 7B,D). The higher the discharge, the larger the difference between measured and predicted Sw-amb. That is, the results fit from the regression equation underestimated the ability of uptake in the large flow condition downstream.
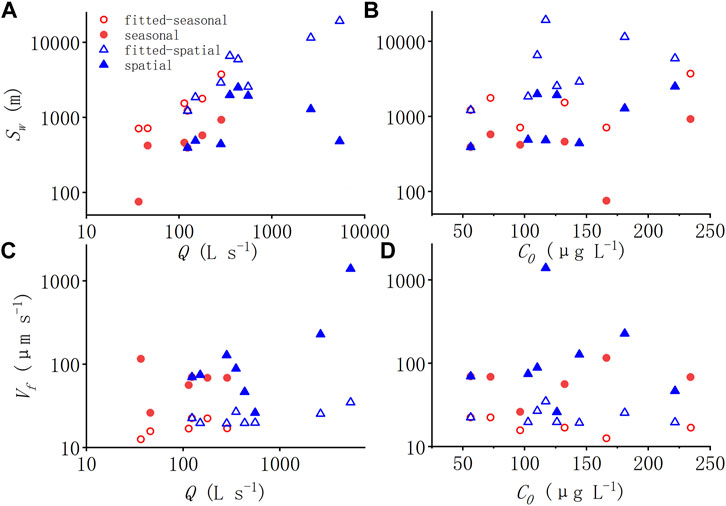
FIGURE 7. (A–D) Relationships between ambient uptake length (Sw-amb), ambient uptake velocity (Vf-amb) and the stream discharge (A,C) and ambient NH4+-N concentration (B,D). Red symbols indicate seasonal experiments and blue symbols indicate spatial experiments. The hollow triangle represents the result of estimated uptake metrics using the regressed Eq. 11.
3.5 Influences of stream characteristics
We further examined the relationships between stream ecological characteristics: dissolved organic carbon, river chlorophyll a, AFDM, and benthic chlorophyll a with stream discharge Q, water temperature T, and ambient ammonium nitrogen C0 among the eight reaches (Figures 8B–H,K–P). As we can see, DOC was positively correlated with discharge (Q) and river width (w) (Figures 8A,I). River chlorophyll a was also significantly positively correlated with river width (Figure 8J). The benthic chlorophyll a showed a rising and falling correlation with temperature, similar to the pattern between temperature and uptake metrics (Uamb, Vf-amb, Umax). Yet there was little correlation between these stream ecological characteristics and ambient concentration of ammonium.
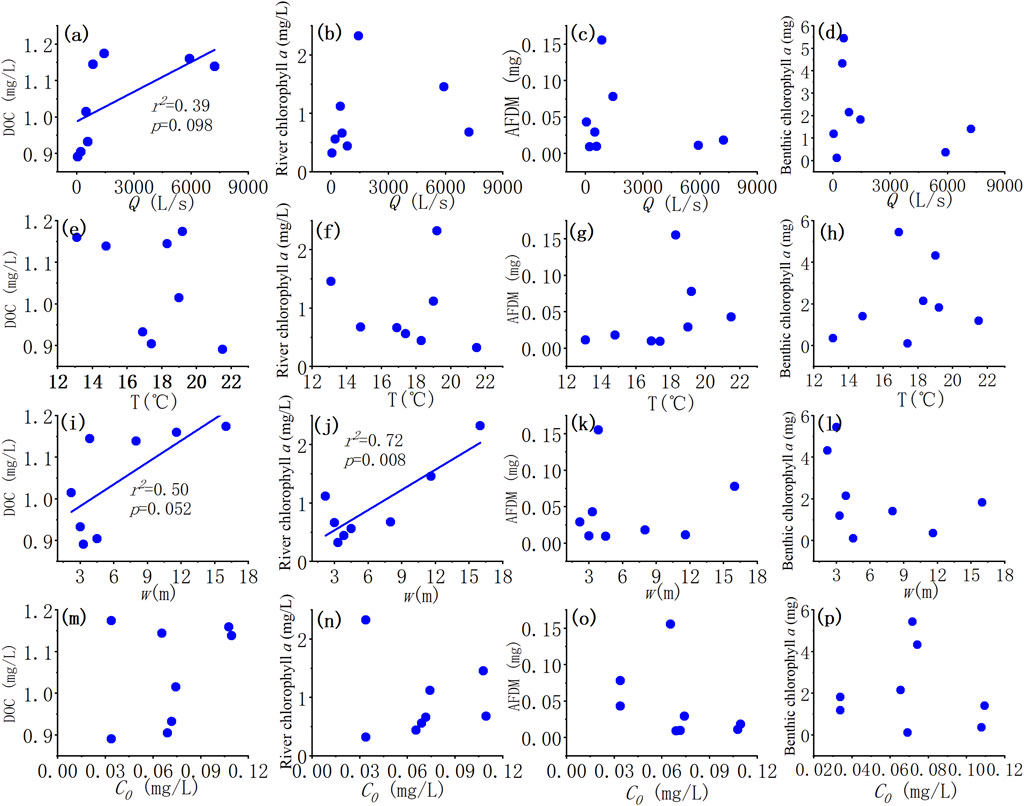
FIGURE 8. (A–P) Relationships between stream ecological characteristics: dissolved organic carbon (DOC), river chlorophyll a, ash-free dry mass (AFDM), benthic chlorophyll a and stream discharge, Q (A–D), water temperature, T (E–H); stream width w (I–L) and ambient ammonium nitrogen C0 (M–P). The solid line indicates a correlation at 0.1 level.
We also collected land use data for the drainage area of seven experimental reaches (Figure 9). It was found that land use showed a positive correlation with the concentration of both nitrogen compounds: NH4+-N and NO3−N (p < 0.05). The larger the proportion of agricultural land, the higher the concentration of TN, NO3− and Cl−. On the other hand, AFDM declined with the proportion of agricultural land.
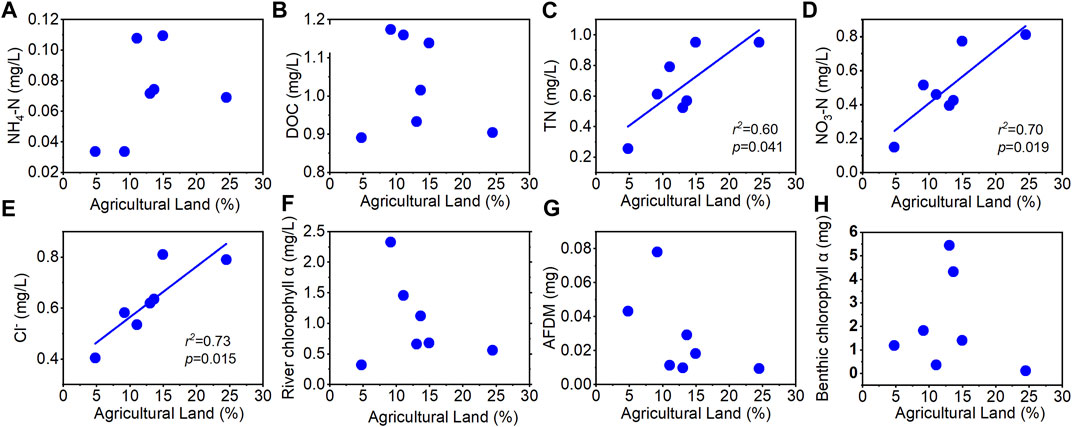
FIGURE 9. Relationships between the proportion of agricultural land and (A) NH4+-N concentration, (B) DOC, (C) total nitrogen (TN), (D) NO3-N concentration, (E) Cl− concentration, (F) river chlorophyll a, (G) ash-free dry mass, and (H) benthic chlorophyll a. The solid line indicates a significant correlation at 0.1 level.
4 Discussion
4.1 Seasonal variability
In this study, a high degree of seasonality in NH4+-N uptake kinetics in the SCY stream was seen. On the seasonal scale, we observed that the maximum ambient areal uptake rate (Uamb) and ambient uptake velocity (Vf-amb) were reached in September, at the end of the growing season, when stream discharge (Q) was the lowest and ambient concentration (C0) was at a high level (Figure 4). Sw-amb is also correlated with Q significantly, consistent with the prediction of the regression equation. Further plots suggested that three uptake metrics (Uamb, Vf-amb, Umax) correlated with Q at both seasonal and spatial scales. Besides, the rising and falling trend between the uptake metrics and temperature indicated that there might be an optimal temperature (T) for uptake in our study region around 17°C, usually after the growing season (Figure 6). Compared with discharge and ambient concentration, the correlation between temperature and uptake metrics was not that significant.
The uptake capacity varies with time which validates the conclusion of previous studies that the nutrient uptake capacity of rivers is dynamic, i.e., the shape and magnitude of the kinetic curve varies seasonally (Syebold and McGlynn, 2018). As our results show, considerable seasonality of nutrient uptake was captured in this work, which has been noted in earlier research (Marti and Sabater, 1996; Simon et al., 2005; Hoellein et al., 2007). This indicated that simulations using only the uptake metrics estimated at one time and one place may not be representative of the aquatic ecosystem’s capability of nutrient retention across space and time. The seasonality of uptake capabilities may not be well captured by water quality models that scale uptake parameters with only temperature either. The overall quantity of ammonium nitrogen absorbed by the biotic community would have been significantly underestimated if we calculated seasonal uptake using just one set of kinetic parameters. The higher the discharge or concentration, the larger the divergence between the measured uptake metrics and the one predicted based on the regressed curves (Figure 7). That is, the uptake capability of the stream varies with discharge and concentration nonlinearly, the regression curves derived from traditional measurements at a single point/time were not able to capture this nonlinearity. This is crucial for water quality modeling, in that adopting a single set of removal rates from regression curves are accepted procedure when simulating the uptake of nutrients in stream networks. We suggest that more measurements are needed to better assess uptake variation at the seasonal scale, especially in dynamic systems that haven’t reached saturation.
4.2 Scaling impact
Under the same seasonal and precipitation conditions, different environmental circumstances lead to distinct uptake rates but still along the M-M curve (Figure 5B). Downstream, the uptake metrics (Uamb, Vf-amb, Umax) increased with rising stream discharge Q and were significantly correlated with Q, while their correlation with ambient NH4+-N concentration (C0) was more scattered (Figure 6). Among the uptake metrics, only the maximum areal uptake rate (Umax) showed a correlation with discharge both seasonally and spatially. On the other hand, though Uamb and Vf-amb were correlated with discharge at the spatial scale, their response to the seasonal variation of discharge was not monotonically. Compared with the predicted uptake length which increased with Q, the measured ambient uptake length (Sw-amb) increased and then decreased with Q (Figure 7). The higher the discharge, the larger the difference between the measured and predicted ambient uptake length. This is different from the consistency at the seasonal scale. The correlation between ambient uptake velocity (Vf-amb) and Q further suggested that the Vf-amb usually considered with little variation did show little correlation with ambient concentration but a relatively clear positive correlation with discharge downstream, which was not captured by the regression curve. That is, the uptake capability did not just change seasonally, but also varied spatially, increasing with discharge linearly downstream. With the increase in discharge/stream width, the biological activity increased even more.
4.3 Impacts of stream characteristics
The positive correlation between Vf-amb and Q was observed seasonally and spatially, which might be attributed to the increasing DOC and river chlorophyll a downstream. When discharge increased downstream, river width increased rapidly, while the riparian vegetation density decreased downstream. Thus, the streams were shadowed by riparian canopy at upstream sites. This light limitation was reduced downstream due to decreased riparian vegetation density and increased stream width. As a result, river chlorophyll a increased downstream (Figures 6, 8). Besides, according to the literature, the threshold ratio of molar DOC:NO3−-N across global ecosystems was from 2.2 to 5.2 (Taylor and Townsend, 2010; Syebold and McGlynn, 2018). This resource stoichiometry was found to strongly influence N accumulation by regulating microbial processes in C and N cycling: lower than the threshold, the system would be energy-limited; higher than that, it would be nutrient-limited (Sterner and Elser, 2002; Sinsabaugh et al., 2016). The C:N ratio (DOC:NO3−-N) in this study varied from 0.89 to 6.95 (Table 1), mostly smaller than the threshold except DPK. Therefore, most of our study streams were energy-limited. That is, the increase in DOC could further improve the uptake capability.
The optimal temperature shown in Figure 6 may be explained by chlorophyll a too, which also showed a similar rising and falling trend with temperature. This might be the suitable temperature for the aquatic ecosystem growth in our study watershed. The land use impacts on nitrogen concentration were also significant as expected. In particular, the concentrations of total nitrogen, nitrate, and chloride had a significant positive linear correlation with the proportion of agricultural land, thanks to the agricultural activities (Figure 9).
4.4 Uptake geometry
Our findings suggest that the uptake capability increased with Q and C0, but the impact of Q and C0 was different throughout the year and across the river network. We may hypothesize that, like hydraulic geometry, the uptake metrics also varied differently at-a-site and downstream.
The variation of discharge was much higher at spatial scale from upstream to downstream than the seasonal variation at certain sites; while the change of ambient concentration was similar seasonally and downstream. At-a-site (seasonally), the impacts of discharge on uptake metrics were relatively limited, while the change in C0 could have more important effects. On the other hand, downstream change in C0 is less influential than discharge variation when considering influences of hydrological conditions. This may be attributed to hydraulic geometry: stream width increased faster with discharge downstream, suggesting a larger wet perimeter, larger benthic area, less light limitation, and more growth space for benthic biota. The river chlorophyll a also increased with discharge downstream, that is, the pelagic biota (phytoplankton) also increased which might also help explain the increase of biota uptake (Vf-amb) downstream. Measurements of seasonal variation of biota were needed for further validation of our hypothesis.
As a result, we measured both seasonal and spatial uptake to capture the uptake geometry, which is different from the traditional assumption in numerical simulations. Our study emphasized the coupling relationship between hydrological and biological factors affecting uptake metrics and compared the differences between seasonal and spatial uptake factors, which could help improve the traditional assumptions of nitrogen uptake scaling in water quality models.
5 Conclusion
This study aimed to understand the impacts of seasonal and spatial scales on nutrient uptake efficiency. Nutrient addition experiments were conducted: six experiments at one upstream site throughout the year and eight experiments across the river network. The seasonality in our experiment is obvious. The nutrient uptake coefficient reached the highest value at the end of the growth season in September and decreased gradually afterwards. At our experimental site SCY, the correlation between the uptake metrics and the environmental concentration C0 is stronger on the seasonal scale.
The correlation between uptake metrics and discharge was different at the seasonal scale and the spatial scale. The measured uptake length (Sw-amb) was correlated with discharge at the seasonal scale but not at the spatial scale; while Uamb, Vf-amb were more correlated with discharge at the spatial scale with stream size. The uptake metrics that increase with Q at the spatial scale may be attributed to the positive correlation of DOC and river chlorophyll a, related to hydraulic geometry for the number of biological activities in the wet perimeter of different river channels. Generally speaking, as the Q increases downstream, the wider the river, the longer the wet perimeter, and the larger the area for biofilm and benthic biota growth, thus, the stronger the uptake capacity. In addition, Km was positively correlated with C0 at the spatial scale, indicating a faster response to the saturation of elevated C0 in different river reaches.
Our research tested the characteristics of uptake efficiency in time and space concurrently, emphasized the coupling relationship between hydrological and biological factors affecting uptake metrics, and compared the differences between seasonal and spatial uptake factors. The divergence between the measured uptake metrics and the ones fitted from regression indicated the necessity to update the traditional assumptions in the simulation of water quality models. More seasonal experiments at all the other streams are needed to fully compare the spatial and seasonal patterns in our study watershed. Based on the measured relationship across the river network, numerical simulation could be implemented to reconstruct a nutrient uptake map across the watershed. This study expanded the assumption of influences for uptake capacity in previous studies, that is, the different emphasis of discharge and environmental concentration on the impact of spatial and temporal uptake scales. We also found that the proportion of agricultural land has a positive correlation with the concentration of nutrient elements in the river, which indirectly affects the solute content of the river environment, and thus leads to different uptake capacities. Therefore, revitalizing land use type and hydraulic geometry can be suggested as effective means to improve uptake capacity for the river ecological environment.
Data availability statement
The original contributions presented in the study are included in the article/Supplementary Material, further inquiries can be directed to the corresponding author.
Author contributions
QR and SY conceptualized the original idea and designed the work. JP, JL, and TY contributed to the data collection and preparation. JP also conducted the data analysis. QR, JP, and SY wrote the paper. All authors contributed to the article and approved the submitted version.
Funding
This research has been funded by the National Key Research and Development Program of China (grant no. 2019YFC1510701-01) and the National Natural Science Foundation of China (grant no. 51979243).
Acknowledgments
The Xiaogang Hydrometric Station and Songyang County Water Conservancy Bureau are thanked for permission to conduct our field experiments and release the data.
Conflict of interest
The authors declare that the research was conducted in the absence of any commercial or financial relationships that could be construed as a potential conflict of interest.
Publisher’s note
All claims expressed in this article are solely those of the authors and do not necessarily represent those of their affiliated organizations, or those of the publisher, the editors and the reviewers. Any product that may be evaluated in this article, or claim that may be made by its manufacturer, is not guaranteed or endorsed by the publisher.
Supplementary material
The Supplementary Material for this article can be found online at: https://www.frontiersin.org/articles/10.3389/feart.2023.1193824/full#supplementary-material
References
Alexander, R. B., Boyer, E. W., Smith, R. A., Schwarz, G. E., and Moore, R. B. (2007). The role of headwater streams in downstream water quality. J. Am. Water Resour. Assoc. 43 (1), 41–59. doi:10.1111/j.1752-1688.2007.00005.x
Arango, C. P., Tank, J. L., Johnson, L. T., Hamilton, S. K., and Kellogg, W. K. (2008). Assimilatory uptake rather than nitrification and denitrification determines nitrogen removal patterns in streams of varying land use. Limnol. Oceanogr. 53 (6), 2558–2572. doi:10.4319/lo.2008.53.6.2558
Ball, R. C., and Hooper, F. F. (1963). “Translocation of phosphorus in a trout stream ecosystem,” in Radioecology. Editors V. Schultz, and A. W. Klement (New York, NY, USA: Reinhold hbl. Cop.), 217–228.
Benke, A. C., and Wallace, J. B. (1980). Trophic basis of production among net-spinning caddisflies in a southern Appalachian stream. Ecology 61, 108–118. doi:10.2307/1937161
Billen, G., Lancelot, C., and Meybeck, M. (1991). “N, P and Si retention along the aquatic continuum from land to ocean,” in Ocean margin processes in global change. Editors R. F. C. Mantoura, J. M. Martin, and R. Wollast (Hoboken, NJ, USA: John Wiley), 19–44.
Bormann, F. H., and Likens, G. E. (1979). Pattern and process in a forested ecosystem. New York, NY, USA: Springer-Verlag, 253.
Bouwman, A. F., Van Drecht, G., Knoop, J. M., Beusen, A. H., and Meinardi, C. R. (2005). Exploring changes in river nitrogen export to the world’s oceans. Glob. Biogeochem. Cycles 19, GB1002. doi:10.1029/2004GB002314
Covino, T. P., McGlynn, B. L., and Baker, M. A. (2010a). Separating physical and biological nutrient retention and quantifying uptake kinetics from ambient to saturation in successive mountain stream reaches. J. Geophys.Res. 115, G04010. doi:10.1029/2009JG001263
Covino, T. P., McGlynn, B. L., and McNamara, R. A. (2012). Land use/land cover and scale influences on in-stream nitrogen uptake kinetics. J. Geophys Res. 117, 1–13. doi:10.1029/2011JG001874
Covino, T. P., McGlynn, B. L., and McNamara, R. A. (2010b). Tracer additions for spiraling curve characterization (TASCC): quantifying stream nutrient uptake kinetics from ambient to saturation. Limnol. Oceanogr.Methods 8, 484–498. doi:10.4319/lom.2010.8.484
Earl, S. R., Valett, H. M., and Webster, J. R. (2006). Nitrogen saturation in stream ecosystems. Ecology 87 (12), 3140–3151. doi:10.1890/0012-9658(2006)87[3140:NSISE]2.0.CO;2
Elser, J. J., Bracken, M. E. S., Cleland, E. E., Gruner, D. S., Harpole, W. S., Hillebrand, H., et al. (2007). Global analysis of nitrogen and phosphorus limitation of primary producers in freshwater, marine and terrestrial ecosystems. Ecol. Lett. 10, 1135–1142. doi:10.1111/j.1461-0248.2007.01113.x
Ensign, S. H., and Doyle, M. W. (2006). Nutrient spiraling in streams and river networks. J. Geophys. Res. Biogeosciences 111, 1–13. doi:10.1029/2005JG000114
Gardner, K. K., McGlynn, B. L., and Marshall, L. A. (2011). Quantifying watershed sensitivity to spatially variable N loading and the relative importance of watershed N retention mechanisms. Water Resour. Res. 47, W08524. doi:10.1029/2010WR009738
Grimm, N. B., and Fisher, S. G. (1986). Nitrogen limitation in a Sonoran desert stream. J. N. Am. Benthol. Soc. 5 (1), 2–15. doi:10.2307/1467743
Grimm, N. B. (1987). Nitrogen dynamics during succession in a desert stream. Ecology 68, 1157–1170. doi:10.2307/1939200
Hall, R. O., Baker, M. A., Arp, C. D., and Koch, B. J. (2009a). Hydrologic control of nitrogen removal, storage, and export in a mountain stream. Limnol. Oceanogr. 54, 2128–2142. doi:10.4319/lo.2009.54.6.2128
Hall, R. O., Baker, M. A., Rosi-Marshall, E. J., Tank, J. L., and Newbold, J. D. (2013). Solute specific scaling of inorganic nitrogen and phosphorus uptake in streams. Biogeosciences 10, 7323–7331. doi:10.5194/bg-10-7323-2013
Hall, R. O., and Tank, J. L. (2003). Ecosystem metabolism controls nitrogen uptake in streams in Grand Teton National Park, Wyoming. Limnol. Oceanogr. 48, 1120–1128. doi:10.4319/lo.2003.48.3.1120
Hall, R. O., Tank, J. L., Sobota, D. J., Mulholland, P. J., O'Brien, J. M., Dodds, W. K., et al. (2009b). Nitrate removal in stream ecosystems measured by total uptake 15 N addition experiments: total uptake. Limnol. Oceanogr. 3, 653–665. doi:10.4319/lo.2009.54.3.0653
Hart, B. T., Freeman, P., and McKelvie, I. D. (1992). Whole-stream phosphorus release studies: variation in uptake length with initial phosphorus concentration. Hydrobiologia 235-236, 573–584. doi:10.1007/BF00026245
Hoellein, T. J., Tank, J. L., Rosi-Marshall, E. J., Entrekin, S. A., and Lamberti, G. A. (2007). Controls on spatial and temporal variation of nutrient uptake in three Michigan headwater streams. Limnol. Oceanogr. 52, 1964–1977. doi:10.4319/lo.2007.52.5.1964
Li, R. Z., Fu, Y., Xu, D. Q., Wang, X. H., and Jin, G. Q. (2021). Assessing the potential and kinetics of coupled nutrients uptake in mesotrophic streams in Chaohu Lake Basin, China. Environ. Sci. Pollut. Res. Int. 44, 62877–62890. doi:10.1007/S11356-021-15214-5
Marti, E., and Sabater, F. (1996). High variability in temporal and spatial nutrient retention in mediterranean streams. Ecology 77, 854–869. doi:10.2307/2265506
Meyer, J. L., and Likens, G. E. (1979). Transport and transformation of phosphorus in a forest stream ecosystem. Ecology 60, 1255. doi:10.2307/1936971
Meyer, J. L. (1979). The role of sediments and bryophytes in phosphorus dynamics in a headwater stream ecosystem. Limnol. Oceanogr. 24 (2), 365–375. doi:10.4319/lo.1979.24.2.0365
Mulholland, P. J., Helton, A. M., Poole, G. C., Hall, R. O., Hamilton, S. K., Peterson, B. J., et al. (2008). Stream denitrification across biomes and its response to anthropogenic nitrate loading. Nature 452 (7184), 202–205. doi:10.1038/nature06686
Mulholland, P. J., Steinman, A. D., and Elwood, J. W. (1990). Measurement of phosphorus uptake length in streams: comparison of radiotracer and stable PO4 releases. Can. J. Fish. Aquatic Sci. 47 (12), 2351–2357. doi:10.1139/f90-261
Mulholland, P. J. (2004). The importance of in-stream uptake for regulating stream concentrations and outputs of N and P from a forested watershed: evidence from long-term chemistry records for walker branch watershed. Biogeochemistry 70 (3), 403–426. doi:10.1007/s10533-004-0364-y
Mulholland, P. J., and Webster, J. R. (2010). Nutrient dynamics in streams and the role of J-NABS. J. N. Am. Benthol. Soc. 29 (1), 100–117. doi:10.1899/08-035.1
Naiman, R. J., and Sedell, J. R. (1979). Characterization of particulate organic matter transported by some Cascade Mountain streams. J. Fish. Res. Board Can. 36, 17–31. doi:10.1139/f79-003
Newbold, J. D., Elwood, J. W., Oneill, R. V., and Winkle, W. V. (1981). Measuring nutrient spiralling in streams. Can. J. Fish. Aquatic Sci. 38 (7), 860–863. doi:10.1139/f81-114
Payn, R. A., Webster, J. R., Mulholland, P. J., Valett, H. M., and Dodds, W. K. (2005). Estimation of stream nutrient uptake from nutrient addition experiments. Limnol. Oceanogr. Methods 3, 174–182. doi:10.4319/lom.2005.3.174
Peterson, B. J., Wollheim, W. M., Mulholland, P. J., Webster, J. R., Meyer, J. L., Tank, J. L., et al. (2001). Control of nitrogen export from watersheds by headwater streams. Sci. (New York, N.Y.) 292 (5514), 86–90. doi:10.1126/science.1056874
Piper, L. R., Cross, W. F., and McGlynn, B. L. (2017). Colimitation and the coupling of N and P uptake kinetics in oligotrophic mountain streams. Biogeochemistry 132, 165–184. doi:10.1007/s10533-017-0294-0
Reisinger, A. J., Tank, J. L., Rosi-Marshall, E. J., Hall, R. O., and Baker, M. A. (2015). The varying role of water column nutrient uptake along river continua in contrasting landscapes. Biogeochem. 125 (1), 115–131. doi:10.1007/s10533-015-0118-z
Saunders, T. J., Mcclain, M. E., and Llerena, C. A. (2006). The biogeochemistry of dissolved nitrogen, phosphorus, and organic carbon along terrestrial-aquatic flowpaths of a montane headwater catchment in the peruvian amazon. Hydrol. Process. 20 (12), 2549–2562. doi:10.1002/hyp.6215
Seitzinger, S. P., Harrison, J. A., Dumont, E., Beusen, A. H. W., and Bouwman, A. F. (2005). Sources and delivery of carbon, nitrogen, and phosphorus to the coastal zone: an overview of global nutrient export from watersheds (NEWS) models and their application. Glob. Biogeochem. Cycles 19, GB4S01. doi:10.1029/2005GB002606
Seitzinger, S. P., Styles, R. V., Boyer, E. W., Alexander, R. B., Billen, G., Horwth, R. W., et al. (2002). Nitrogen retention in rivers: model development and application to water sheds in the north eastern USA. Biogeochemistry 57 (1), 199–237. doi:10.1023/a:1015745629794
Seybold, E., and McGlynn, B. (2018). Hydrologic and biogeochemical drivers of dissolved organic carbon and nitrate uptake in a headwater stream network. Biogeochemistry 1, 23–48. doi:10.1007/s10533-018-0426-1
Short, R. A., and Maslin, P. E. (1977). Processing of leaf litter by a stream detritivore: effect on nutrient availability to collectors. Ecology 58, 935–938. doi:10.2307/1936231
Simon, K. S., Townsend, C. R., Biggs, B. J. F., and Bowden, W. B. (2005). Temporal variation of N and P uptake in 2 New Zealand streams. J. North Am. Benthol. Soc. 24 (1), 1–18. doi:10.1899/0887-3593(2005)024<0001:TVONAP>2.0.CO;2
Sinsabaugh, R. L., Turner, B. L., Talbot, J. M., Waring, B. G., Powers, J. S., Kuske, C. R., et al. (2016). Stoichiometry of microbial carbon use efficiency in soils. Ecol. Monogr. 86, 172–189. doi:10.1890/15-2110.1
Smil, V. (2000). Phosphorus in the environment: natural flows and human interferences. Annu. Rev. Energy Environ. 23, 53–88. doi:10.1146/annurev.energy.25.1.53
Sterner, R. W., and Elser, J. J. (2002). Ecological stoichiometry: The biology of elements from molecules to the biosphere. Princeton, New Jersey, United States: Princeton University Press.
Stream Solute Workshop (1990). Concepts and methods for assessing solute dynamics in stream ecosystems. J. North Am. Benthol. Soc. 9, 95–119. doi:10.2307/1467445
Tank, J. L., Rosi-Marshall, E. J., Baker, M. A., and Hall, R. O. (2008). Are rivers just big streams? A pulse method to quantify nitrogen demand in a large river. Ecology 89 (10), 2935–2945. doi:10.1890/07-1315.1
Taylor, P., and Townsend, A. (2010). Stoichiometric control of organic carbon–nitrate relationships from soils to the sea. Nature 464, 1178–1181. doi:10.1038/nature08985
Vitousek, P. M., Aber, J. D., Howarth, R. W., Likens, G. E., Matson, P. A., Schindler, D. W., et al. (1997). Human alteration of the global nitrogen cycle: sources and consequences. Ecol. Appl. 7, 737–750. doi:10.1890/1051-0761(1997)007[0737:haotgn]2.0.co;2
Vitousek, P. M., and Howarth, R. W. (1991). Nitrogen limitation on land and in the sea: how can it occur? Biogeochemistry 13, 87–115. doi:10.1007/BF00002772
Wallace, J. B., Webster, J. R., and Woodall, W. R. (1977). The role of filter feeders in flowing waters. Arch. Hydrobiol. 79, 506–532.
Webster, J. R., Mulholland, P. J., Tank, J. L., Valett, H. M., Dodds, W. K., Peterson, B. J., et al. (2003). Factors affecting ammonium uptake in streams–an inter-biome perspective. Freshw. Biol. 48 (8), 1329–1352. doi:10.1046/j.1365-2427.2003.01094.x
Webster, J. R. (1975). Analysis of potassium and calcium dynamics in stream ecosystems on three southern Appalachian watersheds of contrasting vegetation. Doctoral dissertation. Athens. GA, USA: University Of Georgia, 232.
Webster, J. R., and Patten, B. C. (1979). Effects of watershed perturbation on stream potassium and calcium dynamics. Ecol. Monogr. 49, 51–72. doi:10.2307/1942572
Keywords: nutrients uptake, TASCC method, seasonal and spatial variation, hilly watershed, correlation analysis
Citation: Ye S, Pan J, Li J, Yu T and Ran Q (2023) The seasonal and spatial variability of ammonium uptake in a hilly watershed. Front. Earth Sci. 11:1193824. doi: 10.3389/feart.2023.1193824
Received: 25 March 2023; Accepted: 04 September 2023;
Published: 21 September 2023.
Edited by:
Tianshou Ma, Southwest Petroleum University, ChinaReviewed by:
Paramate Horkaew, Suranaree University of Technology, ThailandRuzhong Li, Hefei University of Technology, China
Natalie Griffiths, Oak Ridge National Laboratory (DOE), United States
Copyright © 2023 Ye, Pan, Li, Yu and Ran. This is an open-access article distributed under the terms of the Creative Commons Attribution License (CC BY). The use, distribution or reproduction in other forums is permitted, provided the original author(s) and the copyright owner(s) are credited and that the original publication in this journal is cited, in accordance with accepted academic practice. No use, distribution or reproduction is permitted which does not comply with these terms.
*Correspondence: Qihua Ran, cmFucWlodWFAaGh1LmVkdS5jbg==
†Present address: Jiajia Pan, Zhejiang Design Institute of Water Conservancy and Hydroelectric Power Co., Ltd., Hangzhou, Zhejiang, China