 Lixin Zhang
 Guangchao Liu1
- 1Collage of Mining, Liaoning Technical University, Fuxin, China
- 2School of Mechanics and Engineering, Liaoning Technical University, Fuxin, China
Accidents occur frequently in underground chambers owing to the high-stress environment, poor stability of rocks, and unreasonable mining and construction layout. Significant damage to the deep surrounding rock mass by confined water can result in water inrush and flooding accidents. This study numerically investigated the mechanical properties and acoustic emission (AE) signal evolution mechanism of water-bearing sandstone in deep high-stress mining environments. The results showed that, the lower the confining pressure, the lower is the compressive strength of the specimen, resulting in evident failure. The confining pressure inhibited the radial strain and enhanced the strength of the specimen. Furthermore, under the same confining pressure and different water pressure, the higher the water pressure value, the more evident was the failure phenomenon, and the lower was the peak stress. The water pressure decreased the strength of the specimen and its ability to resist damage. Moreover, for the same water pressure, the smaller the confining pressure, the larger was the maximum AE number and the total cumulative amount of acoustic emissions. When the specimen reached the peak stress and produced macroscopic failure, the AE number reached the maximum value. Finally, the AE activity decreased as the water pressure increased, and the higher the water pressure, the smaller was the cumulative AE number. Owing to the existence of water pressure, the internal structure of the model specimen was affected by the softening effect, which decreased the model strength, thereby suppressing the AE activity of the specimen. Our findings can provide a basis for numerical simulation research on mechanical properties and AE evolution mechanism of water-bearing sandstone under three-way stress state.
1 Introduction
As science and technology in China’s coal mine development advances, the deep well development in the country also increases, resulting in an increase in the number of underground chambers built in each deep shaft. Major accidents occur frequently in underground chambers owing to high-stress environments, poor stability of surrounding rocks, and unreasonable layout of mining construction sites, which can endanger the life of workers as well as cause property loss. Therefore, it is necessary to conduct in-depth study on the mechanical characteristics of water-bearing rocks affected by multiple factors as well as the mechanical mechanism reflected by acoustic signals, which have important practical significance and engineering value for monitoring and predicting the occurrence of disasters (Shoufeng et al., 2010; Liu et al., 2012; Shan et al., 2014; Ding et al., 2023a).
As a complex geological structure, there is certain amounts of moisture inside the rock mass. This moisture erodes the internal structure of the rock, which deteriorates the mechanical properties of the rock such as elastic modulus and compressive strength and enhances the plastic deformation. Therefore, studies have been conducted on the mechanical properties of aqueous rocks. Bao et al. (2020) studied the mechanical properties of fine sandstone, mudstone, coal, and medium sandstone in different aqueous states through conventional mechanical experiments. The results showed that the tensile strength of each group of specimens decreased significantly as the moisture content increased. Furthermore, the tensile strength of fine sandstone, mudstone, coal, and medium sandstone decreased in the saturated state of water. Qiao et al. (2017) studied the mechanical effect of water-rock chemistry on the deformation and failure of rock mass. The research status of this mechanism of action is systematically summarized. Zilong et al. (2016) used FLAC3D numerical simulation software to conduct numerical simulation tests under unidirectional stress loading conditions. Furthermore, they compared the numerical analysis results with the test data under uniaxial compression test conditions to investigate the influence of water on rock damage. Chen et al. (2022) focused on the erosion of rocks around chemical elements and conducted a three-axis compression test with ash sandstone. The result showed that the different erosion effects impacted the mechanical properties of ash sandstone. Gui and Lin (2016) analysed the high -pressure underwater bottom plate prominent mechanism and prevention, as well as the control technology, prominent mechanism, and prevention technique of abandoned mines while developing deep coal resources. Evaluated the impact of different moisture contents on the intensity of gypsum ore pillars. The larger the moisture content of the plaster test piece from a single -axis test result, the smaller was the single -axis compressive strength and elastic modulus. Ma et al. (2021), Liu et al. (2018) set up argillaceous siltstone specimens with different moisture content to study the influence of moisture content on the strength of argillaceous siltstone. The results preliminarily analysed the influence of moisture content on the mechanical properties of argillaceous siltstone. Lin et al. (2022) studied the effect of different moisture content on the mechanical properties and creep behaviour of rocks by taking argillaceous siltstone. In recent years, several studies have been conducted on the acoustic signal and induced charge monitoring technology of this technology. Chuanming et al. (2020) elaborated the application prospect of acoustic emission technology in geotechnical engineering and evaluated its application effect in geotechnical research. Several results on the use of acoustic emission techniques in scientific research such as seismic sequences and rupture mechanisms were achieved. Ding et al. (2023b) discussed the effects of stress degree and load loading time on the acoustic emission activity of rock specimens to study the factors that affect the acoustic emission activity of rock specimens. Serdyukov et al. (2022) used the particle flow software PFC2D to study the evolution law of acoustic emission signals on non-uniform granite rock samples. The results showed that the peak intensity of granite sample failure increased as the confining pressure increased. The form of destruction gradually changed from sudden instability to progressive destruction. Li et al. (2018) studied the evolution mechanism of limestone acoustic emission and the mechanical properties of limestone under three-way stress. Triaxial compression test was conducted on limestone specimens. Based on the experimental results, the mechanical properties and acoustic emission signal evolution of limestone under triaxial compression conditions were summarized. Wang et al. (2022) designed a research experiment on the evolution of rock acoustic emission under periodic loading with fine-grained sandstone. Kong et al. (2017) conducted uniaxial compression experiments to study the influence of temperature changes on the acoustic emission activity and mechanical properties of sandstone. The results showed that different temperatures played a significant role in the increase of the acoustic emission frequency of rocks. (Moradian et al., 2016; Lai et al., 2022; Gu et al., 2023; Li et al., 2023). studied the relationship between the acoustic emission mechanism of rock and the evolution of cracks by conducting acoustic emission experiments using brittle rocks.
The monitoring equipment developed according to the relevant technical and theoretical research institutes has been widely used in coal rock dynamic disaster monitoring and early warning system; however, only a few studies have been conducted on the acoustic emission characteristics of water-bearing rocks under three-way stress-loading conditions, the mechanical properties of water-bearing rocks, and the shortcomings of numerical simulation technology. In this study, RFPA2D-Flow was used to simulate the models with different moisture cuts, observe the distribution of acoustic signals after the model was deformed and damaged, and analyse the influence of rocks with different moisture content on the distribution of acoustic signals under the same loading conditions. Then, the model with the same moisture content was simulated with different confining pressure values, and the acoustic signal distribution was simultaneously measured. Furthermore, the acoustic emission signal distribution law of water-bearing rocks under different confining pressure conditions was analysed.
2 Expected results, numerical modelling and parameters
Considering at the engineering problems of large deformation, the instability of the surrounding rocks of many underground engineering chambers, and the unclear monitoring of the precursor information of the surrounding rock catastrophe, this study investigated the triaxial mechanical properties and failure characteristics of water-bearing rocks, while taking the mechanical response and acoustic signal of rocks with different moisture content under confining compression conditions as the starting point and focusing on the two influencing factors of confining pressure and moisture content. Furthermore, the physical signal response of the instability process was obtained by combining acoustic emission signal monitoring technology to explore the rock failure characteristics affected by moisture content and confining pressure. Finally, the precursor information identification of its destruction process was obtained, and the research proceeded as follows:
(1) study on triaxial mechanical properties of water-bearing sandstone;
(2) study on the evolution of acoustic signals of sandstone samples with different moisture cuts; and
(3) study on the evolution law of acoustic signal of sandstone specimens with moisture content under different confining pressure
This numerical simulation uses RFPA2D-Flow as the platform for stress-seepage coupling numerical simulation and evaluates the influence of different moisture contents and confining pressure values on the mechanical properties and acoustic-charge signal of rocks under three-way stress by discretizing the model into units whose mechanical properties follow the Mohr–Coulomb distribution, which is Mainly based on finite element method for calculation. The RFPA2D-Flow analysis system applies the elastic finite element method to calculate the stress and displacement of the element. If the mechanical properties such as elastic modulus, Poisson’s ratio, and tensile strength of the numerical simulation object material meet the specific elastic damage constitutive relationship, and the damage critical value of the constitutive relationship meets the Mohr–Coulomb criterion and the maximum tensile stress criterion, the damage failure of the unit will occur when the stress (strain) of the element reaches the damage critical value. Considering the defects inside the rock mass are randomly distributed and independent of each other, it is assumed in RFPA that the mechanical properties of the discretized mesoprimitives follow the statistical distribution law (as shown in Weibull distribution, Eq. 1), as a result, the relationship between the mechanical properties of macroscopic media and mesoscope is established (Tang, 1997).
The mechanical properties and permeability characteristics of the rock mass are affected by the large number of natural pores, cracks, and other defective structures in the rock mass. During instability failure, the degree of crack distribution inside and on the surface of rock mass expands, resulting in the formation, expansion, and penetration of new cracks. The permeability of the rock before the failure is extremely low (almost impermeable), and the coupling effect of seepage stress is not evident. Furthermore, under the influence of water pressure and stress, the degree of damage changes, migration of stress field, seepage field, and damage evolution process affects the instability process of rock mass.
Porosity is an important physical property indicator for measuring the quality of rock engineering. The porosity of a rock reflects the percentage of pores and cracks in the rock; the greater the porosity, the greater is the number of cracks in the rock and the impact on the mechanical properties of the rock mass. The porosity in rock is usually denoted by n. Sandstone was selected as the simulation object in this study, considering the porosity description of sandstone is roughly the same as that of the soil mass, according to the porous medium.
where n is the porosity of the rock, Vp is the volume occupied by pores and fissures in the rock, and V is the total volume of rock. The water in the rock mass can only penetrate along the connecting pores and cracks. Furthermore, the permeability in a rock can be measured by the permeability coefficient, which is mainly determined by the size, direction, and interconnection of the rock pores.
Where k is the seepage rate of porous medium, d is the effective particle size of geotechnical particles, and c is the proportionality constant.
When the stress or strain states of the element meets a given damage threshold, the elastic modulus of the damaged element is expressed as follows:
where E and E0 are the elastic modulus of the damaged and non-destructive units, respectively, and D is the damage variable.
For elements in uniaxial compression-loaded form, the failure criterion for this element adopts the Mohr–Coulomb criterion given as
where is internal friction angle and
where
The numerical model adopts a two-dimensional thin flat plate strain model, divided into 100×100 elements. The model size is 100 mm×100 mm and the axial load P1 is applied to the upper boundary of the model. P1 is loaded in the form of controlled displacement, and the displacement increment is ΔS=0.005 mm. A confining load P2 is applied to the model side boundary. P2 is constantly loaded in the form of stress, and four sets of confining pressure values, 2 MPa, 4 MPa, 6 MPa, and 8 MPa, are designed. The seepage boundary load P3 is set at the upper boundary of the model, and the water pressure is set to 0.5 MPa, 1 MPa, 2 MPa, and 4 MPa. The numerical model is shown in Figure 1.
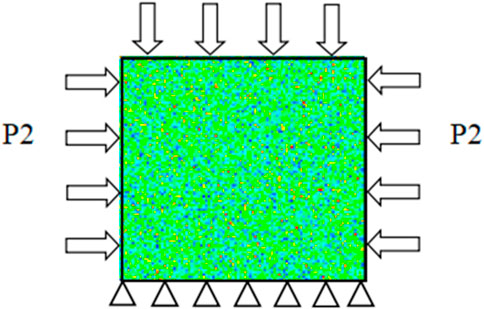
FIGURE 1. Model loading diagram.
2.1 Parameter selection
To study the mechanical properties of rocks with different moisture cuts, this numerical simulation uses the method of applying different water pressures to the model boundary to increase the water content of rock mass to simulate different moisture content conditions. The seepage parameters (such as porosity, coupling coefficient, etc.) that conform to the mechanical properties of sandstone are set for the discrete unit to simulate the water content of sandstone in a real environment.
The mechanical parameters required for each numerical model element, such as elastic modulus and Poisson’s ratio, are assigned according to the Mohr–Coulomb distribution. Herein, m is the homogeneity coefficient, which is used to indicate the uniformity of the sample, considering the special structure of the sandstone of the simulated object. The homogeneity coefficient is selected as 3 for numerical simulation. Table 1 summarizes the hydraulic parameters of this numerical simulation.
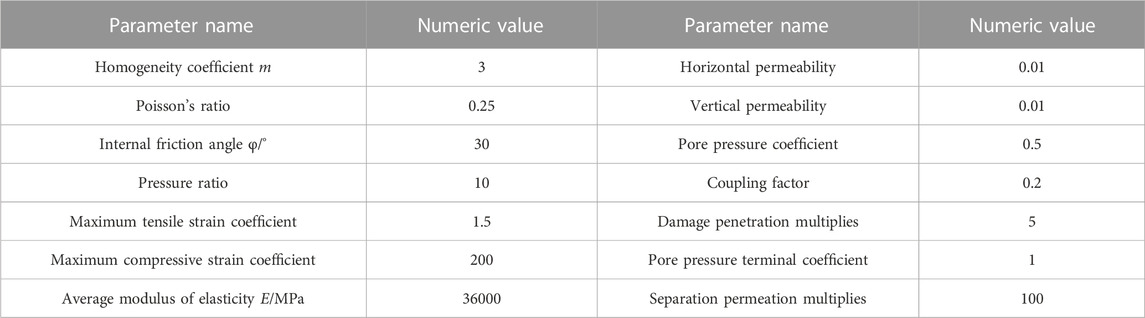
TABLE 1. Hydraulics parameters.
In this study, PFPA2D-Flow was used to numerically simulate the mechanical properties and the evolution of acoustic signals under three-way pressure of rocks with different moisture cuts. The specific embodiments are as follows:
(1) Set the number of elements of the model and the model size. The model is shown in Figure 2. The lower left corner of the model is the positive coordinate axis, and the horizontal and longitudinal axes are the positive X- and Y-axes, respectively.
(2) Set the mechanical parameters of the model and inflow coefficient.
(3) Perform the static load on the model. The application method is the axial compression and peripheral compression, and the formation form is a constant loading. The effect of the load is shown in Figures 3, 4.
(4) The seepage boundary load is applied to the model and the application form is head loading. The initial value is set according to different water pressure sizes.
(5) Set the solution control information. The total loading step is 50 steps, the model calculation type is conventional data solving, the plane simplification model is the plane stress model, and the solution problem type is fluid-structure interaction.
(6) Start solving and observe the changes in the stress distribution of the model.
(7) Stop solving after the model shape fails and the stress value no longer changes. The data in the simulation process is output and a curve is formed.
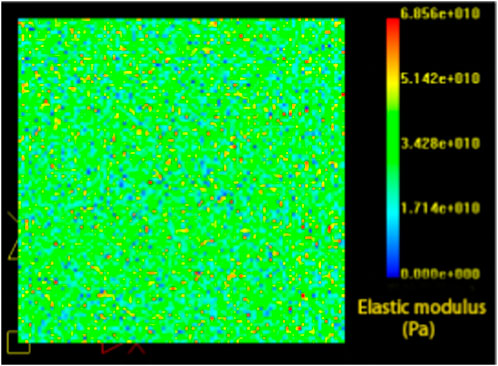
FIGURE 2. Model design.
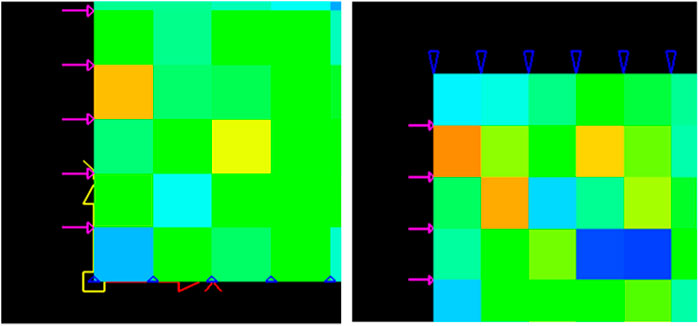
FIGURE 3. Applying loading on the model.

FIGURE 4. Stress–strain curves of model specimens under triaxial stress.
3 Mechanical properties of water-bearing sandstone
3.1 Failure characteristics of water-bearing sandstone under triaxial conditions
Owing to the internal structural defects and the existence of pore fractures, the mechanical properties of rocks are more complicated; as a result, the existence of water further complicates the mechanical properties of rocks. We evaluated the failure process diagram and stress–strain curve of the model specimen under the influence of different confining pressure and water pressure values by performing triaxial compression simulation tests on the water-bearing rock simulation specimens. Then, the failure characteristics and stress–strain characteristics of the water-bearing sandstone in the three-way stress state were analysed.
As shown in Figures 4, 5, the stress–strain curve of the model specimen showed evident phased changes as the loading steps increased, and different stages correspond to the increase in stress. The acoustic emission number (AE number) of the model specimen was small at the beginning of loading, increased significantly after 30 steps, and peaked at 32 steps before decreasing. After 40 steps, almost silent emission activity occurs. As the AE number accumulation increases, the curve shows an upward trend, reaching a maximum at 34 steps and flattening after 34 steps.
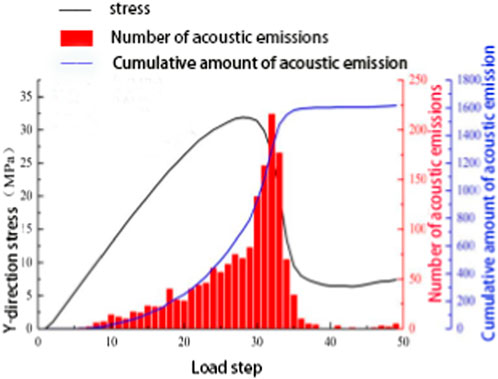
FIGURE 5. Stress–acoustic emission number curve of model specimen under triaxial stress.
As shown in Figure 6, the loading process of the model specimen exhibited an evident crack as the loading step gradually increased. In the early stages of loading, a failure point appeared inside the model specimen between steps 15 to 17. The failure points inside the model specimen from steps 23 to 27 gradually increased, and the stress distribution of the internal elements of the model specimen changed significantly. Cracks began to appear inside the model specimen at steps 28 to 31, it has been widely expanded inside the model.
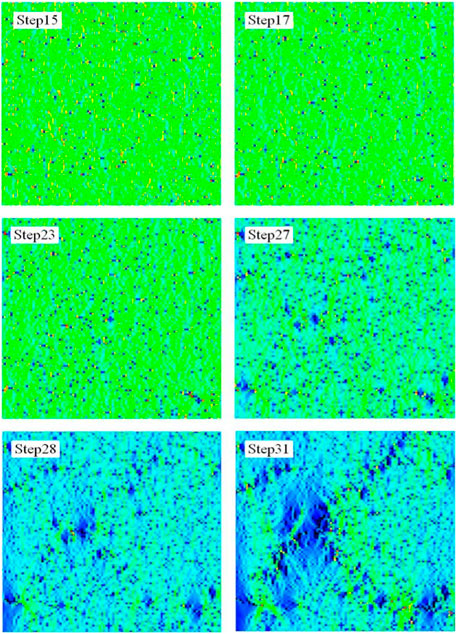
FIGURE 6. Failure process diagram of triaxial loading model specimen.
As shown in Figure 7, the acoustic emission degree of the model specimen at different loading stages exhibited a significantly different distribution. At steps 15 to 17, random and irregular acoustic emission signals appeared inside the model specimen. Most of the acoustic emission signals were in the form of compression and shear failure (white circle in the figure), accompanied by a small amount of pull failure signal (red signal in the figure). From steps 23 to 27, the acoustic emission signal inside the model specimen increased significantly compared to steps 15 and 17, and the distribution showed randomness. From steps 28 to 31, the acoustic emission signal of the model specimen concentrated at the crack generation and crack growth surface, whereas the pressure failure signal was concentrated on the crack growth surface.
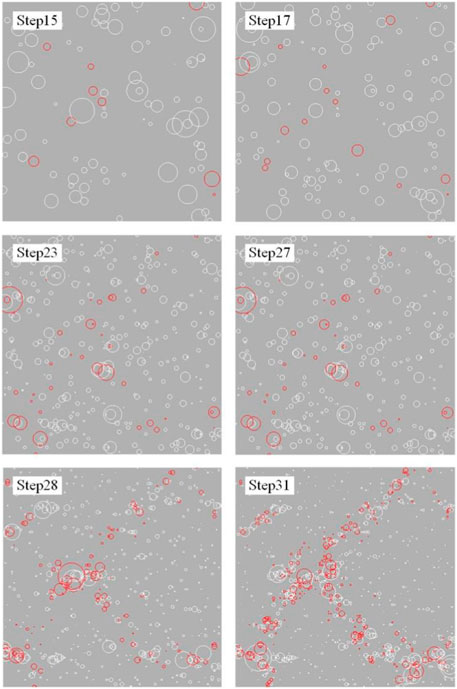
FIGURE 7. AE process diagram of triaxial loading model specimen.
The entire stress–strain process of the model specimen can be divided into: linear deformation stage, nonlinear deformation stage, and softening stage, as shown in Figures 5–7.
(1) Linear deformation stage (steps 1–22): Affected by mechanical properties such as rock non-uniformity, anisotropy, etc., a small number of failure points appear in the initial loading stage of the model specimen, and the principal stress distribution is random and scattered. The stress–strain behaviour of the model specimen is characterized linearly.
(2) Nonlinear deformation stage (step 23–27): As the load increases, the failure points inside the model gradually increases. Cracks begin to develop at the bottom of the model, near the boundary, and in the middle. A large number of acoustic emission signals in the form of shear damage are generated where the crack is formed. In the nonlinear deformation stage, the stress–strain curve of the model specimen has nonlinear characteristics and the Y stress peaks at 27 steps.
(3) Softening stage (steps 28–50): In the softening stage, the crack further begins to expand, the overall trend is upward, and a large number of shear-damaging acoustic emission signals are generated at the crack. After 35 steps, the crack penetrates the entire model specimen. Some of the cracks have bifurcation and stress concentration on the crack surface. After the peak stress in the Y-direction, the stress gradually decreases as the loading steps increases and the strength of the specimen decreases.
3.2 Mechanical properties of water-bearing sandstone affected by different confining pressures
Figure 8 shows that the maximum principal stress of the model under the condition of 8 MPa confining pressure value is higher than that of the model under the confinement pressure condition of 6 MPa, 4 MPa, and 2 MPa at 35 loading steps, and the lower the confining pressure value, the lower is the corresponding maximum principal stress. At 35 steps, evident cracks appeared in four groups of models with different confining pressure values, among which the 8 MPa model had failure points and micro-cracks at the bottom, and the 6 MPa confinement pressure model had evident cracks and that can penetrate the model. The crack of the 6 MPa model has a greater degree of expansion than the 8 MPa model, and stress concentration occurs in the middle of the crack. The crack development degree of the 4 MPa confining model was expanded further, and the bifurcation phenomenon occurred in the propagation direction of the main crack, and the trend of multiple cracks began to emerge. The model under 2 MPa confining pressure has multiple cracks on the basis of the main crack and runs through the entire model, and the failure phenomenon appears in the lower right corner of the model specimen.
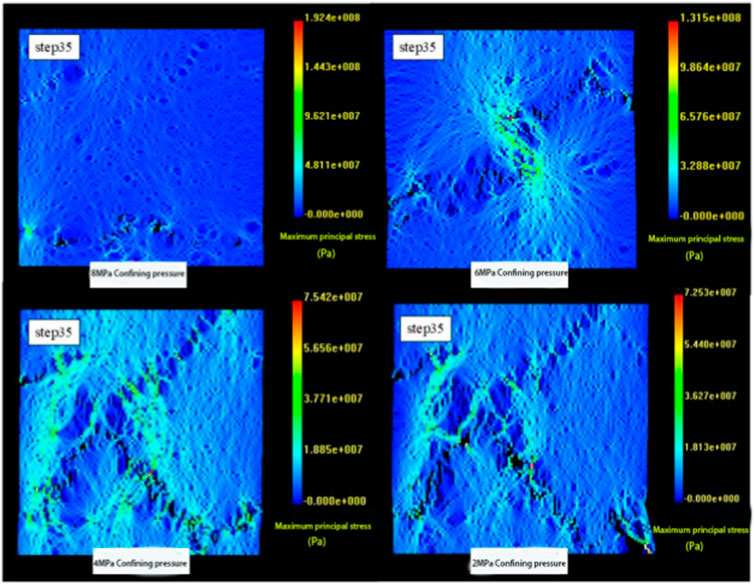
FIGURE 8. Stress distribution at loading step 35 under 4 MPa water pressure.
Figures 1–3 indicates that the presence of confining pressure under the same water pressure conditions affects the compressive strength of the model, and the larger the confining pressure value, the greater is the compressive strength of the model, thereby decreasing the chances of failure. When the water pressure is fixed, the increase in confining pressure presses the cracks inside the model, which limits the radial deformation of the model. Therefore, the stiffness of the model increases, which in turn strengthens the compressive strength of the model specimen.
Figure 9 shows that the peak stress under 8 MPa and 6 MPa confining pressure is 33.9 MPa and 33.4 MPa, respectively. The peak stress at 4 MPa and 2 MPa confining pressure is 31.9 MPa and 31.3 MPa, respectively. Four sets of model specimens with different confining pressure values under loading conditions had different peak intensities. The larger the confining pressure value, the greater is the stress peak considering the existence of confining pressure value inhibits the radial strain of the model. The higher the confining pressure value, the more evident is the compression closure phenomenon of the fracture in the model. As a result, the stiffness of the model is improved.
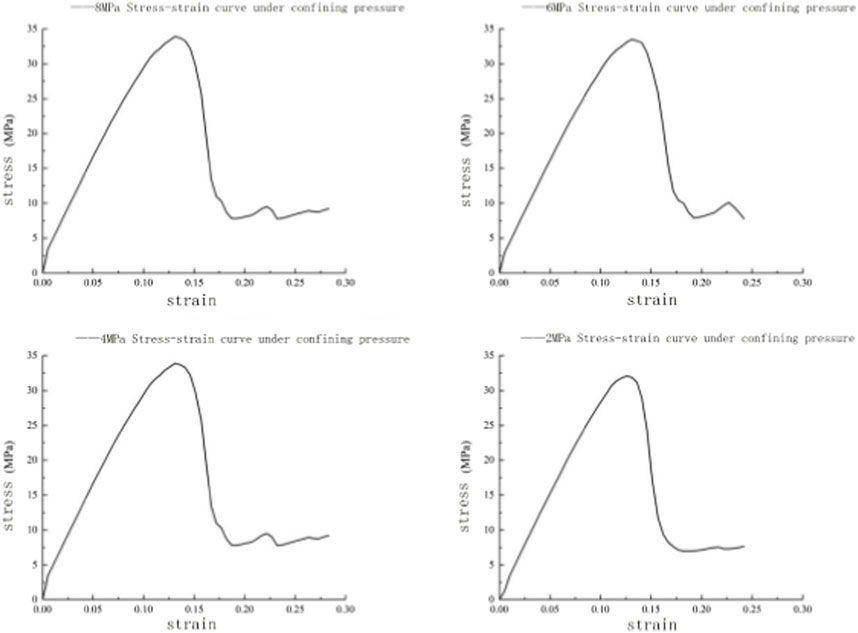
FIGURE 9. Stress–strain curves under different confining pressures at 4 MPa water pressure.
Simultaneously, that the residual stress under 8 MPa confining pressure condition is 9.2 MPa, which reduced to 27% of the peak stress. The residual strength under 6 MPa confining pressure condition is 7.8 MPa, which reduced to 23% of the residual stress. The residual strength is 7.6 MPa and 7.49 MPa when the confining pressure is 4 MPa and 2 MPa, respectively. Evidently, the larger the confining pressure value applied to the model, the higher is its residual strength, considering the model is constantly affected by confining pressure after a large number of cracks. The model elements re-contact at the fracture surface, and the stress concentration and stress redistribution phenomenon occur between the fracture surfaces. The higher the confining pressure value, the greater is the strength of the model after stress redistribution. Therefore, the stress–strain curve has an upward characteristic.
3.3 Mechanical properties of water-bearing sandstone affected by different moisture cuts
As shown in Figure 10, t the maximum principal stress of the model specimen at the 35th loading step under the condition of 0.5 MPa water pressure was higher than that of the other three groups. The larger the water pressure value, the smaller is the maximum principal stress value at 35 loading steps. A small number of cracks appeared at the bottom of the specimen under 0.5 MPa water pressure, which developed upward, and a large number of failure points appear in the middle of the model. The stress distribution around the failure point was more concentrated, resulting in crack germination. The specimen under 1 MPa water pressure exhibited a single crack in the upper left corner of the specimen, which expanded to the lower right corner, resulting in cracks penetrating the model. Furthermore, there is stress concentration around the crack. The model under 2 MPa water pressure exhibited a single crack in the upper right corner of the model developing towards the lower left corner, and the crack fracture surface interval was larger than that of the specimen under 1 MPa water pressure. The specimen under 4 MPa water pressure exhibited cracks penetrating the specimen; there were multiple cracks, and the failure phenomenon occurred in the lower right corner of the specimen.
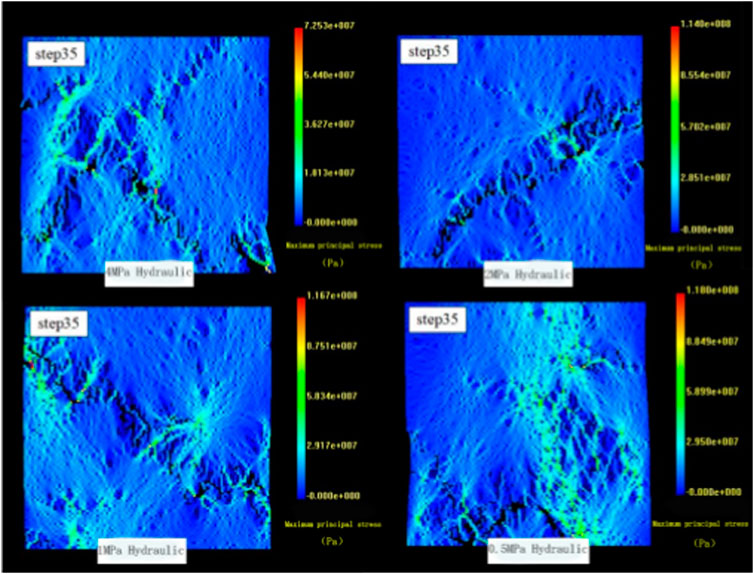
FIGURE 10. Stress distribution at loading step 35 under 2 MPa confining pressure and different water pressure.
Under the condition that the confining pressure value is constant, the different water pressure values applied to the model lead to different effects of moisture in the pore structure inside the rock on the rock strength. The larger the water pressure value, the more evident is the penetration softening effect of water on the rock. Therefore, the compressive strength of the rock decreases. The damage phenomenon of specimens with high water pressure value is more severe.
Figure 11 shows that the stress–strain curves of the model specimens are essentially the same in the linear and nonlinear deformation stages when the four groups of different water pressure values are different. The peak stress of the model at 0.5 MPa, 1 MPa, 3 MPa, and 2 MPa water pressures was 33.9 MPa, 33 MPa, 31.7 MPa, and 31.3 MPa, respectively. Therefore, the greater the water pressure value applied to the model specimen, the lower is the peak stress.
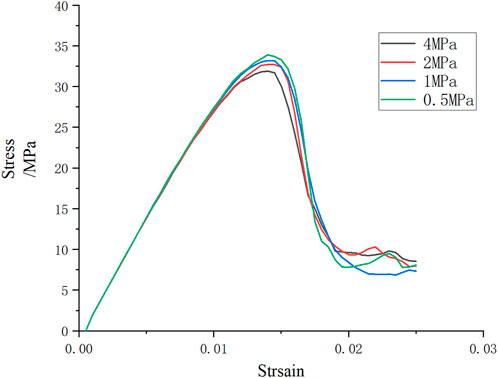
FIGURE 11. Stress–strain curves under different water pressure conditions at 2 MPa confining pressure.
The afore described phenomenon can be attributed to the fact that the action of pore water destroys the micropores and cracks in the model specimen, thereby consuming more energy. As the pore water pressure increases further, the cracks in the model specimen were further developed. The greater the water pressure, the more pronounced is the crack propagation (see Figure 10), which significantly reduces the compressive strength of the model specimen.
4 Acoustic signal evolution of water-bearing sandstone specimens under different confining and water pressures
4.1 Acoustic signal distribution of sandstone samples with moisture content affected by different confining pressures
There are many acoustic emission characterization parameters, and this numerical simulation selects the acoustic emission ringing count (CNT) and the acoustic emission cumulative ringing count to study the influence of different confining pressure values and moisture content on the evolution of acoustic emission signals in water-bearing sandstone. To explore the influence of different confining pressure values on the evolution mechanism of acoustic emission in water-bearing sandstone, the results of this numerical simulation on the law of acoustic emission signal and mechanical properties are as follows, and the simulation results are shown in the figure below.
In comparing Figures 12A, B, it was found that the stress in the linear deformation stage was linearly distributed as the loading step increased, and the AE number gradually increased. In the nonlinear deformation stage, the peak stress of the specimen under the 8 MPa confining pressure condition was 33.9 MPa, which was higher than that of 33.4 MPa under the 6 MPa confining pressure condition. The AE number was further accumulated at this stage, and the AE number produced by the specimen under the 6 MPa confining pressure condition was significantly more than that under the 8 MPa confining pressure. In the softening phase, the stress value gradually decreased with the loading step, the AE number reaches the maximum, and the AE number accumulation curve flattened. The cumulative amount of acoustic emission under 6 MPa confining pressure condition was 1338, which was higher than 1112 under 8 MPa confining pressure condition.
When the confining pressure values were 4 MPa and 2 MPa, the peak stress of the model specimen was lower than that under the 8 MPa and 6 MPa confining pressure conditions. The peak stress under 4 MPa and 2 MPa confining pressure was 31.9 MPa and 31.3 MPa, respectively. In the linear and nonlinear deformation stages, the change trend of stress with loading step was essentially the same as that under 8 MPa and 6 MPa confining pressure conditions. The AE number and the cumulative amount of acoustic emission were significantly higher than those of model specimens with 8 MPa and 6 MPa confining loads applied. The cumulative amount of acoustic emission under the confining pressure conditions of 4 MPa and 2 MPa was 1627 and 1849, respectively. The stress-loading step curves and AE number curves when 4 MPa and 2 MPa confining pressure values were applied to the model specimen under the condition of 4 MPa water pressure value, as shown in Figures 14, 15.
Figure 12 show that the stress-loading step curve corresponding to the four groups of confining pressure values in the linear deformation stage tends to be linear, and the AE number gradually increases. The larger the confining pressure value, the denser is the acoustic emission phenomenon. The application of axial loading and confining pressure loading leads to initial cracks inside the model specimen being gradually compacted and closed, leading to less acoustic emission in the first 10 steps of the model specimen. Furthermore, the AE number increases significantly as the axial load increases owing to the gradual increase of stress on the model elements and the beginning of failure points.
Entering the nonlinear deformation stage, a large number of cracks are generated at the failure point of the model specimen as the loading step increases. The stress-loading step curve shows a linear phenomenon, and the stress in the Y-direction peaks. The acoustic emission phenomenon of the model under 8 MPa confining pressure condition was more active than that of the other three groups, and the AE number was distributed more at steps 23 to 27, considering the accumulated strain energy inside the model specimen under the influence of 8 MPa confining pressure was more; therefore, the acoustic emission activity at the failure point and the crack generation was more active than that of the other three groups of specimens. All four groups of specimens released strain energy at this stage, and hence, the AE number increased significantly.
The axial load further increased, and the model specimen entered the softening stage. The stress-loading step curve in the Y stress began to decrease. The maximum AE number of the specimens under the action of 2 MPa confining pressure was greater than that of the other three groups of model specimens under the action of confining pressure. The larger the confining pressure value, the smaller was the maximum value of sound emission. The original crack in the specimen developed further, and the new crack converged and penetrated, generating macroscopic fracture surface. As a result, the AE number increases rapidly. After the model specimen reaches peak stress and macroscopic failure, the AE number reaches a maximum.
Figure 13 show that the stress-loading step and AE number curves under 2 MPa water pressure exhibited similar stress curve characteristics as those under 4 MPa water pressure, the peak stress of the model under 8 MPa and 6 MPa confining pressures was 33.5 MPa and 33 MPa, respectively. Furthermore, the peak stress of the model specimen under the action of 4 MPa and 2 MPa confining pressures was 32 MPa and 32.7 MPa, respectively. The four groups of specimens showed that the larger the confining pressure value, the greater was the peak stress, which was the same as the afore described analysis results. It shows that the cumulative amount of acoustic emission corresponding to different confining pressure values under the same water pressure has the following situation: the larger the confining pressure value, the smaller is the cumulative amount of AE number. Compared with the other three groups of confining pressure values, the 2 MPa confining pressure value reduces the suppression of the model failure phenomenon, and the acoustic emission activity of the model is more active in the three stages; therefore, the total cumulative amount of acoustic emission under the 2 MPa confining pressure condition was significantly higher than the cumulative amount of acoustic emission under the other three groups of confining pressure conditions.
Under the action of four different confining pressure values, the time lag of the maximum AE number of the model specimen lags behind the maximum stress time and macroscopic failure time of the model, considering the existence of confining pressure inhibits the failure of the model specimen, and the slippage phenomenon of the fractures in the model is hindered under the influence of confining pressure. The occurrence of these two phenomena improves the shear strength and post-peak bearing capacity of the model specimen, and the acoustic emission activity of the specimen rupture has an overall backward shift.
4.2 Acoustic signal distribution of sandstone specimens with moisture content affected by different water pressure
Comparing Figures 12–14, it can be observed that the smaller the water pressure value of the model specimen under the confinement pressure condition of 8 MPa, the greater is the maximum value of AE number and the AE number. The maximum cumulative amount of acoustic emission at 0.5 MPa, 1 MPa, 2 MPa, and 4 MPa water pressures is 1802, 1500, 1550, and 1112, respectively. The maximum cumulative amount of visible acoustic emission decreases as the water pressure increases. Water inhibits the acoustic emission activity of the model specimen.
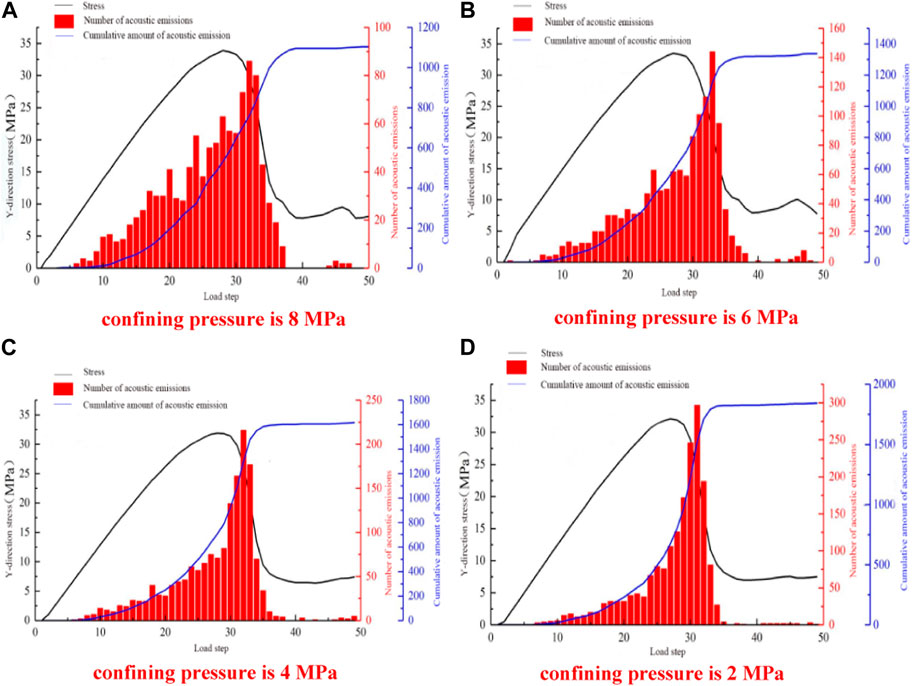
FIGURE 12. Stress-loading step and sound emission number curve of sample at 4 MPa water pressure. (A) confining pressure is 8 Mpa, (B) confining pressure is 6 Mpa, (C) confining pressure is 4 Mpa, and (D) confining pressure is 2 Mpa.
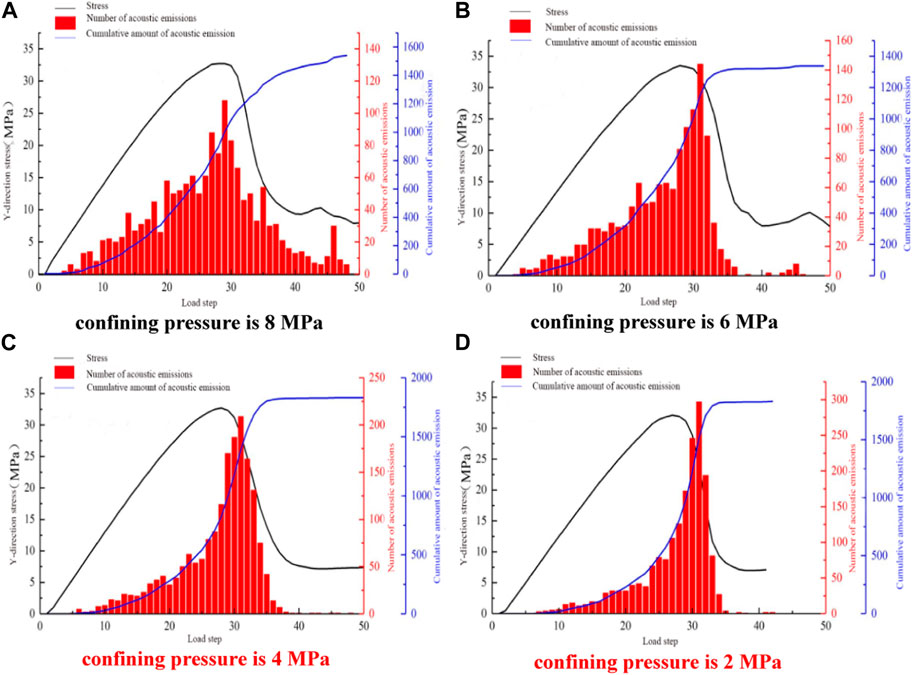
FIGURE 13. Stress-loading step and sound emission number curve of sample at 2 MPa water pressure. (A) confining pressure is 8 Mpa, (B) confining pressure is 6 Mpa, (C) confining pressure is 4 Mpa, and (D) confining pressure is 2 Mpa.
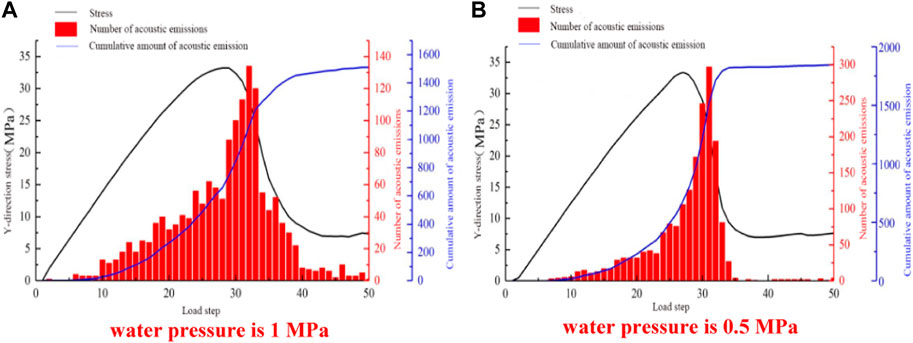
FIGURE 14. Stress-loading step and sound emission number curve of sample at 8 MPa confining pressure. (A) water pressure is 1 MPa (B) water pressure is 0.5 MPa.
We compared Figures 15–17 in the AE number effected by water pressure and confining pressure conditions. The following analyses can be made:
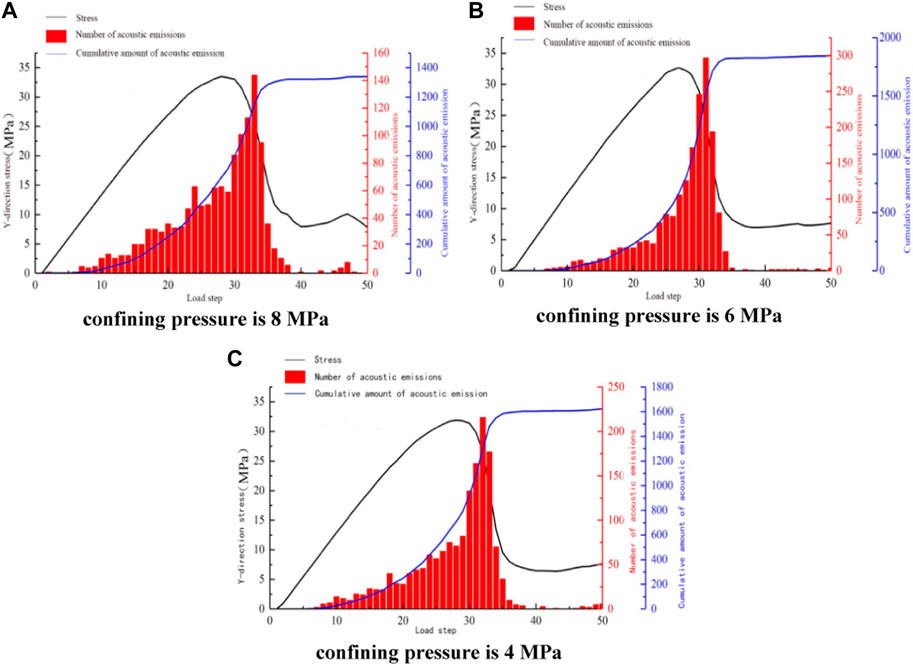
FIGURE 15. Stress-loading step and AE number curve of sample with 1 MPa water pressure. (A) confining pressure is 8 Mpa, (B) confining pressure is 6 Mpa, (C) confining pressure is 4 Mpa.
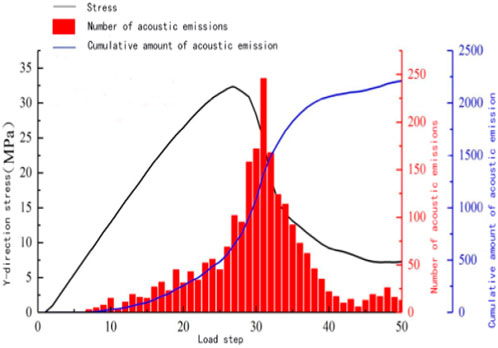
FIGURE 16. Stress-loading step and AE number curve for 0.5 MPa water pressure at 4 MPa confining pressure.
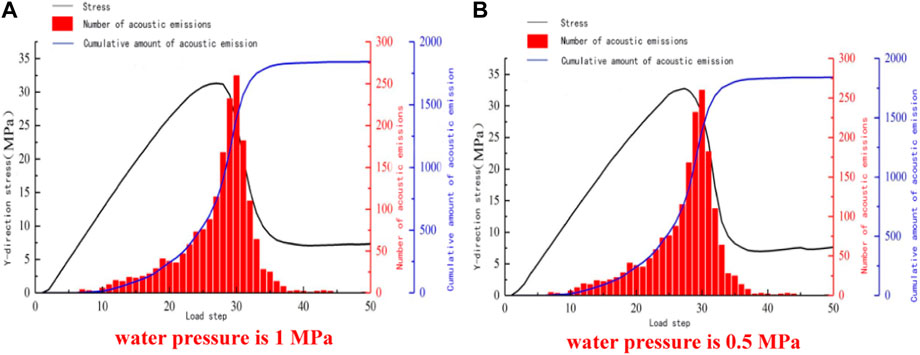
FIGURE 17. Stress-loading step and AE number curve for sample at 2 MPa confining pressure. (A) water pressure is 1 MPa (B) water pressure is 0.5 MPa.
The action of water reduces the strength of sandstone; therefore, the peak strength of the model specimens with different water pressure of the same confining pressure decreases as the water pressure increases (consistent with the analysis results of 3.3). As the peak intensity of sandstone decreases, the ability of the model specimen to resist deformation and damage weakens, and a large number of failure units appear in the model specimen, resulting in a rapid increase in AE number. In the three destruction stages of the model, the following phenomena occur:
(1) In the linear deformation stage, the axial stress increases as the loading steps increase, showing linear characteristics. The micro-cracks in the model are gradually compact, a small number of failure points appear inside the model specimen, and the acoustic emission activity gradually becomes active. The test pieces under different water pressure conditions gradually increase in the AE number. On comparing the AE number curves under the condition of 0.5 MPa and 1 MPa water pressure, it was found that the AE number of the specimen under the influence of 0.5 MPa water pressure at 10 to 22 steps was significantly more than that of 1 MPa water pressure. Furthermore, on comparing the AE number curves of 1 MPa and 2 MPa water pressure and the AE number curve of 2 MPa and 4 MPa water pressure conditions, it was found that the larger the water pressure value in the linear deformation stage, the lower was the AE number. It has been explained that water has a certain softening effect on the internal microstructure of the rock, which inhibits the acoustic emission activity of the rock.
(2) In the nonlinear deformation stage, the axial stress of the four groups of model specimens with different water pressure values all appeared nonlinear and reached the maximum value as the loading steps increased. The axial stress reached the maximum value at 27 steps. A large number of failure points in the model specimen begin to occur, and cracks begin to develop from the failure point. The AE numbers of the four groups of specimens increase rapidly; however, the AE numbers of the specimens under the evident condition of 0.5 MPa water pressure was more than that of the other 3 groups, considering that the presence of water pressure value strengthens the softening effect on the model and the acoustic emission activity begins to decrease.
(3) In the softening stage, cracks occur in the model specimen that penetrate the specimen, and new cracks are generated, and there is a phenomenon of intersection between cracks. The AE number increased rapidly and reached the maximum value, among which the AE number under the water pressure value of 0.5 MPa was higher than the maximum AE number under the other three groups of water pressure conditions. On comparing the maximum values of the AE numbers of the four groups separately, it was found that the larger the water pressure value, the smaller was the maximum AE number. With the increase of loading steps. The softening effect of water on the model specimen was further strengthened, resulting in a decrease in the compressive strength of the model and a weakening of acoustic emission activity.
The cumulative AE number at the water pressure value of 4 MPa was significantly lower than that of the model specimen when the other three groups of water pressure values; the lower the water pressure value, the greater was the cumulative amount of AE number owing to the increase in the pore water pressure and decrease in the AE number activity at the moment of rupture of the model specimen. The action of pore water transforms the model from brittle tension to plastic slip during loading, so that the fracture characteristics of the model change from brittle to ductility. Therefore, in the three stages of destruction, the acoustic emission activity of the model decreased as the water pressure increased, and the acoustic emission accumulation of the model specimen under 4 MPa water pressure was significantly lower than that of the other three groups under water pressure.
4.3 Acoustic signal evolution process of water-bearing sandstone specimens under different confining pressures and different water pressures
A comparative analysis of Tables 2, 3 shows that the AE number in the linear deformation stage gradually increased as the confining pressure under the condition of certain water pressure decreased and is randomly distributed. In the later stage of linear deformation, the AE number under the condition of 8 MPa confining pressure was significantly less than that of the other three groups, and the distribution was densely distributed at the boundary of the model. In the nonlinear deformation stage, the AE number further increased the acoustic emission signal begins to concentrate at the crack in large quantities, the smaller.
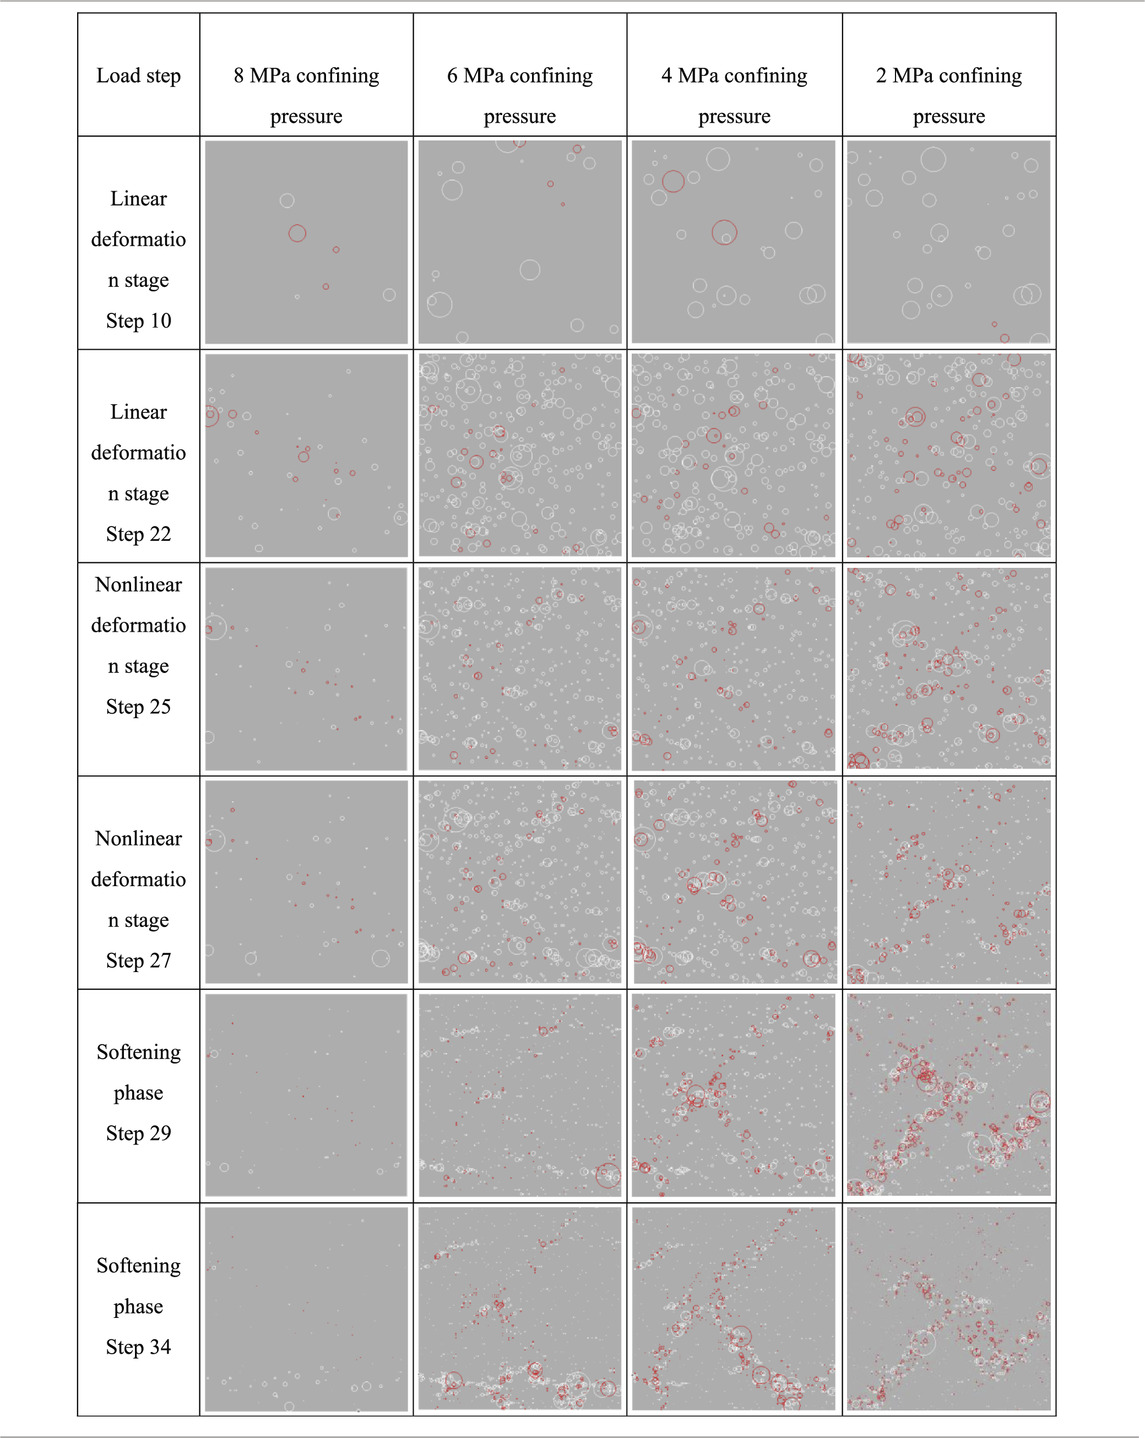
TABLE 2. Evolution process of AE signals under different confining pressures at 4 MPa water pressure.
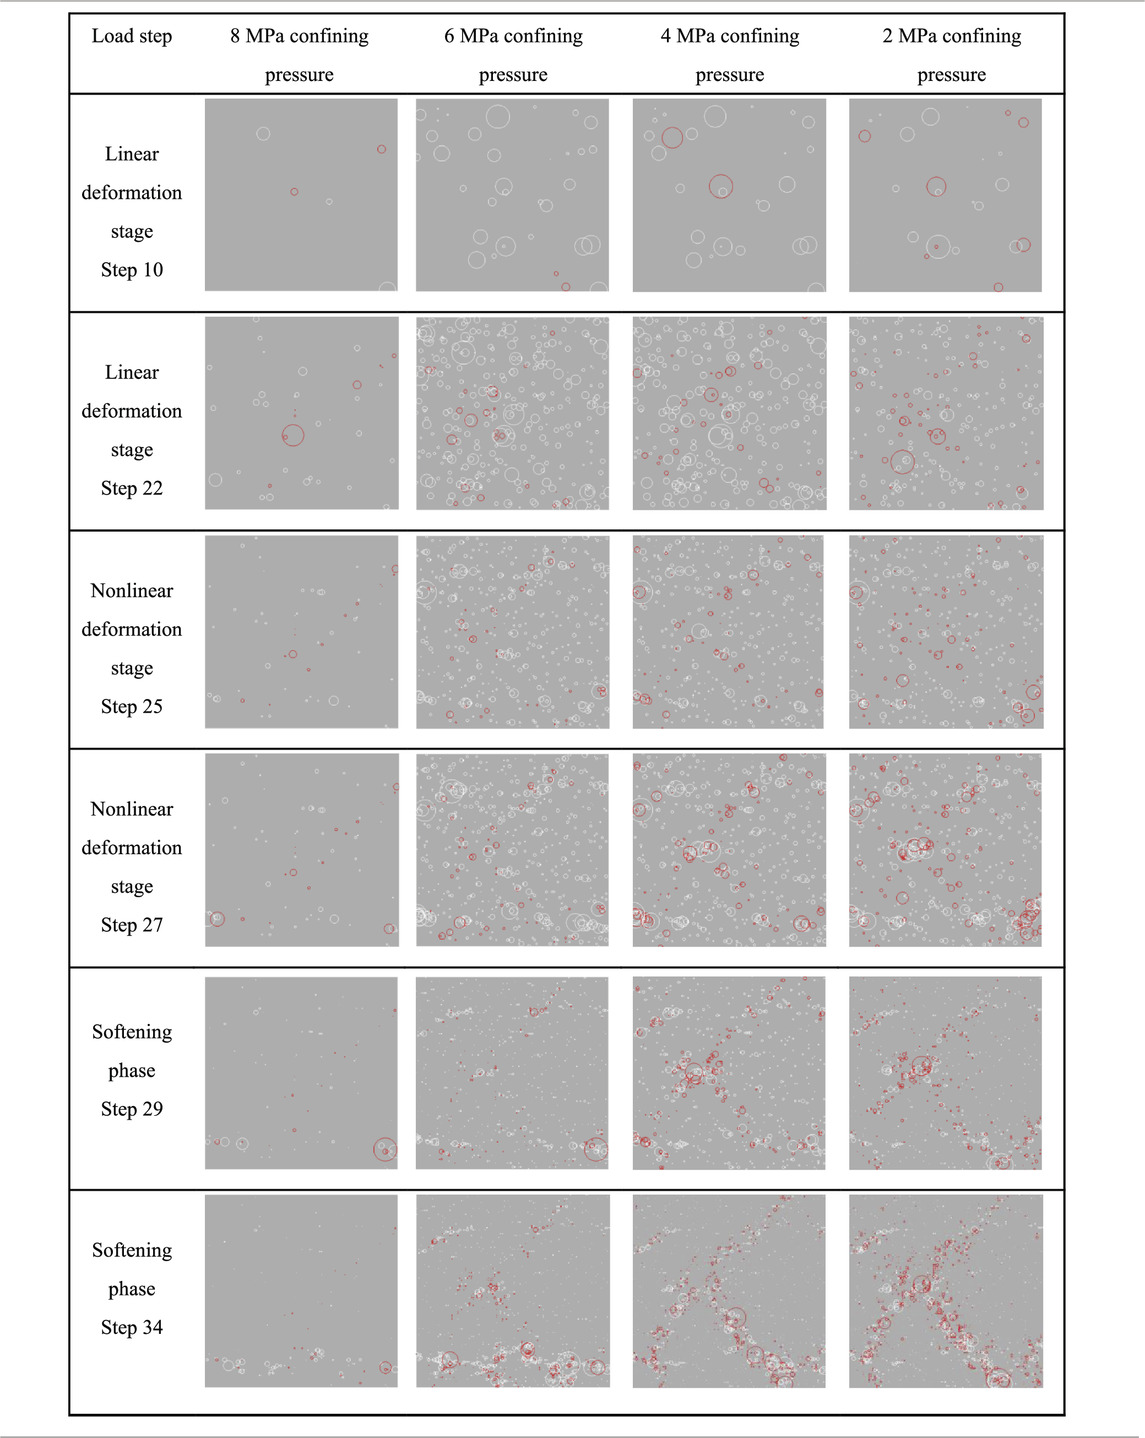
TABLE 3. AE signal evolution process of models with different confining pressures under 2 MPa water pressure.
Is the confining pressure value and the greater is the number of acoustic signals generated. In the softening stage, cracks through the model began to appear on the surface of the model specimen, and the acoustic emission activity was mainly concentrated on the crack surface. Therefore, the acoustic signal appeared in steps 29 and 34 at the crack.
Tables 2–5 indicate that different water pressure values affect the acoustic emission activity of the model specimen. The lower the water pressure value, the more active is the acoustic emission activity, considering the presence of water reduces the brittle characteristics of the rock, thereby weakening the strength of the rock. Rocks are less resistant to deformation and damage, becoming more prone to failure. Therefore, under the action of axial load and confining pressure, the acoustic emission activity of the model is less active than that of the other three groups when 4 MPa water pressure is applied. The acoustic emission activity is the most active at 0.5 MPa water pressure, and the model produces a large number of irregularly distributed acoustic signals in the three deformation and failure stages. Furthermore, the acoustic signals distributed at the cracks are denser than those of the other three groups.
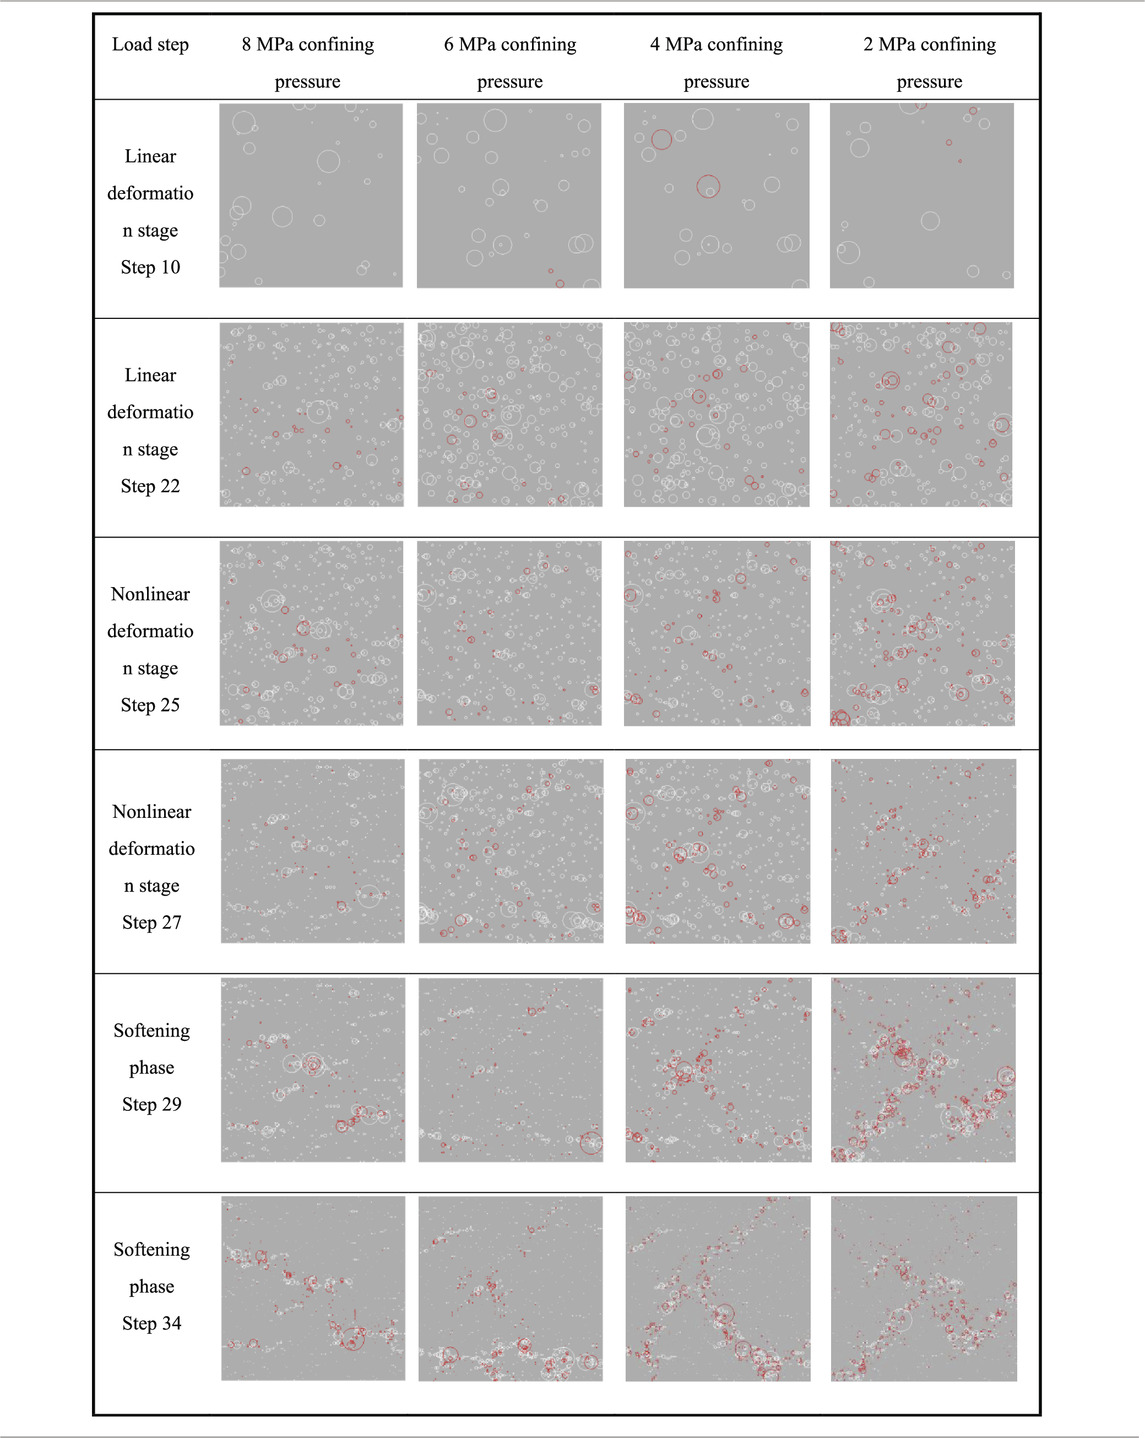
TABLE 4. Evolution process of AE signals in different confining pressure models under 1 MPa water pressure.
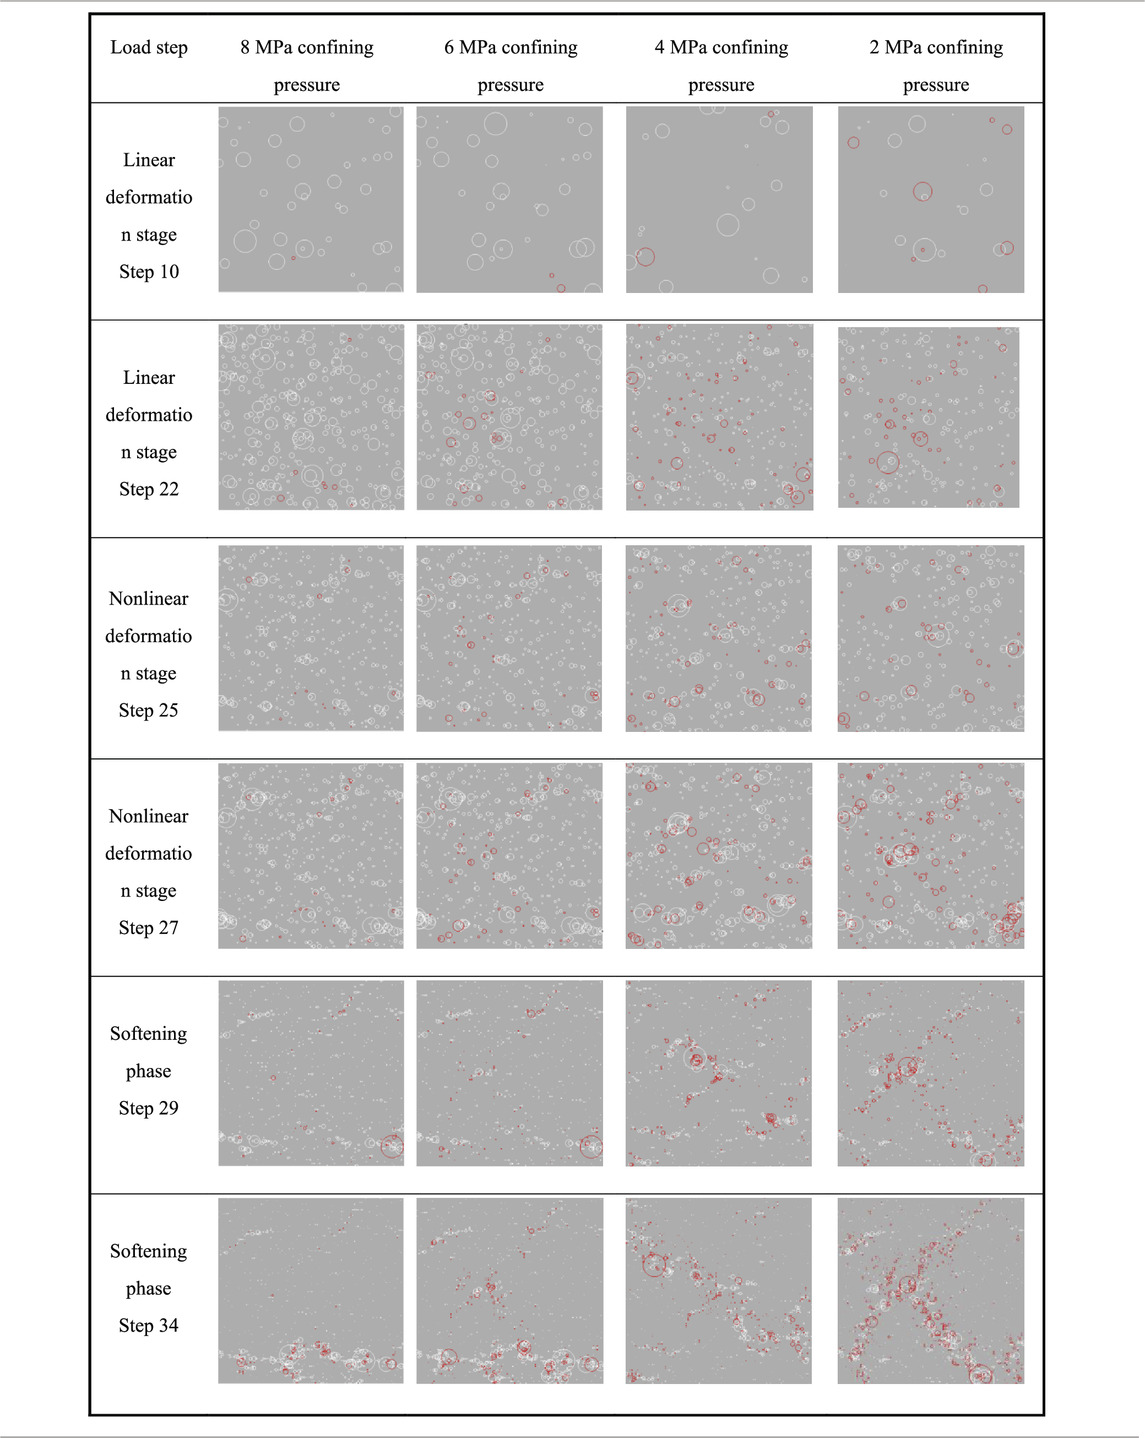
TABLE 5. Evolution process of AE signals under different confining pressures at 0.5 MPa water pressure.
5 Conclusion
(1) In the case of different confining pressures of the same water pressure, the lower the confining pressure, the lower is the compressive strength of the model, and the more evident is the failure phenomenon. This can be attributed to the fact that the cracks inside the model are pressed owing to the increase in the confining pressure value applied, which limits the radial deformation. As a result, the stiffness of the model increases, which strengthens the compressive strength of the model specimen. In the case of different water pressures of the same confining pressure, the higher the water pressure value, the more evident is the failure phenomenon of the model, and the lower is the peak stress in the stress–strain curve. This is because the higher the water pressure value applied to the model, the more evident is the permeation effect of water on the specimen.
(2) The larger the water pressure value, the more evident is the softening effect, which reduces its compressive strength. Furthermore, increased water pressure promoted the development of cracks in the model and reduced the compressive strength of the model. Owing to the different confining pressure, the accumulated strain energy inside the specimen was different, as a result, the resulting acoustic emission activity was different. The smaller the confining pressure value with the same water pressure value, the larger was the maximum AE number o of the model, and the larger was the total cumulative AE number. After the model specimen reaches peak stress and macroscopic failure, the AE number reached a maximum. The larger the confining pressure value, the smaller was the maximum number of sound emissions. The slippage phenomenon of the fractures in the model improved the shear strength and post-peak bearing capacity of the model specimen, and the acoustic emission activity of the rupture of the specimen shifted backward as a whole.
(3) Water has a certain softening effect on the internal microstructure of the rock, which inhibits the acoustic emission activity of the rock. The action of pore water transforms the model from brittle tension to plastic slip during loading; therefore, the fracture characteristics of the model changed from brittle to ductility. The acoustic emission activity of the model decreased as the water pressure increased, the larger the water pressure value, the smaller was the cumulative AE number.
Data availability statement
The data that support the findings of this study are available from the corresponding author, LZ upon reasonable request.
Author contributions
LZ contributed to the conception of the study, performed the experiment; GL contributed to future analysis and modify the manuscript. XW contributed to future analysis and modify the manuscript. YZ contributed to research ideas. All authors contributed to the article and approved the submitted version.
Funding
This work was supported by the National Natural Science Foundation of China (52174116; 52174077).
Conflict of interest
The authors declare that the research was conducted in the absence of any commercial or financial relationships that could be construed as a potential conflict of interest.
Publisher’s note
All claims expressed in this article are solely those of the authors and do not necessarily represent those of their affiliated organizations, or those of the publisher, the editors and the reviewers. Any product that may be evaluated in this article, or claim that may be made by its manufacturer, is not guaranteed or endorsed by the publisher.
References
Bao, T., Hashiba, K., and Fukui, K. (2020). Effect of water saturation on the Brazilian tension test of rocks: Mechanics of materials. Mater. Trans. 62 (1), 1–9. doi:10.2320/matertrans.M-M2020857
Chen, G., Li, Y., Li, T., and Zhang, G. (2022). Deterioration law of intermittent jointed sandstone mechanical properties under water–rock interaction. Acta Geophys. 70 (4), 1923–1935. doi:10.1007/s11600-022-00832-5
Chuanming, L., Nan, L., and Wanrong, L. (2020). Experimental investigation of mechanical behavior of sandstone with different moisture contents using the acoustic emission technique. Adv. Civ. Eng. 2020 (3), 1–10. doi:10.1155/2020/8877921
Ding, X., Xiao, X., Cui, J., Di, W., and Pan, Y. (2023b). Damage evolution, fractal dimension and a new crushing energy formula for coal with bursting liability. Process Saf. Environ. Prot. 169, 619–628. doi:10.1016/j.psep.2022.11.059
Ding, X., Xiao, X., Lv, X., Wu, D., and Pan, Y. (2023a). Effect of water on mechanical properties of coal, charge induction, and rockburst hazard prevention. Min. Metallurgy Explor. 40 (1), 277–290. doi:10.1007/s42461-022-00718-6
Gu, H., Lai, X., Tao, M., Cao, W., and Yang, Z. (2023). The role of porosity in the dynamic disturbance resistance of water-saturated coal. Int. J. Rock Mech. Min. Sci. 166, 105388. doi:10.1016/j.ijrmms.2023.105388
Gui, H., and Lin, M. (2016). Types of water hazards in China coalmines and regional characteristics. Nat. Hazards 84 (2), 1501–1512. doi:10.1007/s11069-016-2488-5
Kong, B., Wang, E., Li, Z., Wang, X., Niu, Y., and Kong, X. (2017). Acoustic emission signals frequency-amplitude characteristics of sandstone after thermal treated under uniaxial compression. J. Appl. Geophys. 136, 190–197. doi:10.1016/j.jappgeo.2016.11.008
Lai, X. P., Zhang, S., Shan, P., Cui, F., Yang, Y. B., and Bai, R. (2022). Experimental study of unconventional modified filling energy absorption and control mechanism in high energy storage rock masses. Sci. Rep. 12, 11783. doi:10.1038/s41598-022-15954-5
Li, G., Wang, Y., Wang, D., and Zhang, S. (2023). The creep behavior of rock shear seepage under different seepage-water pressures. Mech. Time-Depend Mater 27, 351–365. doi:10.1007/s11043-023-09601-3
Lin, H. X., Zhang, Q. Y., Zhang, L. Y., Duan, K., Xue, T. E., and Fan, Q. H. (2022). The influence of water content on the time-dependent mechanical behavior of argillaceous siltstone. Rock Mech. Rock Eng. 55, 3939–3957. doi:10.1007/s00603-022-02826-7
Liu, B., Li, S. C., Wang, J., Sui, Q. M., Nie, L. C., and Wang, Z. F. (2012). Multiplexed FBG monitoring system for forecasting coalmine water inrush disaster. Adv. Optoelectron. 2012, 1–10. doi:10.1155/2012/895723
Liu, X. S., Tan, Y. L., Ning, J. G., Lu, Y. W., and Gu, Q. H. (2018). Mechanical properties and damage constitutive model of coal in coal-rock combined body. Int. J. Rock Mech. Min. Sci. 110, 140–150. doi:10.1016/j.ijrmms.2018.07.020
Li, Z., Wang, L., Lu, Y., Li, W., and Kai, W. (2018). Experimental investigation on the deformation, strength, and acoustic emission characteristics of sandstone under true triaxial compression. Adv. Mater. ence Eng. 2018, 1–16. doi:10.1155/2018/5241386
Ma, H., Song, Y., Chen, S., Yin, D., Zheng, J., Shen, F., et al. (2021). Experimental investigation on the mechanical behavior and damage evolution mechanism of water-immersed gypsum rock. Rock Mech. Rock Eng. 54 (9), 4929–4948. doi:10.1007/s00603-021-02548-2
Moradian, Z., Einstein, H., and Ballivy, H. G. (2016). Detection of cracking levels in brittle rocks by parametric analysis of the acoustic emission signals. Rock Mech. Rock Eng. 49 (3), 785–800. doi:10.1007/s00603-015-0775-1
Qiao, L., Wan, Z., and Huang, A. (2017). Alteration of mesoscopic properties and mechanical behavior of sandstone due to hydro-physical and hydro-chemical effects. J. Eng. 50, 255–267. doi:10.1007/s00603-016-1111-0
Serdyukov, S., Rybalkin, V., Drobchik, A., Vostrikov, N. I., Rybalkin, L. A., Drobchik, A. N., et al. (2022). Acoustic and seismic emission in hydraulic fracturing of cement block under loading. J. Min. Sci. 58 (6), 920–929. doi:10.1134/s1062739122060060
Shan, R. L., Kong, X. S., Liu, J., Li, J. F., Bai, Y., and Song, Y. W. (2014). Research status and development trends of roadway surrounding rock stability classification. Appl. Mech. Mater. 3307, 1352–1357. doi:10.4028/www.scientific.net/amm.580-583.1352
Shoufeng, T., Minming, T., Junli, H., and Xinmin, H. (2010). Characteristics of acoustic emission signals in damp cracking coal rocks. Min. Sci. Technol. 20 (1), 143–147. doi:10.1016/s1674-5264(09)60176-9
Tang, C. (1997). Numerical simulation of progressive rock failure and associated seismicity. Int. J. Rock Mech. Min. Sci. 34 (2), 249–261. doi:10.1016/s0148-9062(96)00039-3
Wang, Y., Deng, C., Zeng, D., He, F., Feng, X., Wang, D., et al. (2022). Research on sandstone damage characteristics and acoustic emission precursor features under cyclic loading and unloading paths. Sustainability 14 (19), 12024. doi:10.3390/su141912024
Keywords: triaxial stress, water-bearing rock, acoustic emission, mechanical properties, numerical calculation
Citation: Zhang L, Liu G, Wei X and Zhang Y (2023) Mechanical properties and acoustic emission evolution of water-bearing sandstone under triaxial conditions. Front. Earth Sci. 11:1212095. doi: 10.3389/feart.2023.1212095
Received: 25 April 2023; Accepted: 17 July 2023;
Published: 13 October 2023.
Edited by:
Shuren Wang, Henan Polytechnic University, ChinaReviewed by:
Jin Yu, Huaqiao University, ChinaPengfei Shan, Xi’an University of Science and Technology, China
Copyright © 2023 Zhang, Liu, Wei and Zhang. This is an open-access article distributed under the terms of the Creative Commons Attribution License (CC BY). The use, distribution or reproduction in other forums is permitted, provided the original author(s) and the copyright owner(s) are credited and that the original publication in this journal is cited, in accordance with accepted academic practice. No use, distribution or reproduction is permitted which does not comply with these terms.
*Correspondence: Lixin Zhang, emhhbmdsaXhpbkBsbnR1LmVkdS5jbg==