 Sujan Raj Adhikari
 Sheri Molnar
 Jinfei Wang
- 1Department of Earth Sciences, University of Western Ontario, London, ON, Canada
- 2Department of Geography and Environment, University of Western Ontario, London, ON, Canada
The goal of the multi-year seismic microzonation mapping project for Greater Vancouver, British Columbia, Canada, is to produce seismic hazard maps inclusive of local site effects, in particular seismic hazard specific to one-dimensional site response and three-dimensional Georgia sedimentary basin amplification, as well as liquefaction and landslide hazard potential. We explore the variability in key seismic site characterization measures most often used for seismic microzonation mapping to evaluate the impact on mapping and communication of seismic microzonation of Greater Vancouver. This study focuses on the comparison of seismic microzonation maps of Greater Vancouver based on up to three seismic site term parameters and their associated classification schemes: 1) the time-averaged shear-wave velocity (Vs) of the upper 30 m (Vs30) and associated Canadian National Building Code (NBC) site class; 2) Vs30-based site classification proposed for the updated Eurocode 8; 3) site period (T0) determined from microtremor site amplification spectra; and 4) a hybrid site classification based on T0 and the average Vs and thickness of soil. 810 Vs30 and 2,200 T0 values are determined to evaluate sub-regional differences in these important seismic site parameters in Greater Vancouver. We find that the seismic microzonation of Greater Vancouver depends on the chosen seismic site parameter (Vs30, T0, or a combination of parameters) and that classification schemes with greater class divisions are beneficial to communicating the great variability in seismic site conditions in Greater Vancouver. We recommend that either one hybrid classification map or two classification maps of Vs30 and T0 together are required for effective communication of the seismic microzonation of Greater Vancouver.
1 Introduction
Seismic microzonation is a method for characterizing a region’s seismic hazard due to local site conditions at a regional or municipal scale, often communicated in the form of a map or spatial GIS layer. Seismic microzonation maps identify and characterize seismically homogeneous behavior, such as zones with similar susceptibility to seismic site amplification, liquefaction, or slope instability. Seismic microzonation is a comprehensive process that involves three distinct stages: 1) estimating the regional seismic hazard that involves examining the geological environment, recorded and historical earthquake data, and fault activity in the area; 2) estimating the conditions of the regional seismic site, such as the material properties and dynamic response of the soil and rocks, groundwater levels, geological substructure, and surface topography of the surrounding area; and 3) using the outcomes of stages 1 and 2 to perform seismic hazard analyses to predict seismic ground motions and site response at the ground surface. Intuitively, as the quality and quantity of in situ seismic site characterization data and spatial geodatasets in combination with technical seismic hazard analyses increase, the grade or level of seismic microzonation mapping increases. For example, a grade I seismic microzonation map uses lower quality and quantity of data and technical seismic analyses than grade III (TC4-ISSMGE, 1999; SM Working Group, 2015). Seismic microzonation maps are most directly used as input in seismic risk analyses. Thereby, they are beneficial to regional or local authorities in urban planning, emergency managers in response and recovery planning, and earthquake engineering professionals in seismic design, among others.
The most ubiquitous seismic site term parameter in seismic hazard prediction is the time-averaged shear-wave velocity (Vs) of the upper 30 m (Vs30), first proposed by Borcherdt (1994) and used to characterize five seismic site classifications (A–F), each based on a particular range of Vs30 (e.g., class A corresponds to Vs30 > 1,500 m/s) (NEHRP, 1994). It is now a near-universal requirement for seismic design standards to use Vs30, which increases the precision and dependability of seismic design techniques, particularly for locations with diverse soil conditions (Castellaro et al., 2008; Borcherdt, 2012; Myriam et al., 2018; Stanko and Markušić, 2020). In Canada, Vs30 was adopted for seismic site classification in the 2005 National Building Code (NBC) (Adams and Halchuk, 2004) and maintained in the code until 2020 (NBCC, 2015). The recently adopted 2020 NBC permits the use of Vs30 directly to determine seismic design ground motions when it is calculated from an in situ seismic field method (Kolaj et al., 2020); otherwise, the design ground motions are the maximum motion for the seismic site class based on in situ measurements of standard penetration test blow count (N) or undrained shear strength (su) averaged for the upper 30 m. The most recent American seismic design code (ASCE 7–22) maintains the use of seismic site classification based on Vs30 with further refinement of the original five NEHRP classes to seven (addition of CD and DE classes). Although widely used, numerous authors have questioned the ability of Vs30 to capture the complexity of site effects (Castellaro et al., 2008; Gallipoli and Mucciarelli, 2009; Lee and Trifunac, 2010) because it could mislead the amplification value for deep and low stiffness deposit laying on harder rock (sedimentary basin site) or for sites with a velocity profile that does not monotonically increase with depth. The lowest peak observable in an MHVSR curve (f0HV) is assumed to represent the fundamental resonant site frequency (f0) of the soil column. f0 is related to both the stiffness distribution in the subsurface and the depth of the seismic bedrock (Pitilakis et al., 2013; Pitilakis et al., 2019; Farrugia et al., 2018; Molnar et al., 2018). Zhao et al. (2006) developed a site period classification scheme from earthquake spectral ratios of 5% damped response spectra in Japan. Compared to the Vs30-based classification method, Zhao et al. (2006) discovered that their site period classification offered a more precise prediction of ground motion characteristics. Later, Di Alessandro et al. (2012) used Italian datasets to propose two additional site period classes to the Zhao et al. (2006) site period classification. Recent efforts to utilize site frequency in the development of ground motion models (Hassani and Atkinson, 2016) and seismic site classification for earthquake design codes (Zhao et al., 2006; Pitilakis et al., 2013) indicate the growing popularity of f0 and accompanying shift away from the dominance of Vs30 in seismic hazard analyses. Cultrera et al. (2021) ranked 24 distinct indicators of site classification based on a questionnaire survey and ranked them based on the responses of several experts in various domains. They found that f0, Vs depth profile, Vs30, and the depth of engineering and seismological bedrock are the preferred site indicators for effective seismic site characterization. A number of alternative seismic site classification schemes have been proposed, each based on a mix of several site characterization measures (Rodríguez-Marek et al., 2000; Di Giulio et al., 2020; Cultrera et al., 2021). A hybridized seismic site classification scheme based on multiple seismic site characterization measures [N, su, plasticity index, f0, soil thickness (h), and average Vs to seismic bedrock (VSav)] has been proposed for the revision of the Eurocode 8 seismic design code (Pitilakis et al., 2013; Pitilakis et al., 2019).
The earliest seismic microzonation studies in Canada resulted in Vs30-based NBC site class mapping for the municipalities of Victoria, BC (Monahan et al., 2000); Greater Vancouver, BC (Monahan, 2005); Ottawa, ON (Motazedian et al., 2011); and Montreal, QC (Rosset et al., 2015). There are fewer seismic microzonation maps in Canada based on site period (inverse of f0): Toronto (Mihaylov, 2011) and Québec City (Leboeuf et al., 2013). More recent Canadian seismic microzonation studies have produced multiple maps of various seismic site characterization measures, including site period (VSav, Vs30, or both; not NBC site class) and total sediment thickness maps with the development of 3D geomodels: the St. Lawrence Lowlands (Nastev et al., 2016) and Saguenay, QC (Salsabili et al., 2021). The ongoing Metro Vancouver seismic microzonation mapping project (Molnar et al., 2020) will produce a suite of high-quality (grade III) seismic microzonation maps to convey local seismic site conditions (e.g., Vs30, site period, and post-glacial/glacial sediment thickness) and probabilistic seismic hazard maps depicting shaking (de)amplification and seismic-induced liquefaction and landslide hazard potential at 2% and 10% probability of exceedance in 50-year risk levels (considering ground motions with a 2,500- and 475-year recurrence interval, respectively). A comprehensive regional geodatabase of geological, geophysical (primarily seismic), and geotechnical spatial datasets and in situ field measurements has been compiled (Adhikari et al., 2021b) to achieve high-quality mapping, including over 10,000 lithology logs, 2,300 microtremor horizontal-to-vertical spectral ratio measurements (Sirohey, 2022), 1,380 cone penetration tests, 810 Vs depth profiles, and 530 standard penetration tests.
In this study, we utilize the geodatabase compiled to achieve seismic microzonation mapping of Metro Vancouver, British Columbia, Canada (Adhikari et al., 2021b) to explore sub-regional differences in important seismic site term parameters (Vs30, site period) across 16 local municipalities, lands of 6 First Nations, and 1 Electoral Area of western Metropolitan Vancouver. Subsequently, we apply various site classification schemes based on Vs30, site period, or a hybrid combination of seismic site characterization measures in generating seismic microzonation maps of Greater Vancouver from which the impact of each scheme on communicating the region’s seismic site characterization to technical and non-technical end users can be evaluated (Fyfe and Molnar, 2020).
2 Greater Vancouver seismic site condition
Greater Vancouver lies within the Late Cretaceous to Early Tertiary Georgia basin filled with south-dipping sedimentary rocks that overlie Mesozoic plutonic rocks exposed in the Coast Mountains (Monger and Journeay, 1994). A simplified geologic map of the western Greater Vancouver study area is shown in Figure 1. The youngest Holocene post-glacial deposits in the region are modern alluvial, deltaic, and bog deposits with near surface Vs of 115–175 m/s, respectively (Assaf, 2022). The Fraser River Delta, beneath the cities of Richmond and Delta, is a topographically lowland region comprising deltaic silts and sands, with a thickness of up to 300 m (Rogers et al., 1998). The Fraser River Delta sediments exhibit an expected power law Vs depth (z) relationship, with Vs of ∼70 m/s at the surface to ∼320 m/s at 90 m depth (Hunter and Christian, 2001). A thick Pleistocene succession (maximum of 500 m) of glacial and interglacial sediments underlies the Fraser River Delta’s center (Christian et al., 1994; Britton et al., 1995) and thereby has complex changes in sediment types vertically at individual sites and laterally between them. These Pleistocene sediments are mostly composed of Ice-compacted sediment (till) at surface or near the surface across most of Vancouver, Burnaby and Surrey (Luternauer et al., 1994). We group the former as glacial sediments and the latter as post-glacial, as they were never glacially overridden (Figure 1). Glacial sediments have a range of Vs that increases with depth from ∼490 m/s at the surface to ∼800 m/s at 50 m depth in upland Vancouver, Burnaby, and Surrey areas and from 375 m/s (base of Holocene) to 550 m/s (200 m deeper) beneath the Fraser River Delta (Assaf, 2022). Pleistocene post-glacial sediments have a VSav of ∼250–265 m/s (Assaf, 2022). The Quaternary sediment package overlies the Late-Cretaceous Georgia basin sedimentary bedrock and pinches out to the north, from a maximum thickness of 800–1,000 m beneath the Delta to only several meters at the edge of the post-glacial Fraser River Delta (Britton et al., 1995). Tertiary sedimentary rocks have Vs as low as ∼650 m/s in the near surface, increasing to over 1,200 m/s at 40 m depth, and Tertiary rock Vs increases from ∼575 to 1,525 m/s, from 445 to 605 m depth beneath the Fraser River Delta (Assaf, 2022). Mesozoic plutonic igneous rocks are exposed along the North Shore (north of Burrard Inlet) at the highest altitudes. In the near surface, the VSav of these crystalline fractured rocks is ∼1,600 m/s and increases to over 2,000 m/s by ∼ 40 m depth (Assaf, 2022). In general, there are two major seismic impedance contrasts at depth between post-glacial and glacial units and between post-glacial or glacial and rock units.
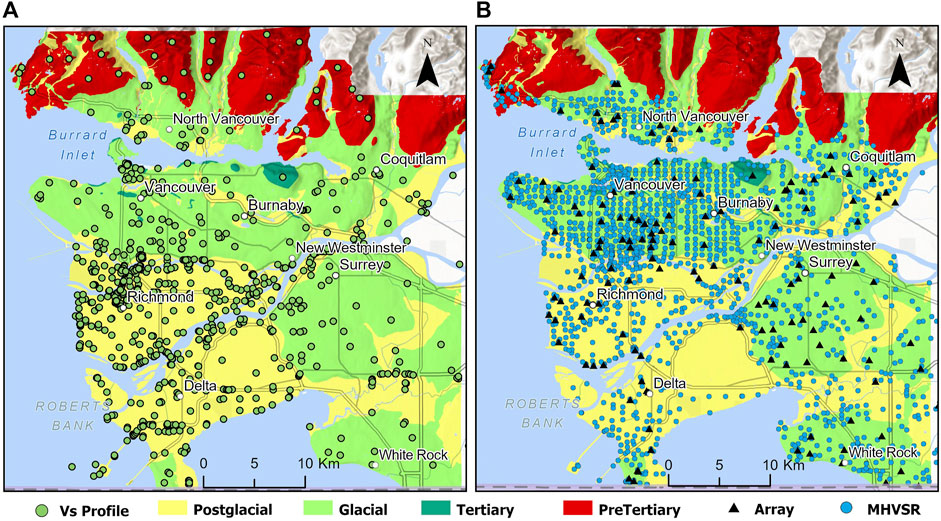
FIGURE 1. Simplified surficial geologic map (colors) with (A) locations of 810 Vs depth profiles (circles) from invasive and non-invasive field testing, and (B) further details of the non-invasive field testing in terms of ∼2,200 MHVSR measurements (circles) and over 120 multi-seismic-method array tests (triangles) performed during the Metro Vancouver seismic microzonation mapping project.
Figure 1 displays geodata locations of the Metro Vancouver microzonation study’s geodatabase (Adhikari et al., 2021b), including 810 Vs depth profiles (Figure 1A), ∼2,200 MHVSR measurements, and over 120 multi-method-seismic array test locations (Figure 1B). The geodatabase is developed from two main data sources: 1) from previously collected open and private geodata sources, with the private geodata shared by 24 municipalities, organizations, or consultants, and 2) by performing in situ field-based multi-method non-invasive seismic testing throughout the region annually between 2018 and 2021. The non-invasive seismic field methods include single-station microtremor measurements (Molnar et al., 2022) performed at a 600- to 1,000-m grid spacing across the study area (Figure 1B) to obtain amplification spectra and site peak frequencies (f0HV and higher frequency peaks f1HV and rarely f2HV) (Sirohey, 2022), combined active-source multi-channel of surface waves (MASW) and passive-source microtremor array method (MAM) array testing to obtain fundamental-mode Rayleigh wave dispersion estimates for joint inversion with MHVSR peak frequency(ies) (f0HV and f1HV) to obtain Vs depth profiles (Ladak, 2020; Assaf et al., 2022; Boucher, 2022) and compression-wave velocity and Vs refraction surveys at selected sloping ground sites (Boucher, 2022).
3 Spatial variation of Vs30 and site period
Two main seismic site classification measures, Vs30 and site period, can be readily obtained from the Vs depth profile (Figure 1A) and MHVSR (Figure 1B, circles) databases, respectively. Vs30 is calculated as the time-averaged Vs over the upper 30 m [i.e., 30 m divided by the summation of travel times (h/Vs) of each layer in the depth profile]. For Vs profiles shallower than 30 m, we use an extrapolation model specific to the Vs data of Metro Vancouver developed by Assaf et al. (2022) and based on Dai et al. (2013) functional form to estimate Vs30. To fill spatial data gaps and increase spatial coverage, we utilize other in situ field-based measurements to supplement additional Vs30 values. Assaf et al. (2023) developed an empirical relationship to convert CPT measurements to Vs for Fraser River Delta sediments (z < 90 m). We use this relationship to predict Vs depth profiles for 365 CPT logs in the Fraser River Delta. A representative Vs depth profile of the upper 30 m for Coast Mountain plutonic igneous rocks of the North Shore developed from multiple invasive and non-invasive field methods (private consulting data of the second author) is used to estimate Vs30 at 25 selected locations of outcropping rock in the study area. Figure 2A displays the locations of 810 Vs30 values calculated from in situ Vs or converted CPT-converted Vs depth profile data.
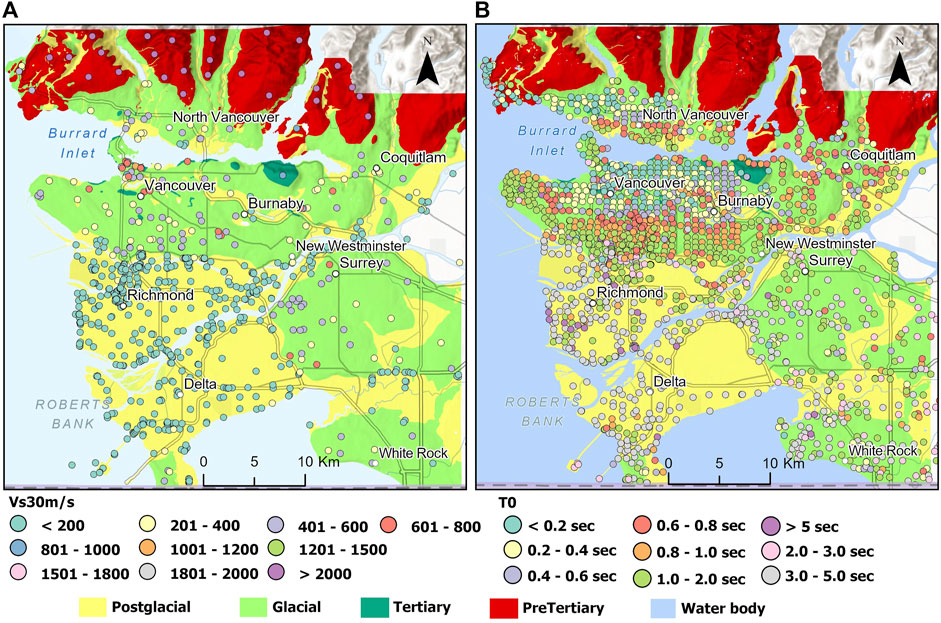
FIGURE 2. (A) Locations of Vs30 obtained from 810 Vs profiles and (B) site period obtained from MHVSR data overlaid on the surficial geological map of the study area.
Sirohey (2022) developed a multi-peak picking algorithm to determine the peak site frequencies for the single-station microtremor measurements of the Metro Vancouver microzonation study (Figure 1B). The MHVSR curve is calculated for each time window of the microtremor recording using HVSRPy (Cox et al., 2020), and a modified agglomerative hierarchical clustering routine (Di Alessandro et al., 2016) is used to compile clusters of MHVSRs with similar curve shape (i.e., edit inconsistent MHVSR curves from consistent MHVSR curves). The end-user selects the most appropriate MHVSR cluster based on visual comparison with the plotted Fourier amplitude spectra. Peak frequencies are determined for all individual curves, as well as the mean and 10th and 90th percentile curves. Then, statistics about the peak frequency values and their amplification are calculated based on the matched peaks from the individual windows to determine if SESAME’s two reliability and six clear peak criteria (Bard, 2008) are met. In this study, the lowest frequency peak of the over 2,200 average MHVSR curves is inverted as an estimate of the site period (Figure 2B).
Prior to using existing seismic site classification schemes in the following section, we evaluate the spatial variation of Vs30 and site period across Greater Vancouver in terms of their average and one standard deviation variation for 17 local communities (Figure 3, Table 1). Although this mapping does not use seismic microzonation (zones defined by similarity of Vs30 or site period), it is a form of seismic microzonation map useful for communicating with local communities or conveying the communities in which the acquisition of in situ Vs30 could reduce 2020 NBC design ground motions (Adhikari et al., 2021a). In general, the lowest Vs30 (180 ± 60 m/s) and longest site periods (3.1 ± 1.5 s) occur in the cities of Richmond and Delta, as expected for the Fraser River Delta lowlands. The glaciated uplands of Vancouver, Burnaby, and Surrey have higher Vs30 values with a greater variance (442 ± 170 m/s) as expected, whereas the average site periods are moderate-to-long (0.7–2.3 s, Table 1), indicating that these stiffer glacial sediments are relatively thick. For Surrey, the site period (depth to Georgia basin sedimentary rock) is consistent with the neighboring Delta even with ∼100 m elevation gain of glacial uplands, and for Vancouver and Burnaby, site periods decrease northward (Figure 2B) toward the northern limit of the Georgia sedimentary rock basin (Burrard Inlet, North Shore, or both). Communities constrained to north and eastern shorelines (e.g., City of North Vancouver, Port Moody, and Port Coquitlam) have an average Vs30 and site period that is relatively low and moderate, respectively (Table 1), related to soft sediments that are thicker than 30 m. Communities that are further north and with higher elevations (outcropping Coast Mountain plutonic rocks) have the highest Vs30 and shortest site periods.
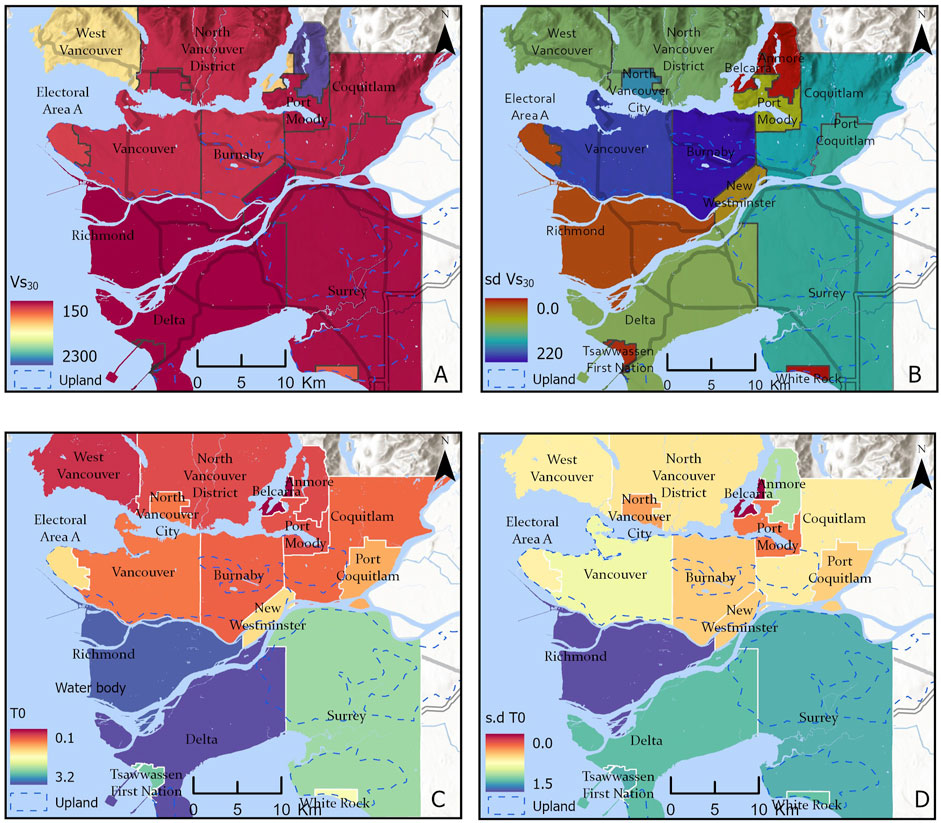
FIGURE 3. Maps of the (A) mean Vs30 and (B) its one standard deviation and (C) mean site period and (D) its one standard deviation for 17 local communities in Greater Vancouver.
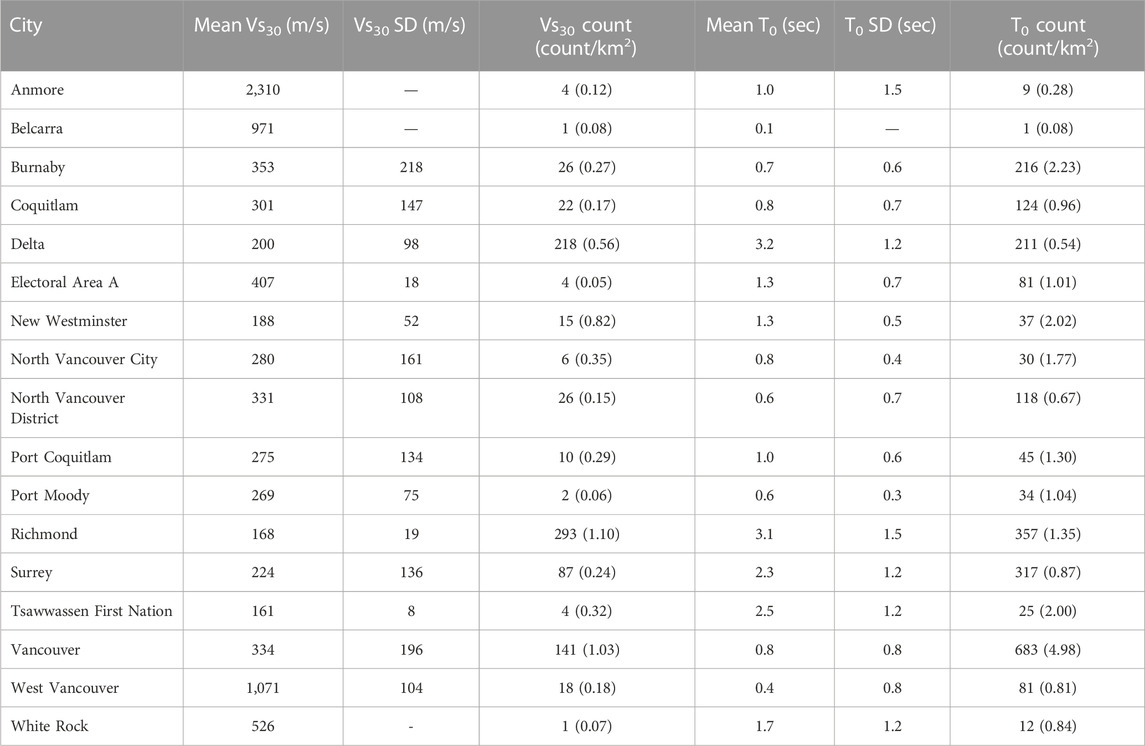
TABLE 1. Average and one standard deviation (SD) of Vs30 and T0 (inverse of f0HV) for 17 local communities in Greater Vancouver.
4 Application of various seismic site classifications
We select and apply four seismic site classification schemes based on Vs30, T0, or a hybrid combination of seismic site characterization parameters (VSav, T0, h) to develop and compare various site classification maps for Greater Vancouver. The Vs30-based seismic site designation of the 2020 NBCC (CCBFC. and NRCan, 2022) (Supplementary Table S1 in the electronic supplement) defines six site classes based on Vs30 ranging from >1,500 m/s (class A) to ≤140 m/s (class F). Similarly, Eurocode 8 (CEN, 2004; 2021) has four classifications based on Vs30 ranges (Supplementary Table S2 in the electronic supplement) that span from >800 m/s (class A) to <180 m/s (class D). The site classification scheme of Di Alessandro et al. (2012) defines seven classes based on site period ranges that span <0.2 s (class I) to ≥0.6 s (class IV) with higher classes V–VII corresponding to HVSR amplification spectra morphology (e.g., flat HVSR and multiple peaks). In the Di Alessandro et al. (2012) classification scheme, the flat MHVSR response of rock and rock-like conditions of the North Shore corresponds to class V, and the double peak MHVSR response in the Fraser River Delta (Sirohey, 2022) corresponds to class VI. Finally, we utilize a hybrid seismic site classification scheme (VSav, T0, and h) proposed for revisions to Eurocode 8 by Pitilakis et al. (2019) (Supplementary Table S4 in the electronic supplement). The VSav and h spatial datasets are calculated from the Vs profile (Figure 2A) and total (post-glacial and glacial) sediment thickness (from over 10,000 lithology logs, not shown), respectively. We have not compiled and calculated the average of other soil properties for the upper 30 m (e.g., N60 and su). Therefore, we do not assign a seismic site class according to the other soil properties in this study. In addition, we are unable to incorporate classifications that are based on information other than the seismic site term parameters used in this study [i.e., Eurocode 8 class E and class X from Pitilakis et al. (2019) are ignored].
Figure 4 shows seismic microzonation maps for the four selected seismic site classification schemes, and an interpolation of the site classification data points is achieved using empirical Bayesian kriging. Table 2 reports the percentage of the area assigned by each site class in terms of the Greater Vancouver region’s area, which is further sub-divided in terms of each simplified geology unit’s area (outcropping rock, glacial or post-glacial sediments; see Figure 2). When the 2020 NBCC site classification based on Vs30 is used (Figure 4A), classes A and B are only found in Greater Vancouver’s higher elevation rock and thin soil over rock zones in the North Shore, which covers ∼24% of the region (Table 2). Class C relates to the upland portions of Vancouver, Burnaby, Surrey, and White Rock that have been glacially overridden and covered with glacial debris, as well as the transition from class B at a higher elevation to the shoreline (e.g., the southern North Shore). Site class D regions typically consist of sites at a lower elevation with tens of meters of deep post-glacial sediments. However, they also cover a larger area than anticipated in Surrey, Burnaby, and Vancouver. The majority of Greater Vancouver corresponds to classes C (26%) and D (26%) (Table 2). Class E (23% of Greater Vancouver, Table 2) is generally confined to the Fraser River Delta and Serpentine–Nicomekl valley lowlands, where Vs is lowest. Site class F is present in only 1% of the region (Table 2) as small patches in Richmond, Delta, and the Serpentine–Nicomekl valley. The dominance of harder site classes A and B corresponds to outcropping rock geology areas of the North Shore, classes C and D correspond dominantly to glaciated geology upland areas, and classes E–F dominate post-glacial geology present at shorelines and in the Fraser River Delta lowlands (Table 2). We note that a significant percentage of classes B and D also occurs in glacial and post-glacial geology areas, respectively.
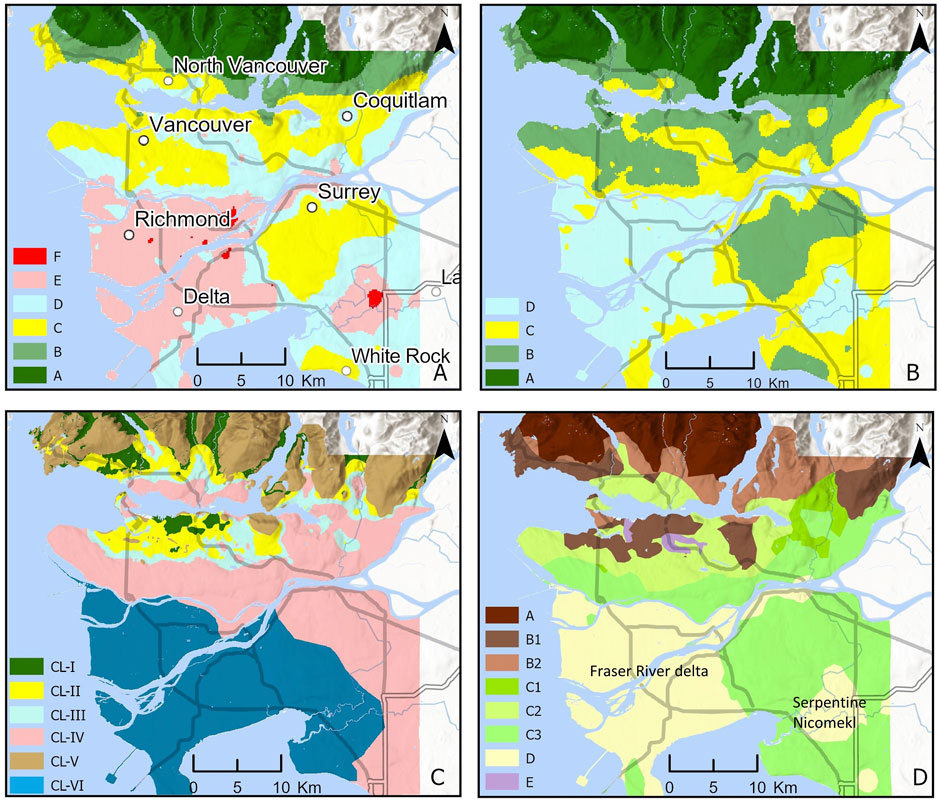
FIGURE 4. Spatial distribution of seismic site class based on Vs30 in the (A) 2020 NBCC, (B) Eurocode 8, (C) site period, and (D) a hybrid site classification proposed in revisions to Eurocode 8.
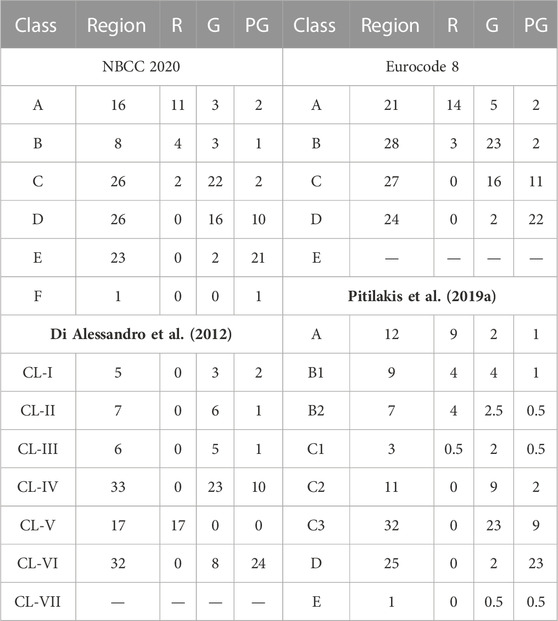
TABLE 2. Percentage (%) of each site class’s area within the Greater Vancouver region and its percentage (%) in terms of simplified geology unit [outcropping rock (R), glacial (G), and post-glacial (PG) sediments, as shown in Figure 2].
Figure 4B shows the Vs30-based seismic site classification of Greater Vancouver according to Eurocode 8. Overall, this is very similar in zonation to the Vs30-based classification of the 2020 NBCC (Figure 4A) but with different Vs30 ranges (see Supplementary Tables S1, S2) and, thereby, a general one classification shift higher. Class A rock conditions occupy 21% of Greater Vancouver, constrained to the North Shore, according to the Eurocode 8 classification scheme (Table 2). Eurocode 8 site classes B and C dominate the Greater Vancouver area, encompassing 28% and 27% of the region, respectively (Table 2). The softest Eurocode 8 site class D covers 24% of Greater Vancouver. Overall, the wider Vs30 scale of the 2020 NBC classification (Figure 4A) is more appropriate than the Eurocode 8’s Vs30 scale for the end-member site condition variance in Greater Vancouver (from soft post-glacial sediments to outcropping glaciated hard rocks).
Figure 4C displays the seismic site classification of Greater Vancouver based on the predominant site period determined from microtremor average horizontal-to-vertical spectral ratios. This site period classification scheme apparently results in a different seismic microzonation pattern compared to Vs30 (Figures 4A, B). The site period is controlled by VSav and h. Class V (flat HVSR) is assigned to only outcropping rock areas and encompasses 17% of the region (Table 2). Short-period classes I (<0.2 s) and II (0.2–0.39 s) occur predominately in glaciated geology areas, in the transition zone between North Short outcropping rocks and the shoreline, as well as in northern Vancouver and Burnaby, where rock is relatively shallow yet comprises only 12% of Greater Vancouver. Long-period class IV (≥0.6 s) and multiple peak class VI dominate the region (65%). Class IV is dominated by glacial geology in southern Vancouver and Burnaby, as well as Surrey, where these stiff glacial sediments are thick. In general, the site periods of the Fraser River Delta lowlands are significantly long (>2 s, Figure 2B) and may require the addition of a new site class category(ies). Di Alessandro et al.’s (2012) addition of class VI (multiple peaks) is applicable to a significant area of Greater Vancouver (32%), where two peak frequencies are observed in MHVSRs due to the shallower post-glacial and glacial impedance contrast and the deeper glacial and Georgia basin rock impedance contrast.
Figure 4D displays the application of the hybrid-based site classification scheme (Pitilakis et al., 2019) using VSav, T0, and h. Again, a different seismic microzonation map pattern is apparent, but there are similarities in select areas with zonation patterns based solely on Vs30 or site period classification (i.e., hybridization). Higher site classes (A–C1) constrained to the northern study area are consistent with thinner sediment thicknesses (shallower depth to rock). Classes B1 and B2 occur in transition zones from classes A to C1-3 in the North Shore and in northern Vancouver and Burnaby, dominated by shallow rock and glacial geology. Overall, the need for these two classifications (zones) also occurs in Vs30 and site period metrics (Figures 4A, B). Classes C2 and C3 occur primarily in glacial geology areas in southern Vancouver and Burnaby, as well as Surrey. The division of these two classes is not controlled by VSav (200–450 m/s) but by site period (shorter than 1.5 and 1.8 s, respectively) and h (20–60 m and >60 m, respectively). Overall, these hybrid classes (C2 and C3) are beneficial in subdividing the longer site period class IV area (compared to Figure 4C). The Fraser River Delta (Richmond and Delta) and Serpentine–Nicomekl valley (between Surrey and White Rock) lowlands correspond to class D. This relatively homogeneous classification (one zone; Figures 4C, D) is likely appropriate, although we are used to the two Vs30-based classifications (Figures 4A, B) simply because the VS30 of Fraser River Delta sediments is close to the 2020 NBC DE class boundary of 180 m/s (microzonation does not need two zones). Classes C1 (thick stiff sediments) and E (thin, soft sediments) are constrained to zones in northeastern Greater Vancouver (4% of the region, Table 2) that are not apparent from only Vs30 and site period classifications. This highlights the benefit of a hybrid site classification scheme to further subdivide zones based on stiffness and h (useful to differentiate thin and thick zones of both soft and stiff sediments).
5 Conclusion
A seismic microzonation study is underway for 16 municipalities, lands of 6 First Nations, and 1 Electoral Area in western Metro Vancouver. A comprehensive regional geodatabase has been compiled to achieve Metro Vancouver seismic microzonation mapping. This comprehensive geodatabase of in situ site characterization datasets has been compiled from in situ invasive logging and penetration methods from various public and classified data sources supplemented by abundant multi-method non-invasive seismic field data collection across the region. Seismic site characterization measures, such as Vs depth profiles, f0HV, and borehole lithology, are compiled in the regional geodatabase from which key seismic site term parameters (VSav, Vs30, T0, and h) can be determined. In this study, 810 VS30 values are determined from in situ Vs depth profiles and the conversion of CPT logs to Vs profiles via a region-specific empirical relation. Over 2,200 T0 values are determined from the lowest peak frequency of microtremor horizontal-to-vertical spectral ratio curves. We evaluated the average and one standard deviation variation of Vs30 and T0 for 17 local communities in Greater Vancouver to explore sub-regional differences in these seismic site term parameters. In northern Greater Vancouver, Pre-Tertiary Coast Mountain rocks are outcropping at the highest elevations and correspond to the highest Vs30 (>1,500 m/s) and shortest site periods (<0.2 s). In contrast, the lowest Vs30 and longest site periods are an average of 180 m/s and 3.1 s, respectively, in the Fraser River Delta and Serpentine–Nicomekl valley lowlands.
Subsequently, we applied four site classification schemes based on Vs30, T0, or a hybrid combination of seismic site characterization measures (VSav, T0, and h) to evaluate each scheme’s impact on communicating the region’s seismic site characterization. We found that both Vs30-based seismic site classification schemes, 2020 NBCC and Eurocode 8, result in a similar classification pattern (microzonation), but there is an overall shift to a higher site class when applying Eurocode 8. The 2020 NBC classification’s wider Vs30 scale is more appropriate for the end-member site condition variance in Greater Vancouver. We found that a site-period-based classification results in a different zonation pattern compared to Vs30. Our use of the site-period and amplification spectra classification scheme of Di Alessandro et al. (2012) with seven classes is beneficial to subdivide long-period sites (>0.6 s, class IV) with a single resonance peak from those with a second resonance peak (multi-peak, class VI), particularly in the Fraser River Delta lowlands. This could also be achieved by modifying or adding a new class to the Di Alessandro et al. (2012) scheme to differentiate the very long site periods of the Fraser River Delta lowlands (>2 s) (i.e., site periods are much longer than 0.6 s in Greater Vancouver). Finally, when a hybrid site classification scheme is used to perform seismic microzonation mapping, a different classification pattern is apparent but with similarities in select areas to mapping based solely on Vs30 or site period classification.
Regardless of the classification scheme, we found that outcropping rock areas are equally well-identified on the North Shore, and such classification corresponds to ∼20% of the Greater Vancouver region. The transition from outcropping rock to lowland areas is also consistently mapped into two classifications or zones by either Vs30 or T0. This results from classification schemes with four or more classes; however, it indicates that this discretization of classes is necessary to capture rapid variation in underlying seismic site conditions. The use of a hybrid site classification scheme with seven classes aids in subdividing glacial geology with different thicknesses and, thereby, site periods and glacial and post-glacial sediments that are thick and thin, respectively. The single site term parameter classification schemes (Vs30 or T0) encapsulate these three cases into one class; Vs30 cannot differentiate between these cases, and the four classes defined by site period ranges are too coarse. We also conclude that site period and hybrid classification schemes that categorize the Fraser River Delta lowlands as a single zone are more appropriate than a Vs30-based classification scheme with a class boundary serendipitously at the average Vs30 of the Fraser River Delta lowlands (∼180 m/s). This study provides a thorough understanding of seismic site characteristics in Greater Vancouver from the evaluation of seismic microzonation maps based on Vs30, site period, or hybrid-based seismic site classification approaches. We conclude that, at a minimum, the 2020 NBCC Vs30 and site period maps together or the hybrid classification map needs to be produced to fully communicate the variability and range of local seismic site conditions in the region and, thereby, the susceptibility to seismic hazard shaking. Although the generation and comparison of all three maps provided benefit to understanding local seismic site conditions in this study, the minimum number of maps to effectively communicate seismic hazards inclusive of local site effects to technical and non-technical end users is sought.
Data availability statement
Datasets that support the findings of this study will be made available through the Metro Vancouver Seismic Microzonation Project website at https://metrovanmicromap.ca. Requests to access the datasets should be directed to SM, c21vbG5hcjhAdXdvLmNh.
Author contributions
SA: conceptualization, writing–original draft, investigation, software, and data curation. SM: conceptualization, writing–review and editing, and resources. JW: review and editing. All authors contributed to the article and approved the submitted version.
Funding
Funding was provided by the Institute of Catastrophic Loss Reduction with the support of the BC Ministry of Emergency Management and Climate Readiness.
Acknowledgments
We are grateful to the 24 agencies, organizations, and/or persons that shared their geodata for the Metro Vancouver seismic microzonation mapping project. The geodatabase is curated and managed by SA (first author) with Alex Bilson Darko (project manager), the support of Ranjana Ghimire and Rozhan Raoufi (research assistants), and the part-time support by the University of Western Ontario (UWO) students—Andrew Beney, Jacob Edgett, Tyler Beattie, and Congxi Zhu. Non-invasive field measurements were collected and processed by UWO personnel: Alex Bilson Darko (project manager), SA (Ph.D., Earth Sciences and Hazards, Risk, and Resilience), Jamal Assaf (Ph.D., Civil Engineering), Chris Boucher (MSc, Earth Sciences), Meredith Fyfe (MSc, Earth Sciences and Env. Sustainability), Aamna Sirohey (MSc, Earth Sciences), Sameer Ladak (MSc, Earth Sciences), Magdalena Kapron (MSc, Earth Sciences), Natalia Gomez Jaramillo (MSc, Earth Sciences) with field support from Alireza Javanbakht Samani (Ph.D., Earth Sciences), Ali Fallah Yeznabad (Ph.D., Civil Engineering), Thomas Foulon (Ph.D., U. Waterloo), and the University of British Columbia undergraduate summer students, Azhar Izman and Youssef Shaaban (2019, 2020) and Rachel Choboter and Christie Tsang (2019).
Conflict of interest
The authors declare that the research was conducted in the absence of any commercial or financial relationships that could be construed as a potential conflict of interest.
Publisher’s note
All claims expressed in this article are solely those of the authors and do not necessarily represent those of their affiliated organizations or those of the publisher, the editors, and the reviewers. Any product that may be evaluated in this article, or claim that may be made by its manufacturer, is not guaranteed or endorsed by the publisher.
Supplementary material
The Supplementary Material for this article can be found online at: https://www.frontiersin.org/articles/10.3389/feart.2023.1221234/full#supplementary-material
References
Adams, J., and Halchuk, S. (2004). A review of NBCC 2005 seismic hazard results for Canada—The interface to the ground and prognosis for urban risk mitigation. Available at: http://geogratis.cgdi.gc.ca/download/part6/ess_pubs/226/226349/gip_062.pdf.
Adhikari, S. R., Molnar, S., Ghofrani, H., and Wang, J. “Region specific vs 30 across Metro Vancouver and impact to seismic design ground motions,” in Proceedings of the 74th Canadian Geotechnical Conference, Niagara Falls, Ontario, September 2021a.
Adhikari, S. R., Molnar, S., and Wang, J. (September 2021b). Significance of geodatabase development for seismic microzonation in Metropolitan Vancouver, Canada. Proceedings of the 17th World Conf. Earthq. Eng. Sendai, Japan. doi:10.4095/298718
Assaf, J., Molnar, S., and El Naggar, M. H. (2023). CPT-Vs correlations for post-glacial sediments in Metropolitan Vancouver. Soil Dyn. Earthq. Eng. 165, 107693. doi:10.1016/j.soildyn.2022.107693
Assaf, J., Molnar, S., El Naggar, M. H., and Sirohey, A. (2022). Seismic site characterization in Fraser River delta in metropolitan vancouver. Soil Dyn. Earthq. Eng. 161, 107384. doi:10.1016/j.soildyn.2022.107384
Assaf, J. (2022). “Seismic site characterization and response in metropolitan vancouver,”. Electronic Thesis and Dissertation Repository,9035 (Ontario campus, Canada: Western Libraries).
Bard, P.-Y. (2008). The H/V technique: Capabilities and limitations based on the results of the SESAME project. Bull. Earthq. Eng. 6, 1–2. doi:10.1007/s10518-008-9059-4
Borcherdt, R. D. (1994). Estimates of site-dependent response spectra for design (methodology and justification). Earthq. Spectra 10, 617–653. doi:10.1193/1.1585791
Borcherdt, R. D. “VS30 – a site-characterization parameter for use in building codes, simplified earthquake resistant design, GMPEs, and ShakeMaps,” in Proceedings of the 15Th World Conference on Earthquake Engineering, Lisbon, Portugal, September 2012.
Boucher, C. (2022). “Approaches to model non-uniqueness and site complexity for non-invasive shear-wave depth profiling,”. Electronic Thesis and Dissertation Repository,9035 (Ontario campus, Canada: Western Libraries).
BrittonHarris, J. B., Hunter, J. A., Luternauer, J. L., Britton, J. R., and Harris, J. B. (1995). The bedrock surface beneath the Fraser River delta in British Columbia based on seismic measurements. Curr. Res. 1995-E, Geol. Surv. Can., 83–89.
Castellaro, S., Mulargia, F., and Rossi, P. L. (2008). Vs30: Proxy for seismic amplification?. Seismol. Res. Lett. 79, 540–543. doi:10.1785/gssrl.79.4.540
Ccbfc, , and Nrcan, (2022). Canadian commission on building and fire codes, and natural resources Canada. ‘Seismic hazard data: NBC 2020, Part 4. Ottawa, Ontario, Canada: National Research Council of Canada. doi:10.4224/w324-hv93
Cen, (2004). Eurocode 8: Design of structures for earthquake resistance-part 1: General rules, seismic actions and rules for buildings. Bruss. Eur. Comm. Stand.
Cen, (2021). Eurocode 8: Earthquake resistance design of structures. EN1998–1–1 working draft N1017 18–02–2021. Maastricht, Netherlands: The European Union.
Christian, H. A., Monahan, P. A., and Barrie, J. V. (1994). Deep hole geotechnical investigation adjacent to the BC hydro canoe pass submarine cable terminal, Fraser River delta, British Columbia. Geol. Surv. Can. Openfile 2, 72.
Cox, B. R., Cheng, T., Vantassel, J. P., and Manuel, L. (2020). A statistical representation and frequency-domain window-rejection algorithm for single-station HVSR measurements. Geophys. J. Int. 221, 2170–2183. doi:10.1093/gji/ggaa119
Cultrera, G., Cornou, C., Di Giulio, G., Bard, P. Y., Di, G., Pierre, G., et al. (2021). Indicators for site characterization at seismic station: Recommendation from a dedicated survey. Bull. Earthq. Eng. 19, 4171–4195. doi:10.1007/s10518-021-01136-7
Dai, Z., Li, X., and Hou, C. (2013). A shear-wave velocity model for VS30 estimation based on a conditional independence property. Bull. Seismol. Soc. Am. 103, 3354–3361. doi:10.1785/0120130025
Di Alessandro, A., Luzio, D., Martorana, R., and Capizzi, P. (2016). Selection of time windows in the horizontal-to-vertical noise spectral ratio by means of cluster analysis. Bull. Seismol. Soc. Am. 106, 560–574. doi:10.1785/0120150017
Di Alessandro, C., Bonilla, L. F., Boore, D. M., Rovelli, A., and Scotti, O. (2012). Predominant-period site classification for response spectra prediction equations in Italy. Bull. Seismol. Soc. Am. 102, 680–695. doi:10.1785/0120110084
Di Giulio, G., Ercoli, M., Vassallo, M., and Porreca, M. (2020). Investigation of the Norcia basin (Central Italy) through ambient vibration measurements and geological surveys. Eng. Geol. 267, 105501. doi:10.1016/j.enggeo.2020.105501
Farrugia, J. J., Atkinson, G. M., and Molnar, S. (2018). Validation of 1D earthquake site characterization methods with observed earthquake site amplification in Alberta, Canada. Bull. Seismol. Soc. Am. 108, 291–308. doi:10.1785/0120170148
Fyfe, M., and Molnar, S. (2020). Evaluating the use and communication of seismic hazard maps: A case study of Metro vancouver, British Columbia, Canada, risk 2020 conference, 12th international conference on risk analysis and hazard mitigation, lisbon, Portugal, 23-25 june 2020. WIT Trans. Eng. Sci. 129, 157–168. doi:10.2495/RISK200141
Gallipoli, M. R., and Mucciarelli, M. (2009). Comparison of site classification from VS30, VS10, and HVSR in Italy. Bull. Seismol. Soc. Am. 99, 340–351. doi:10.1785/0120080083
Hassani, B., and Atkinson, G. M. (2016). Applicability of the site fundamental frequency as aV<i>S</i>30Proxy for central and eastern North America. Bull. Seismol. Soc. Am. 106, 653–664. doi:10.1785/0120150259
Hunter, J. A., and Christian, H. A. “Use of shear wave velocities to estimate thick soil amplification effects in the Fraser River delta, British Columbia,” in Proceedings of the Symposium on the Application of Geophysics to Engineering and Environmental Problems, Denver, Colorado, March 2001. doi:10.4133/1.2922943
Kolaj, M., Halchuk, S., Adams, J., and Allen, T. I. (2020). Sixth generation seismic hazard model of Canada: Input files to produce values proposed for the 2020 national building code of Canada. Geol. Surv. Can. Open File 8630, 15. doi:10.4095/327322
Ladak, S. (2020). “Western Earthquake site characterization of rock sites in Eastern Canada and stiff ground sites in Vancouver, British Columbia,”. Electronic Thesis and Dissertation Repository,6972 (Ontario campus, Canada: Western Libraries).
Leboeuf, D., Perret, D., Nollet, M. J., Lamarche, L., Nastev, M., and Parent, M. (2013). Microzonage sismique des villes de Québec-Ancienne-Lorette et réserve indienne Wendake(catégories d’emplacement), Québec. Geol. Surv. Can. Open File 6875. doi:10.4095/292640
Lee, V. W., and Trifunac, M. D. (2010). Should average shear-wave velocity in the top 30m of soil be used to describe seismic amplification?. Soil Dyn. Earthq. Eng. 30, 1250–1258. doi:10.1016/j.soildyn.2010.05.007
Luternauer, J. L., Barrie, J. V., Christian, H. A., Clague, J. J., Evoy, R. W., Hart, B. S., et al. (1994). Fraser River delta: Geology, geohazards and human impact. Geol. Surv. Can. Bull. 481, 197–220.
Mihaylov, D. G. (2011). “Seismic microzonation of Great Toronto Area and influence of building resonances on measured soil responses,”. Electronic Thesis and Dissertation Repository,306 (Ontario campus, Canada: Western Libraries).
Molnar, S., Assaf, J., Sirohey, A., and Adhikari, S. R. (2020). Overview of local site effects and seismic microzonation mapping in Metropolitan Vancouver, British Columbia, Canada. Eng. Geol. 270, 105568. doi:10.1016/j.enggeo.2020.105568
Molnar, S., Cassidy, J. F., Castellaro, S., Cornou, C., Crow, H., Hunter, J. A., et al. (2018). Application of microtremor horizontal-to-vertical spectral ratio (MHVSR) analysis for site characterization: State of the art. Surv. Geophys. 39, 613–631. doi:10.1007/s10712-018-9464-4
Molnar, S., Sirohey, A., Assaf, J., Bard, P. Y., Castellaro, S., Cornou, C., et al. (2022). A review of the microtremor horizontal-to-vertical spectral ratio (MHVSR) method. Netherlands: Springer. doi:10.1007/s10950-021-10062-9
Monahan, P. A., Levson, V. M., McQuarrie, E. J., Bean, S. M., Henderson, P., and Sy, A. (2000). Relative Earthquake Hazard Map of Greater Victoria showing areas susceptible to amplification of ground motion, liquefaction and earthquake-induced slope instability. Br. Columbia Geol. Surv. Minist. Energy Mines, Geosci. Map.
Monahan, P. (2005). Soil hazard map of the Lower Mainland of British Columbia for assessing the earthquake hazard due to lateral ground shaking. Available at: https://www.caee.ca/9CCEEpdf/School retrofit papers/Vancouver_Hazard_Mapping_600dpi_revised.pdf.
Monger, J. W. H., and Journeay, J. M. (1994). Basement geology and tectonic evolution of the Vancouver region. Bull. - Geol. Surv. Can. 481, 3–25. doi:10.4095/203245
Motazedian, D., Hunter, J. A., Pugin, A., and Crow, H. (2011). Development of a vs 30 (NEHRP) map for the city of Ottawa, Ontario, Canada. Can. Geotech. J. 48, 458–472. doi:10.1139/T10-081
Myriam, B., Kristel, M. F., Jaime, A., Didier, B., Agathe, R., Santiago, M., et al. (2018). Combined geophysical and geotechnical approaches for microzonation studies in Hispaniola Island. Geosci 8, 336–415. doi:10.3390/geosciences8090336
Nastev, M., Parent, M., Benoit, N., Ross, M., and Howlett, D. (2016). Regional VS30 model for the St. Lawrence lowlands, eastern Canada. Georisk 10, 200–212. doi:10.1080/17499518.2016.1149869
Nbcc, (2015). National building code of Canada 2015 volume 1 and 2 issued by the Canadian commission on building and fire codes national research council of Canada. NRCC 56190. Ottawa: National research council Canada Institute for research in construction Canadian commission on building and fire codes. Available at: https://publications.gc.ca/collections/collection_2019/cnrc-nrc/NR24-28-2018-eng.pdf.
Nehrp, (1994). Recommended provisions for seismic regulations of new buildings: Part 1, provisions. FEMA 222A. Washington, D.C, United States: Federal Emer- gency Management Agency.
Pitilakis, K., Riga, E., Anastasiadis, A., Fotopoulou, S., and Karafagka, S. (2019). Towards the revision of EC8: Proposal for an alternative site classification scheme and associated intensity dependent spectral amplification factors. Soil Dyn. Earthq. Eng. 126, 105137. doi:10.1016/j.soildyn.2018.03.030
Pitilakis, K., Riga, E., and Anastasiadis, A. (2013). New code site classification, amplification factors and normalized response spectra based on a worldwide ground-motion database. Bull. Earthq. Eng. 11, 925–966. doi:10.1007/s10518-013-9429-4
Rodríguez-Marek, A., Bray, J. D., and Abrahamson, N. A. “A geotechnical seismic site response evaluation procedure,” in Proceedings of the 12th World Conference of Earthquake Engineering, Auckland, New Zeland, 2000, 1–8.
Rogers, G. C., Cassidy, J. F., and Weichert, D. (1998). Variation in earthquake ground motion on the Fraser delta from strong-motion seismograph records. Geol. Nat. Hazards Fraser River delta, Br. Columbia. D.C. Mosher Geol. Surv. Can. Bull. 5, 195–210.
Rosset, P., Bour-Belvaux, M., and Chouinard, L. (2015). Microzonation models for Montreal with respect to $$\hbox {V}_\mathrm{S30}$$ V S 30. Bull. Earthq. Eng. 13, 2225–2239. doi:10.1007/s10518-014-9716-8
Salsabili, M., Saeidi, A., Rouleau, A., and Nastev, M. (2021). Seismic microzonation of a region with complex surficial geology based on different site classification approaches. Geoenvironmental Disasters 8, 27. doi:10.1186/s40677-021-00198-8
Sirohey, A. A. (2022). “Soil amplification and peak frequencies from thousands of passive seismic measurements across Metro vancouver, British Columbia, Canada,”. Electronic Thesis and Dissertation Repository,8810 (Ontario campus, Canada: Western Libraries).
SM Working Group (2015). “Guidelines for seismic microzonation,” in Civil protection department and conference of regions and autonomous provinces of Italy (Italy: SM Working Group).
Stanko, D., and Markušić, S. (2020). An empirical relationship between resonance frequency, bedrock depth and VS30 for Croatia based on HVSR forward modelling. Nat. Hazards 103, 3715–3743. doi:10.1007/s11069-020-04152-z
Tc4-Issmge, (1999). Manual for zonation on seismic geotechnical hazard, revised edition. Japan: Technical committee for earthquake geotechnical engineering (TC4) of the international society of soil mechanics and geotechnical engineering (ISSMGE), 209. Available at: https://books.google.ca/books?id=Yd-9oAEACAAJ.
Keywords: Vs30, shear-wave velocity, ambient vibrations, seismic microzonation, site period, soil amplification, site classification, building code
Citation: Adhikari SR, Molnar S and Wang J (2023) Seismic microzonation mapping of Greater Vancouver based on various site classification metrics. Front. Earth Sci. 11:1221234. doi: 10.3389/feart.2023.1221234
Received: 12 May 2023; Accepted: 18 July 2023;
Published: 02 August 2023.
Edited by:
Yoshiya Oda, Tokyo Metropolitan University, JapanReviewed by:
Chisato Konishi, Oyo Corporation, JapanAntonio Garcia Jerez, University of Almeria, Spain
Copyright © 2023 Adhikari, Molnar and Wang. This is an open-access article distributed under the terms of the Creative Commons Attribution License (CC BY). The use, distribution or reproduction in other forums is permitted, provided the original author(s) and the copyright owner(s) are credited and that the original publication in this journal is cited, in accordance with accepted academic practice. No use, distribution or reproduction is permitted which does not comply with these terms.
*Correspondence: Sheri Molnar, c21vbG5hcjhAdXdvLmNh; Sujan Raj Adhikari, c2FkaGlrYTZAdXdvLmNh