Abstract
Floods pose a significant threat to the safety of countries with severe societal, economic, and environmental consequences, especially the flash floods in mountainous regions. Previous studies have shown that many floods were caused by intense rainfall with highly saturated soil. In this study, we applied a physically-based distributed hydrological model (Integrated Hydrology Model, InHM) to a warm humid mountainous catchment in Southwest China, the Shouxi River. The main objective of our research is to investigate the relative importance of rainfall and antecedent soil moisture on flood generation in our study region. Our results show that an increase in rainfall return period and antecedent soil saturation ratio significantly increased peak flow and shortened peak time. There is a correlation between the ratio of antecedent soil saturation ratio to rainfall (SPR) and peak flow. When SPR <1, there is a positive correlation; when SPR >1, there is a negative correlation. Additionally, with the increase in drainage area, the relative importance of rainfall tends to decrease, while the relative contribution of soil saturation ratio tends to increase. The findings could provide support for the determination of the dominant factors influencing runoff generation in humid regions, offering scientific support for the timely and effective flood prevention and mitigation measures in mountainous regions.
1 Introduction
Floods are usually caused by sudden rainstorms or massive snowmelt and are one of the most common natural disasters in the world (Zhong et al., 2021). As the issue of climate change intensifies, flood risks have increased significantly in recent years, posing serious threats to public safety and property. This ultimately results in severe economic and social disruptions to countries (Soo et al., 2019). In mountainous catchments of a few hundred square kilometers or less, flash floods with short response time and heavy rain is tended to be aggravated due to natural and anthropogenic activities (Zhai et al., 2018). In China, the mortality caused by flash flood reached 4540, occupying 80% of that caused by floods from 2010 to 2014 (http://www.mwr.gov.cn/zzsc/tjgb/zgshzhgb/2014/mobile/index.html), according to the bulletin of flood and drought disaster in China of 2014. Flash flood, along with water-induced hazards, geological and hydrological conditions, have become a global issue, particularly in the mountainous regions of southwest China (Gan et al., 2018).
Generally, the causes of floods are complex and include both anthropic and natural factor, such as climate change and landscape change. Climate change is highly likely to alter flood hazards (Arnell and Gosling, 2016). As the climate warms, occurrence of extreme rainfall events is likely to increase (Min et al., 2011), elevating the flood risk (Milly et al., 2002; Pall et al., 2011). Numerous studies have shown that extreme precipitation has intensified across continents, and extreme precipitation is a major cause of catastrophic flooding (Guha-Sapir et al., 2013; Guha-Sapir et al., 2014). Bertola et al. (2021) suggested that in northwestern Europe, extreme rainfall contributed significantly to positive changes in floods, with an increase of 2.8%–3.3% in flood frequency per decade of return period. However, some studies have also shown that the trend of increasing extreme precipitation does not directly translate into positive trends in large catchments (Madsen et al., 2014; Sharma et al., 2018). This suggests that there are other factors that modulate the flood response, such as antecedent soil moisture.
It has been observed that flood variability can poorly explained by rainfall characteristics alone (Berghuijs et al., 2016), and one of the most likely culprits is the antecedent soil moisture of the catchment (Pathiraja et al., 2012). Landscape change has a strong impact on floods because of the severe human alteration of the natural landscape. Deforestation can increase or decrease antecedent soil moisture and trigger erosion (Rogger et al., 2017). Event runoff coefficients tend to be higher when antecedent soil moisture reaches a high level, increasing flood peak in dry catchments (Borga et al., 2007; Vivoni et al., 2007). Grillakis et al. (2016) used the Kampus model to estimate the sensitivity of flood discharge to antecedent soil moisture and found that small-event floods show greater sensitivity to antecedent soil moisture than large-event magnitude. Sriwongsitanon and Taescombat (2011) found that for small events, the hydrological response in forest area was lower in the non-forested by comparing forested and non-forested areas. However, for large events, the hydrological response in forest area was greater.
Therefore, understanding the relative importance of rainfall and antecedent soil saturation ratio and their impacts on a range of catchment scales and event magnitudes plays an important role in flood forecasting. Pathiraja et al. (2012) used a continuous rainfall runoff model to calibrate 45 catchments in the Murray-Darling Basin, and found that correctly simulating antecedent soil moisture can greatly improve simulation accuracy. Flood frequency curve was steeper than rainfall frequency curve in dry catchments (Breinl et al., 2021). Antecedent soil moisture was also found with a significant effect on rainfall thresholds for flash flood warning (Zhai et al., 2018). Wasko and Nathan (2019) identified a tipping point in rainfall: beyond which watershed rainfall dominated flood response and below this point, flood discharge decreased as the soil moisture reduced. Although there are many researches about the joint role of rainfall and antecedent soil moisture, few of them focus on the relative contribution of rainfall and antecedent soil saturation ratio.
The formation mechanisms of floods are different on different scales (Blöschl, 2022). It is necessary to study the scale effects on flood generation. In large catchments (>1000 km2), flood discharge is more influenced by antecedent soil moisture, whereas in smaller catchments (<1000 km2), flood discharge is more likely to be caused by precipitation (Wasko and Sharma, 2017). Furthermore, Nikolopoulos et al. (2011) studied on three watershed (24, 165, and 329 km2) and also found that flood responses were more sensitive to antecedent soil moisture for increasing catchment scale. Many studies have identified the importance of rainfall and antecedent soil moisture, yet not much specifically focused on the quantitative evaluation of the relative contribution of rainfall and antecedent soil moisture, and their variation with spatial scales, especially in humid China where floods have been one of the major natural hazards for centuries.
Here we conducted numerical analysis in a humid mountainous catchment in Southwest China (Shouxi River), the goals of this study are to: (1) examine the impact of rainfall and antecedent soil saturation ratio on runoff generation, and the potential mechanisms that cause these effects; (2) investigate the relative importance of rainfall and soil saturation ratio in different catchment scales; (3) explore scale effects on rainfall and soil saturation ratio.
2 Material and methods
2.1 Study area
The Shouxi River catchment (SXRC), located in the southwest mountainous area of China (103°02′-103°27′ E, 30°47′-31°02′ N) (Figure 1A), is a small tributary of the Minjiang River. SXRC is situated at the transitional zone between the Sichuan Basin and the Qinghai-Tibet Plateau. The elevation gradually decreases from southwest to northeast, ranging from approximately 5000 m in the Qinghai-Tibet Plateau to 900 m in the Sichuan Basin. The catchment covers an area of approximately 560 km2 and presents a fan-shaped topography. The climate of the SXRC is subtropical humid climate, with significant vertical temperature differences. The average slope in the catchment is 32.5°, and the annual mean temperature is 15.2°C (Liu, 2022). Average annual precipitation is about 1134 mm, with most of it occurring between June and September (Liu et al., 2021). The geological structure of the catchment is complex, with developed folds and faults. The upstream valley has a “V" shape, while the middle and downstream valleys are slightly broader with a “U" shape. Some sections of the river have developed joints and fissures, with strong tectonic erosion and river cutting activities (Yuan et al., 2022).
FIGURE 1

(A) Location of the study area; (B) the configuration of the numerical mesh used in this study.
The floods in the SXRC are mainly caused by heavy rainfall. Correspondingly, the flood season in the study area is from June to September. The annual maximum floods are particularly concentrated between July and August. The slopes within the river basin are steep, leading to rapid rise and fall of floods (Yin et al., 2022). For example, Wenchuan County experienced severe torrential rain in 20 August 2019, with the maximum cumulative rainfall reaching 65 mm within 1 hour. The discharge in Shouxi River reached 1840 m3/s within 3 h. The whole flood event lasted for 5 days, causing large-scale flooding and geological disasters, and significant personnel and property losses (Yang et al., 2022). In addition, the SXRC is located near the epicenter of the 2008 Mw=7.8 Wenchuan earthquake. After the earthquake, there are frequent occurrences of landslides, mudslides and other geological disasters, with serious damage to vegetation and loose sediments. As a result, the likelihood of mountain floods and debris flows increased.
2.2 Model structure
This study uses the physically-based distributed hydrological model InHM (Integrated Hydrology Model), which is originally developed by Vanderkwaak of Waterloo University (1999). InHM simulates water and solute in three-dimensional dual continua subsurface as well as two-dimensional surface and river flow.
The 3D variably saturated fluid motion and macroporous fluid motion in subsurface pore media are described by Richard’s equation, which degenerates to Darcy’s formula in the saturated state: Where (m/s) is Darcy flux, (s-1) is the water rate between surface and subsurface soil, (s-1) is the input/output terms on the boundary, (-) and (-) are volume and area fraction associated with each continuum respectively, (-) is soil porosity, (-) is water saturation, (s) is time. The Darcy flux is given by:Where (-) is relative permeability, (kg/(m·s)) is viscosity of water, (-) is intrinsic permeability vector, (m)is pressure head (m) is elevation head. The surface water flow motion (both open channel flow and slope flow) in InHM is described using the diffusive wave approximation of the two-dimensional shallow water equation. The surface water flow motion equation is defined as:Where (-) is surface saturation, (m) is the average height of surface microtopography, (-) is stored surface water depth, (-) is mobile surface water depth, (m/s) is surface water velocity, (m) is surface coupling length scale, and the surface water velocity in Eq. 3 can be given by: Where n (s·m-1/3) is the Manning’s surface roughness tensor, (-) is the energy slope.
InHM uses the Finite Volume Element (FVE) method to discretize the control equations and employs the Newton iteration method to solve the nonlinear equations in an implicit manner. More details about the governing equations can be found in VanderKwaak (1999) and Loague and VanderKwaak (2002). The model can provide hydrological information at any time and location within the entire drainage area (i.e., soil moisture, soil saturation ratio, water depth, cross-sectional runoff process line) or the dynamic changes in hydrological information during the operation of any node, making it suitable for this theoretical analysis (Su, 2012). It has been applied to different catchments and terraces, validated for runoff generation (Ran et al., 2019a; Ran et al., 2019b; Ran et al., 2020), as well as sediment movement simulation (Ran et al., 2012; Ran et al., 2018). It has also been applied to nearby watershed of similar characteristics, and proved its suitability on the study region (Liu et al., 2021).
2.3 Mesh configuration
The 2D surface mesh for the SXRC is shown in Figure 1B, and the 3D mesh was constructed by adding layers. Given that soil moisture fluctuates more strongly in the surface layer and most of the water eventually converges in the river channel, the resolution of the mesh was set to increase from the boundary to the river channel and from upper soil layers to lower soil layers. The mesh boundary resolution, channel resolution, and exit resolution of the SXRC are about 1000 m, 50 m, and 20 m, respectively. The vertical profile was generally divided into the surface layer (0–1 m), the middle layer (1–3 m), and the deep layer (3–13 m) with the nodal spacing of 0.2 m, 0.5 m and 2.5 m.
2.4 Model set up
The objective of this study is to investigate how antecedent soil saturation ratio and rainfall return period affect runoff generation in humid mountainous catchment. The DEM data used in the study was from the Geospatial Data Cloud (https://www.gscloud.cn/sources/accessdata/310?pid=302), with a spatial resolution of 30 m. The rainfall and runoff data used for model calibration and validation were obtained from the measured hourly rainfall and runoff in the SXRC. Rainfall data was obtained from hourly measurements between 4 June 2019 and 5 August 2020. Runoff data was obtained from hourly measurements at the outlet of the catchment during the main flood season (June to September) in both 2019 and 2020. Since our study focused on event scale research, three relatively large events with complete rainfall and runoff data were selected for calibration and validation. The model was calibrated with event during July 9–14, 2019; while events from July 16–20, 2019 and June 23–29, 2020 were used for validation.
Figure 2 illustrates the comparison between the observed and simulated hydrograph used for model calibration and validation. As we can see from Figure 2, the model captured the flow event relatively well during both calibration and validation periods, especially during the high flow period, which is the focus of this study. The criterion used to measure model performance was Nash coefficient (NS) (Nash and Sutcliffe, 1970) and R2. During the calibration period, the NS and R2 values reached 0.65 and 0.76, respectively. During the validation period, the NS and R2 values averaged 0.715 and 0.83, respectively. Given the goal of this study, we think the simulation results were acceptable for our theoretical analyses of the large flow events in this study.
FIGURE 2

Comparison between observed and simulated discharge during the (A) calibrated event (July 9—14 July 2019) and two validated events (B) July 16—20, 2019), and (C) June 23–29, 2020. The black line represents the simulated hydrograph, and the blue points represent observed discharge.
2.5 Scenarios
To fully understand the influence of runoff generation in mountainous catchment, a series of scenarios were designed with varying return periods and antecedent soil saturation ratio. According to the Flood Manual in Small and Medium-sized Watersheds of Sichuan Province (Department of Water Resources of Sichuan Province, 1984), we applied 6 rainfall return periods ranging from 5 years to 1000 years (5, 10, 50, 100, 500, 1000 years), lasting for 6 hours with constant rainfall intensity. In addition, to examine the effects of antecedent soil moisture, the saturation ratio level was set at 40%, 50%, 60%, 70%, 80%, and 90%. Totally, there were 36 scenarios (i.e., 6 rainfall return periods × 6 antecedent soil saturation ratio) in this study.
Given the impact of scale effects, 27 flow monitoring points were set up in different sections of the SXRC. The drainage areas ranged from a few square kilometers to several hundred square kilometers, covering small catchments to large catchments. The mean topographic gradient varied from 29° to 37°, with a major concentration in the 33°–35° range. Results from these observation points were used to investigate the synergetic effects on runoff generation for different rainfall, antecedent soil saturation ratio and catchment scales.
We explored the relationship between rainfall return period and antecedent soil saturation ratio to peak flow under 36 scenarios (6 rainfall return periods × 6 antecedent soil saturation ratio) (Section 3.1). To investigate the scale effects (Section 3.2), we calculated the relationship between rainfall return period, antecedent soil saturation ratio and drainage area at 27 flow monitoring spots across the catchment, using 50% saturation ratio and 100-year-event rainfall return period as reference. To further explore the relative contribution of rainfall and antecedent soil saturation ratio (Section 3.3), we combined all drainage areas, rainfall return periods, and soil saturation ratio for investigation, that is, a total of 972 relationships (6 rainfall return periods × 6 antecedent soil saturation ratio × 27 drainage areas).
2.6 Quantification the relative contribution of soil saturation ratio and rainfall
To measure the effects of rainfall and soil saturation ratio on flood generation, we introduced the ratio of saturation ratio to event rainfall (SPR). We expressed the relative saturation of soil moisture by normalizing the antecedent soil saturation ratio (S′) with the maximum and the relative intensity of rainfall by normalizing the event rainfall (P′) with the maximum. The impact of soil moisture and rainfall is expressed through the ratio of these two normalizations, i.e., SPR = S’/P’.
To investigate the impacts of rainfall and antecedent soil saturation ratio for peak flow discharge, relative importance was defined as the proportional contribution to the determination coefficient (R2) of the regression between peak flow and rainfall and soil saturation ratio. The method proposed by Lindeman, Merenda and Gold (LMG) (Sen et al., 1981) in the R package “reliaimpo” was used. This metric decomposes R2 into non-negative contributions, summing up the total R2, considering the unique contribution of the variable itself and the increased contribution when combined with other variables (Johnson and Lebreton, 2004). It is based on sequential R2, which handles dependencies on ranking by taking an unweighted average over the rankings (Grömping, 2006). The R2 of a model with regression in set S is:Where Model SS is the regression sum of squares that includes the regressors, Total SS is the total sum of squares. The order of regression variables is denoted by the permutation of regressors x1, …, xp, with subscripts r = (r1, …, rp) in the form of a tuple. Sk(r) represents the set of regression variables that enter the model at order r before xk. The portion of R2 assigned to xk can be expressed as:
The metric LMG can be written as:
3 Results
3.1 Floods response to rainfall and antecedent soil saturation ratio
Figure 3A presents the peak flow under different antecedent soil saturation ratio and return period. As we can see, the peak flow under all six return periods increased with soil saturation ratio. The peak flow with high soil saturation ratio was much greater than the scenario with low saturation ratio. The increment in peak flow was gradual when the antecedent saturation ratio was low (40%–60%), and increased rapidly when the antecedent saturation ratio was higher (70%–90%). The change with antecedent saturation ratio was more significant in the 1000 years return periods. Although larger rainfall leads to larger peak flow, the variability of peak flow with different rainfall return periods was minimal at 40% soil saturation ratio. The peak flow increased with rainfall return period, and reached its highest point at 90% soil saturation ratio: the difference in peak flow between 5-year-event and 1000-year-event was 4100 m3/s. This is due to the fact that when the antecedent soil saturation is low, soil water storage consumes the majority of the rainfall, with only a small portion of it actually generates runoff. It is evident from Supplementary Figure S1 that the peak flow increased with return period rapidly first and the increment slowed down afterwards.
FIGURE 3

The (A) peak flow and (B) peak time at different antecedent soil saturation ratio and rainfall return periods. The color represents the rainfall return period.
Figure 3B illustrates the variation of peak time with antecedent soil saturation ratio and rainfall return period. As we can see, the peak time declined with antecedent soil saturation ratio and return period. Simultaneously, the peak time tended to stabilize, especially when the return period was large (100–1000 years). In contrast to the peak flow, which was more sensitive to large rainfall and higher saturation ratio, peak time was more sensitive at small return period and low antecedent soil saturation ratio. For 5-year-event and 1000-year-event, a half rise in soil saturation led to 4/5 and 1/2 decrease in peak time, respectively; while for the 40% and 90% soil saturation ratio scenario, peak time decreased by 0.6 and 0.15 as the return period raised from 5 years to 1000 years. Antecedent soil saturation ratio and rainfall return period affect runoff generation together. As shown in Figure 4A the peak flow was small regardless of the rainfall amount when the soil was relatively dry. When the soil saturation ratio exceeded 70%, even small return period could result in large peak flow. With the increase of rainfall return period, the impact of soil saturation ratio on peak flow gradually increased. The peak time was very large (up to 32 h) with low soil saturation ratio and small rainfall return period (Figure 4B), which may be due to the fact that the soil is not fully saturated at this time.
FIGURE 4

Contour map of antecedent soil saturation ratio and rainfall return period. (A) peak flow, (B) peak time.
3.2 Scale effects on runoff generation
Scale effect has been identified in flood generation (Blöschl, 2022). Here we explored how the impacts of antecedent saturation ratio and rainfall magnitudes vary with scales by taking 50% antecedent soil saturation ratio and 100-year rainfall return period as base case. Figure 5 presents the peak flow and peak time under different rainfall return periods and antecedent soil saturation ratio with various drainage area. We can see that the peak flow and peak time were positively correlated with the drainage area, but there was great variation for small and medium catchments (100—300 km2) (Figure 5A). The reason for this was that small and medium catchments were located at various tributaries and influenced by local topography (e.g., slopes), whereas large catchments (the last four points) were at the main steam of the catchment. The scale effect of peak flow was more significant under higher rainfall return period and antecedent soil saturation ratio. In contrast, with the increase of return period and antecedent soil saturation ratio, the variation in peak time gradually decreased with the change of drainage area.
FIGURE 5
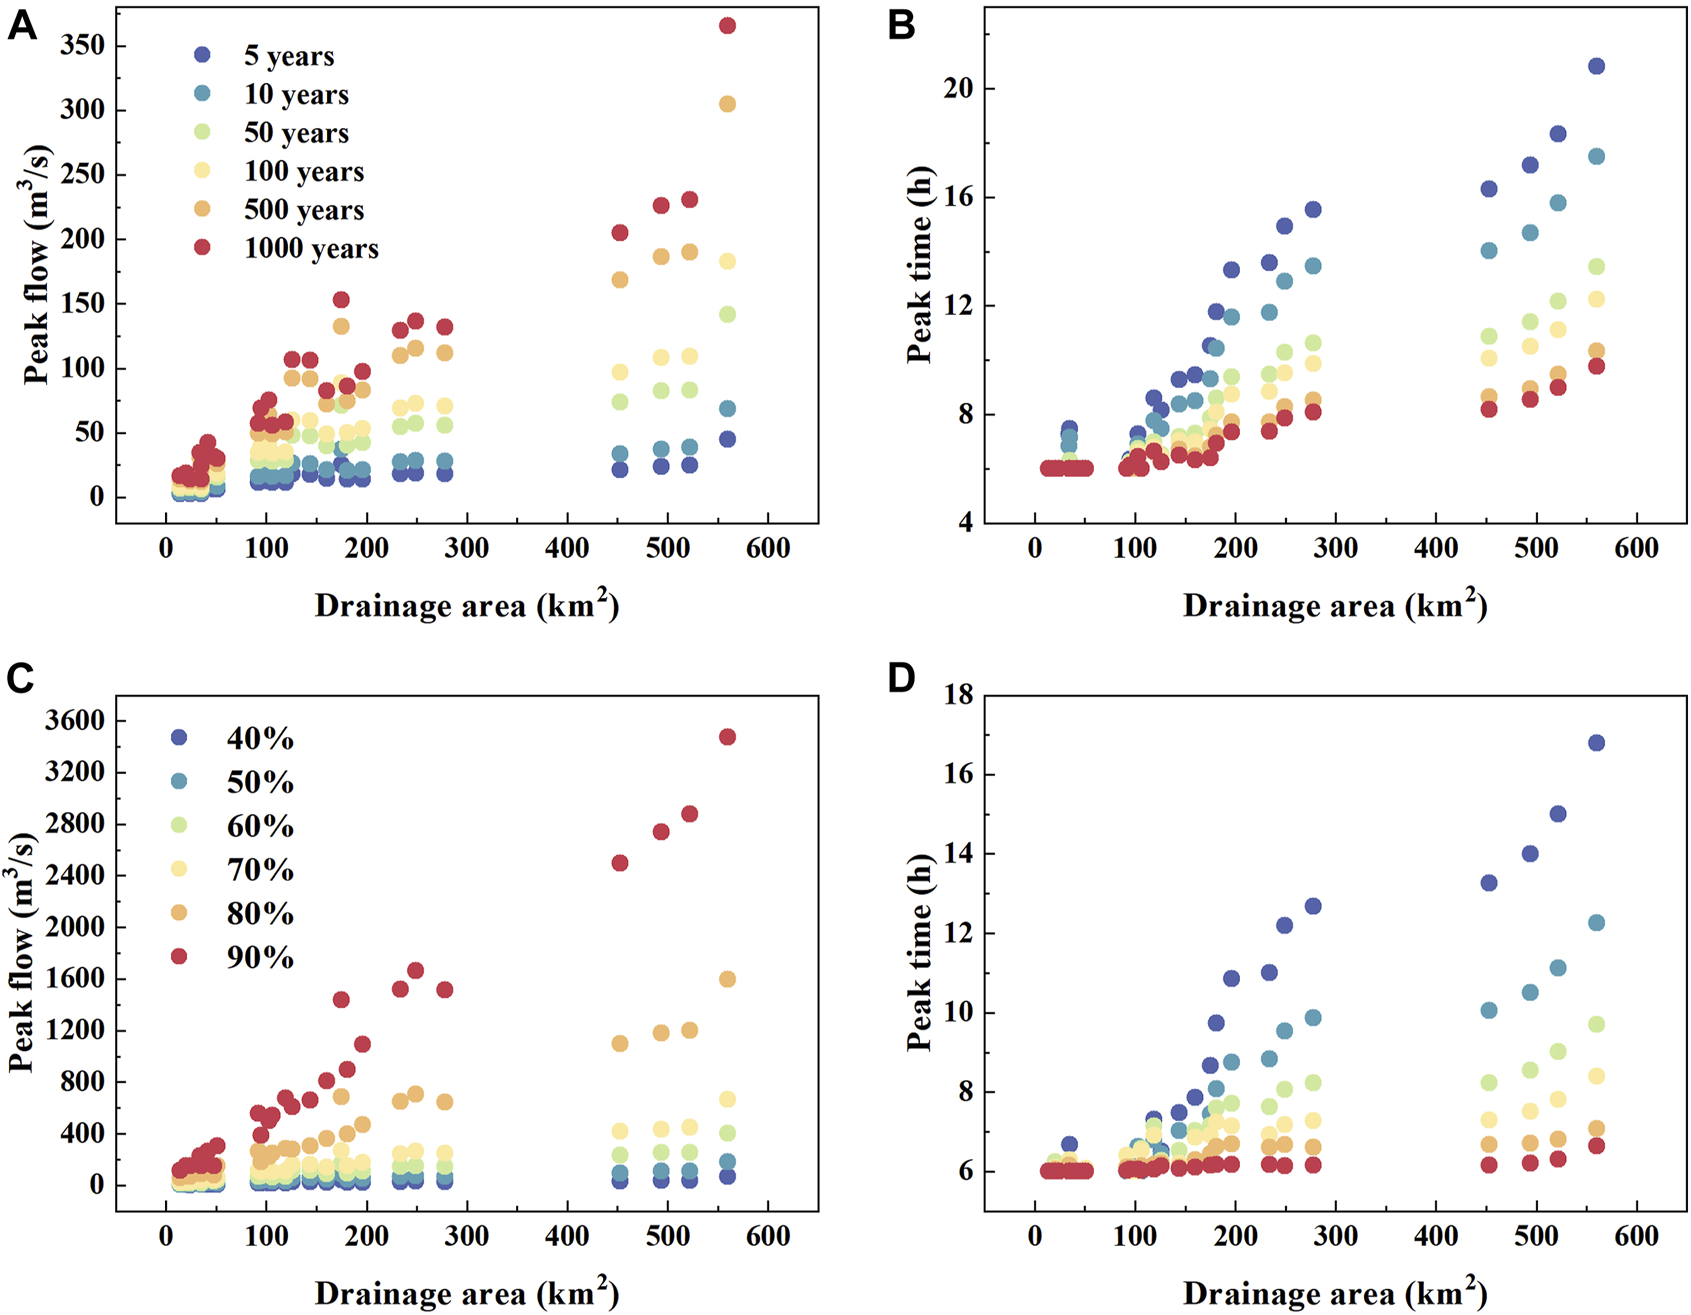
Scatter plots between peak flow and drainage area under different (A) rainfall return period, and (C) antecedent soil saturation ratio; and scatter plots between peak time and drainage area under different (B) rainfall return period and (D) antecedent soil saturation ratio.
To further clarify the effects of antecedent soil saturation ratio, rainfall return period and drainage area on runoff generation, we have plotted contour maps depicting these variables (Figure 6). From Figure 6A, it can be seen that peak flow increased with drainage area and antecedent soil saturation ratio, though the increase rate was not consistent. As soil saturation ratio exceeded 70%, there was significant variation in peak flow with changes in drainage area. On the contrary, noticeable changes were found in peak flow when rainfall return period was low, with a surge in the range of 100–200 km2 (Figure 6C). This may be related to the topography of the sub-catchment. This shows that peak flow was not sensitive to low antecedent soil moisture, while small increase in rainfall would result in greater runoff in each catchment, which is consistent with Figure 4A.
FIGURE 6

The scale effects of runoff on antecedent soil saturation ratio and rainfall return period. (A) Scale effect of peak flow on antecedent soil saturation ratio at 100-year-event; (B) scale effect of peak time on antecedent soil saturation ratio at 100-year-event; (C) scale effect of peak flow on return period at 50% soil saturation ratio; (D) scale effect of peak time on return period at 50% soil saturation ratio.
The peak time increased from the upper left to the lower right, with larger drainage areas, lower soil saturation ratio, and smaller rainfall return periods (Figures 6C, D). When soil saturation ratio was above 80%, runoff occurred almost instantaneously after the end of the rainfall event. This is because all sub-catchments in the region were saturated before the end of the rainfall event. This indicates that the dominant runoff generation mechanism of SXRC is saturation excess. This is also matching the results of our previous findings in the southwest humid China (Liu et al., 2021). For catchments with an area less than 150 km2, peak time was generally consistent with rainfall time due to the short length of the stream channel in the study catchments.
3.3 Relative contribution of rainfall and antecedent soil saturation ratio
To quantify the impact of soil moisture and rainfall on flood generation, we calculated the ratio of antecedent soil saturation ratio and rainfall (SPR) (Ran et al., 2022). Figure 7 compares the peak flow from different sub-catchments with various SPR values. When SPR was in the first four groups (SPR <1), the peak flow increased with SPR. When SPR was in the last four groups (SPR >1), there was a negative correlation between SPR and peak flow. That is, when the relative magnitude of soil moisture in the input data is greater, magnitude of floods decreased with the decrease of rainfall dominance. On the other hand, when the relative magnitude of rainfall was greater, this situation was reversed. The maximum flood peak flow occurred when SPR was around one. That is, the flood peak reached the maximum when the contribution of rainfall and antecedent soil saturation ratio was close, both rainfall and antecedent soil saturation ratio were relatively large. The peak flow was more sensitive to scenarios with larger rainfall and higher soil moisture saturation ratio. Note that the error in each group followed the same trend as the peak flow due to the larger variance in larger catchments (Supplementary Figure S2). While in small catchments, the change of flood peak flow with SPR was not obvious.
FIGURE 7

Bar plot of the peak flow under different SPR (ratio of antecedent soil saturation and precipitation). The error bars indicate variance among catchments and scenarios.
To further explore the relative contribution of rainfall and antecedent soil saturation ratio individually, we calculated the relative importance of rainfall and soil saturation ratio to flood peak. As can be seen from Figure 8, there were apparent trend in the contribution rates of both rainfall and soil saturation ratio. With the increase in catchment drainage area, the relative contribution rates of rainfall gradually decreased while the antecedent soil saturation ratio increased. In the main stream areas near the outlet (the last four points), the changes in these two indicators are particularly prominent. Note that in this algorithm, the value of antecedent soil moisture importance has always been greater. Similar importance has also been found in Vreugdenhil et al. (2022) on overland flow and tile drainage in a Hydrological Open Air Laboratory, Austria. Given the calculation of this method, this may be attributed to the relatively larger value and smaller variance of soil saturation ratio. Different methods could derive various values of the relative importance, yet their trends with drainage area are similar: with the increase in catchment size, the impact of antecedent soil moisture decreases and that of rainfall increases, which is consistent with the previous findings.
FIGURE 8

Scatter plot of the relative importance of rainfall (A) and soil moisture (B) to peak flow as the drainage area changes.
4 Discussion
4.1 Impact of antecedent soil moisture and rainfall on flood generation
Obviously, the peak flow increased with rainfall return period and antecedent soil saturation ratio, while the peak time decreased with them. Meanwhile, the growth rate of peak flow increased with soil moisture but decreased with rainfall return period. The increase rate was steeper under heavy rainfall return periods and high soil saturation ratio. This result ties well with previous studies in Turkey River in the midwestern United States (Zhu et al., 2018). The rapid generation of surface runoff due to saturated soil can lead to greater sensitivity of the flow to changes in rainfall. Conversely, when the soil was dry, most of the rainfall would infiltrate into the soil, slowing the surface runoff (Viglione et al., 2016). This suggests that the dominant mode of runoff generation within the study catchment is Dunne overland flow, which is consistent with previous research findings (Ran et al., 2015).
Rainfall and antecedent soil saturation ratio level have been identified as being main driving factors of runoff generation, and they jointly influence flood (Berghuijs et al., 2016; Ye et al., 2017; Wasko and Nathan, 2019; Breinl et al., 2021). Extreme floods were found occurring under high return period and high antecedent soil saturation ratio in many catchments (Zhu et al., 2018; Zhong et al., 2021). As the rainfall increased, the response of peak flow to high soil saturation ratio become stronger (Figure 4A). Comparing our results with literature, it must be pointed out that some studies have suggested that dry catchments are more sensitive to changes in rainfall than wet ones (Yang and Yang, 2011; Tang et al., 2019). Our results do not necessarily contradict these findings. This may be due to the existence of a critical value for soil saturation. Above this threshold, changes in soil moisture do not significantly affect peak flow. However, when soil moisture is below the critical value, flood size decreases with soil moisture (Wasko and Nathan, 2019). Besides, runoff sensitivity to soil moisture is closely related to the dominant runoff generation mechanisms (Castillo et al., 2003). In arid regions where runoff mainly occurs as infiltration-excess, its sensitivity is expected to show lower than basins where subsurface mechanisms predominate (Cao et al., 2019). Moreover, the increase in rainfall may not necessarily result in higher peak flow due to the reduction of soil saturation ratio. The findings are in line with previous findings (Wasko and Sharma, 2017; Sharma et al., 2018).
We examined the influence of soil saturation ratio and rainfall by comparing their ratios. The results show that when SPR was less than one, there was a positive correlation between SPR and peak flow, while when it was greater than one, it was a negative correlation (Figure 7). That is, the maximum peak flow occurred when both rainfall and antecedent soil saturation ratio were relatively high and contributed to runoff generation. Previous study in the Yangtze River Basin has observed a negative correlation between the multi-year averaged SPR and flood peak flow (Ran et al., 2022). Our result further expanded the data set to event scale and found that there was a more complex relationship between SPR and peak flow at event scale. This finding that event flow peak was maximum when SPR was close to one is consistent with the findings in many humid catchments worldwide (Bennett et al., 2018; Bertola et al., 2021; Ran et al., 2022).
4.2 Impact of scale effects on flood generation
There was a clear correlation between peak flow and peak time with drainage area (Figure 5). When the catchment drainage area was small, there were fluctuations in peak flow and peak time, which could be attributed to the variation of the topography of these small catchments. Overall, it showed a positive correlation with drainage area. This helps quantify the impact of catchment drainage area on runoff generation in the existing work.
Furthermore, the impacts of influential factors on runoff generation may vary for catchments with different drainage areas. Soil saturation ratio condition of larger catchments played a more significant role in regulating flood response compared to smaller ones (Figure 8). Studies conducted in Australia also found that the correlation between peak flow and soil moisture was higher than that between rainfall (Wasko and Nathan, 2019). Additionally, Cao et al. (2019) also reported that the effect of antecedent soil moisture is stronger in larger catchments. These findings are consistent with our results. This may be attributed to the longer time for catchment drainage in larger catchments comparing to smaller ones, which also have greater spatial heterogeneity including geomorphological and topographic characteristics (Saharia et al., 2017). For example, catchments with steep slope and high drainage density will respond faster to rainfall (Saharia et al., 2017). Smith et al. suggested that the impact of antecedent soil moisture on river flow could be more significant in larger catchments (Smith et al., 2013). Our study further quantifies the relative importance of rainfall and antecedent soil conditions. With the increase of catchment area, the relative importance of rainfall decreases while the relative importance of antecedent soil moisture increases (Figure 8).
Given the scale effects of the relative importance of soil moisture and rainfall, this can be done by assimilating drainage area and soil moisture into hydrological forecasting system to mitigate flood hazards in mountainous areas.
The peak time is also an important indicator of runoff generation, which is of great significance to the early warning of flash flood. In small catchments (i.e., <100 km2), the peak time was insensitive to both antecedent soil saturation ratio and rainfall magnitude. This is because the confluence distance is very short in the range of several to tens of square kilometers. On the other hand, even in large catchments, extremely short peak time can be observed when antecedent soil saturation ratio was high (Figure 6B). This means that the peak flow occurs immediately at the end of the rainfall. Events with high antecedent soil moisture were likely to convert more precipitation to discharge, and took a shorter time to reach peak flow (Thomas et al., 2021). Simulating the runoff generation process accurately is crucial for reliable flash flood warnings in mountainous catchments. For example, when the soil is close to saturation, the peak time will advance by approximately 300%. Moreover, this effect is more significant under rainfall of shorter return period. Therefore, attention also should be paid to the peak time for small rainfall events coming after series of previous events that have substantially saturated the soil (high soil saturation ratio).
4.3 Limitations and implications
In this study, the InHM model was used to simulate the process of runoff generation in a humid mountainous catchment, aiming to understand the impact and the relative importance of rainfall and antecedent soil saturation ratio on runoff generation. However, our research also has some limitations.
In this analysis, the rainfall was set as the mean maximum 6-h rainstorm from historical records with the homogeneous assumption. That is to say, the rainfall was uniform across the whole catchment. Studies have suggested that spatial rainfall structure has an important impact on river basin runoff in large scale (Zhu et al., 2018). But Lobligeois et al. (2014) found that the spatially uniform rainfall inputs in catchments smaller than 500 km2 performed better by simulating 3620 flood events observed in 181 catchments. As nearly 95% of our catchments are smaller than 500 km2, it is reasonable to adopt spatially uniform rainfall in our research.
This work is a theoretical analysis based on simulations from a physically-based distributed hydrological model InHM. Although the model has been successfully employed for many event-based rainfall-runoff simulations in different catchments (Mirus et al., 2007; Ebel et al., 2008), and calibrated in our study region, more accurate measured data on rainfall, soil moisture and runoff are needed to further validate our findings. In addition, studies are needed to be applied to catchments in more climate regions, which will further expand our findings and lead to more general conclusions about the impacts of rainfall and soil moisture.
Studies have shown that extreme precipitation has intensified globally (Do et al., 2017). The increase of rainfall intensity can lead to major floods, especially in humid regions (Milly et al., 2002; Sharma et al., 2018). Better understandings of the contribution of rainfall and antecedent soil moisture at catchments with different drainage area can be crucial for improving flood risk predictions. By investigating the impacts of dominant factors of runoff generation across scales, we can provide guidance on the causes of runoff generation at different scales.
5 Conclusion
In this paper, we apply the physically-based distributed hydrological model InHM to Shouxi River Catchment in Southwest China to analyze the relative contribution of rainfall return period and antecedent soil saturation ratio on runoff generation. By simulating runoff generation processes in different sub-catchments, we explored how rainfall and soil moisture influenced runoff at different scales.
Our results showed that both antecedent soil saturation ratio and rainfall return period had significant impacts on runoff generation. Increasing return period and soil saturation ratio can greatly increase peak flow and shorten peak time. When a high return period was matched with a high antecedent soil saturation ratio, rare extreme flood peak flow would occur rapidly. Our analysis further showed that there was a certain correlation between the antecedent soil saturation ratio to rainfall (SPR) and peak flow. When SPR <1, there was a positive correlation between SPR and peak flow; while when SPR >1, it shifted to a negative correlation. This indicated that the maximum floods usually occurred when rainfall was relatively large and soil water close to saturation; maximum rainfall falling on dry soil could not necessarily generate annual maximum floods.
Furthermore, we found that there were also scale effects on flood generation. Both peak flow and peak time increased linearly with the drainage area. The scale effect was more pronounced when there was high antecedent soil saturation ratio and rainfall return period. Based on the analysis in Shouxi River Catchment, we found that with the increase in catchment drainage area, the relative contribution of rainfall gradually decreased while the antecedent soil saturation ratio increased.
Statements
Data availability statement
The raw data supporting the conclusion of this article will be made available by the authors, without undue reservation.
Author contributions
TY: Formal Analysis, Writing–original draft. QR: Conceptualization, Writing–review and editing. HP: Data curation. JL: Investigation. JP: Investigation. SY: Conceptualization, Writing–review and editing.
Funding
The author(s) declare financial support was received for the research, authorship, and/or publication of this article. This research was funded by the National Key Research and Development Program of China (2019YFC1510701-01), and National Natural Science Foundation of China (51979243).
Conflict of interest
Author JP was employed by Zhejiang Design Institute of Water Conservancy and Hydroelectric Power Co., LTD.
The remaining authors declare that the research was conducted in the absence of any commercial or financial relationships that could be construed as a potential conflict of interest.
Publisher’s note
All claims expressed in this article are solely those of the authors and do not necessarily represent those of their affiliated organizations, or those of the publisher, the editors and the reviewers. Any product that may be evaluated in this article, or claim that may be made by its manufacturer, is not guaranteed or endorsed by the publisher.
Supplementary material
The Supplementary Material for this article can be found online at: https://www.frontiersin.org/articles/10.3389/feart.2023.1285766/full#supplementary-material
SUPPLEMENTARY FIGURE S1The (A) peak flow and (B) peak time at different return period and soil saturation ratio. The color represents the antecedent soil saturation ratio.
SUPPLEMENTARY FIGURE S2Scatter plot of the peak flow under different SPR. The color represents drainage area.
References
1
Arnell N. W. Gosling S. N. (2016). The impacts of climate change on river flood risk at the global scale. Clim. Change134 (3), 387–401. 10.1007/s10584-014-1084-5
2
Bennett B. Leonard M. Deng Y. Westra S. (2018). An empirical investigation into the effect of antecedent precipitation on flood volume. J. Hydrology567, 435–445. 10.1016/j.jhydrol.2018.10.025
3
Berghuijs W. R. Woods R. A. Hutton C. J. Sivapalan M. (2016). Dominant flood generating mechanisms across the United States: flood Mechanisms across the U.S. Geophys. Res. Lett.43 (9), 4382–4390. 10.1002/2016GL068070
4
Bertola M. Viglione A. Vorogushyn S. Lun D. Merz B. Blöschl G. (2021). Do small and large floods have the same drivers of change? A regional attribution analysis in Europe. Hydrology Earth Syst. Sci.25 (3), 1347–1364. 10.5194/hess-25-1347-2021
5
Blöschl G. (2022). Three hypotheses on changing river flood hazards. Hydrology Earth Syst. Sci.26 (19), 5015–5033. 10.5194/hess-26-5015-2022
6
Borga M. Boscolo P. Zanon F. Sangati M. (2007). Hydrometeorological analysis of the 29 August 2003 flash flood in the eastern Italian alps. J. Hydrometeorol.8 (5), 1049–1067. 10.1175/JHM593.1
7
Breinl K. Lun D. Müller-Thomy H. Blöschl G. (2021). Understanding the relationship between rainfall and flood probabilities through combined intensity-duration-frequency analysis. J. Hydrology602, 126759. 10.1016/j.jhydrol.2021.126759
8
Cao Q. Mehran A. Ralph F. M. Lettenmaier D. P. (2019). The role of hydrological initial conditions on atmospheric river floods in the Russian River Basin. J. Hydrometeorol.20 (8), 1667–1686. 10.1175/JHM-D-19-0030.1
9
Castillo V. Gomezplaza A. Martinezmena M. (2003). The role of antecedent soil water content in the runoff response of semiarid catchments: a simulation approach. J. Hydrology284 (1–4), 114–130. 10.1016/S0022-1694(03)00264-6
10
Department of Water Resources of Sichuan Province (1984). Flood manual in small and medium-sized watersheds of sichuan Province. Chengdu: Complied by Department of Water Resources of Sichuan Province.
11
Do H. X. Westra S. Leonard M. (2017). A global-scale investigation of trends in annual maximum streamflow. J. Hydrology552, 28–43. 10.1016/j.jhydrol.2017.06.015
12
Ebel B. A. Loague K. Montgomery D. R. Dietrich W. E. (2008). Physics-based continuous simulation of long-term near-surface hydrologic response for the Coos Bay experimental catchment: simulation of Long-Term Hydrologic Response. Water Resour. Res.44 (7). 10.1029/2007WR006442
13
Gan B. Liu X. Yang X. Wang X. Zhou J. (2018). The impact of human activities on the occurrence of mountain flood hazards: lessons from the 17 August 2015 flash flood/debris flow event in Xuyong County, south-western China. Geomatics, Nat. Hazards Risk9 (1), 816–840. 10.1080/19475705.2018.1480539
14
Grillakis M. G. Koutroulis A. G. Komma J. Tsanis I. K. Wagner W. Blöschl G. (2016). Initial soil moisture effects on flash flood generation – a comparison between basins of contrasting hydro-climatic conditions. J. Hydrology541, 206–217. 10.1016/j.jhydrol.2016.03.007
15
Grömping U. (2006). Relative importance for linear regression in R: the package relaimpo. J. Stat. Softw.17 (1). 10.18637/jss.v017.i01
16
Guha-Sapir D. Hoyois P. Below R. (2013). Annual disaster statistical review. Brussels, Belgium: Université catholique de Louvain.
17
Guha-Sapir D. Hoyois P. Below R. (2014). Annual disaster statistical review. Brussels, Belgium: Université catholique de Louvain.
18
Johnson J. W. Lebreton J. M. (2004). History and use of relative importance indices in organizational research. Organ. Res. Methods7 (3), 238–257. 10.1177/1094428104266510
19
Liu L. (2022). “Soil moisture movement and its influence on rainstorm and flash flood in Southwest mountainous area,” (China: Zhejiang University). Ph.D. Thesis.
20
Liu L. Ye S. Chen C. Pan H. Ran Q. (2021). Nonsequential response in mountainous areas of southwest China. Front. Earth Sci.9, 660244. 10.3389/feart.2021.660244
21
Loague K. VanderKwaak J. E. (2002). Simulating hydrological response for the R-5 catchment: comparison of two models and the impact of the roads. Hydrol. Process.16 (5), 1015–1032. 10.1002/hyp.316
22
Lobligeois F. Andréassian V. Perrin C. Tabary P. Loumagne C. (2014). When does higher spatial resolution rainfall information improve streamflow simulation? An evaluation using 3620 flood events. Hydrology Earth Syst. Sci.18 (2), 575–594. 10.5194/hess-18-575-2014
23
Madsen H. Lawrence D. Lang M. Martinkova M. Kjeldsen T. R. (2014). Review of trend analysis and climate change projections of extreme precipitation and floods in Europe. J. Hydrol.519, 3634–3650. 10.1016/j.jhydrol.2014.11.003
24
Milly P. C. D. Wetherald R. T. Dunne K. A. Delworth T. L. (2002). Increasing risk of great floods in a changing climate. Nature415 (6871), 514–517. 10.1038/415514a
25
Min S.-K. Zhang X. Zwiers F. W. Hegerl G. C. (2011). Human contribution to more-intense precipitation extremes. Nature470 (7334), 378–381. 10.1038/nature09763
26
Mirus B. B. Ebel B. A. Loague K. Wemple B. C. (2007). Simulated effect of a forest road on near-surface hydrologic response: redux. Earth Surf. Process. Landforms32 (1), 126–142. 10.1002/esp.1387
27
Nash J. E. Sutcliffe J. V. (1970). River flow forecasting through conceptual models, part I-a discussion of principles. J. Hydrology10 (3), 282–290. 10.1016/0022-1694(70)90255-6
28
Nikolopoulos E. I. Anagnostou E. N. Borga M. Vivoni E. R. Papadopoulos A. (2011). Sensitivity of a mountain basin flash flood to initial wetness condition and rainfall variability. J. Hydrology402 (3–4), 165–178. 10.1016/j.jhydrol.2010.12.020
29
Pall P. Aina T. Stone D. A. Stott P. A. Nozawa T. Hilberts A. G. J. et al (2011). Anthropogenic greenhouse gas contribution to flood risk in England and Wales in autumn 2000. Nature470 (7334), 382–385. 10.1038/nature09762
30
Pathiraja S. Westra S. Sharma A. (2012). Why continuous simulation? The role of antecedent moisture in design flood estimation. Water Resour. Res.48 (6). 10.1029/2011WR010997
31
Ran Q. Chen X. Hong Y. Ye S. Gao J. (2020). Impacts of terracing on hydrological processes: a case study from the Loess Plateau of China. J. Hydrology588, 125045. 10.1016/j.jhydrol.2020.125045
32
Ran Q. Hong Y. Chen X. Gao J. Ye S. (2019a). Impact of soil properties on water and sediment transport: a case study at a small catchment in the Loess Plateau. J. Hydrology574, 211–225. 10.1016/j.jhydrol.2019.04.040
33
Ran Q. Hong Y. Li W. Gao J. (2018). A modelling study of rainfall-induced shallow landslide mechanisms under different rainfall characteristics. J. Hydrology563, 790–801. 10.1016/j.jhydrol.2018.06.040
34
Ran Q. Qian Q. Li W. Fu X. Yu X. Xu Y. (2015). Impact of earthquake-induced-landslides on hydrologic response of a steep mountainous catchment: a case study of the Wenchuan earthquake zone. J. Zhejiang University-SCIENCE A16 (2), 131–142. 10.1631/jzus.A1400039
35
Ran Q. Su D. Qian Q. Fu X. Wang G. He Z. (2012). Physically-based approach to analyze rainfall-triggered landslide using hydraulic gradient as slide direction. J. Zhejiang Univ. Sci. A13 (12), 943–957. 10.1631/jzus.A1200054
36
Ran Q. Wang F. Gao J. (2019b). Modelling effects of rainfall patterns on runoff generation and soil erosion processes on slopes. Water11 (11), 2221. 10.3390/w11112221
37
Ran Q. Wang J. Chen X. Liu L. Li J. Ye S. (2022). The relative importance of antecedent soil moisture and precipitation in flood generation in the middle and lower Yangtze River basin. Hydrology Earth Syst. Sci.26 (19), 4919–4931. 10.5194/hess-26-4919-2022
38
Rogger M. Agnoletti M. Alaoui A. Bathurst J. C. Bodner G. Borga M. et al (2017). Land use change impacts on floods at the catchment scale: challenges and opportunities for future research. Water Resour. Res.53 (7), 5209–5219. 10.1002/2017WR020723
39
Saharia M. Kirstetter P.-E. Vergara H. Gourley J. J. Hong Y. (2017). Characterization of floods in the United States. J. Hydrology548, 524–535. 10.1016/j.jhydrol.2017.03.010
40
Sen P. K. Lindeman R. H. Merenda P. F. Gold R. Z. (1981). Introduction to bivariate and multivariate analysis. J. Am. Stat. Assoc.76 (375), 752. 10.2307/2287559
41
Sharma A. Wasko C. Lettenmaier D. P. (2018). If precipitation extremes are increasing, why aren’t floods?Water Resour. Res.54 (11), 8545–8551. 10.1029/2018WR023749
42
Smith J. A. Baeck M. L. Villarini G. Wright D. B. Krajewski W. (2013). Extreme flood response: the June 2008 flooding in Iowa. J. Hydrometeorol.14 (6), 1810–1825. 10.1175/JHM-D-12-0191.1
43
Soo E. Z. X. Jaafar W. Z. W. Lai S. H. Islam T. Srivastava P. (2019). Evaluation of satellite precipitation products for extreme flood events: case study in Peninsular Malaysia. J. Water Clim. Change10 (4), 871–892. 10.2166/wcc.2018.159
44
Sriwongsitanon N. Taesombat W. (2011). Effects of land cover on runoff coefficient. J. Hydrology410 (3–4), 226–238. 10.1016/j.jhydrol.2011.09.021
45
Su D. (2012). “Study on the parallelization of a physics-based hydrologic model InHM utilizing computer cluster,” (China: Zhejiang University). Ph.D. Thesis.
46
Tang Y. Tang Q. Wang Z. Chiew F. H. S. Zhang X. Xiao H. (2019). Different precipitation elasticity of runoff for precipitation increase and decrease at watershed scale. J. Geophys. Res. Atmos.124 (22), 11932–11943. 10.1029/2018JD030129
47
Thomas N. W. Ayalew T. B. Arenas A. A. Schilling K. E. Weber L. J. Krajewski W. F. (2021). Characterizing the effects of dry antecedent soil moisture conditions, channel transmission losses, and variable precipitation on peak flow scaling. Adv. Water Resour.158, 104061. 10.1016/j.advwatres.2021.104061
48
Vanderkwaak J. E. (1999). “Numerical simulation of flow and chemical transport in integrated surface-subsurface hydrologic systems,” (Canada: University of Waterloo). Ph.D. Thesis.
49
Viglione A. Merz B. Viet Dung N. Parajka J. Nester T. Blöschl G. (2016). Attribution of regional flood changes based on scaling fingerprints. Water Resour. Res.52 (7), 5322–5340. 10.1002/2016WR019036
50
Vivoni E. R. Entekhabi D. Bras R. L. Ivanov V. Y. (2007). Controls on runoff generation and scale-dependence in a distributed hydrologic model. Hydrol. Earth Syst. Sci.11 (5), 1683–1701. 10.5194/hess-11-1683-2007
51
Vreugdenhil M. Széles B. Salinas J. L. Strauß P. Oismueller M. Hogan P. et al (2022). Non-linearity in event runoff generation in a small agricultural catchment. Hydrol. Process.36 (8), e14667. 10.1002/hyp.14667
52
Wasko C. Nathan R. (2019). Influence of changes in rainfall and soil moisture on trends in flooding. J. Hydrology575, 432–441. 10.1016/j.jhydrol.2019.05.054
53
Wasko C. Sharma A. (2017). Global assessment of flood and storm extremes with increased temperatures. Sci. Rep.7 (1), 7945. 10.1038/s41598-017-08481-1
54
Yang H. Yang D. (2011). Derivation of climate elasticity of runoff to assess the effects of climate change on annual runoff. Water Resour. Res.47 (7). 10.1029/2010WR009287
55
Yang Z. Jin E. Zhou X. Gao J. Wang X. (2022). “Simulation study on “8.20” rainstorm flash flood process in Shouxi River, Wenchuan.” in Proceedings of the 16th National Hydrodynamics Conference and the 32nd National Symposium on Hydrodynamics. 1985-1990. (in Chinese)
56
Ye S. Li H.-Y. Leung L. R. Guo J. Ran Q. Demissie Y. et al (2017). Understanding flood seasonality and its temporal shifts within the contiguous United States. J. Hydrometeorol.18 (7), 1997–2009. 10.1175/JHM-D-16-0207.1
57
Yin Z. Li H. Tang X. Gong Z. (2022). Flash flood forecasting of Shouxi River in southwestern region based on deep learning. Water Resour. Power40 (2), 88–91. (in Chinese).
58
Yuan X. Liu C. Lu H. Nie R. Chen C. Liu T. et al (2022). Analysing evolution characteristics of landslide deposits in Shouxi River Basin in the wenchuan earthquake zone. Adv. Eng. Sci.54 (6), 32–42. (in Chinese). 10.15961/j.jsuese.202200732
59
Zhai X. Guo L. Liu R. Zhang Y. (2018). Rainfall threshold determination for flash flood warning in mountainous catchments with consideration of antecedent soil moisture and rainfall pattern. Nat. Hazards94 (2), 605–625. 10.1007/s11069-018-3404-y
60
Zhong M. Zeng T. Jiang T. Wu H. Chen X. Hong Y. (2021). A copula-based multivariate probability analysis for flash flood risk under the compound effect of soil moisture and rainfall. Water Resour. Manag.35 (1), 83–98. 10.1007/s11269-020-02709-y
61
Zhu Z. Wright D. B. Yu G. (2018). The impact of rainfall space-time structure in flood frequency analysis. Water Resour. Res.54 (11), 8983–8998. 10.1029/2018WR023550
Summary
Keywords
flood generation, scale effect, antecedent soil saturation ratio, rainfall, mountainous catchment
Citation
Yu T, Ran Q, Pan H, Li J, Pan J and Ye S (2023) The impacts of rainfall and soil moisture to flood hazards in a humid mountainous catchment: a modeling investigation. Front. Earth Sci. 11:1285766. doi: 10.3389/feart.2023.1285766
Received
30 August 2023
Accepted
03 November 2023
Published
27 December 2023
Volume
11 - 2023
Edited by
Chong Xu, Ministry of Emergency Management, China
Reviewed by
Sangdan Kim, Pukyong National University, Republic of Korea
Huiran Gao, Ministry of Emergency Management, China
Updates
Copyright
© 2023 Yu, Ran, Pan, Li, Pan and Ye.
This is an open-access article distributed under the terms of the Creative Commons Attribution License (CC BY). The use, distribution or reproduction in other forums is permitted, provided the original author(s) and the copyright owner(s) are credited and that the original publication in this journal is cited, in accordance with accepted academic practice. No use, distribution or reproduction is permitted which does not comply with these terms.
*Correspondence: Sheng Ye, 0015927@zju.edu.cn
Disclaimer
All claims expressed in this article are solely those of the authors and do not necessarily represent those of their affiliated organizations, or those of the publisher, the editors and the reviewers. Any product that may be evaluated in this article or claim that may be made by its manufacturer is not guaranteed or endorsed by the publisher.