 Sarah M. Hayes
 Ryan J. McAleer
 Nadine M. Piatak
 Sarah Jane O. White
 Robert R. Seal
 - 1United States Geological Survey, Geology, Energy and Minerals Science Center, Reston, VA, United States
- 2United States Geological Survey, Florence Bascom Geoscience Center, Reston, VA, United States
A suite of complementary techniques was used to examine germanium (Ge), a byproduct critical element, and co-substituent trace elements in ZnS and mine wastes from four mineral districts where germanium is, or has been, produced within the United States. This contribution establishes a comprehensive workflow for characterizing Ge and other trace elements, which captures the full heterogeneity of samples through extensive pre-characterization. This process proceeded from optical microscopy, to scanning electron microscopy and cathodoluminescence (CL) imaging, to electron microprobe analysis, prior to synchrotron-based investigations. Utilizing non-destructive techniques enabled reanalysis, which proved essential for verifying observations and validating unexpected results. In cases where the Fe content was <0.3 wt% in ZnS, cathodoluminescence imaging proved to be an efficient means to qualitatively identify trace element zonation that could then be further explored by other micro-focused techniques. Micro-focused X-ray diffraction was used to map the distribution of the non-cubic ZnS polymorph, whereas micro-focused X-ray fluorescence (μ-XRF) phase mapping distinguished between Ge4+ hosted in primary ZnS and a weathering product, hemimorphite [Zn4Si2O7(OH)2·H2O]. Microprobe data and μ-XRF maps identified spatial relationships among trace elements in ZnS and implied substitutional mechanisms, which were further explored using Ge and copper (Cu) X-ray absorption near-edge spectroscopy (XANES). Both oxidation states of Ge (4+ and 2+) were identified in ZnS along with, almost exclusively, monovalent Cu. However, the relative abundance of Ge oxidation states varied among mineral districts and, sometimes, within samples. Further, bulk XANES measurements typically agreed with micro-focused XANES (μ-XANES) spectra, but unique micro-environments were detected, highlighting the importance of complementary bulk and micro-focused measurements. Some Ge μ-XANES utilized a high energy resolution fluorescence detector, which improved spectral resolution and spectral signal-to-noise ratio. This detector opens new opportunities for exploring byproduct critical elements in complex matrices. Overall, the non-destructive workflow employed here can be extended to other byproduct critical elements to more fully understand fundamental ore enrichment processes, which have practical implications for critical element exploration, resource quantification, and extraction.
1 Introduction
Germanium (Ge) is commonly identified as a critical element (Hayes and McCullough, 2018; U.S. Geological Survey, 2022) as a result of applications in fiber optic communications, infrared night vision, polymerization catalysis, and other semiconductor-based technologies, and a supply chain vulnerable to disruption (Thomas, 2018; U.S. Geolgoical Survey, 2021). Demand for many critical elements, including Ge, is anticipated to increase in coming decades (National Research Council, 2008; Thomas, 2018). Current annual production is 130 metric tons Ge, which is produced from “new scrap” recycling, Ge-rich coal combustion, and as a byproduct of zinc (Zn) extraction (the focus of this manuscript), with each source contributing about a third to global production (Licht et al., 2015; Thomas, 2018). Despite significant domestic reserves, the United States is highly reliant upon imported Ge because any Ge-enriched ores mined in the United States, from which Ge is eventually recovered, are exported for smelting and refining elsewhere (U.S. Geolgoical Survey, 2021). Understanding Ge substitution in zinc sulfides (ZnS) may lead to improved Ge exploration tools and more precise estimates of Ge reserves.
Analysis of Ge in ZnS is challenging due to low and variable Ge content (1s–100s mg kg−1), the proximity of Ge and Zn fluorescence emission energies, sub-mm-scale ZnS polymorphism, oxidation state variability of trace elements (e.g., Ge can occur in 2+ and 4+ oxidation states), and micrometer-scale heterogeneity in trace element content. In many areas, the Ge content may be below the detection limits of non-destructive techniques, complicating analysis (Table 1). Even when Ge is present at 100s mg kg−1 in ZnS, it is a challenge to isolate the relatively small Ge Kα (Kα1= 9,886.4 eV) signal from the much larger Zn Kβ signal (Kβ1= 9,572 eV), complicating quantification by X-ray based methods, including scanning electron microscopy-energy dispersive spectroscopy (SEM-EDS), electron microprobe, and most synchrotron-based methods. Natural ZnS grains commonly contain both cubic sphalerite and non-cubic wurtzite domains (Deer et al., 1992), which are readily distinguished in cross-polarized transmitted light due to their isotropic and anisotropic natures, respectively. Trace element enrichment has been shown to influence the crystalline structure of ZnS (e.g., Seal et al., 1985; Pring et al., 2020). However, unambiguous phase identification is complicated since prior studies consistently report the presence of sphalerite-attributed X-ray diffraction (XRD) peaks within anisotropic zones (Bonnet et al., 2016; Pring et al., 2020).
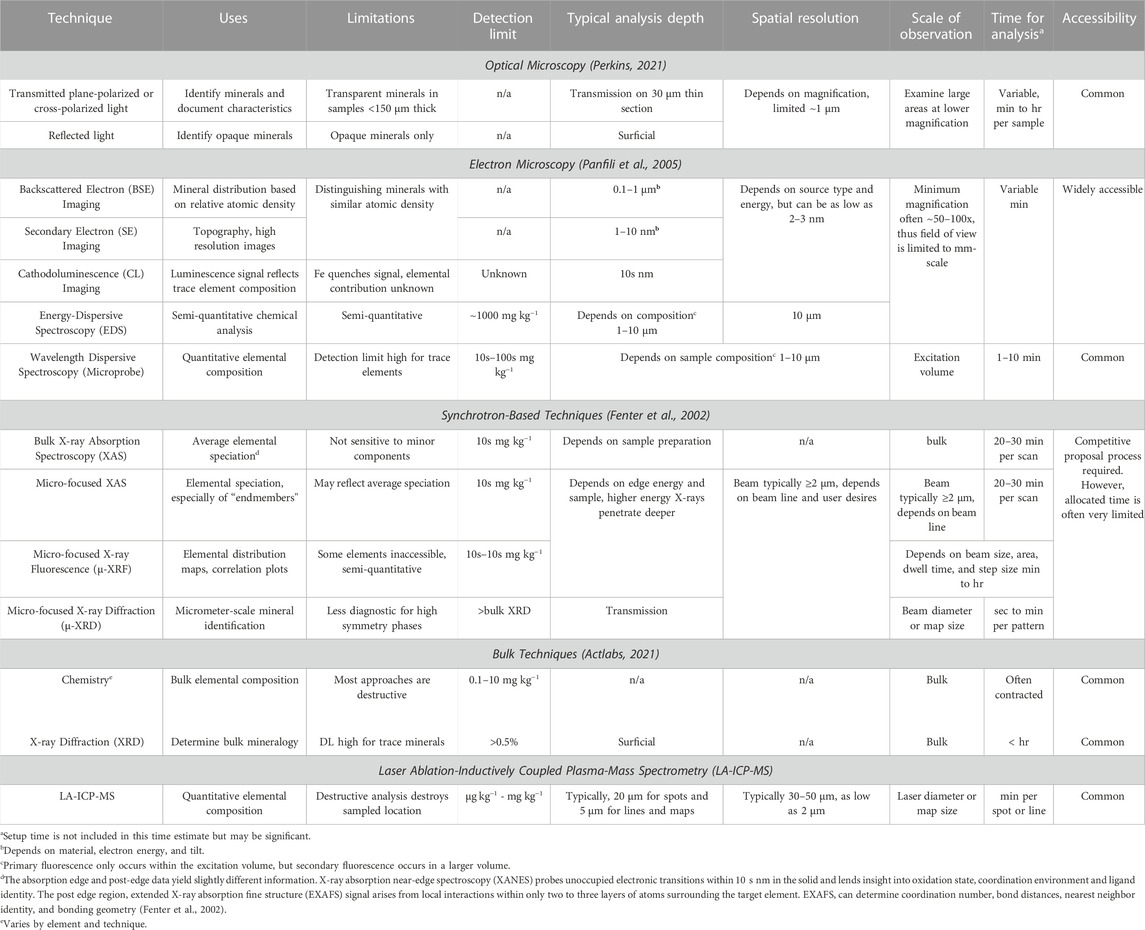
TABLE 1. A comparison of bulk and micro-focused techniques.
Synchrotron-based techniques were an integral component of this study because they are among the few techniques available for probing the oxidation state and bonding environment of Ge and potential co-substituent elements, especially when target elements are present at low abundance. Several prior studies have examined Ge and potentially co-substituting elements in ZnS using X-ray absorption near-edge spectroscopy (XANES). All such studies reported the presence of Ge4+ (Cook et al., 2015; Belissont et al., 2016; Bonnet et al., 2017), but Bonnet et al. (2017) additionally identified Ge2+ in samples from the Central and East Tennessee mining districts (two districts also examined in this study). Substitutional mechanisms of Ge4+ for Zn2+ requires charge balance, which may be provided by vacancies (Cook et al., 2015; Belissont et al., 2016) or through coupled substitution with monovalent ions, such as copper (Cu+), when strong elemental correlations are identified. Belissont et al., 2016 observed a strong Ge:2Cu molar correlation, and identified monovalent Cu using XANES, further supporting the 3Zn2+ ⇔ Ge4+ + 2Cu+ substitutional mechanism.
Cathodoluminescence (CL) imaging is sensitive to trace element variations and has been underutilized. Although the influence of various trace elements on the CL signal is not fully understood, spectral peak positions have been determined for a few elements and element mixtures in synthetic sphalerites (Leverenz, 1950; Remond, 1977; Marfunin, 1979), and qualitative correlations have been noted in natural sphalerites (Çiftçi, 2009). A variety of trace and critical elements act as CL activators in low-iron (Fe) sphalerite (e.g., Marfunin, 1979; Çiftçi, 2009; Sahlström et al., 2017), such that CL images can provide maps of trace element zonation.
This contribution is part of a larger project with the goal understanding the behavior and enrichment of Ge in ZnS and its weathering products, including speciation and substitutional mechanisms. This manuscript focuses on the novel workflow we developed to support this larger goal using a suite of complementary, generally non-destructive techniques. Companion manuscripts that focus on the mineral-district-specific geochemical and mineralogical results and their implications include a published study by White et al. (2022a) and a manscript in preparation (Nadine Piatak, U.S. Geological Survey, 2023). We examined samples from four sites where Ge is currently, or has been, recovered within the United States: Central and East Tennessee mining districts (TN), Red Dog mine (AK), Pend Oreille mine (Metaline mining district, WA), and the Tristate mining district (OK), now being remediated as the Tar Creek Superfund Site (Fite, 1954; U.S. Geolgoical Survey, 2021). This suite of samples was examined using optical microscopy, electron microscopy, CL imaging, microprobe, synchrotron-based XRD, X-ray fluorescence (XRF) mapping, and XANES analysis, typically in that order (Figure 1). Each technique provided unique insight into the samples being studied; see Table 1 for a comparison of benefits and limitations of each. The broader study has important implications for constraining the geochemical controls on Ge enrichment in ore-forming environments, estimating future Ge supply, assessing the potential for increasing byproduct recovery of Ge, assessing the potential for Ge recovery from historical mine wastes, and evaluating the environmental and human health risks associated with Ge released in the surficial environment. Within that context, this contribution outlines our workflow and best practices for examining byproduct critical elements in complex matrices.
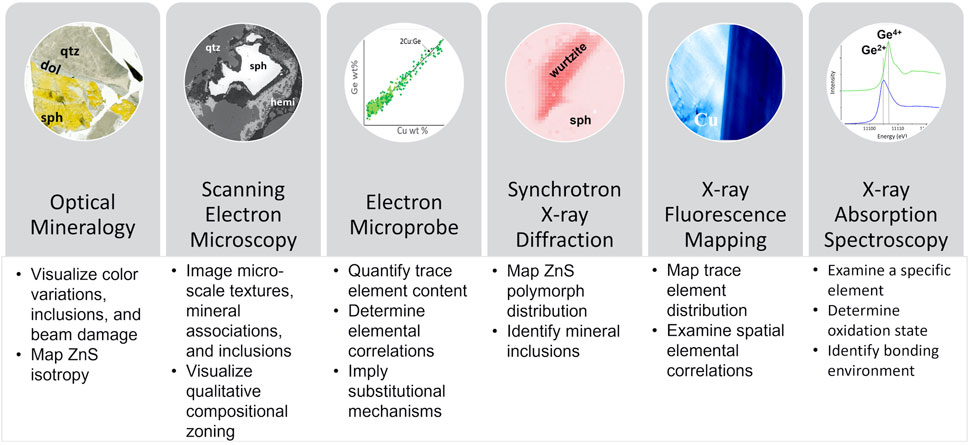
FIGURE 1. A complementary suite of micro-focused techniques used in this study to examine Ge and co-substituents in ZnS. These techniques were typically employed progressing from left to right, but iterative use proved essential for comprehensive understanding.
2 Methods of investigation
All reagents used were American Chemical Society (ACS) reagent grade or better. Reference materials were collected from chemical and mineral distributors, and the identities of all samples and references were determined by X-ray diffraction (Supplementary Table S1). A variety of methods were used to characterize the samples, and comparison of the methods including their uses, limitations, and spatial resolution is provided in Table 1.
2.1 Sample descriptions and thin section preparation
A detailed description of the samples in this study have been provided in the following studies. Briefly, samples from the Tristate mining district (OK) were collected from the surface of the Mahutska, St. Joe and Admiralty mine waste or “chat” piles (Schaider et al., 2007; White et al., 2022a). Germanium in the Tristate district was recovered from Zn smelter flue dusts in the 1940s, and in 1954 accounted for most of the global Ge production (Fite, 1954; McKnight and Fischer, 1970). Samples from Tennessee included two ZnS samples collected from the Central Tennessee Gordonsville mine (ZnS_2_1 and ZnS_5) and Zn concentrates from Central (Conc C and Conc G) and East Tennessee districts (East_TN_Conc; Piatak et al., 2023). Zinc concentrates from the Central and East Tennessee mines are hydrometallurgically processed at the Nyrstar Clarksville Smelter, with the Central Tennessee concentrate being processed separately to produce a Ge-enriched residue (Nyrstar, 2022). Josephine and Yellowhead ore zone samples from the Pend Oreille mine in the Metaline District were collected by David Leach (McClung, 2001; Pannalal et al., 2007). The Pend Oreille mine was placed in care and maintenance in 2019 by Teck Cominco Limited. Samples from Red Dog are from mineralization stages 1 and 2 (sample 900 bams), stage 2 (sample 942), and stages 3 and 4 (sample 975), as previously described in Kelley et al. (2004). Pend Oreille and some of Red Dog Zn concentrates are (were) processed at the Teck Smelter in Trail, British Columbia (Canada), which produces Ge. All deposits are classified as Mississippi Valley-type (MVT) deposits, except Red Dog, which is a sedimentary exhalative (SEDEX) massive sulfide deposit. Samples were received as either dried sand to silt-sized splits (Tar Creek, Central and East Tennessee concentrates), as thin-section offcuts from a prior study (Red Dog), or as hand samples (Metaline and Gordonsville mines). Thin sections were prepared by Spectrum Petrographics (Vancouver, WA), sectioned to a 30 μm thickness, doubly polished, and mounted on quartz slides to avoid other elements found in standard borosilicate glass slides, which could be misinterpreted as originating in the sample.
2.2 Optical microscopy
Optical microscopy was performed using a Nikon Eclipse E600 POL optical microscope to investigate samples in plane-polarized and cross polarized transmitted light, and in reflected light. Images were collected with a digital camera attached to the optical microscope using Nikon NIS Elements imaging software version 5.11.01.
2.3 Scanning electron microscopy and cathodoluminescence
All SEM and microprobe analyses (see below) were performed on polished thin sections with a ∼10 nm carbon coat applied using a Leica ACE600 coater. Scanning electron microscopy (SEM) was performed using a Hitachi SU-5000 field emission electron microscope operated in high vacuum mode and equipped with either a 30 mm2 EDAX Octane or 100 mm2 Oxford energy dispersive spectroscopy (EDS)-silicon drift detector depending on the date of analysis. SEM-EDS spectra were collected using an accelerating voltage of 15–20 keV and Hitachi spot intensity of either 30 or 50 (nominal beam current ranging from ca. 0.5–4 nA). Importantly for this study, the instrument was also equipped with a Delmic SPARC modular cathodoluminescence detector with both fast intensity mapping and hyperspectral capabilities. Color CL images were obtained in fast intensity mode using a filter wheel and serial collection of blue (<505 nm), green (505–575 nm), and red (>605 nm) channels on a photomultiplier tube detector. Spectral data at select localities were collected using a 150 lines mm−1 grating, a 200-μm slit width, and a Zyla 5.5 CMOS detector optimized for detection in the visible light range. Acquisition times varied from 1 to 10 s and spectra were normalized by area for comparison purposes.
2.4 Electron microprobe analysis
In addition to Zn and S, up to seventeen minor to trace elements were analyzed using the electron microprobe (Piatak et al., 2023; White et al., 2022b). Carbon-coated, polished thin sections were examined using a fully automated JEOL 8900 Electron Microprobe with five wavelength dispersive analyzers. A major challenge in measuring low levels (10s–100s of mg kg−1) of Ge in a Zn-rich (65 wt%) matrix is the proximity of the Zn Kβ peak and the Zn absorption edge to the Ge Kα peak (Supplementary Figure S1). In EDS analysis, the energy resolution is such that in ZnS the Zn Kβ strongly overlaps the Ge Kα peak. The improved energy resolution of wavelength-dispersive spectroscopy analysis allows Ge Kα to be resolved, but the adjacent Zn Kβ peak as well as the Zn absorption edge prohibits a standard background correction using off-peak positions above and below the Ge Kα line.
Operating conditions for analysis were a 40° takeoff angle, accelerating voltage of 20 keV, a beam current of 100 nA, and an electron beam diameter of 1–10 μm. Germanium counts were acquired for 140 s, resulting in a 3σ counting-statistics-based detection limit (CDL) of 80 and 60 mg kg−1 for Ge and Cu, respectively (White et al., 2022b). A complete description of measurements are available in the Supporting Material (SM).
2.5 Mineralogy
Bulk XRD analysis was performed using a PANalytical X’Pert PRO (Almelo, Netherlands) automated powder diffractometer located at the United States Geological Survey in Reston, VA. Synchrotron-based micro-focused XRD patterns were collected at the Advanced Photon Source (APS; Argonne National Laboratory, IL), beam line GSE-CARS 13-ID-E, and Stanford Synchrotron Radiation Lightsource (SSRL; Stanford Linear Accelerator Center, CA) beam line 11–3. At SSRL, micro-focused XRD maps were collected in transmission geometry by raster scanning an area of 5.5 x 8 mm using a 150 μm step size and a 150 x 150 μm beam with a 60 s integration time per pattern, generating a total of 1998 diffraction patterns. A total absorption map was collected by recording the intensity of the direct beam passing through the sample using a photodiode. Data were reduced using GSAS-II to calibrate the detector distance using lanthanum hexaboride (LaB6) and converting the area pattern to a standard 2-D diffraction pattern. See SM for additional details on data collection.
All XRD patterns were analyzed using PANalytical X’Pert HighScore Plus software (version 4.8), which included converting synchrotron-based data to the Cu Kα radiation scale and Rietveld refinements, using standard reference patterns from the Inorganic Crystal Structure Database (ICSD; Fiz Karlsruhe, 2013). The wurtzite domains were mapped by subtracting the background (calculated by summing the signal from 29.20 to 29.68°2θ, a region containing 19 points) from one of two wurtzite-attributed peak regions (peak 1, 29.8–30.2°2θ and peak 2, 30.30–30.8°2θ, each containing 19 points). The position of this wurtzite-attributed peak shifted slightly between the anisotropic domains mapped. Peak shifts could indicate slight differences in the unit cell parameters between the two regions or may be a consequence of deviations from orthogonality between the sample and beam path, which would result in differences in the distance between the sample and the detector among the analyzed areas.
2.6 Micro-focused XRF mapping
Micro-focused XRF maps measure the X-ray fluorescence spectrum of the sample, which results from inelastic scattering of incident X-rays (Fenter et al., 2002). Emitted X-ray energy is characteristic of the element from which it originated, thus enabling the simultaneous mapping of individual elements while the region of interest is being raster scanned. Maps were collected at APS beam line 13-ID-E, operating at 100 mA and configured using a Si (111) double crystal monochromator, Pt-coated Kirkpatrick-Baez focusing mirrors, and a 4-element Vortex ME4 (Hitachi) or a 7-element SXD-7 (Canberra, Austria) silicon-drift energy dispersive spectroscopy detector. Thin sections were placed in fluorescence geometry in a ∼ 2 μm beam and rastered in two or 3-μm steps with a 30 m dwell time. Maps were collected at several energies to optimize for different elements, including: 5,500 eV optimizing for Ag and Sb, 9,300 eV optimizing for Cu and Fe, and 18,000 or 19,000 eV optimizing for high Z-elements. Several maps were collected at energies near the Ge edge, nominally at 11,090 eV (pre-edge), 11,106.5 eV (Ge in sulfide), 11,110 eV (Ge in oxide), and 11,200 or 12,000 eV (post-edge), after an energy shift was applied based on energy calibration using a freshly prepared Ge powder. These energies corresponded with the maximum intensity of the white line measured for Ge4+-S and Ge4+-O environments in samples and reference spectra, and the known spatial distribution of ZnS and hemimorphite, as observed by other techniques. An aluminum (Al) foil filter was used to attenuate Zn fluorescence for the Ge-edge and high-Z element maps. Blank maps were collected in an area of the thin section containing only the epoxy used to embed the sample to ensure that artifacts of sample preparation did not significantly contribute to the measured spectra.
XRF maps were analyzed using the Larch software package (version 0.9.40; Newville, 2013). The Zn Kβ signal was removed by subtracting the map collected at 11,090 eV from those collected at 11,106.5 eV (to highlight the Ge signal from sulfides) and 11,110 eV (to highlight the Ge signal from oxides) after each map was divided by incoming counts. The Ge and Cu maps were linearly scaled from lowest (black) to highest counts (white), after by dividing by the incident flux.
2.7 X-ray absorption spectroscopy
The X-ray absorption spectra can be divided into two regions, the near edge or XANES region, which is typically considered to include 10 eV below edge to 50 eV above it, and the post-edge region or Extended X-ray Absorption Fine Structure (EXAFS) region, which begins about 30 eV above the edge and extends, until post-edge oscillations are no longer measurable (∼1000 eV). The XANES region probes oxidation state, coordination number, and electronic structure within 10s nm. The EXAFS region can provide insight into the local bonding environment, including bond distances, nearest neighbor identity, and coordination number within two to three layers of surrounding atoms (Fenter et al., 2002). This study focused on the Ge and Cu XANES region.
2.7.1 X-ray absorption spectroscopy data collection
Micro-focused Ge and Cu XANES were collected at APS beam line 13-ID-E under the same conditions as μ-XRF mapping. At each beam time, a freshly prepared Ge powder was collected for energy calibration. The energy calibration at the Cu edge was manually adjusted by aligning group I, averaged micro-focused data most similar to the Central Tennessee bulk spectra, with Central Tennessee sphalerite (ZnS_2_1), to account for the variation in energy between the Ge and Cu edges (the necessary shift was between 0.15 and 0.55 eV at different beam times). Blank scans were collected on a portion of the thin section covered with epoxy to be sure the signal measured originated from the sample. In all cases, the blank edge step was found to be negligible (< 2%) relative to the samples (details in Supplementary Figure S3 and Supplementary Table S2). At most locations, a single spectrum was collected, but multiple scans were collected at a few points to improve signal to noise (S:N) ratio and to assess beam damage. For later measurements, a high energy resolution fluorescence detector (HERFD) was used to collect Ge XANES (concurrent with Ge XANES collection using the same energy dispersive detector as used for XRF mapping). This HERFD detector functions similarly to a wavelength dispersive detector in an electron microprobe, consisting of a sample, analyzer crystals, and an area detector (28 cm2 Eiger X 500K detector) all located on a 1 m Rowland circle in Johann geometry with a ∼2 m path length between the sample and detector. Three spherically bent Si (660) crystals were positioned at 78.45° to satisfy the Bragg diffraction condition for 9,886 eV corresponding to Ge Kα fluorescence. The entire path length of the fluorescent X-rays was within a helium-filled enclosure to minimize absorption by air.
Bulk XANES were collected on APS beam line 5-BM-D (Cu, and some Ge references) and at the SSRL beam line 11–2 (Ge only). In all cases, energy calibration was performed with in-line metal standards with the maximum of the first derivative spectra defined as 8,979 eV and 11,103 eV for Cu, and Ge, respectively. Beam line 5-BM-D was equipped with a Si (111) double-crystal monochromator detuned to 60% of maximum value and two 4-element Vortex ME4 silicon drift detectors. The appropriate foil was placed between I1 and I2 for in-line energy calibration. During the measurements, SSRL was operating at 500 mA in top-off mode. Germanium spectra were collected at SSRL on beam line 11–2, which was equipped with a Si (220, phi = 90) double-crystal monochromator, measurements were made with the beam 100% tuned up and a Canberra 100-element germanium detector. In-line energy calibration was performed using a piece of Kapton tape placed at 45° to the incident beam before I0 in order to scatter a small fraction of X-rays onto the appropriate material for energy calibration. A deadtime curve was collected and used during data reduction to correct data for detector non-linearity. All measurements were performed at room temperature with a vertical beam size of 1.2 mm and horizontal beam size that varied in order to optimize the detector flux (typically 10 mm). Aluminum foil was placed between the sample and fluorescence detectors to attenuate Zn fluorescence for Ge measurements.
Reference minerals (identity confirmed by XRD, see details in Supplementary Table S1) were ground and prepared for analysis as a thin layer on Kapton tape with the number of tape layers optimized based on attenuation of the X-ray beam (typically six to eight layers). Exceptions to this were NIST trace element doped fused glasses (610, 612, 614), which were placed directly into the beam. At APS, samples were prepared on Kapton tape to facilitate interrogation using two vortex detectors (positioned in front and behind the sample). At SSRL 11–2 samples were prepared as packed powders in aluminum sample holders.
2.7.2 XANES analysis
X-ray absorption spectra were analyzed using Sixpack (SSRL data reduction only; version 1.56; Webb, 2005) and the Athena package within Demeter (version 0.9.26; Newville, 2001; Ravel and Newville, 2005). After energy calibration (using the maximum of the first derivative), spectra were averaged, if multiple scans were collected, and normalized. For Ge spectra, reported energies are for the maximum of the white line (the energy of maximum absorption), since it could be more reliably identified in spectra with low S:N ratios. Background subtraction was performed using a linear fit to the pre-edge region that was extended through the spectrum. Spectral step heights were normalized to one using a second order normalization.
2.7.3 Linear combination XANES fits
Linear combination fits were performed for Ge and Cu using Athena (version 0.9.26; Newville, 2001; Ravel and Newville, 2005). Fit ranges were determined relative to the top of the white line and fit ranges were -10–20 eV and -20–55 eV for Ge and Cu, respectively. Further, each component was constrained to contributing between 0 and 100%, but the fit components were not forced to sum to 100%. When possible, reference spectra used in the LCFs were collected on the same beam line as sample spectra to account for any differences in resolution inherent to the beam line. Previous work has suggested the detection limit of phases in XANES LCFs is 5–10% (Foster et al., 1998; O'Day et al., 2004). Minor fit components (<5%) were included in this study when they improved the quality of the fit either by visually explaining a diagnostic feature or based on at least a 10% improvement to the r-factor fit statistic. Further, linear combination fits have been shown to deviate by as much as 20% from the composition of known mixtures created to mimic environmental samples, with the largest observed deviations in mixtures with similar molar ratios of the element of interest (O'Day et al., 2004). Thus, while providing essential information, linear combination fits should be considered semi-quantitative in nature.
2.7.4 Germanium quantification
Using the XANES spectra absolute edge step for reference standards and the average edge step for Ge in quartz in the Tar Creek and Yellowhead samples, we were able to estimate the content of Ge in quartz. Synthesized glasses with 40 trace elements were used as references: NIST 610 (447 mg kg−1 Ge), NIST 612 (36.1 mg kg−1 Ge), and NIST 614 (0.942 mg kg−1 Ge; Jochum et al., 2011). This produced a calibration curve with R2 = 0.9996, which was then used to estimate the quartz content in sample spectra. The NIST glasses with lower Ge content showed evidence of multiple bonding environments (likely Ge2+ and Ge4+), which may be an inherent quality of the standard or may be due to beam induced reduction (e.g., Holton, 2009). The calibration curve assumes that the absorption of these species is the same, meaning that the magnitude of the edge step would result from the sum of the two species.
Germanium was also quantified in ZnS, using Ge content estimated from post-synchrotron microprobe analysis of one to five points surrounding a XANES location. Although Ge content varied on the micrometer scale, the calibration curve had an R2 = 0.82, indicating that this approach to estimating Ge content based on the absolute edge step could be useful in systems where matrix-matched standard reference materials do not exist. Using the absolute edge step for elemental quantification, while not typical in synchrotron science, could potentially be useful in some instances.
3 Results
3.1 Overview
This study outlines a novel workflow combining a suite of complementary, non-destructive micro-focused and bulk techniques to examine Ge and potential co-substituents in ZnS, with each technique providing a unique contribution (Table 1). As shown in Figure 1, analyses typically proceeded from left to right, beginning with optical microscopy and moving toward synchrotron-based techniques after extensive pre-characterization. Optical microscopy was used to identify areas for further investigation. Electron microscopy was used to collect high resolution images in regions of interest, and CL imaging proved a powerful tool for visualizing implied trace element heterogeneity. Microprobe-determined chemistry resulted in quantitative elemental concentrations and correlations, and assisted in explaining zonation trends observed in CL images. This characterization allowed informed selection of regions of interest for synchrotron-based analyses. Synchrotron-based characterization included XRD point analyses and mapping, XRF elemental and, in some cases, Ge phase mapping, and XANES analyses to examine bulk and micro-focused Ge and Cu speciation.
3.2 Optical microscopy
Optical microscopy provided unique and essential information on crystal shape, habit, color, and zoning, as well as on textural relationships among crystals (Figure 2). Transmitted light was important in documenting color variations in ZnS, a mineral that is colorless when pure, with color differences reflecting variations in trace element content (Figure 2A; Figure 3A). Additionally, cross-polarized transmitted light was used to evaluate the distribution of isotropic and anisotropic domains, since ZnS can occur as either hexagonal wurtzite or cubic sphalerite (Figure 2A; Figure 3B). The trace element enrichment has been shown to influence crystalline structure of ZnS (e.g., Seal et al., 1985; Pring et al., 2020). Synchrotron-based techniques are typically considered non-destructive, but in some cases the incident beam has been known to damage samples (Holton, 2009). Transmitted light was used to document beam-induced changes after synchrotron analyses in a few samples (Figure 2B). In Figure 2B, the boundary of the XRF map is indicated by yellowing and XANES points resulted in further darkening (white arrows). While important to note and document this damage, the XANES spectra were deemed to be of usable quality because no differences were observed between replicate scans. Transmitted light was also useful in the identification of sub-surface inclusions that were not observed by other near-surface imaging techniques [SEM-backscattered electron (BSE) or reflected light microscopy]. For example, post-microprobe reinvestigation of some areas by optical microscopy identified pyrite inclusions just below the surface, which explained anomalously high Fe contents in some microprobe analyses (Figure 2C). Reflected light microscopy was an important tool for the identification of opaque sulfide minerals and inclusions that were difficult to observe using other approaches. One such example is chalcopyrite disease, shown in Figure 2D, where micrometer- to nanometer-sized inclusions of chalcopyrite resulted in high Cu content microprobe analyses (Barton and Bethke, 1987). These sub-micrometer high Cu regions were very subtle in BSE images and may not be visible with typical brightness and contrast settings. These examples demonstrate the value of examining samples with optical microscopy throughout the characterization process.
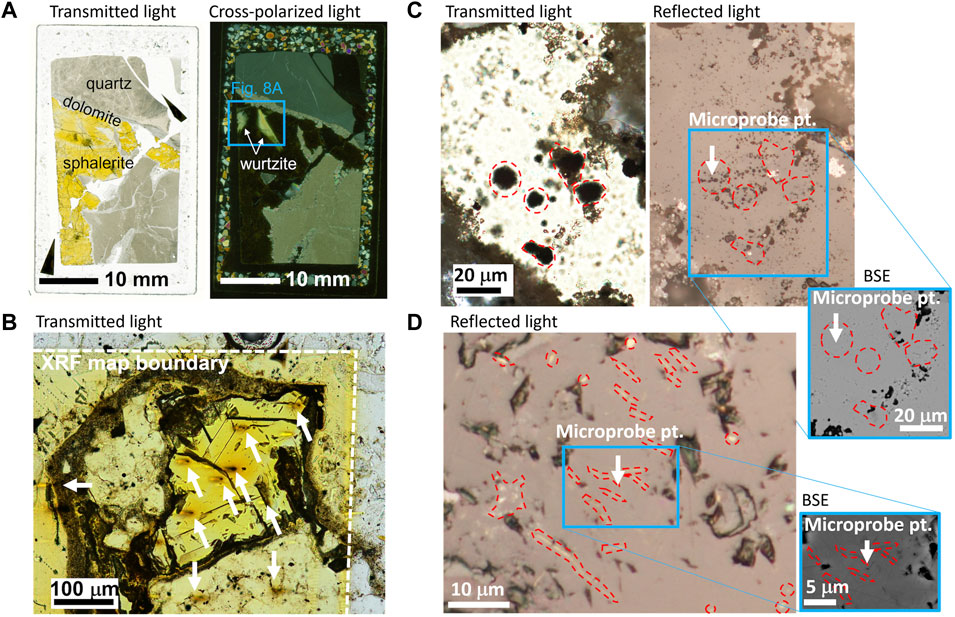
FIGURE 2. Applications of optical microscopy. (A) Transmitted light image showing the distribution of minerals in this sample. Sphalerite color varied from clear to golden yellow. A cross-polarized transmitted light image of the same sample revealed the distribution of anisotropic regions, which indicate the presence of non-cubic ZnS. (B) Transmitted light image collected post-synchrotron in order to document changes induced by the synchrotron X-ray beam. Note yellowing of the entire μ-XRF map region. Also note dark orange marks where XANES spectra were collected (white arrows). Although potentially indicating beam damage, no changes were observed in spectra when multiple XANES scans were collected. (C) Transmitted light image showing the presence of several sub-surface Fe-rich inclusions, which were not visible in reflected light or SEM-BSE (see BSE inset). These inclusions explain anomalously high Fe in microprobe analysis (white arrow). (D) Reflected light image indicates the presence of chalcopyrite (brassy spots and strips typically oriented lower right to upper left, some of which are outlined in red) within sphalerite. The chalcopyrite required high contrast settings in the SEM-BSE to observe (see BSE inset), but explains the high Cu in microprobe analysis (white arrow).
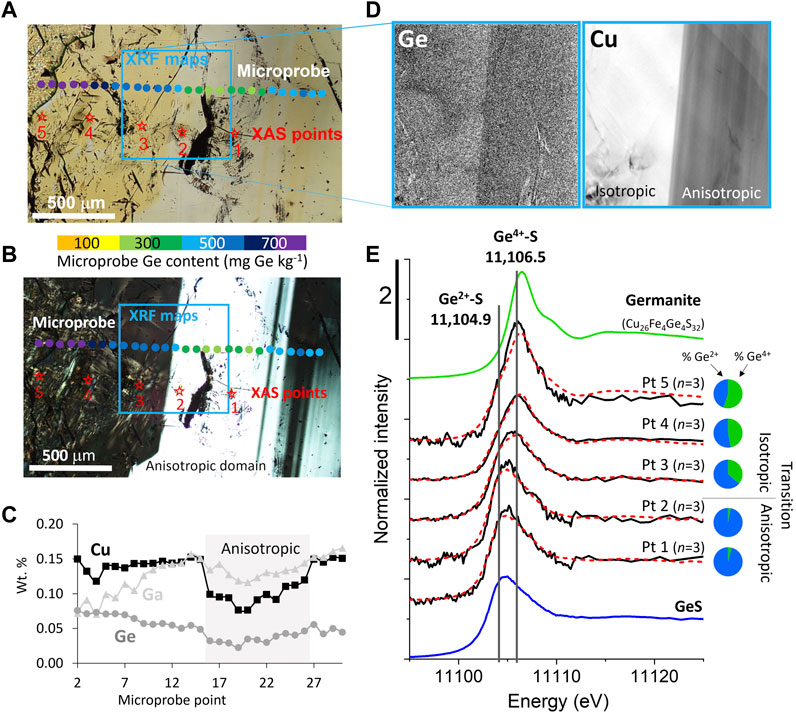
FIGURE 3. Ge content and speciation gradient in Central Tennessee sphalerite (sample ZnS_5). (A) Plane-polarized transmitted light image showing transparent ZnS strip vertically bisecting image. (B) Cross-polarized transmitted light image with anisotropic ZnS strip vertically bisecting image. In Figures 3A,B, red stars indicate μ-XANES locations, and colored dots indicate microprobe locations, with dot color indicating Ge content. (C) Electron microprobe-determined content of Ge, Cu and Ga for the same transect shown in Figures 3A,B. (D) μ-XRF maps demonstrate Ge and Cu spatial distibution for area defined by the blue boxes in Figures 3A,B (maps individually scaled with lowest intensity shown in black and highest intensity shown in white). (E) Germanium XANES spectra for transect shown in red stars in Figures 3A,B. Linear combination fits are shown in red dashed lines, with results shown in pie charts. These fits indicate progressive increase in Ge4+ abundance from point 1 to point 5 with the largest difference in the observed speciation mixture between the anisotropic domain (mostly Ge2+; points 1 to 2) and isotropic domains (mixed Ge oxidation states; points 3 to 5).
3.3 Scanning electron microscopy and cathodoluminescence
Scanning electron microscopy was used to investigate mineral associations: mineral inclusions were located down to a sub-micrometer scale, EDS spectra identified main elements present and facilitated mineral identification, and BSE images documented zoning within sphalerite (Figure 1). However, as previously mentioned, the SEM can miss important features, such as buried inclusions (Figure 2C) and, depending on brightness and contrast settings, may fail to differentiate minerals with similar mean atomic numbers, such as sphalerite and chalcopyrite (Figure 2D). Reexamination and reanalysis with optical microscopy and SEM using high contrast was required to observe some instances of chalcopyrite disease within sphalerites (Figure 2D).
Red-green-blue (RGB) CL images can be collected rapidly (<10 min) and are highly sensitive to variations in trace element content, even if the CL responses of individual elements is not clear. For example, Figure 4A shows a BSE image of a sphalerite grain (white) surrounded by quartz (dark gray) and secondary needle-like hemimorphite [Zn4(Si2O7) (OH)2·H2O; medium gray]. Although the sphalerite appeared to be homogeneous in this BSE image (with brightness and contrast adjusted to show multiple phases), the grain exhibited fine-scale oscillatory zoning in CL, which was locally truncated by vein-like zones of CL-dark ZnS (white arrows in Figure 4A). Microprobe data show that darker CL zones in sphalerite correlated with lower Ge and Cu, and high Fe content, whereas the areas with the highest intensity red CL response also have the highest Ge and Cu contents.
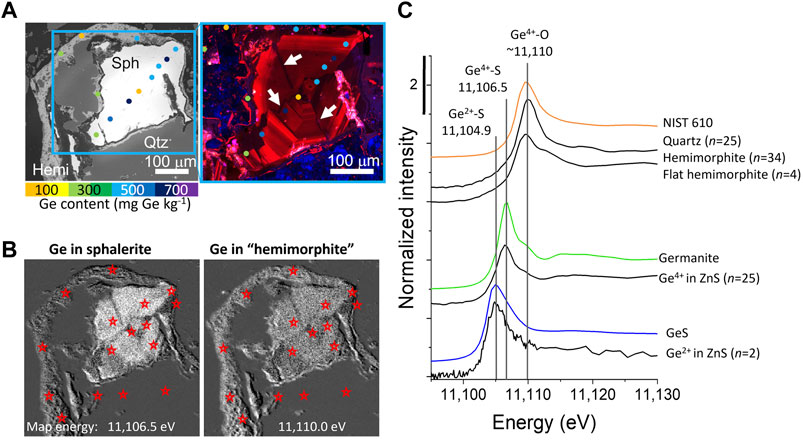
FIGURE 4. Ge speciation in sphalerite, quartz, and hemimorphite. (A) SEM-BSE and cathodoluminescence images from a representative location from a Tar Creek Mahutska sample (CL region slightly smaller, see blue box in BSE image). Microprobe locations shown with colored dots, with color indicating Ge content, and low CL regions indicated with white arrows. (B) Phase map highlighting the distribution of Ge in sphalerite and Ge in hemimorphite (hemimorphite is in quotations below because Ge in sphalerite has a non-zero absorbance at this energy). In these gray-scale images, white corresponds with higher Ge-containing phase, whereas black indicates the absence of Ge-containing phases. Red stars indicate locations where Ge μ-XANES spectra were collected (individual spectra not shown). (C) μ-XANES spectra of Ge4+ in quartz, typical hemimorphite and a few hemimorphite spectra with a flat white line, Ge4+ in sphalerite, and, rarer, Ge2+ in sphalerite. Reference spectra (colored lines) are shown with characteristic maximum absorption energies indicated.
Despite appearing similar in BSE, the sphalerite grains in Figure 5 had highly variable CL responses, which fall into two general categories: dark blue with low intensity (Figure 5A, e.g., grain with spot 4), and highly variable red intensity (Figures 5A,B, e.g., grains with spots 9, 10 and 15). Based on the elemental contents (tabulated in Figure 5), grains with low Fe and high Cu appeared bright red. In contrast, grains with higher Fe content correlated with a dark response in CL, consistent with prior studies demonstrating the quenching effect of Fe on CL response (Marfunin, 1979; Kuhlemann and Zeeh, 1995). Some grains showed oscillatory zoning in CL (Figure 5A, grain with transect), whereas others exhibit patchy zoning (Figure 5A, grain with spot 9). The traverse in Figure 5A showed that the bright red CL stripes spatially correlate with the zones of highest Cu and gallium (Ga) and, generally, negatively with cadmium (Cd) and Ge content (Figure 5C). Importantly, in some instances systematic CL zoning in sphalerite was truncated by sphalerite with a different CL response (Figure 5A, see white arrow on grain with transect). These truncations, not visible in BSE images, indicated the presence of multiple generations of sphalerite, important for determining paragenesis. The sample from Tar Creek (Figure 5B) showed a similar range of CL responses varying between blue and bright red, but also contained grains that exhibited sector zoning in CL (Figure 5B, grain with spot 15), suggesting the preferential incorporation of some trace elements into specific crystal faces, as has been noted previously for Cd and Cu (e.g., Bonnet et al., 2016).
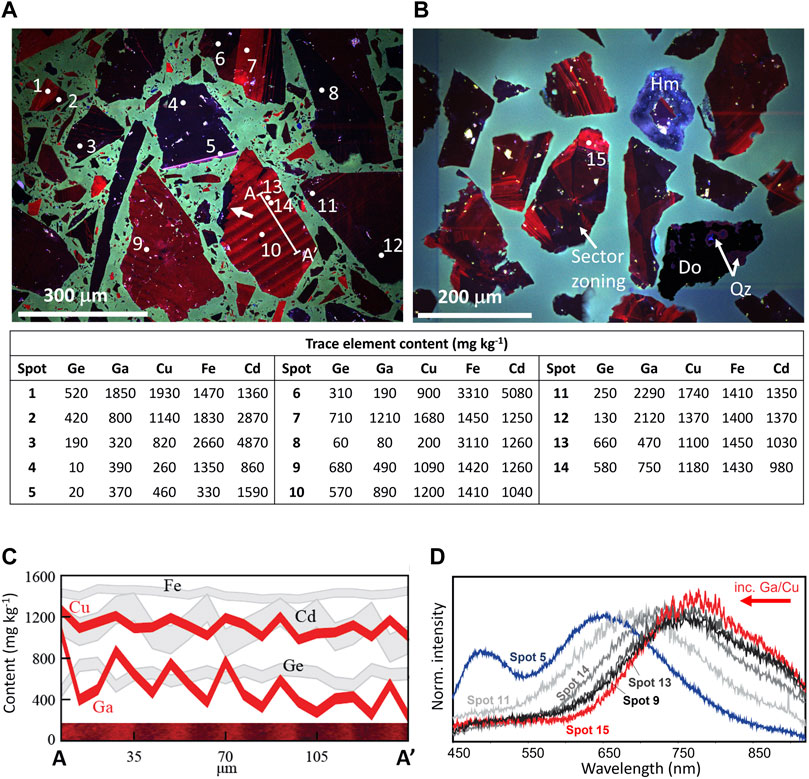
FIGURE 5. Cathodoluminescence variability in sphalerite. All large grains in images are sphalerite, unless otherwise indicated, and the mounting epoxy luminesces green and blue. (A) RGB-filtered CL image of a Central Tennessee sphalerite concentrate (Conc G), including microprobe analyses for selected trace elements (spots 1–14). Grains are highly variable in CL response and chemistry, but dark grains are universally higher in Fe than red grains, which typically have higher Cu, Ge, and Ga content. Traverse A-A′ is indicated with a white line and is orthogonal to oscillatory zoning, whereas a white arrow indicates an example of zoning truncation, indicative of multiple generations of sphalerite. (B) RGB-filtered CL image of a sphalerite concentrate from Tar Creek (Mahutska). (C) Microprobe traverse of oscillatory zoned sphalerite indicated in Figure 5A traverse (A to A′). In this traverse, the linewidth represents 1 standard deviation. Red luminescence correlated directly with Cu and Ga, and generally inversely with Cd. The relationship with Ge and Fe were less clear. (D) CL spectroscopic response of spot locations indicated in Figures 5A,B. These preliminary data suggest a blue shift with increasing Ga/Cu. Minerals: Hm = hemimorphite, Do = Dolomite, Qz = quartz.
Spectral CL data were also collected in selected areas and representative intensity data are plotted in Figure 5D. This approach to collecting CL data is significantly slower than RGB-binned images described above, since a full CL spectrum is collected at every location, requiring longer acquisition times. Interestingly, the spectral data demonstrated that the shape of the spectral response in “red” (>605 nm) zones in RGB filtered images varied among the grains. For example, most analyzed grains from Tar Creek and Central Tennessee exhibited a maximum intensity at ∼800 nm (Figures 5A,B, spots 9, 13, and 15), but some spectra exhibited a maximum intensity at ∼700 nm. In some instances, variations in the wavelength of maximum intensity were observed within the same grain (Figures 5A,D, spots 13 and 14). This shift in the maximum intensity wavelength correlated with variations in the Ga/Cu mass ratio. Comparing only grains with similar Fe content (1410–1450 mg kg−1; Figures 5A,D, spots 9, 11, 13, and 14), the maximum intensity wavelength shift from 800 to 700 nm was accompanied by an increase from 0.44 to 1.32 in the Ga/Cu mass ratio, respectively. These data suggest that CL hyperspectral mapping may be a sensitive and relatively rapid method for mapping this ratio in samples with similar Fe contents. Further, the spectrum with anomalously low Fe content (330 mg kg−1; Figures 5A,D, spot 5), was quite different than the other spectra and this may reflect a stronger response from other activators in the absence of significant Fe quenching.
Multiple studies have demonstrated that the presence of Fe quenches the CL response, to the extent that many natural sphalerites do not luminesce (Marfunin, 1979; Kuhlemann and Zeeh, 1995). Central Tennessee and Tar Creek each contained an average of ∼0.2 wt% Fe and were strongly luminescent (Piatak et al., 2023; White et al., 2022a). In contrast, most generations of sphalerite from the Red Dog SEDEX deposit had >2 wt% Fe (Piatak et al., 2023) resulting in quenching of the CL signal. For the CL detector used in this study, a nominal Fe content of approximately 0.3 wt% was the cutoff for obtaining useful CL images from sphalerite. CL images revealed complex and fine-scale zonation within ZnS that was not evident by other techniques and was used to guide the subsequent analysis of a large range of sphalerite compositions and identification of trace element zonation that would otherwise have been missed.
3.4 Electron microprobe analysis
Electron microprobe analyses were collected in areas of interest identified using optical microscopy, SEM-BSE, and CL imaging (Figure 1, Figure 3A, Figure 4A, Figure 5). Due to its importance to this study and the complexities of measuring Ge in a ZnS matrix, specific focus was placed on the measurement of Ge, resulting in an average CDL of 80 mg kg−1. Colored dots overlayed on the optical images in Figures 3A,B show the Ge content along a microprobe transect. Notably, variations in color and isotropy correlated with Ge, Ga, and Cu content, with the nearly colorless (Figure 3A), anisotropic (Figure 3B) stripe running vertically through the middle of the image was characterized by lower Ge and Cu and higher Ga relative to the bright yellow isotropic domains (Figure 3C). Similarly, Figures 4A,B show microprobe analyses of Ge as colored dots superimposed on SEM-BSE and CL images of a ZnS grain surrounded by hemimorphite and quartz. The orange dot in the middle of the ZnS grain had an anomalously low Ge content (<100 mg kg−1 Ge) relative to surrounding analyses with Ge contents >400 mg kg−1. Although the ZnS grain appeared uniform in the BSE image, the location of the analytical spot with low Ge content directly correlated with one of several narrow vein-like dark CL areas that truncated the otherwise red oscillatory zoned ZnS crystal. This textural relationship suggested the dark CL (and low Ge and Cu, and high Fe) sphalerite post-dates the red sphalerite in this grain (Figure 4A).
Microprobe datasets for each district revealed broader trends in trace element associations, and imply substitutional mechanisms. For example, Figure 6A shows microprobe data for sphalerites from the Metaline and Central Tennessee mining districts. Sphalerites from the Josephine and Yellowhead ore zones displayed a strong correlation (R2 = 0.95) between Ge and Cu content along the Ge:2Cu molar ratio line, consistent with a Ge4+ + 2Cu+ ⇔ 3Zn2+ substitutional mechanism. In contrast, Central Tennessee data were more complex with a few higher Ge content data lying above the Ge:2Cu molar ratio line, but most data lying below the line. These data clearly indicated that the substitutional mechanism of Ge into ZnS in the Central Tennessee mining district was more complex, consistent with multiple substitutional mechanisms. These observations highlight the utility of Ge XANES to explain the microprobe observations and substitutional mechanisms.
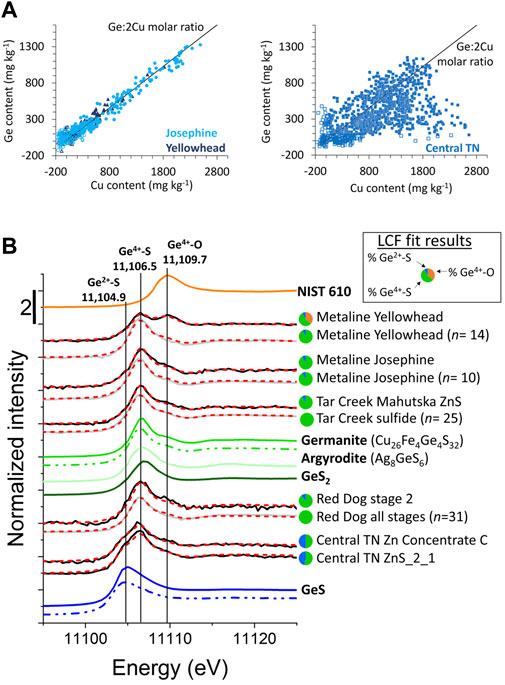
FIGURE 6. Selected electron microprobe data, and bulk and micro-focused Ge XANES spectra. (A) Microprobe data from Metaline and Central Tennessee districts. Analyses from Metaline demonstrate a strong correlation between Cu and Ge along the Ge:2Cu molar line, whereas the Central Tennessee analyses indicate a less clear relationship between Cu and Ge. Open symbols indicate data that are below detection limit for at least one element. (B) Germanium micro-focused and bulk XANES spectra. Micro-focused spectra are shown in gray with the number of merged scans (n) indicated in the label, while bulk XANES are shown in black. Linear combination fits using NIST 610, germanite, and GeS references are plotted in red dashed lines with results in the pie charts. Reference spectra are plotted in color with solid lines representing bulk measurements and dash-dot-dot indicating micro-focused data.
3.5 Micro-focused mineralogy
Large anisotropic domains were identified in ZnS from the Central Tennessee mining district (Figure 2A; Figure 3A, B). Figure 7A is a cross-polarized transmitted light image, showing the distribution of isotropic sphalerite and anisotropic domains tentatively identified as wurtzite. Quartz and dolomite are also present (appearing gray) along the top side of the image and were useful in aligning the images and in confirming the calibration of XRD patterns. Figure 7B is the total X-ray absorption map, which recorded the intensity of the direct beam passing through the sample without being scattered. This image clearly shows that a larger fraction of the incident beam passed through the sample in the quartz/dolomite region (top of image) and the epoxy-only region (left of image) relative to the ZnS region, which was useful for alignment. Figure 7D shows the 37 diffraction patterns collected across the transect A and A’, as shown in Figures 7A–C. Beginning at point A, the first three to four patterns contained peaks consistent with quartz and dolomite. The next two patterns and last 10 patterns had peaks consistent with only sphalerite. The diffraction patterns collected in the middle of the transect contained peaks consistent with both sphalerite and wurtzite, as has been previously reported (Figure 7D; Bonnet et al., 2016; Pring et al., 2020). In all patterns, a broad hump centered at ∼22°2θ resulted from the slide to which the thin section of sample was affixed. Anisotropic regions were mapped using the wurtzite peak at ∼30°2θ (Figure 7C), these maps demonstrate excellent agreement to the optical microscopy observations (Figure 7A). The wurtzite peak position varied slightly between the two anisotropic zones, indicating slight variations in the lattice parameters between the two regions or that the sample was not positioned exactly in the plane orthogonal to the incident beam during analysis.
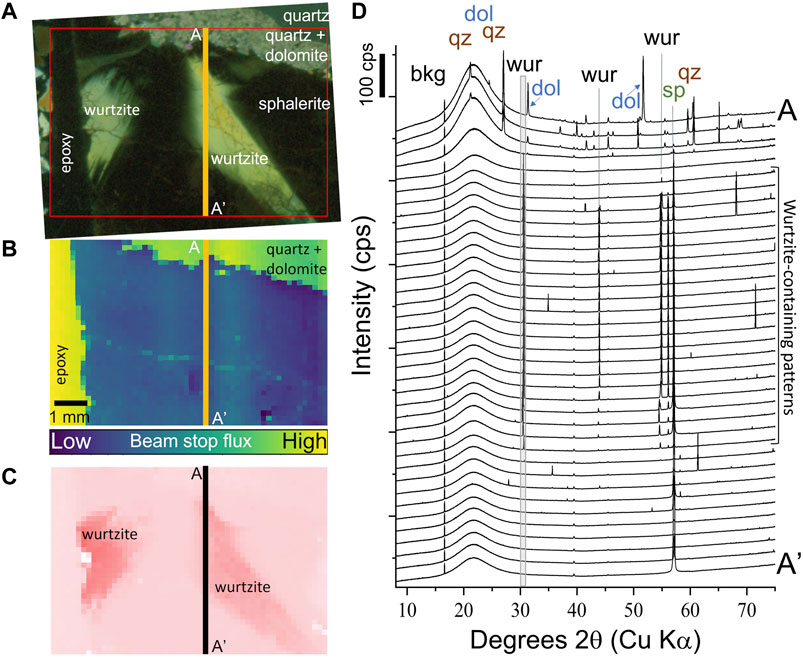
FIGURE 7. Synchrotron-based XRD investigation of anisotropic regions in Central Tennessee ZnS. (A) Cross polarized transmitted light (red box is the region shown in Figures 7B,C). (B) Total absorption map (scale bar same for Figures 7A,C) showing more X-rays transmitted through epoxy, quartz, and dolomite than ZnS. (C) ZnS polymorph distribution (sum of wurtzite peak intensity at 30°2θ peak). Wurtzite appears dark pink, while all other phases appear light pink (meaning there is no peak at 30°2θ). (D) Diffraction patterns for transect A to A′, demonstrating the presence of wurtzite peaks at 30°2θ and ∼55°2θ and sphalerite peak at about 57°2θ in the middle XRD patterns.
3.6 Micro-focused XRF mapping
3.6.1 Multi-element maps
The spatial distribution of multiple elements was documented using XRF mapping, including elements that occur at contents below the microprobe detection limit. XRF mapping was an effective tool to connect elemental distribution and the locations of XANES analysis with other properties (e.g., color, CL signal, and isotropy; Figure 1). These maps were also used to identify elemental correlations, which could imply substitutional mechanisms and paragenetic relationships. Figure 3D shows the distribution of Ge and Cu and reveals that their content is correlated (higher contents are indicated by lighter colors). Note that subtracting the Zn signal from the Ge map was essential to isolate the relatively small Ge Kα signal from the much larger Zn Kβ signal, the same overlap that complicates microprobe analyses (Supplementary Figure S1). The Zn Kβ emission line also precluded mapping the distribution of Ga Kα (Kα1= 9,251.7 eV) using an energy dispersive detector, such as those typically employed in XRF mapping experiments.
In several instances the Ge signal was mapped simultaneously using both HERFD and EDS detectors enabling a direct comparison of the detector responses. HERFD detectors have better energy resolution, which we hoped would improve the S:N of the Ge Kα map. However, for maps collected simultaneously with both detectors, the HERFD map had much worse S:N ratio compared to the EDS detector, due to the lower flux. Although the HERFD has better energy discrimination, resulting in rejection of Zn signal because it passes a narrower range of energies, this did not compensate for the lower flux on the HERFD detector. Despite the lower flux, the HERFD detector could become an essential tool for elements with strong matrix overlaps (such as Ge and Ga in ZnS) if the count times were increased or flux was collected from a larger solid angle.
3.6.2 Phase mapping
Phase mapping is an approach that involves mapping at several energies around the absorption edge of a single element in order to distinguish between species based on edge features. Figure 4B shows maps collected at 11,106.5 and 11,110 eV (the maximum absorption energies of Ge4+ bonded to S and O, respectively), to highlight the distribution of Ge4+ in sphalerite and hemimorphite, respectively. Note that both spectra have non-zero absorption at both energies (Figure 4C), but each map highlights the distribution of a single phase. Germanium was also present in quartz, but the content was too low to be identified in the XRF map.
This approach was also attempted to distinguish between Ge2+-S and Ge4+-S by mapping at 11,104.9 and 11,106.5 eV in regions known to contain both Ge oxidation states, based on XANES spectra. However, the Ge2+ and Ge4+ were not distinguishable, likely due to the smaller energy difference between the Ge2+ and Ge4+ in sphalerite (ΔE=1.6 eV) relative to the energy difference between Ge4+ bonded to sulfur and oxygen (ΔE=3.5 eV). A related challenge is that these spectra have more similar absorbance coefficients at each energy than for the sulfide versus oxide system as a result of the significant white line apparent in the hemimorphite spectra, complicating conclusive deconvolution of the distribution of the two sulfide species. As a result, mapping the distribution of the two sulfide species is likely not currently possible.
3.7 Germanium X-ray absorption spectroscopy
XANES spectra were collected on references representing Ge2+-S, Ge4+-S, and Ge4+-O bonding environments, which had diagnostic white line maximum energies: 11,104.9 eV, ∼11,106.5 eV, and ∼11,110 eV, respectively (Figures 4C, Figure 6B). The Ge2+-S environment was represented by GeS. Several spectra were collected for references containing Ge4+ in tetrahedral coordination with S, including GeS2, argyrodite (Ag8GeS6), and germanite. These spectra exhibited slight variations in post edge features and the maximum energy of the white line (11,107.0, 11,106.7, and 11,106.5 eV, respectively; Figure 6B), with germanite being most similar to sample spectra. Similarly, of the several spectra collected to represent Ge4+-O environment (GeO2, and several NIST glasses), NIST 610 was the most similar in edge position and shape to the sample spectra (White et al., 2022a). It is interesting to note that the observed shift in the white line between the two Ge oxidation states when bonded to S (ΔE= 1.6 eV between GeS and germanite) is less than the shift observed between Ge4+ bonded to S and O ligands (ΔE= 3.2 eV between germanite and NIST 610). However, these values are similar to the energy shifts reported for similar compounds by other studies (Belissont et al., 2016; Bonnet et al., 2017; White et al., 2022a) and indicate that the chemical energy shift is larger than the oxidation state energy shift. Prior work has noted that the spread of edge energies increases with Ge oxidation state and that for Ge4+-compounds, edge energy increases with increasing ligand electronegativity and ionic bond character (Pugsley et al., 2011; Belissont et al., 2016; Bonnet et al., 2017).
Micro-focused XANES spectra were an essential component of identifying several unique Ge bonding environments in mine wastes from the Tar Creek Superfund Site (Figure 4C). In these mine wastes, Ge was identified in sphalerite, quartz, and hemimorphite [Zn4(Si2O7) (OH)2·H2O], a secondary weathering product of ZnS (White et al., 2022a). The micro-focused spectra were initially examined and sorted based on the white line energy, peak shape, and edge step, without knowledge of the location where they were collected. When compared with the known phase distribution, there was excellent agreement between XANES-determined phases, and those determined by optical microscopy, SEM-BSE images, and μ-XRD. The quartz and hemimorphite both had white lines at ∼11,110 eV, but were readily distinguished from one another based on peak shape and absolute edge step, because hemimorphite contains significantly more Ge than quartz. Quartz spectra were characterized by a maximum absorbance at 11,110.0 ± 0.15 eV [number of spectra n)=25] and a small absolute edge step (4.6 ± 0.4 x10⁻⁶; Figure 4C). Normalized quartz spectra have a taller and narrower white line relative to hemimorphite and a lower background in the raw spectra, due to not having the overlapping Zn signal. Most hemimorphite spectra were characterized by a slightly lower and more variable energy maximum 11,109.5 ± 0.76 eV (n=34), as well as a larger and more variable absolute edge step (9 ± 4 x10⁻⁵). Further, a few hemimorphite spectra (n=4) were characterized by a flatter edge step (Figure 4C). The variations in the hemimorphite XANES spectra reflect variations in the Ge bonding environment, which is typical of secondary phases forming under surficial conditions. Hemimorphite is a weathering product that forms rinds of overlapping needle-like grains, which are typically narrower than the beam diameter along the narrow axis, so the beam likely interacts with a mixture of hemimorphite, epoxy, and other minerals, which may also contribute to the spectral heterogeneity.
Bulk XANES reveal that in ZnS from Tar Creek, Ge4+-S was the dominant species, with a minor population of Ge2+-S (Figure 6). Indeed, these variations in oxidation state can occur on the micrometer scale, because several micro-focused spectra indicated the presence of both Ge2+ and Ge4+, within the scale of the 2–3 μm incident X-ray beam (White et al., 2022a). The abundance of Ge2+-S can be estimated based on bulk fits and by the number of micro-focused spectra containing Ge4+ (n=25), Ge2+ (n=2), and mixed (n=2) spectra, both of which indicate the presence of ∼90% Ge4+ in sphalerite (Figure 4C). Further evaluation of the locations where Ge2+ was detected, using CL, SEM, optical microscopy, or trace element content, did not reveal any characteristics of Ge2+-rich areas that could be used to predict their location in Tar Creek samples.
Figure 3E shows an example of Ge spectra collected across a ZnS transect from an anisotropic domain with lower Ge and higher Ga content to an isotropic domain with higher Ge (.1 to .5). The maximum of the white line increases in energy from .1 to .5 from 11,105.0 to 11,106.0 eV, indicating a shift in the oxidation state from dominantly Ge2+ to an evenly mixed Ge2+ and Ge4+ environment, although LCFs indicate a mixture of Ge oxidation states in all spectra. The spectra from points 1 and 2 are very similar to the GeS reference spectra, indicating Ge2+ is the dominant oxidation state. In .3 to .5, a progressive shift in white line to higher energy indicates a more mixed bonding environment and a progressively higher fraction of Ge4+, although both Ge2+ and Ge4+ oxidation states occur within the scale of the incident X-ray beam (ca. 2–3 μm).
Micro-focused XANES is a powerful tool for identifying end members and characterizing minor Ge-bearing species (such as Ge in quartz and Ge2+-S in sphalerite; Figure 4), but caution is needed when extrapolating 10s of μ-XANES spectra to the sample or deposit scale. Bulk XANES measurements provide an excellent complement to μ-XANES by estimating the overall abundance of each Ge species in the larger sample. Bulk and micro-focused sample spectra were fit using linear combinations of GeS, germanite, and NIST 610, and the fit results were largely consistent between the bulk and micro-focused analyses (Figure 6B). Sphalerites from some locations, such as Metaline, Tar Creek, and Red Dog were dominated by Ge4+, whereas the Ge speciation at Central Tennessee was a mixture of Ge2+ and Ge4+. The micro-focused spectra were all well-fit using only endmember references representing the Ge2+-S and Ge4+-S environments. However, the bulk spectrum from Yellowhead exhibits a significant peak at 11,110 eV, which originates from Ge in quartz, since the bulk sample is mostly composed of quartz and carbonates with a smaller amount of sphalerite. Similarly, the bulk spectra fit for Red Dog indicates the presence of Ge2+ that was not detected in the micro-focused spectra. Although Ge2+ is a minor component in the bulk fit for the Stage 2 sphalerite from Red Dog, it demonstrates the importance of complementary bulk measurements to assess how representative μ-XANES are of the larger sample. Thus, in samples examined here, the micro-focused spectra were often, but not always, reflective of the bulk materials.
3.7.1 Quantification of Ge using absolute edge step
Although the absolute edge step is proportional to Ge elemental content, elemental quantification is not often attempted in synchrotron-based science. Attempts at quantification are often conducted using a single calibration point with a non-matrix-matched thin films, limiting the results to being, at best, semi-quantitative in nature. Micro-focused XANES revealed a measurable amount of Ge in quartz, which literature suggests can incorporate up to 2–3 mg kg−1 Ge (Evans and Derry, 2002) and as much as 17 mg kg−1 Ge (Wertich et al., 2018). Figure 8A shows NIST glass spectra, which show decreasing S:N with decreasing Ge content, as expected. Also evident in the spectra is the presence of two oxidation states, especially in NIST 614, which may be inherent to the standard or indicative of beam-induced reduction. A calibration curve was generated with the assumption that Ge atoms have the same absorption regardless of oxidation state, and thus the measured edge step is reflective of all Ge in the sample, regardless of oxidation state. The calibration curve, shown in Figure 8B, had an R-squared value of 0.9996, indicating a good correlation between edge step and Ge content. The Ge content of the quartz was estimated at 2 ± 2 and 9 ± 2 mg kg−1 Ge in quartz from Tar Creek and Yellowhead, respectively, based on the average and standard deviation of the spectra edge steps (number of spectra is 25 for Tar Creek; White et al., 2022a) and three for Yellowhead. These results are further supported by a comparison of the S:N between the references and the single quartz spectra (Figure 8A, gray spectra). The Tar Creek spectra had slightly better S:N than the NIST 614 spectrum and the Yellowhead spectra has S:N nearly as good as NIST 612, consistent with their relative Ge contents.
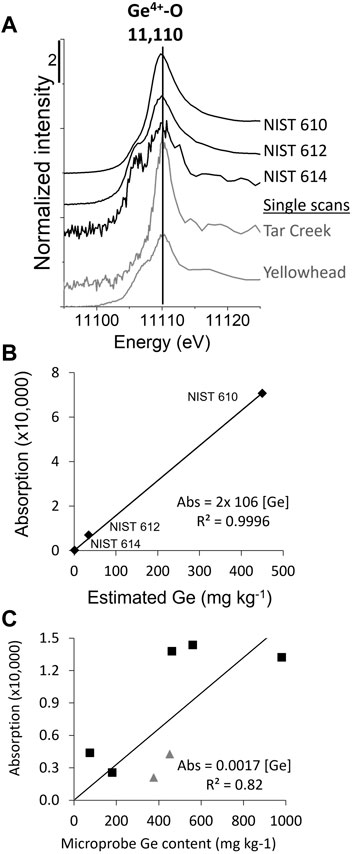
FIGURE 8. Quantification of Ge in quartz and sphalerite. (A) Quartz XANES spectra, including NIST 610, 612, and 614, containing 447, 36.1, and 0.942 mg kg−1 Ge, respectively (Jochum et al., 2011). Representative individual quartz μ-XANES spectra from Tar Creek and Yellowhead (gray lines), which were included to give a sense of the noise associated with a single spectrum; (B) Quartz calibration curve; (C) Sphalerite calibration curve (black squares are for Ge4+ spectra and gray triangles are for Ge2+ spectra, mixed Ge oxidation state spectra were not included).
Because certified reference materials for Ge in sphalerite, similar to the NIST glasses, do not exist, we developed a calibration curve for Ge in sphalerite based on microprobe data. After synchrotron analysis, microprobe analyses were collected near XANES locations (Figure 8C). Small-scale spatial Ge heterogeneity was reflected in a lower R-squared (0.82), but the absolute edge step was nonetheless highly correlated with the microprobe-determined Ge content. While more challenging than the calibration curve for quartz and uncommon in the literature, this proved to be an effective method that could be valuable for other studies.
3.7.2 High resolution germanium XANES
High energy resolution fluorescence detector data have increased spectral resolution because the measurement is less affected by core-hole lifetime that causes absorption edge broadening (Hämäläinen et al., 1991). HERFD has not been applied extensively to dilute samples with complex matrices (e.g., Bissardon et al., 2019; Nehzati et al., 2021), but offers an excellent solution in instances like this study when additional energy resolution is useful in isolating the targeted signal. In Figure 9, raw HERFD and EDS spectra are plotted together (HERFD shown in red dashed lines). The HERFD background was lower and more consistent, which makes normalizing data significantly easier (Figure 9A). The lower background indicated that the HERFD effectively rejected background matrix fluorescence (Zn Kβ) and passed the targeted signal (Ge Kα). Whereas broadly similar to EDS data, the HERFD spectra were characterized by a sharper, narrower absorption edge with higher white line amplitude when normalized. As expected, the HERFD has better spectral resolution, as can be seen for several reference XANES and the first derivative XANES spectra (Figure 9B).
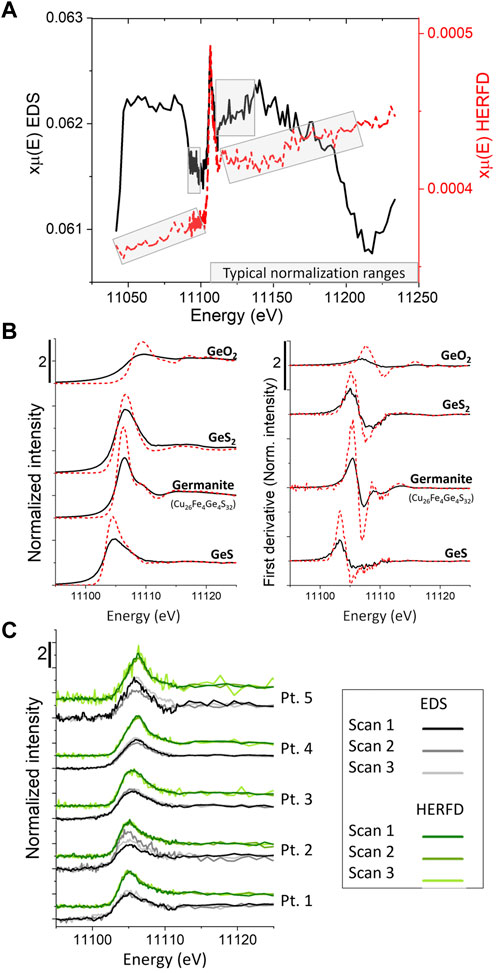
FIGURE 9. Comparison of HERFD and EDS Ge μ-XANES spectra. (A) Typical raw sphalerite spectra from HERFD (red line) and EDS (black line) detectors collected simultaneously. Note, HERFD has lower background and a more linear pre- and post-edge, enabling easier normalization; (B) Normalized reference spectra and first derivative of normalized spectra, demonstrating the higher spectral resolution of the HERFD data; (C) Comparison of individual scans from HERFD and EDS detectors from the transect shown in Figure 3. Note that the S:N ratio in most scans is better for the HERFD data, but both detectors intermittently exhibit unusually low S:N, even when the other detector scan appears typical.
Most of the time, the HERFD and EDS detectors each produced consistent data quality, although HERFD data had slightly better S:N. However, intermittently poor data quality with low S:N ratio was observed in one detector, even when the other detector recorded spectra with typical S:N. Examples of this intermittent poor behavior are shown in Figure 9C. Point 1 shows the expected behavior with all replicate scans exhibiting similar S:N to other spectra collected with the same detector. Point 2 shows poor EDS detector performance in scan 2, but good HERFD performance in all scans. HERFD data in scan three at points 3 and 4 have poor S:N. Finally, point 5 has poor EDS S:N in scans one and three and poor HERFD S:N in scan 3. This demonstrated the observed intermittent poor S:N scans from both detectors and was typical of the overall observed behavior.
There are several potential causes for poor HERFD behavior. Total Ge content generally increased from point 1 to point 5, which does not help explain the observed detector behavior. Physical causes, such as thermal heating causing swelling of the crystal, slightly altering its alignment, or imperfect He purge of the ∼2 m path length between the sample and detector, were deemed unlikely because the low S:N spectra were observed intermittently and in both detectors. A sudden, significant drop in I0 occurred during scan three at points 3 to 5, which would have disproportionately affected the HERFD data, since fewer photons reach the HERFD detector (Hämäläinen et al., 1991). The HERFD detector inherently rejects a large fraction of the Ge Kα photons that fail to satisfy the Bragg condition and has more optical components than the EDS detector, giving the EDS detector a Jacquinot advantage (Skoog et al., 1998). An illustration of this point is that for seven typical scans, the average number of photons detected per second were 33,000 and 3,700,000 by the HERFD and EDS detectors, respectively (the average I0 was 75,000,000 cps at 11,120 eV). Thus, counting statistics, resulting from low Ge content or lower incoming flux, would affect the HERFD data more because of the inherently lower count rate. Despite these few instances of low S:N scans, the HERFD detector yielded overall better spectral resolution and better S:N than the typical EDS setup and represents a powerful advantage in instances when interference from the matrix complicates measurement of a minor/trace element of interest. While the HERFD was not essential for this study, it did result in higher quality Ge XANES spectra and could potentially facilitate collection of Ga XRF maps and XANES spectra, as previously mentioned.
3.8 Copper XANES
Copper speciation was also examined by XANES, since co-substitution or vacancies are required to charge balance Ge4+ substitution into ZnS and a correlation between Cu and Ge was identified by microprobe in several of the deposits examined (Figure 6A). The oxidation state of Cu in sulfide minerals has been extensively studied, albeit mostly in sulfide minerals containing Cu as a major rather than a trace element. For example, two possible formal oxidation state configurations have been proposed for chalcopyrite, CuIIFeIIS2 (e.g., Todd et al., 2003; Mikhlin et al., 2005) and CuIFeIIIS2 (e.g., Goh et al., 2006; Pearce et al., 2006). Similarly, some studies have described both CuS and Cu2S as containing only Cu+ (e.g., Goh et al., 2006), whereas other studies have provided evidence for mixed oxidation states (e.g., Pattrick et al., 1998; Kumar et al., 2013). Cook et al. (2015) also noted that, based on charge balance, the formal oxidation state of Cu in germanite is mixed. Much of the debate on which Cu oxidation state(s) occur in sulfide minerals centers around which spectral features are diagnostic of specific oxidation states, which is beyond the scope of this manuscript. Thus, we will proceed by interpreting our data using the spectral features that are often considered diagnostic of each Cu oxidation state. Specifically, the pre-edge peak at 8,979 eV is taken to be indicative of divalent Cu, whereas a peak or shoulder at ∼8,982 eV (which creates a local minimum in the first derivative spectra) is diagnostic of monovalent Cu (Kau et al., 1987).
Micro-focused Cu XANES spectra from Tar Creek, Central and East Tennessee and Metaline districts were sorted into five groups, based on visual inspection, indicating the presence of several unique Cu bonding environments (Figure 10A, gray spectra). Groups I through IV spectra exhibited a shoulder (or local minimum in the first derivative spectra) at 8,982 eV and no pre-edge feature at 8,979 eV, indicating the presence of exclusively monovalent Cu, consistent with prior studies (Cook et al., 2012; Belissont et al., 2016). The largest groups (groups I and II) are very similar to one another and previously reported Cu XANES spectra (Cook et al., 2012; Belissont et al., 2016). Group I was characterized by a slightly narrower white line at 8,985 eV and a more defined post-edge feature at 8,990 eV with a slightly lower energy than the similar features in group II. Indeed, group I was nearly identical to the bulk spectra for Central Tennessee and Tar Creek ZnS, which is not surprising since 41 of the 43 μ-XANES spectra comprising group I were collected from Central Tennessee ZnS samples and the rest were from Tar Creek (Figure 10B). Similarly, group II (n= 13) comprised the majority of μ-XANES spectra collected from Josephine and Yellowhead (Figure 10B) and appeared quite similar to the bulk Josephine spectra. This indicates that for these samples, the micro-focused spectra are representative of the average Cu bonding environment present in the bulk samples.
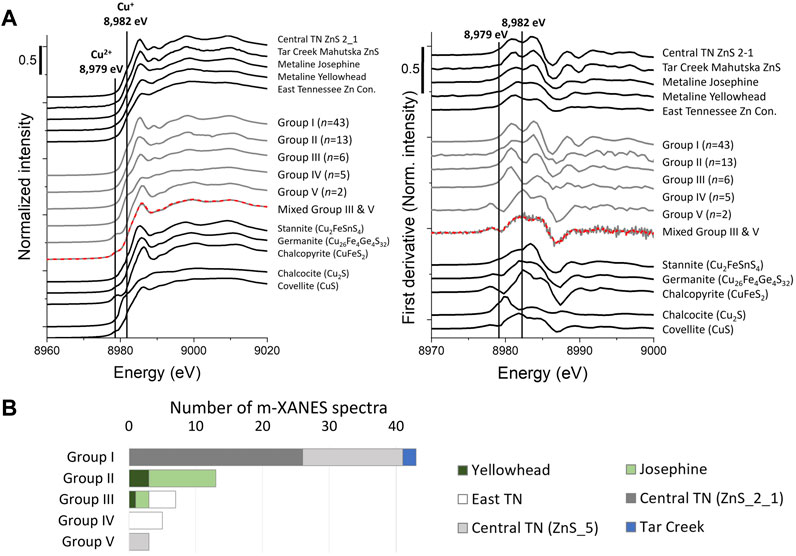
FIGURE 10. Copper XANES (A) Normalized reference spectra and first derivative of normalized spectra of bulk samples (top black spectra), grouped μ-XANES (middle gray spectra), and reference minerals (bottom black spectra). Note the bottom micro-focused spectra with linear combination fit (red dashed line), which was found to contain a mixture of 72% group V and 28% group III, indicating the Cu bonding environment occasionally varied within the 2–3 μm of the incident X-ray beam. (B) Bar chart showing how μ-XANES spectra from each sample were grouped. These μ-XANES spectra were averaged to create μ-XANES groups shown in Figure 10A.
In contrast, the remaining groups were representative of micro-environments and dissimilar to bulk spectra. Group III (n=6) comprised the remainder of Josephine and Yellowhead μ-XANES and was characterized by a much more evident rising edge feature at 8,982 eV and a smaller white line shifted higher in energy. Interestingly, neither group II nor III spectral characteristics were similar to those of bulk Yellowhead, which had a significantly lower white line and no feature at 8,989.5 eV (Figure 10). Similarly, neither groups III nor IV (n=5), the μ-XANES spectra collected from East Tennessee, had features like the corresponding bulk spectra. Thus, groups III and IV represent micro-environments, which were not significant enough to be reflected in the bulk XANES, based both on visual inspection and LCFs. Indeed, the bulk spectra for East Tennessee and Yellowhead most closely resemble the CuS reference, except for the notable absence of a peak at 8,979 eV in the sample spectra, which is attributed to the presence of divalent Cu in the CuS reference spectra (Figure 10). At low Cu content and in the absence of co-substituents, CuS micro-inclusions have been shown to form in synthetic ZnS (Pattrick et al., 1998). An alternative explanation for the mismatch between bulk and micro-focused spectra is the presence of another Cu-bearing phase that was not detected by XRD. To try to resolve this issue, SEM was used to map large areas of both Yellowhead and East Tennessee to look for Cu-containing phases that might be able to account for the difference between the micro-focused and bulk spectra. In both samples, a few grains of chalcopyrite were identified, which do not fully explain why the bulk spectra appear most similar to the CuS reference spectra rather than the chalcopyrite reference spectra. Nonetheless, this evidence indicates that the μ-XANES were not reflective of the bulk Cu environment in several instances.
Perhaps the most unexpected of the Cu μ-XANES was group V (n=2) because of a peak at 8,979 eV, which is taken to indicate of the presence of divalent Cu (Figure 10). All group V spectra were collected from the same region on the Central Tennessee sphalerite ZnS_5 sample, including a mixed spectra (estimated by LCF to contain 72% group V and 28% group III). The presence of this mixed spectra indicates that the bonding environments can vary within the 2–3 μm of the incident X-ray beam (Figure 10). This region appeared dark colored in transmitted light, had an appearance consistent with sphalerite by optical microscopy and SEM-BSE, but was not conclusively identified by spot XRD. Further, this region was characterized by unusually low Ge, Ga, and Cu content and high Fe and Cd content. The coupled chemical and spectroscopic data may suggest direct substitution of Cu2+ into the sphalerite lattice for Zn (Cu2+ ⇔ Zn2+). Direct substitution of Cu for Zn has rarely been reported, and only at Cu content less than 0.2 atomic percent (Pattrick et al., 1998). Since the peak at 8,979 eV was not evident in the bulk spectra, this region must also represent a minor mechanism of Cu incorporation in the sample.
In summary, the Cu XANES data effectively highlight the necessity of complementing micro-focused measurements with bulk analyses to assess if the μ-XANES are representative of the bulk sample (Figure 10). Prior studies have relied entirely on micro-focused measurements, which leaves some question as to if the results are reflective of the bulk materials (Cook et al., 2012; Belissont et al., 2016). Further, these spectra also highlight the value of μ-XANES in identifying trace element micro-environments that may be critical to the interpretation of other data, such as trace element content and CL imaging. Empirically, the μ-XANES detected in this study are much more varied than those previously reported (Cook et al., 2012; Belissont et al., 2016). Explaining the origin of these differences is beyond the current scope, since it is dependent to the incorporation of multiple trace elements, many of which have multiple oxidation states. However, the variety of Cu XANES measured may be related to the fact that samples included in this study were from four deposits, more than have been examined by any single prior study. Alternatively, the variations detected may have also been influenced by the extensive pre-characterization of samples targeted at identifying typical and unique regions for further investigation.
4 Discussion
4.1 Integrated vignettes
The value of this workflow is the insight provided by the complementary integration of the techniques. Combined, this suite of non-destructive techniques provides a comprehensive perspective on Ge substitution in ZnS, as illustrated in the two examples below.
4.1.1 Central Tennessee
ZnS samples from Central Tennessee occur as large crystals with variable color from colorless to bright golden yellow (Figure 2A). These sphalerites are also characterized by large domains of anisotropy, indicating the presence of the non-cubic ZnS polymorph (Figure 2A, Figure 3B, Figure 7A), which was effectively visualized with cross-polarized transmitted light and mapped using synchrotron-based XRD (Figure 7C). The structural state of the ZnS has important implications for trace element incorporation and, potentially, Ge speciation. Figure 3 shows a bright yellow, isotopic ZnS that is vertically bisected by a nearly transparent stripe of anisotropic ZnS. In this region, the lowest Ge and Cu, and highest Ga occur in the anisotropic region (Figure 3C). The anisotropic domain also contains the largest fraction of Ge2+, suggesting direct substitution (Ge2+ ⇔ Zn2+). Additional examples of ZnS regions dominated by either Ge2+ or Ge4+ in Central Tennessee ZnS will be included in a manuscript in preparation (Nadine Piatak, U.S. Geological Survey, 2023). Nonetheless, the combination of optical microscopy, SEM, microprobe, and synchrotron-based XANES, XRF maps, and XRD enabled detailed determination of Ge speciation and suggested multiple substitutional mechanisms.
4.1.2 Tar Creek
Tar Creek sphalerite has very low Fe content and low total substituting metals—among the lowest of the ZnS samples examined in this study. As a result, grains from Tar Creek typically lacked significant zonation in transmitted light, appearing a transparent light yellow, and typically appeared homogeneous in BSE images (even in very high contrast images). Despite this seeming lack of zonation, microprobe data demonstrated significant variation in trace element content (including Ge) within and among grains (Figure 4A). This variation was surprising, and prompted further investigation using CL imaging and, ultimately, the integration of this method in our standard workflow (Figure 1).
In this case, CL imaging was first attempted on grains that showed significant variation in microprobe values (Figure 4A). These images showed a clear correlation between CL response and the trace element variability, which substantiated microprobe measurements. Accurate and precise measurement of Ge was both essential to the study and complicated by the proximity of Zn Kβ and the Zn absorption edge, which necessitated an atypical background subtraction procedure. Following the realization that CL correlated with Cu and Ge content in the Tar Creek samples, we integrated CL imaging into the workflow. We searched for grains with the widest variation in CL response and used CL images to plan microprobe analysis on a diverse set of grains. This approach enabled the identification and interrogation of sphalerite compositions over a wide compositional space and resulted in better constraints on substitutional mechanism(s).
Synchrotron-based analyses were used to visualize the spatial distribution of Ge between sulfide (Ge4+-S) and oxide (Ge4+−O) environments (Figure 4B). Extensive characterization using μ-XANES identified four unique Ge bonding environments in the samples (Figure 4C). Germanium was found in ZnS mostly as Ge4+-S, but μ-XANES also identified a minor population of Ge2+-S (∼10%), which would likely not have been identified in bulk spectra without the definitive μ-XANES. Further, while tetravalent Ge was expected in hemimorphite (Ge content median= 270 mg kg−1 and range= <170–2300 mg kg−1), the ability to measure the Ge μ-XANES in quartz was unexpected and provided a direct method for estimating the Ge content in quartz at low concentrations that are inaccessible by electron microprobe (Figure 8; White et al., 2022a).
4.2 Benefits of complementary techniques and best practices
Multiple techniques were required to fully probe the substitution of Ge and Cu in ZnS. Each technique contributed unique information to the overall understanding (Table 1). For example, whereas elemental correlations can imply substitutional mechanisms, confirmation of elemental oxidation states using XANES is required. Our approach was to begin with the fastest and least costly methods, in this case optical microscopy, and progressively identify areas of interest for future examination using more time-restricted approaches (Figure 1; Table 1). Color variation and optical zoning reflected variations in ZnS polymorph and trace element composition. Other readily available, in-house methods (SEM-EDS, CL, and microprobe) were used to investigate areas of interest identified by optical microscopy. In low Fe samples (<0.3 wt%), CL images efficiently documented trace element zonation, especially when other zonation indicators were absent. Extensive pre-characterization was critical for prioritizing regions of interest for microprobe and synchrotron-based analyses.
4.2.1 Iterative application of complementary techniques
Although the analysis progression, outlined in Figure 1, typically proceeded from left to right, iterative use of these techniques proved crucial for developing a comprehensive understanding of Ge (and Cu) in ZnS. This iterative approach was only possible since all techniques were essentially non-destructive, so returning to the same analytical location was possible. Further, it is critical to consider that each approach has a different excitation volume and penetration depth (Table 1). For instance, reexamination of anomalous microprobe results using optical microscopy and SEM to look for inclusions either resulted in rejection of data due to multi-phase contamination or revealed heterogeneity in the sample. Thus, it is important to consider the limitations of each technique when interpreting data and deciding when to return to other techniques to investigate unexpected results.
4.2.2 Get the most out of XANES spectra
Absolute edge steps are often ignored but contain important information. In this case, examining the absolute edge step was an important clue in categorizing the Ge in quartz and hemimorphite spectra, especially when the S:N was poor and the shape of the white line was less distinctive. Further, the absolute edge step was valuable in estimating the absolute Ge content in quartz (Figure 8). The calibration curve for Ge in sphalerite may be useful in a variety of studies, when there is a need to estimate the Ge content in sphalerite at contents below the microprobe detection limit. Developing calibration curves when matrix matched standards are available or relying on alternative quantification approaches can be very useful for quantification and determination of the XANES detection limit.
Utilizing the HERFD detector was valuable because of the improved spectral S:N, providing more featured XANES (especially for high Z elements; Hämäläinen et al., 1991), and significantly easier background subtraction. Further developments in HERFD technology may result in the HERFD becoming an even more powerful tool, but it is already valuable in instances, like this study, when interference from the matrix complicates detection of the target element.
4.2.3 Multiple approaches facilitate capturing sample complexity
Throughout the analytical progression outlined in Figure 1, one of the goals with each technique is to identify regions that are typical and atypical for further examination, with the overall goal of identifying relationships among properties that can lend insight into the factors controlling the incorporation of Ge and the substitutional mechanism. For example, optical microscopy identified color variations, which reflect trace element content, as well as regions of anisotropy. Typical and atypical regions were then further examined using SEM-BSE and CL imaging for further evidence of zoning and trace element content variability. Without CL imaging to visualize chemical zonation patterns, the heterogeneity in the samples may not have been captured or could have been captured without the recognition of a pattern. For instance, if multiple microprobe measurements were performed randomly on the grain with the transect in Figure 5A without the CL image, the heterogeneity would likely not have been correlated with oscillatory zoning. These efforts facilitated efficient quantification of trace element content using microprobe and qualitatively mapped using μ-XRF mapping. Combined microprobe and CL data enabled the identification of typical and outlier compositions, which enabled us to investigate the full range of chemical heterogeneity of the samples. The inherent heterogeneity would likely not have been characterized as completely or systematically without the application of multiple complementary techniques. One example is the region shown in Figure 3, where the trace element chemistry and isotropy correlate over a small spatial range. This region was selected for synchrotron-based analysis based on the hypothesis that the observed variations in trace element content and isotropy may be concomitant with variations in Ge oxidation state. While the μ-XANES revealed a dramatic Ge oxidation state gradient, that specific region of interest was only identified because of the suite of complementary techniques employed in pre-characterization.
Selected locations were then probed using μ-XANES to identify the oxidation state and bonding environment of Ge and Cu. When selecting μ-XANES spots, it is important to include points from a variety of target element content and variable chemical environments, as identified in the μ-XRF maps and other methods (e.g., microprobe, CL). For example, due to the low Ge content we did not expect to observe an edge step on quartz in Tar Creek, but still selected a μ-XANES point on quartz. The Ge μ-XANES on quartz in the Tar Creek and, later, Yellowhead samples proved to be very useful in estimating amount of Ge in quartz in these samples (Figure 8). At Tar Creek, the Ge content in quartz was used to constrain an overall mass balance of Ge distribution among sphalerite, hemimorphite, and quartz (Figure 4; White et al., 2022a), whereas at Pend Oreille, the estimated Ge content of quartz was used to contextualize the bulk spectra in concert with bulk XRD data (Figure 6).
4.2.4 Data validation efforts are valuable for identifying problems and building confidence
There have been multiple instances in this project when reexamining anomalous results, as well as calibrating and conducting blank measurements enabled more confident interpretation of the data. For example, complementing microprobe analyses with CL imaging established CL as an effective and efficient tool for visualizing variations in trace element content. Another example of a valuable validation was collecting replicate and blank (i.e., thin section glass and epoxy) XANES scans. Whereas the Cu blank spectrum contained a measurable edge step, it was negligible when compared with the edge step of any samples measured (Supplementary Figure S3 and Supplementary Table S2). In instances where the incident X-ray beam caused discoloration of the sample (Figure 2B), replicate XANES scans appeared uniform, which indicated that the discoloration had not induced substantial changes in the Ge speciation and enabled confident inclusion of those data.
In other cases, further investigation of unusual data identified data that should be excluded. For example, reinvestigation of unusually high microprobe values using optical microscopy and SEM sometimes identified inclusions that had not been identified during prior examination, as shown in Figures 2C,D. Conversely, in instances when reinvestigation of unusual results did not uncover an alternative explanation, performing the due diligence added confidence in the conclusion that these results reflected the inherent variability of trace elements in ZnS.
5 Conclusion
The novel workflow described here utilized a suite of complementary, non-destructive techniques to reveal that Ge speciation, elemental correlations, and substitutional mechanisms vary among mineral districts and, sometimes, within samples over micrometer scales. Both Ge2+ and Ge4+ were identified in this study, supporting direct substitution of Ge for Zn (Ge2+ ⇔ Zn2+) and, combined with trace element data, co-substitution involving Cu+ (e.g., Ge4+ + 2Cu+ ⇔ 3Zn2+), as well as more complex substitutional mechanisms. Trace element incorporation and Ge and Cu speciation were shown to vary on the micrometer scale in some samples. The application of CL imaging was especially useful in visualizing this trace element zonation, which facilitated efficient examination of a wide variety of compositional space and ultimately led to an improved understanding of the complexity within the samples. Whereas the more readily available, less intensive analytical approaches were typically applied first, iterative use of the routine and more advanced techniques often revealed new insights into sample complexities. Due diligence efforts to reevaluate anomalous results, and collect analytical blanks and replicates were critical in both identifying data that should be excluded or in adding confidence that atypical results were reflective of actual variability in the samples. The workflow described here may be valuable in characterizing similarly challenging systems, such as presented by byproduct critical elements hosted in minerals at low abundance.
Data availability statement
The datasets generated for this study can be found in the Science Base repository, at: https://doi.org/10.5066/P9HHH5FL and https://doi.org/10.5066/P92ZX0T7.
Author contributions
Conceptualization and funding acquisition: RS, NP, SW. Methodology, data collection, and data analysis: NP, SW, RM, and SH. Manuscript preparation: SH, RM, NP, SW, and RS. All authors read and approved the final manuscript.
Funding
Funding for this work was provided by the United States Geological Survey Minerals Research Program, NSF Grant GEO-1215894, and NIEHS Grants P01 ES012874 and ES00002.
Acknowledgments
We acknowledge the support of D. Hoppe, C. Green, and J. Hammarstrom for their scientific and technical support. We thank K. Kelley (U.S. Geological Survey [USGS]) and D. Leach (Colorado School of Mines and USGS) for providing samples from the Red Dog deposit and the Metaline mining district, respectively. We thank the staff at Nyrstar Middle Tennessee Mines and Clarksville Smelter, and Teck Pend Oreille Mine and Trail Smelter for the site tours and helpful discussions. We also thank L. Schaider, J. Shine, R. Jim, E. Keheley, C. Kreman, S. King, T. Kent, T. Stand, R. Casanova, Flint Rock, a private landowner, D. Brabander, S. Thomas, S. Myneni, J. Higgins, for their contributions to the Tar Creek project and B. Valentine, H. Jaimeson, A. Dobosz, and D. Lougheed for their overall contributions to the project. The Harvard Museum of Natural History provided mineral samples. We also thank the staff at APS and SSRL for synchrotron support, especially A. Lanzirotti, M.Newville, S. Sutton, Q. Ma, D. Keane, R. Davis, and C. Tassone. Use of the Advanced Photon Source, an Office of Science User Facility operated for the U.S. Department of Energy (DOE) Office of Science by Argonne National Laboratory, was supported by the U.S. DOE under Contract No. DE-AC02-06CH11357. Use of the Stanford Synchrotron Radiation Lightsource, Stanford Linear Accelerator Center (SLAC) National Accelerator Laboratory, is supported by the U.S. Department of Energy, Office of Science, Office of Basic Energy Sciences under Contract No. DE-AC02-76SF00515. Any use of trade, firm, or product names is for descriptive purposes only and does not imply endorsement by the U.S. Government.
Conflict of interest
The authors declare that the research was conducted in the absence of any commercial or financial relationships that could be construed as a potential conflict of interest.
Publisher’s note
All claims expressed in this article are solely those of the authors and do not necessarily represent those of their affiliated organizations, or those of the publisher, the editors and the reviewers. Any product that may be evaluated in this article, or claim that may be made by its manufacturer, is not guaranteed or endorsed by the publisher.
Supplementary material
The Supplementary Material for this article can be found online at: https://www.frontiersin.org/articles/10.3389/feart.2023.939700/full#supplementary-material
References
Actlabs (2021). Geochemistry schedule of services and fees. [Online]. Ontario, Canada. Available: https://actlabs.com/wp-content/uploads/2021/07/Actlabs-Schedule-of-Services-USD-2021.pdf (Accessed 4 15, 2022).
Barton, P. B., and Bethke, P. M. (1987). Chalcopyrite disease in sphalerite: Pathology and epidemiology. Am. Min. 72, 451–467.
Belissont, R., Muñoz, M., Boiron, M. C., Luais, B., and Mathon, O. (2016). Distribution and oxidation state of Ge, Cu and Fe in sphalerite by μ-XRF and K-edge μ-XANES: Insights into Ge incorporation, partitioning and isotopic fractionation. Geochim. Cosmochim. Acta 177, 298–314. doi:10.1016/j.gca.2016.01.001
Bissardon, C., Proux, O., Bureau, S., Suess, E., Winkel, L. H. E., Conlan, R. S., et al. (2019). Sub-ppm level high energy resolution fluorescence detected X-ray absorption spectroscopy of selenium in articular cartilage. Analyst 144 (11), 3488–3493. doi:10.1039/c9an00207c
Bonnet, J., Cauzid, J., Andre-Mayer, A. S., Peiffert, C., Caumon, M. C., Rouer, O., et al. (2016). Trace element distribution (Cu, Ga, Ge, Cd, and Fe) in sphalerite from the Tennessee MVT deposits, USA, by combined EMPA, LA-ICP-MS, Raman spectroscopy, and crystallography. Can. Mineral. 54 (5), 1261–1284. doi:10.3749/canmin.1500104
Bonnet, J., Cauzid, J., Testemale, D., Kieffer, I., Proux, O., Lecomte, A., et al. (2017). Characterization of germanium speciation in sphalerite (ZnS) from central and eastern Tennessee, USA, by X-ray absorption spectroscopy. Minerals 7 (5), 79. doi:10.3390/min7050079
Çiftçi, E. (2009). Mercurian sphalerite from akoluk deposit (ordu, NE Turkey): Hg as a cathodoluminescence activator. Mineral. Mag. 73 (2), 257–267. doi:10.1180/minmag.2009.073.2.257
Cook, N. J., Ciobanu, C. L., Brugger, J., Etschmann, B., Howard, D. L., de Jonge, M. D., et al. (2012). Determination of the oxidation state of Cu in substituted Cu-In-Fe-bearing sphalerite via -XANES spectroscopy. Am. Mineral. 97 (2-3), 476–479. doi:10.2138/am.2012.4042
Cook, J. N., Etschmann, B., Ciobanu, L. C., Geraki, K., Howard, L. D., Williams, T., et al. (2015). Distribution and substitution mechanism of Ge in a Ge-(Fe)-bearing sphalerite. Minerals 5 (2), 117–132. doi:10.3390/min5020117
Deer, W., Howie, R., and Zussman, J. (1992). An introduction to the rock-forming minerals. Hong Kong: Longman Group Limited.
Evans, M. J., and Derry, L. A. (2002). Quartz control of high germanium/silicon ratios in geothermal waters. Geology 30, 1019–1022. doi:10.1130/0091-7613(2002)030<1019:qcohgs>2.0.co;2
Fenter, P. A., Rivers, M., Sturchio, N. C., and Sutton, S. (2002). Applications of synchrotron radiation in low-temperature Geochemistry and environmental science. Washington, DC: Mineralogical Society of America.
Fiz Karlsruhe (2013). Inorganic crystal structure Database (ICSD) version 3.3. [Online]. Available: https://www.fiz-karlsruhe.de/en/produkte-und-dienstleistungen/inorganic-crystal-structure-database-icsd (Accessed 8 20, 2016).
Foster, A. L., Brown, G. E., Tingle, T. N., and Parks, G. A. (1998). Quantitative arsenic speciation in mine tailings using X-ray absorption spectroscopy. Am. Mineral. 83 (5-6), 553–568. doi:10.2138/am-1998-5-616
Goh, S. W., Buckley, A. N., Lamb, R. N., Rosenberg, R. A., and Moran, D. (2006). The oxidation states of copper and iron in mineral sulfides, and the oxides formed on initial exposure of chalcopyrite and bornite to air. Geochim. Cosmochim. Acta 70 (9), 2210–2228. doi:10.1016/j.gca.2006.02.007
Hämäläinen, K., Siddons, D. P., Hastings, J. B., and Berman, L. E. (1991). Elimination of the inner-shell lifetime broadening in X-ray-absorption spectroscopy. Phys. Rev. Lett. 67 (20), 2850–2853. doi:10.1103/physrevlett.67.2850
Hayes, S. M., and McCullough, E. (2018). Critical minerals: A review of elemental trends in comprehensive criticality studies. Resour. Policy 59, 192–199. doi:10.1016/j.resourpol.2018.06.015
Holton, J. M. (2009). A beginner's guide to radiation damage. J. Synchrotron. Radiat. 16 (2), 133–142. doi:10.1107/s0909049509004361
Jochum, K. P., Weis, U., Stoll, B., Kuzmin, D., Yang, Q., Raczek, I., et al. (2011). Determination of reference values for NIST SRM 610–617 glasses following ISO guidelines. Geostand. Geoanal. Res. 35 (4), 397–429. doi:10.1111/j.1751-908x.2011.00120.x
Kau, L.-S., Spira-Solomon, D., Penner-Hahn, J., Hodgson, K. O., and Solomon, E. I. (1987). X-ray absorption edge determination of the oxidation state and coordination number of copper: Application to the type 3 site in Rhus vernicifera Laccase and its reaction with oxygen. J. Am. Chem. Soc. 109, 6433–6442. doi:10.1021/ja00255a032
Kelley, K. D., Leach, D. L., Johnson, C. A., Clark, J. L., Fayek, M., Slack, J. F., et al. (2004). Textural, compositional, and sulfur isotope variations of sulfide minerals in the red Dog Zn-Pb-Ag deposits, brooks range, Alaska: Implications for ore formation. Econ. Geol. 19, 1509–1532. doi:10.2113/gsecongeo.99.7.1509
Kuhlemann, J., and Zeeh, S. (1995). Sphalerite stratigraphy and trace element composition of East Alpine Pb-Zn deposits (Drau Range, Austria-Slovenia). Econ. Geol. 90 (7), 2073–2080. doi:10.2113/gsecongeo.90.7.2073
Kumar, P., Nagarajan, R., and Sarangi, R. (2013). Quantitative X-ray absorption and emission spectroscopies: electronic structure elucidation of Cu2S and CuS. J. Mater. Chem. C 1 (13), 2448–2454. doi:10.1039/c3tc00639e
Licht, C., Peiro, L. T., and Villalba, G. (2015). Global substance flow analysis of gallium, germanium, and indium: quantification of extraction, uses, and dissipative losses within their anthropogenic cycles. J. Ind. Ecol. 19 (5), 890–903. doi:10.1111/jiec.12287
Marfunin, A. (1979). Spectroscopy, luminescence and radiation centers in minerals. Berlin, Germany: Springer-Verlag.
McClung, C. R. (2001). Wall rock alteration of the metaline formation around the Pend Oreille Zn-Pb deposit, Metaline District, NE Washington, USA. MS Thesis in Geology. Golden (CO): Colorado School of Mines.
McKnight, E. T., and Fischer, R. P. (1970). Geology and ore deposits of the Picher field, Oklahoma and Kansas. Washington, DC: U.S. Geolgogical Survey. Professional Paper 588.
Mikhlin, Y., Tomashevich, Y., Tauson, V., Vyalikh, D., Molodtsov, S., and Szargan, R. (2005). A comparative X-ray absorption near-edge structure study of bornite, Cu5FeS4, and chalcopyrite, CuFeS2. J. Electron Spectrosc. Relat. Phenom 142 (1), 83–88. doi:10.1016/j.elspec.2004.09.003
National Research Council (2008). Minerals, critical minerals, and the U.S. economy. Washington, DC: The National Academies Press.
Nehzati, S., Dolgova, N. V., James, A. K., Cotelesage, J. J. H., Sokaras, D., Kroll, T., et al. (2021). High energy resolution fluorescence detected X-ray absorption spectroscopy: an analytical method for selenium speciation. Anal. Chem. 93 (26), 9235–9243. doi:10.1021/acs.analchem.1c01503
Newville, M. (2001). IFEFFIT: interactive XAFS analysis and FEFF fitting. J. Synchrotron Radiat. 8, 322–324. doi:10.1107/s0909049500016964
Newville, M. (2013). Larch: an analysis package for XAFS and related spectroscopies. J. Phys. Conf. Ser. 430, 012007. doi:10.1088/1742-6596/430/1/012007
Nyrstar (2022). Nyrstar Clarksville. [Online]. Netherlands: Nyrstar. Available: https://www.nyrstar.com/operations/processing/nyrstar-clarksville (Accessed 2 1, 2022).
O'Day, P. A., Rivera, N., Root, R., and Carroll, S. A. (2004). X-ray absorption spectroscopic study of Fe reference compounds for the analysis of natural sediments. Am. Mineral. 89 (4), 572–585. doi:10.2138/am-2004-0412
Panfili, F. R., Manceau, A., Sarret, G., Spadini, L., Kirpichtchikova, T., Bert, V., et al. (2005). The effect of phytostabilization on Zn speciation in a dredged contaminated sediment using scanning electron microscopy, X-ray fluorescence, EXAFS spectroscopy, and principal components analysis. Geochim. Cosmochim. Acta 69 (9), 2265–2284. doi:10.1016/j.gca.2004.10.017
Pannalal, S. J., Symons, D. T. A., and Leach, D. L. (2007). Paleomagnetic and mineral magnetic constraints on Zn–Pb ore Genesis in the Pend Oreille Mine, Metaline district, Washington, USA. Can. J. Earth Sci. 44 (12), 1661–1673. doi:10.1139/e07-056
Pattrick, R. A. D., Mosselmans, J. F. W., and Charnock, J. M. (1998). An X-ray absorption study of doped sphalerites. Eur. J. Mineral. 10 (2), 239–250. doi:10.1127/ejm/10/2/0239
Pearce, C. I., Pattrick, R. A. D., Vaughan, D. J., Henderson, C. M. B., and van der Laan, G. (2006). Copper oxidation state in chalcopyrite: Mixed Cu d9 and d10 characteristics. Geochim. Cosmochim. Acta 70 (18), 4635–4642. doi:10.1016/j.gca.2006.05.017
Perkins, D. (2021). Introduction to mineralogy. [Online]. Available: https://opengeology.org (Accessed 4 27, 2022).
Piatak, N. M., Hayes, S. M., White, S. J. O., McAleer, R. J., Hoppe, D. A., Seal, R. R., et al. (2023). Electron microprobe analyses of sphalerite from Central and East Tennessee mining districts, the Red Dog mining district (AK), and the Metaline mining district (WA). U.S. Geological Survey data release. doi:10.5066/P92ZX0T7
Pring, A., Wade, B., McFadden, A., Lenehan, C. E., and Cook, N. J. (2020). Coupled substitutions of minor and trace elements in co-existing sphalerite and wurtzite. Minerals 10 (2), 147. doi:10.3390/min10020147
Pugsley, A. J., Bull, C. L., Sella, A., Sankar, G., and McMillan, P. F. (2011). XAS/EXAFS studies of Ge nanoparticles produced by reaction between Mg2Ge and GeCl4. J. Solid State Chem. 184 (9), 2345–2352. doi:10.1016/j.jssc.2011.06.020
Ravel, B., and Newville, M. (2005). ATHENA, ARTEMIS, HEPHAESTUS: data analysis for X-ray absorption spectroscopy usingIFEFFIT. J. Synchrotron Radiat. 12, 537–541. doi:10.1107/s0909049505012719
Remond, G. (1977). Applications of cathodoluminescence in mineralogy. J. Lumin 15 (2), 121–155. doi:10.1016/0022-2313(77)90015-1
Sahlström, F., Blake, K., Corral, I., and Chang, Z. (2017). Hyperspectral cathodoluminescence study of indium-bearing sphalerite from the Mt Carlton high-sulphidation epithermal deposit, Queensland, Australia. Eur. J. Mineral. 29 (6), 985–993. doi:10.1127/ejm/2017/0029-2660
Schaider, L. A., Senn, D. B., Brabander, D. J., McCarthy, K. D., and Shine, J. P. (2007). Characterization of zinc, lead, and cadmium in mine waste: Implications for transport, exposure, and bioavailability. Environ. Sci. Technol. 41 (11), 4164–4171. doi:10.1021/es0626943
Seal, R. R., Cooper, B. J., and Craig, J. R. (1985). Anisotropic sphalerite of the Elmwood-Gordonsville deposits, Tennessee. Can. Mineral 23 (1), 83–88.
Skoog, D. A., Holler, F. J., and Nieman, T. A. (1998). Principles of instrumental analysis. Chicago: Saunders College Publishing.
Thomas, C. (2018). “Germanium,” in Metals and minerals: U.S. Geological Survey minerals yearbook 2018. U.S. Geological Survey. Available: https://www.usgs.gov/media/files/germanium-2018-pdf (Accessed 11 15, 2021).
Todd, E. C., Sherman, D. M., and Purton, J. A. (2003). Surface oxidation of chalcopyrite (CuFeS2) under ambient atmospheric and aqueous (pH 2-10) conditions: Cu, Fe L- and O K-edge X-ray spectroscopy. Geochim. Cosmochim. Acta 67 (12), 2137–2146. doi:10.1016/s0016-7037(02)01371-6
U.S. Geolgoical Survey (2021). Minneral commodity summary: Germanium. Washington, DC: U.S. Geological Survey.
U.S. Geolgoical Survey (2022). 2022 final list of critical minerals. Fed. Regist. 87 (37), 10381–10382.
Webb, S. M. (2005). SIXPack a graphical user interface for XAS analysis using IFEFFIT. Phys. Scr. T115, 1011–1014. doi:10.1238/physica.topical.115a01011
Wertich, V., Leichmann, J., Dosbaba, M., and Götze, J. (2018). Multi-stage evolution of gold-bearing hydrothermal quartz veins at the Mokrsko Gold Deposit (Czech Republic) based on cathodoluminescence, spectroscopic, and trace elements analyses. Minerals 8 (8), 335. doi:10.3390/min8080335
White, S. J. O, Piatak, N., McAleer, R., Hayes, S., Seal, R. R., Schaider, L. A., et al. (2022a). Germanium redistribution during weathering of Zn mine wastes: Implications for environmental mobility and recovery of a critical mineral. Appl. Geochem. 143, 105341. doi:10.1016/j.apgeochem.2022.105341
White, S. J. O., Piatak, N. M., McAleer, R. J., Hayes, S. M., Seal, R. R., Schaider, L. A., et al. (2022b). Geochemical, mineralogical, and molecular scale speciation characterization of mine wastes from the Tar Creek Superfund Site, Tri-State Mining District, Oklahoma, U.S.A. U.S. Geological Survey Data Release. Available: https://www.sciencebase.gov/catalog/item/626017f6d34e85fa62b88dd8 (Accessed 8 20, 2022).
Keywords: cathodoluminescence, X-ray absorption spectroscopy, X-ray fluorescence mapping, critical elements, sphalerite, copper, high energy resolution fluorescence detector (HERFD)
Citation: Hayes SM, McAleer RJ, Piatak NM, White SJO and Seal RR (2023) A novel non-destructive workflow for examining germanium and co-substituents in ZnS. Front. Earth Sci. 11:939700. doi: 10.3389/feart.2023.939700
Received: 09 May 2022; Accepted: 05 January 2023;
Published: 24 January 2023.
Edited by:
Harilaos Tsikos, University of Patra, GreeceCopyright © 2023 Hayes, McAleer, Piatak, White and Seal. This is an open-access article distributed under the terms of the Creative Commons Attribution License (CC BY). The use, distribution or reproduction in other forums is permitted, provided the original author(s) and the copyright owner(s) are credited and that the original publication in this journal is cited, in accordance with accepted academic practice. No use, distribution or reproduction is permitted which does not comply with these terms.
*Correspondence: Sarah M. Hayes, c2hheWVzQHVzZ3MuZ292