 Ankush
 P. Dewangan
 G. Sriram
- CSIR-National Institute of Oceanography, Panaji, Goa, India
Gas hydrates deposits in the Andaman forearc basin are inferred from seismic data and confirmed by drilling/coring during the NGHP-01 expedition. We present new evidence of gas flares in the Andaman forearc basin, detected through water column image (WCI), subbottom profiling, and high-resolution seismic data acquired onboard RV Sindhu Sadhana (SSD-085) in November-December 2021. The gas flares are located over an elongated sedimentary ridge, featuring two prominent mounds (M1 and M2) with distinct geological features. Compressional tectonics induced by the Diligent fault (DLF) formed the ridge with varying slopes and elevations. Gas flares observed above the mound M1 in WCI and sub-bottom profiler data. Seafloor samples reveal carbonate rocks with visible pores, indicating gas/fluid migration or burrows. The regional seismic profile delineates three sedimentary sequences: folded and faulted strata, mass transport deposits, and horizontal-to-sub-horizontal sedimentary layers. Additionally, we observed a bottom simulating reflector (BSR), indicating potential subsurface gas hydrate deposits. Detailed high-resolution seismic data revealed complex fault systems near bathymetry mounds (M1 and M2), which may serve as pathways for vertical fluid/gas migration.
1 Introduction
Submarine gas flares and cold seeps have attracted significant attention in academia and industries, primarily due to their association with distinctive chemosynthetic communities, bacterial mats, benthic fauna, mineral precipitation, and deep oil/gas reservoirs (Rensbergen et al., 2007). The gas flares and cold seeps are primarily driven by methane gas, which may be originate at varying water depths. In shallow marine sediments, particularly in the continental shelf region, methane gas is predominantly produced through biogenic decomposition of organic matter (Canfield, 1991), and this phenomenon is prominently observed in seismic data (Judd and Hovland, 1992; Karisiddaiah and Veerayya, 1994; Ergün et al., 2002; Andreassen et al., 2007; Mazumdar et al., 2009; Dondurur et al., 2011). Methane gas, once formed, undergoes upward migration driven by its buoyancy. This ascent is primarily facilitated by exploiting pathways along faults, fractures, and permeable sedimentary layers (Lazar et al., 2016). These natural conduits provide a means for the methane to migrate through geological formations, ultimately reaching shallower depths within the subsurface or even reach the seafloor, where it can be released into the water column in the form of methane bubbles. The migration processes play a pivotal role in the distribution and release of methane within the geological environment (Cook and Malinverno, 2013; Crutchley et al., 2016; Nole et al., 2016; Hillman et al., 2020; 2017; Gullapalli et al., 2019; Hoffmann et al., 2019). Methane released from the seafloor leads to the formation of diffusive or localized cold seeps under diverse geological environments (Judd, 2004; Duarte et al., 2007; Watson et al., 2019).
In deeper waters, mainly in the continental slope and rise regions, methane may be trapped as free gas or within the gas hydrate deposits, solid crystalline structures formed under high pressure and low temperatures (Sloan and Koh, 2007). However, methane (as free gas) may migrate through the gas hydrate stability zone (GHSZ) as short-range diffusion, focused fluid flow, or advection of methane gas (You and Flemings, 2018), leading to the development of chemosynthetic communities and the formation of shallow gas hydrate deposits (Meldahl et al., 2001; Petersen et al., 2010; Krabbenhoeft et al., 2013; Mazumdar et al., 2019; Crutchley et al., 2021; Dewangan et al., 2021). A minor fraction of abiogenic methane can also be generated in deep waters through the thermal decomposition of organic matter via chemical processes occurring in the Earth’s crust and upper mantle (Kvenvolden and Rogers, 2005).
The Andaman-Nicobar subduction zone is part of Southeast Asia’s active subduction system. Gas hydrate deposits in the forearc basin have been confirmed through both seismic studies (Satyavani et al., 2008; Prakash et al., 2010; Nandi and Samanta, 2011) and ground verification achieved through drilling/coring aboard the JOIDES Resolution during the NGHP-01 expedition (Kumar et al., 2014). However, the presence of gas flares or cold seeps in the Andaman-Nicobar subduction zone remains unreported. This study introduces the identification of gas flares within the Andaman forearc basin, aiming to explore the underlying geological conditions that have given rise to these gas flares. By doing so, this research offers significant insights, enhancing our understanding of how the structural features within the forearc basin influence the migration of gas and fluid through the sediment layers.
2 Geology of the Andaman-Nicobar subduction zone
The Andaman-Nicobar-Sumatra Subduction Zone (Figure 1A) exemplifies a classical accretionary-type subduction zone, exhibiting distinctive geological features including a trench, accretionary prism, forearc high, forearc basin, volcanic arc, and backarc basin (Roy and Das Sharma, 1993). The region is seismically very active driven by the ongoing oblique subduction of the Indo-Australian plate beneath the Southeast Asian plate. The complex plate tectonic history has led to the development of a network of fault systems, comprising of strike-slip or reverse West Andaman Fault (WAF), normal Eastern Marginal Fault (EMF), a backthrust Diligent Fault (DLF), and a strike-slip sliver fault system (Singh et al., 2013), as depicted in Figure 1A. The sliver fault system (Figure 1A; highlighted in red) includes the Sagaing fault in the North, the Andaman transform fault (ATF), the Andaman backarc spreading center (ABSC), the Andaman-Nicobar fault (ANF), and the Great Sumatra Fault (GSF) in the South (Curray, 2005). Notably, the ANF and WAF effectively separate the Andaman-Nicobar region into discernible backarc and forearc basins (Kamesh Raju et al., 2007; Cochran, 2010; Singh et al., 2013).
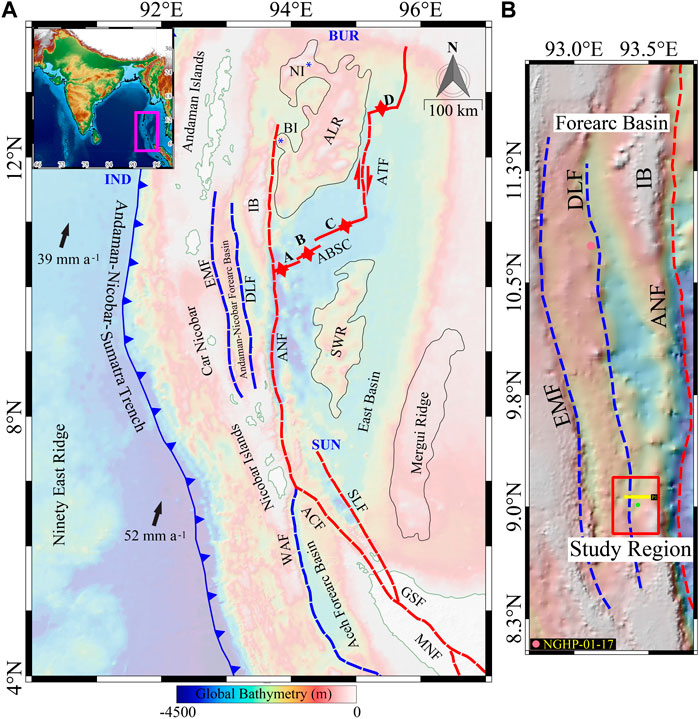
Figure 1. Overview of the Study Area and Tectonic Features in the Andaman-Nicobar Sumatra Subduction Zone with Global Bathymetry. (A) Regional tectonic map of Andaman-Nicobar which highlights the major tectonic features like, Eastern Margin Fault (EMF; Blue dashed); Diligent Fault (DLF; Blue dashed); West Andaman Fault (WAF; Blue dashed); Andaman-Nicobar Fault (ANF; Red dashed); Aceh Fault (ACF; Red dashed); Seulimeum Fault (SLF; Red dashed); Andaman backarc spreading center (ABSC; Red dashed) with segments A-D; Great Sumatra Fault (GSF); Mentawai Fault (MNF; Red line); Andaman Transform Fault (ATF; Red line); Invisible Bank (IB); Indian Plate (IND); Burmese Plate (BUR); Sunda Plate (SUN); Alcock Rise (ALR); Sewell Rise (SWR); Barren Island (BI); and Narcondam islands (NI). (B) The zoom-in of the Andaman Forearc basin within EMF and ANF. The red polygon highlights the specific study region in focus. The solid star refer to Site NGHP-01-17 drilled during NGHP-Expedition-01.
Our primary focus in the Andaman basin is on the forearc region encompassing accretionary prism sediments, a forearc high, and a forearc basin. This region spans roughly 50 km east-west and extends ∼900 km north-south, stretching from the southern extremities of the Irrawaddy Delta to the northern reaches of Sumatra (Pandey et al., 2017). The forearc basin (Figure 1B), situated to the north of Nicobar Island, contains 3–5 km thick sedimentary layers, primarily shaped by the interplay of tectonic forces and sediment deposition over roughly 60 million years (Dickinson and Seely, 1979; Moeremans and Singh, 2015). The forearc basin’s western boundary is defined by a pronounced V-shaped depression, formed by EMF (Figure 1B), a currently dormant fault that exhibits a normal faulting behavior (Singh and Moeremans, 2017). The forearc basin’s eastern boundary is demarcated by the Invisible Bank (IB; Figure 1B), speculated to be an inclined and elevated continental crust that developed during different phases of the plate tectonic evolution (Pal et al., 2003; Singh et al., 2013; Moeremans and Singh, 2015). Within the forearc basin, a northeast-trending structural high, resulting from the back thrust Diligent fault (DLF), is observed (Singh and Moeremans, 2017). Despite the oblique subduction process, compression prevails within the forearc basin, signifying substantial slip partitioning between the lateral strike-slip movement along the Andaman and Nicobar Fault and the megathrust fault in the Andaman-Nicobar segment of the subduction zone (Moeremans and Singh, 2015).
The Andaman-Nicobar forearc basin comprises five significant sedimentary groups (Rodolfo, 1969; Pal et al., 2003; Curray, 2005; Awasthi et al., 2020). The basement consists of pelagic sediments and volcanic-plutonic rocks from the Late Cretaceous Ophiolite Group, which is approximately 95 million years old (Pedersen et al., 2010). Overlying the basement is 1.4 km thick Eocene Mithakhari Group composed of coarser ophiolite fragments and pelagic trench sediments found in the accretionary prism (Allen et al., 2008; Moeremans and Singh, 2015). A 3-km thick Andaman Flysch Group (AFG) overlie the Mithakhari Group. AFG represents upper Eocene-Oligocene sediments characterized by three distinct lithofacies (Moeremans and Singh, 2015). The Archipelago Group (AG) comprises sediments ranging from the Miocene to Pliocene epochs, which are thought to have been deposited unconformably overlying the AFG in an open marine setting on the outer shelf (Chakraborty and Pal, 2001). The Mithakhari Group exhibits complex deformation and displays a wide range of bedding orientations, in contrast to the AFG and AG (Pal et al., 2003). Lastly, the Nicobar Group within the Andaman strata comprises Pleistocene limestone, beach deposits, unclassified volcanic rocks, and tuff, forming a distinct lithological unit (Curray, 2005; Awasthi and Ray, 2019).
3 Data and methodology
High-resolution seismics, subbottom profiles, multibeam bathymetry, and water column image (WCI) data were acquired in the forearc basin onboard RV Sindhu Sadhana (SSD-085) during Nov-December 2021 (Figure 2A). Multichannel high-resolution seismic data were collected using an air-gun (G-Gun; 60 cu. in.) source, and a 150 m long hydrophone streamer (48 channels with a group interval of 3.125 m). Data were collected with an 8-s shot interval, which is equivalent to a 16 m shot interval, enabling us to achieve a maximum CDP fold of six using this specific source-receiver geometry. The near offset and the sampling rate were 28 m and 2 ms, respectively. The seismic data exhibits a dominant frequency of 120 Hz. Data were processed using the SeisSpace software package. The processing sequence commenced with the assignment of marine geometry in the P1/90 format followed by several processing steps to improve the signal-to-noise ratio. Initially, a bandpass filter (70-80-270-300 Hz) was employed to effectively remove background noise. Swell corrections were applied to enhance the continuity of reflectors. To enhance the overall signal-to-noise ratio, the prestack data were subjected to an f-k filter. Furthermore, to mitigate unwanted effects such as bubble pulse and multiple reflections, we utilized predictive and spiking deconvolution techniques with a delay of 40 ms and an operator length of 2,000 ms. However, it’s important to note that due to constraints related to maximum offset (<175 m), we were unable to conduct velocity analysis. Therefore, we used a constant velocity of 1,600 m/s for stacking as well as for Kirchhoff time migration to accurately position the reflectors.
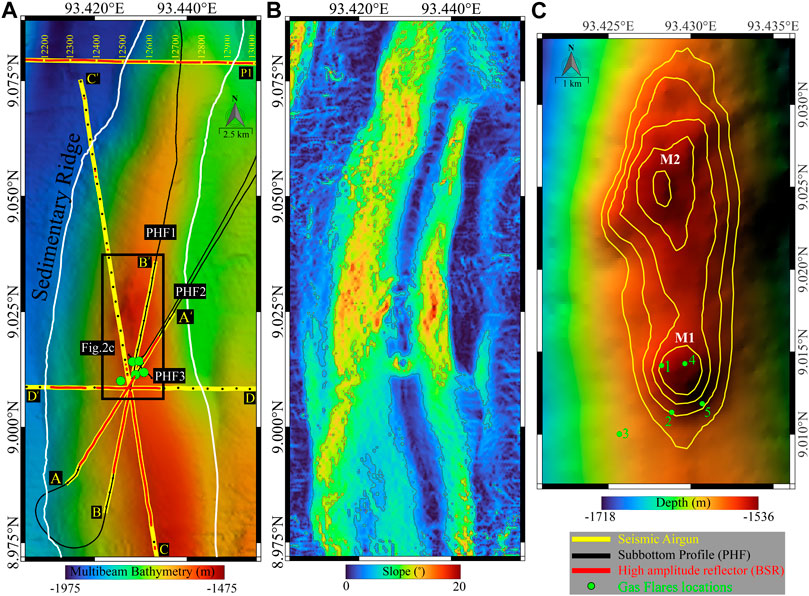
Figure 2. Illustrates the multibeam bathymetry and slope characteristics of the study area, focusing on Mounds M1 and M2. (A) The multibeam bathymetry map showcases the NE-SW-oriented Sedimentary Ridge (SR) with annotations of key features such as the regional seismic profile (P1; depicted by the yellow line), high-resolution seismic (HRS; highlighted by yellow lines with black dots), subbottom profiles (depicted by black lines), interpreted High Amplitude Reflector (BSR; shown in red), and five locations of gas flares (indicated by green circles). (B) The slope map emphasizes the topography of the sedimentary ridge (SR). (C) A zoomed-in view of Mounds M1 and M2 along with gas flare locations identified through water column image (Gas flares: 1 to 5).
The Hydrosweep DS-3 multibeam echosounder (MBES) system was utilized for the acquisition of seafloor bathymetry and water column image (WCI) data. The system operated at a central frequency of 15.5 kHz, covering the entire ocean depth range, and delivered depth measurements with an approximate uncertainty of 1% relative to the water depth. Both data acquisition and subsequent processing were performed using Teledyne PDS software v4.3, resulting in the creation of a digital terrain model with a grid resolution of 100 m. Additionally, a Seabird CTD profiler was employed to conduct CTD and sound velocity profiling in the study region. Depth corrections for the multi-beam data were performed using salinity, temperature, and SVP data. Water-column data was collected for each ping, enabling the detection of gas flares. In the initial stages of processing water column images (WCI), specific techniques like threshold filtering, speckle noise reduction, and manual editing were applied to enhance the quality and accuracy of gas flare identification (Veloso et al., 2015; Dewangan et al., 2021; Sriram et al., 2023).
To acquire data related to subsurface geology, we utilized the hull-mounted ATLAS Teledyne Parasound P35 sub-bottom profiler (SBP) system. This equipment operated in parametric mode, producing two distinct acoustic frequencies: 18 kHz and 23.5 kHz. Furthermore, through non-linear acoustic interferometry, two secondary harmonics were generated at 40 kHz and 4 kHz. Notably, the primary high-frequency (PHF) data provided crucial information about the presence of gas flares within the water column (Dewangan et al., 2021; Sriram et al., 2023). Seabed samples were collected over the gas flare’s region using a spade-corer system.
4 Results
4.1 Seabed morphology using bathymetry data
The study area (Figure 2A), is located in the southern part of the Andaman forearc basin ∼74 km from Car Nicobar Island. Multibeam bathymetry data in this region reveals a 17 km long and 0.6 km wide sedimentary ridge (SR) oriented in the north-south direction. This ridge rises from the surrounding seafloor depth of 1,800 m to about ∼1,500 m (Figure 2A). The ridge exhibits varying slope, ranging from 2° to 20° as it extends east-west from the axis towards the flanks (Figure 2B). In contrast, the axial region generally displays gentle slopes (<3°) in the north-south direction. Along the ridge axis, two prominent mounds (M1 and M2) were observed, which are separated by ∼1.5 km and encompass an area of about ∼1.5 km2 (Figure 2C). Mound M1 has a diameter of ∼487 m, with slopes ranging from 2° to 12° within its central area (Figure 2B).
4.2 Gas flares detected using WCI and sub-bottom profiler data above mound M1
Water column image (WCI) over mound M1 reveals intense backscattering, possibly attributed to gas flares over the mound (Figure 3). Detailed analysis of multiple transects in this area shows five distinct gas flares near mound M1, distributed within a 400 m radius (Figure 2C). Gas flares observed over the mound M1 (Figure 3D) have been re-confirmed using sub-bottom profiling (PHF) data (Figures 3A–C). These gas flares rise vertically to a depth of 700 m from a surrounding seafloor depth of 1,550 m. PHF data, acquired at various time intervals and orientations (PHF1 (SSW-NNE), PHF2 (SW-NE), and PHF3 (SE-NW) in Figure 2B), illustrate flare characteristics (Figures 3A–C). The upper limit of hydrate stability, derived for methane and seawater (Miles, 1995) and CTD temperature-depth information, is about 700 m, which matches with the flare termination (Figure 3A).
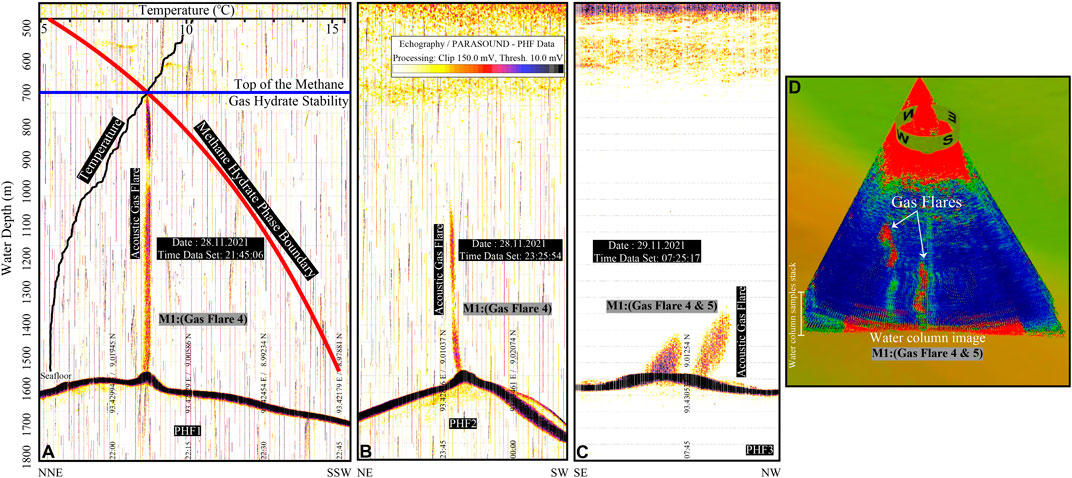
Figure 3. Subbottom profiling and multibeam water column image (WCI) conducted across Mound M1. (A) Subbottom profile (PHF1) oriented SSW-NNE, intersecting Mound M1, revealing gas flare 4 within the water column extending up to 700 m from the seafloor depth of 1,540 m. The overlay includes a methane hydrate + seawater phase curve generated using Miles (1995) equation and temperature-depth data from CTD at the gas flare location on Mound M1, indicating the upper limit of gas hydrate stability zone (GHSZ). (B) Subbottom profile (PHF2) oriented SW-NE across Mound M1, highlighting gas flare 4 within the water column. (C) Subbottom profile (PHF3) oriented NW-SE spanning Mound M1, distinctly displaying two gas flares (4 and 5) within the water column. (D) Stacked representation of water column image (WCI) sonar wedges from multibeam mapping, emphasizing the presence of two gas flares along Mound M1 (4 and 5).
4.3 Regional seismic stratigraphy over the sedimentary ridge
The regional seismic profile, oriented in the EW direction (Figure 4A), shows the sedimentary ridge as a folded anticlinal structure. The regional stratigraphy consists of three distinct seismic sequences (S1, S2, and S3; Figure 4B). Sequence S1, the oldest, exhibits semi-parallel continuous layers that have undergone folding and faulting due to the compression tectonics from the DLF (Figure 1A). Sequence S2 displays chaotic seismic facies typical of mass transport deposits (MTDs). This layer overlies sequence S1 and consists of younger sediments. The thickness of this layer is variable, and at certain locations (e.g., CDPs 12100–12200), the MTDs nearly reach the seafloor. A prominent V-shaped valley is observed between CDPs 12650 and 12800. Sequence S3, the youngest, comprises fault-free and gently folded parallel continuous layers. It onlaps onto sequence S2 with no major tectonic activity post-deposition. We observe a prominent high amplitude reflector (HAR) throughout the seismic section. The reflector mimics the seafloor, exhibits reverse polarity with respect to seafloor, and cross-cuts sequences S1 and S2. Horizons below this reflector from CDPs 11600 to 12050 show higher amplitude and lower frequency. Limited penetration is observed below this reflector from CDPs 12500 to 12900 (Figure 4B).
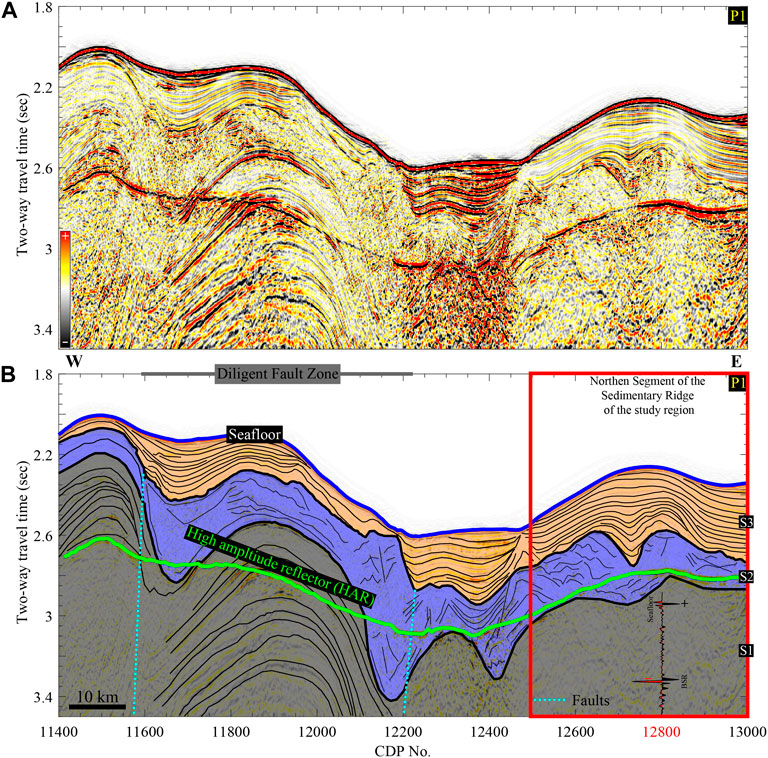
Figure 4. Regional seismic profile P1, oriented in the WE direction. (A) Uninterpreted profile. (B) The interpreted profile reveals three distinct seismic sequences: S1 (semi-parallel, folded, continuous layers), S2 (characterized by chaotic seismic facies), and S3 (consisting of fault-free and gently folded parallel continuous layers). The High Amplitude Reflector (HAR, green line) mimicks the seafloor with negative polarity. The rectangle box highlights the northern segment of the sedimentary ridge (SR) in the study region. The seismic wiggle trace (CDP: 12800) highlights the positive polarity of the seafloor vis-a-vis the negative polarity of high amplitude reflector (HAR). The Diligent fault (DLF) is highlighted using dashed vertical lines.
4.4 High-resolution shallow seismic stratigraphy across mound M1
Figures 5–Figures 7 illustrate the seismic coverage in mound M1 through four high-resolution seismic (HRS) lines: A-A’, B-B’, C-C’, and D-D’ (Figure 2A). Profile A-A’, oriented in the SW-NE direction (Figure 5A), depicts the bathymetric mound (M1) where gas flares are observed in the subbottom profiler data. The profile exhibits two prominent seismic facies: parallel continuous layers with minor faults and a disturbed zone with few internal reflections. The continuous layers may correspond to the regional seismic sequence S3. The other seismic sequences (S1 and S2) are less discernible due to limited penetration in the HRS data. Inclined beds are observed dipping towards the SW direction between CDPs 2800 and 3200, while gently dipping beds are observed towards the NE direction between CDPs 3400 and 3800. Sediments near mound M1 exhibit lower frequency and higher amplitude, suggesting the presence of free gas, hydrates, or authigenic carbonates (Figure 5B). The reflectors below the mound M1 are also less discernible, indicating a potential region for fluid migration. We observe a high amplitude reflector (HAR) mimicking the seafloor between 2.7 and 2.8 s TWT similar to the regional seismic profile (Figure 4B); however, the reflector is absent below the mound M1. Additionally, a long fault extending from the top of the mound M1 to the depths below the HAR is observed, with enhanced reflections observed on the NE side of the fault. Profile B-B’, oriented in the SSW-NNE direction show features similar to profile A-A’.
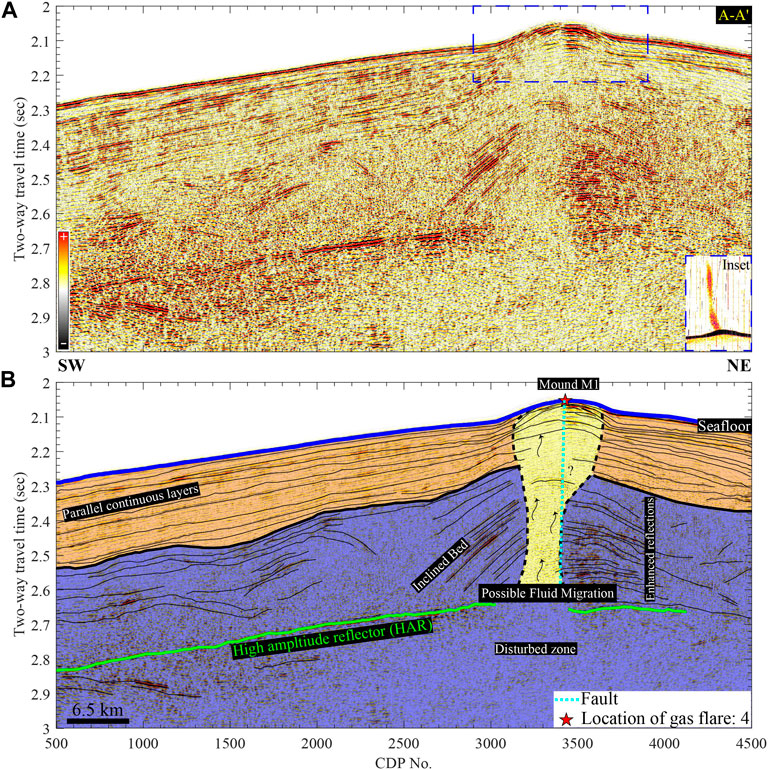
Figure 5. HRS seismic profiles along line A-A’ (SW-NE orientation) across Mound M1. (A) Uninterpreted profile and the inset (dashed rectangle box) of the SBP profile along the A-A’ highlights the gas flare “4” over the mound M1. (B) Interpreted profile showing the location of gas flares (red star) at CDP 3400; distinct seismic sequences (S3), a disturbed zone with inclined beds (SW direction), enhanced dipping reflectors (NE direction), High Amplitude Reflector (HAR, green line), near-vertical fault (cyan), and the zone of potential fluid migration (curved arrow) are highlighted.
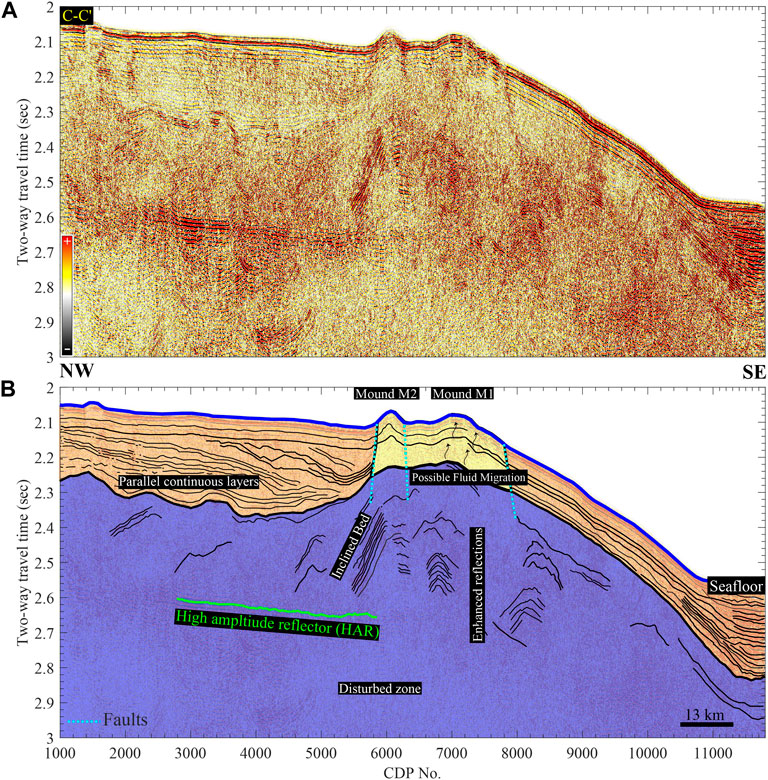
Figure 6. High-resolution seismic (HRS) line C-C’ oriented in the NW-SE Direction. (A) Uninterpreted HRS seismic profile across the mound M1 and M2; (B) Profile C-C’ shows parallel continuous layers (S3) on both sides of the mounds and a potential fluid migration zone. The High Amplitude Reflector (HAR, green line) is observed around 2.6 s, and some deep-seated faults are inferred beneath the mounds M1 and M2.
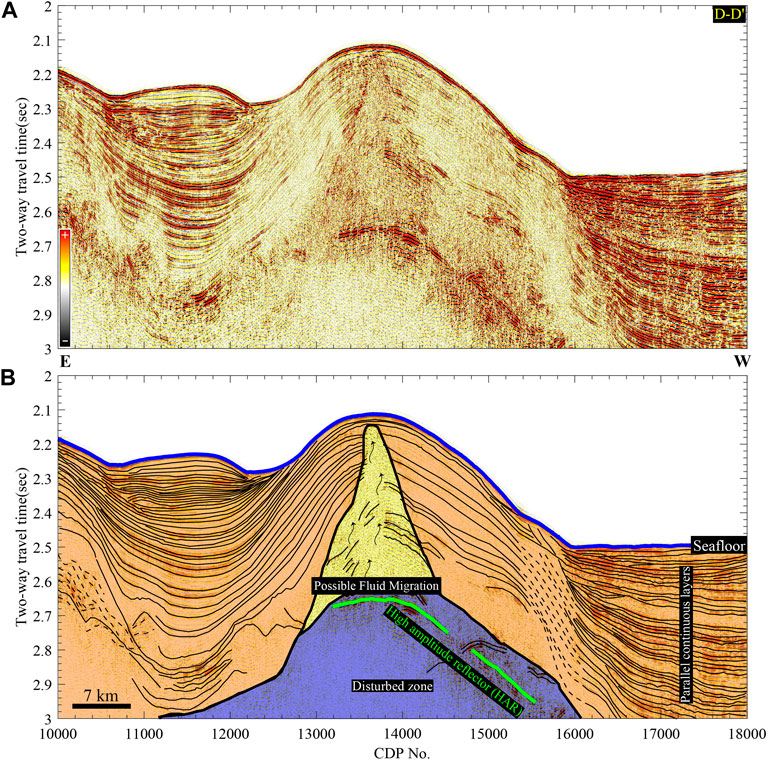
Figure 7. High-resolution seismic (HRS) line D-D’ oriented in the EW Direction (A) Uninterpreted profile; (B) Profile D-D’ shows parallel continuous layers (S3) on both sides of the mounds and a potential fluid migration zone. The High Amplitude Reflector (HAR, green line) is marked between 2.7 and 2.9 s, spanning CDPs 13,100 to 15,600.
In the NW-SE oriented profile (C-C’; Figure 6A), seafloor mounds (M1 and M2) are observed between CDPs 5500 and 8000. Similar to previous observations, parallel continuous layers flank the mounds (Figure 6B). Deformed beds are noted from 2.4 to 2.6 s beneath these layers (Figure 6B). The potential region of fluid migration appears to rise from 2.3 s TWT, with some fractures observed below mound M1. The HAR is observed around 2.6 s between CDPs 2600 and 6000. Deep-seated faults are observed beneath mounds M1 and M2. In the EW-oriented seismic profile (D-D’; Figure 7A), the fluid migration zone is evident between CDPs 12800 and 14400, rising from 2.8 s to 2.2 s. Parallel continuous layers of sequence S3 are observed on either side of fluid migration zone. The HAR is observed between 2.7 and 2.9 s from CDPs 13100 to 15600 (Figure 7B).
A detailed view of seafloor mound M1 from profile A-A’ (Figure 8A) shows multiple fault/fractures affecting the shallow sediments. Seabed samples collected using a spade core from the gas flares region show carbonate rocks with numerous pore and void structures (Figure 8B), potentially linked to the gas ebullition or burrows from benthic organisms. A detailed analysis of carbonates is underway to gain insight into their origins.1
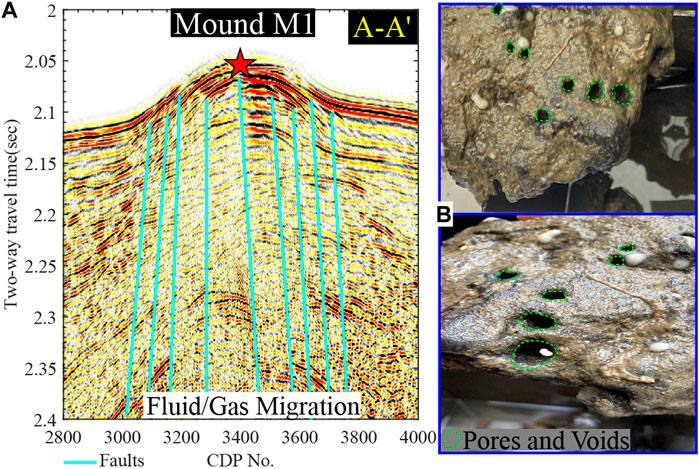
Figure 8. Geological Sampling of Mound M1 in the vicinity of gas flare region. (A) Zoom in of seismic profile A-A’ near mound M1 highlighting numerous fractures (marked in cyan) which may act as the pathways of free gas migration; (B) seabed samples collected using spade core illustrate carbonate rocks with numerous pore and void structures, potentially linked to the gas ebullition or burrows from benthic organisms.
5 Discussion
5.1 Geophysical signature of gas hydrate deposits and free gas in the Andaman forearc basin
The presence of overlying gas hydrate deposits and the underlying free gas generates a high impedance reflector known as the bottom simulating reflector (BSR) in seismic data. This occurs at depths corresponding to the base of the gas hydrate stability zone (GHSZ; Kvenvolden, 1985; Shipley et al., 1979; Singh et al., 1993). The identification of BSR relies on its distinct characteristics, including its mimicking of seafloor topography, reverse polarity relative to the seafloor, and crosscutting of pre-existing geological layers, signifying its role as a phase boundary. The analysis of seismic and well-logging data has confirmed the presence of gas hydrate deposits in the northern forearc basin (Prakash et al., 2013). The BSR-derived geothermal gradient appears to be highly variable in the forearc basin, ranging from 25°C/km to 52°C/km, resulting in a huge variation in the thickness of the GHSZ, ranging from 200 to 650 m (Prakash et al., 2013). Analysis of seismic attributes suggests the existence of gas hydrate accumulations within the central forearc basin (Satyavani et al., 2008), and drilling/coring at Site NGHP-01-17 confirmed pore-filling gas hydrate preferentially occurring within the volcanic ash layers (Ojha and Sain, 2013; Kumar et al., 2014). The concentration and isotopic ratio of hydrocarbon gases suggest mostly biogenic methane with minor traces of thermogenic methane (Kumar et al., 2014).
In the present study, the regional seismic profile from the southern part of the forearc basin shows a high amplitude reflector with characteristics similar to those of BSR. Further, the presence of HAR near the base of the GHSZ map (Rastogi et al., 1999) leads to its interpretation as BSR. The HAR as observed in the high-resolution seismic data is also interpreted as BSR, and its spatial extent is mapped in Figure 2A. The presence of BSR indicates gas hydrate deposits in the southern part of the forearc basin. However, BSR is not observed directly beneath the gas flare region, suggesting unsuitable temperature or pressure conditions for gas hydrates formation. Alternatively, limited penetration of high-resolution seismic data may hinder the imaging of BSRs below the fluid migration zone.
5.2 Structural and tectonic setting favoring methane migration in the forearc region
The oblique subduction of the Indo-Australian plate beneath the Eurasian-Asian plate results in slip distribution parallel and perpendicular to the trench (Fitch, 1972). Trench-parallel motion is accommodated by a strike-slip sliver fault, while trench-perpendicular motion leads to the formation of an accretionary prism and forearc basin. Significant structural features within the forearc basin include the Eastern Marginal Fault (EMF), an inactive normal fault that bounds the basin to the west; the Invisible Bank, a continental sliver that bounds the basin to the east; and the DLF, a back thrust fault responsible for the upliftment of older sediments (Singh et al., 2013). Similar uplifted sediments and back thrusts are observed in the northern Sumatra segment at 5.40ºN, indicating a compression regime within the forearc basin.
The compression regime facilitates the upward migration of hydrocarbon gases, detectable through seismic and sonar techniques (Judd and Hovland, 1992; Colbo et al., 2014; Stott et al., 2019; Böttner et al., 2020; Kim et al., 2020). Gas presence in sedimentary layers causes seismic attenuation, resulting in acoustic turbidity/masking (Judd and Hovland, 1992; Taylor, 1992; Chand and Minshull, 2003; Judd and Hovland, 2007), and enhanced reflections beneath the BSR (Naudts et al., 2006; Hustoft et al., 2007). Seismic chimneys (Crutchley et al., 2010; Mishra et al., 2020) indicate gas migration pathways through the overburden. In certain cases, high pore-fluid pressure induced by sedimentary overloading can expel subsurface sediments and fluids, creating features like pockmarks and submarine mud volcanoes. The latter are commonly observed in compressional tectonic settings such as the Makran accretionary wedge (Schlüter et al., 2002), the Mediterranean accretionary wedge (Camerlenghi et al., 1995; Kopf, 1999), off Costa Rica (Bohrmann et al., 2002), the Barbados Ridge complex (Westbrook and Smith, 1983), the eastern Indonesian accretionary complex (Barber et al., 1986), and the Nankai accretionary wedge of Japan (Kuramoto et al., 2001; Morita et al., 2004).
Mud volcanoes concealed beneath the surface have been documented in the northern segment of the forearc basin of the Andaman region (Basu et al., 2012a; Basu et al., 2012b). Their formation is influenced by regional compression forces and the presence of overpressured shale strata and mass transport deposits (MTDs) within the forearc basin (Basu et al., 2012b). Usually, the mud volcanoes are positioned atop anticline structures, resulting from basin inversion during the Early Miocene. Mud volcanoes erupted during the Pliocene period due to the reactivation of deep-seated normal faults into reverse faults. Subsequently, the mud volcanoes are covered by Pleistocene to Recent sediments and are identifiable on the seismic data as chaotic reflections (Basu et al., 2012a). Analysis of seismic and logging data suggests that the sources of mud volcanoes include shallow and deeper Miocene MTDs (Basu et al., 2012b).
In the present study, analysis of the regional seismic line shows the existence of a shallow-depth MTD covered by recent sedimentary layers within the southern part of the forearc basin (Figure 4B). The MTD may be supplied with free gas originating from the base of GHSZ as observed in Figure 4B, leading to over-pressured zones within the geological strata. Detailed analysis of high-resolution seismic data identifies a zone associated with the movement of fluidized sediment from the MTD or gas-charged sediments. Multiple faults extending down to the base of the GHSZ may serve as conduits for the transportation of fluids and gases across geological horizons. Therefore, our study suggests an initial stage of mud volcano formation in the southern forearc basin, potentially evolving into fully-developed mud volcanoes over time.
5.3 Gas flares in the Andaman forearc region
The bathymetry (Figure 2) highlights a prominent mound M1 in the southern part of the forearc basin, while the WCI, SBP data over the mound M1 (Figure 3) show the presence of gas flares. The significant difference in density and velocity between the gas bubbles and seawater creates a noticeable impedance contrast (Turco et al., 2022), facilitating its detection using high-frequency multibeam echosounders (Greinert et al., 2006). Geological samples collected near the base of gas flares probably show authigenic carbonates (Figure 8B), which may formed by the interaction of methane, chemosynthetic communities, and seawater (Foucher et al., 2009).
According to the GHSZ map of India, methane hydrates in the Andaman basin remain stable at water depths beyond 700–750 m (Rastogi et al., 1999). The methane hydrate + seawater phase curve and temperature profile of the Andaman basin further confirm the stability of hydrates at depths greater than 700 m (Figure 2A). Consequently, the observed gas flares are situated within the GHSZ. It is anticipated that methane bubbles are coated with a thin hydrate skin, which dramatically reduces methane dissolution. This hydrate coating provides protection and leads to the formation of tall flares within the GHSZ (Heeschen et al., 2003; Leifer and MacDonald, 2003; Obzhirov et al., 2004; Greinert et al., 2006; Judd and Hovland, 2007; Law et al., 2010; Bünz et al., 2012; Wenau et al., 2015; Römer et al., 2019). In our investigation, we have observed tall gas flares ascending up to 700 m water depth. The 700 m depth signifies the top boundary of the GHSZ in the Andaman Sea as depicted in Figure 2A. As gas bubbles rise vertically in the water column due to buoyancy and cross the GHSZ, the hydrate skin surrounding the bubble dissociates, causing rapid dissolution of methane and the abrupt termination of the methane flare. Similar observations have been reported globally (Henry et al., 2002; Rehder et al., 2002; Pecher et al., 2010; Rudolph and Manga, 2010; Crutchley et al., 2013; Mazumdar et al., 2019; Dewangan et al., 2021).
5.4 Geological model for the origin of methane flares in the Andaman’s forearc basin
We propose a geological model to elucidates the observed methane flares in the forearc basin of the Andaman Sea. Sediments in the forearc basin were deposited into two distinct tectonic regimes: the accretionary phase (Upper Cretaceous to Oligocene) and the forearc phase (Miocene to Recent) (Basu et al., 2012a). During the forearc phase, the basin experienced subsidence, known as the ponded-fill stage, and acted as a natural trap for sediments sourced from the Irrawaddy River and the Andaman Islands. Significant tectonic events such as submarine volcanism during the Early Miocene (Srinivasan and Azmi, 1976; Srivastava et al., 2021) may have led to basin inversion, resulting in the formation of shallow and deep-level MTDs (Basu et al., 2012b; Pandey et al., 2017).
Our investigation explores the geological evolution from the Mid-Miocene to the present, focusing on the Diligent Fault (DLF) growth due to compressional tectonics (Moeremans and Singh, 2015). Figure 9A illustrates the initial sedimentary depositions, which subsequently underwent uplift and tilting, likely concurrent with or shortly after the inception of the DLF into a back thrust system. Persistent folding throughout sedimentation, as evidenced by downwarping and minor faulting at fold hinges (Figure 9B) forms a series of sediment ridges as observed in the bathymetry data.
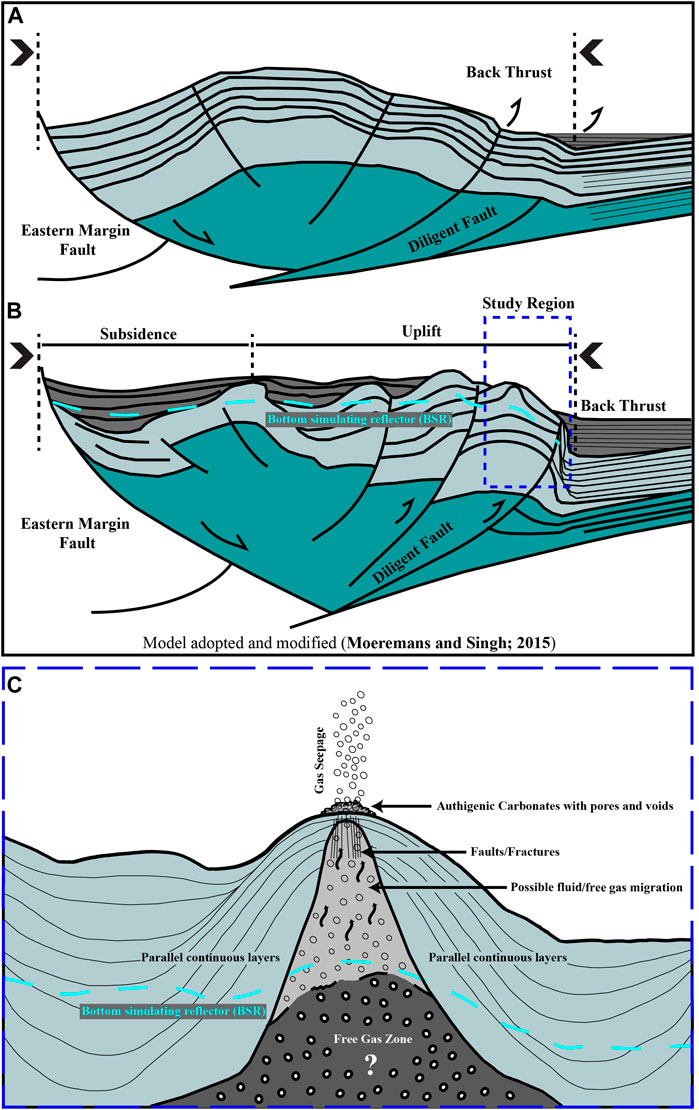
Figure 9. Illustration of the geological evolution and tectonic dynamics in the study area. (A) Initial sedimentary depositions, which subsequently underwent uplift and tilting, likely concurrent with or shortly after the inception of the DLF into a back thrust system. (B) Persistent folding throughout sedimentation, as evidenced by downwarping and minor faulting at fold hinges forms a series of sediment ridges as observed in the bathymetry data. The presence of BSR indicates the occurrence of gas hydrate deposits underlain by free-gas bearing sediments. (C) Compression tectonics, primarily driven by DLF, facilitates the upward migration of methane. Prominent bathymetric mounds may form atop the sedimentary ridges and gases may seep through them leading to gas flares/cold seep environments and the formation of authigenic carbonates on the seabed.
Methane in the forearc basin of the Andaman Sea originates from organic matter degradation and thermogenic activity (Prakash et al., 2013). This has resulted in the widespread occurrence of gas hydrates within the GHSZ and free gas at its base (Satyavani et al., 2008; Ojha and Sain, 2013; Prakash et al., 2013; Kumar et al., 2014). Compression tectonics, primarily driven by DLF, facilitates the upward migration of methane. Prominent bathymetric mounds may form atop the sedimentary ridges and gases may seep through them leading to gas flares/cold seep environments and the formation of authigenic carbonates on the seabed (Figure 9C). We propose that compression tectonics due to subduction, coupled with regional and local fault systems extending to the base of the GHSZ, may have facilitated the migration of methane gas through the geological strata. Similar structures globally are favorable locations for the formation of gas hydrate deposits and cold seeps.
6 Conclusion
The geological and tectonic framework of the Andaman forearc basin favors the upward migration of fluid/gas through an extensive network of faults and fractures resulting from ongoing subduction processes. In the present study, we report gas flares from southern forearc region of the Andaman Sea. The gas flares rise vertically to 700 m depth from a surrounding 1,550 m seafloor depth. Seabed sampling of the gas flare region shows probable authigenic carbonates, indicating methane gas ebullition. The specific location of these gas flares coincides with elevated bathymetric mounds (M1 and M2), key geological features over a sedimentary ridge formed due to compression tectonics. The presence of BSR observed on the regional seismic lines and inferred from the high-resolution seismic profiles suggests the existence of gas hydrate deposits and free gas-bearing sediments in the southern part of the Andaman forearc region. The regional fault system serves as a plausible conduit for the migration of fluid/gas migration from deeper reservoirs up to the seafloor.
Data availability statement
The original contributions presented in the study are included in the article/Supplementary material, further inquiries can be directed to the corresponding author.
Author contributions
A: Data curation, Investigation, Methodology, Software, Visualization, Writing–original draft, Writing–review and editing. PD: Conceptualization, Data curation, Formal Analysis, Funding acquisition, Investigation, Methodology, Project administration, Resources, Software, Supervision, Validation, Visualization, Writing–original draft, Writing–review and editing. GS: Conceptualization, Data curation, Formal Analysis, Funding acquisition, Investigation, Methodology, Project administration, Resources, Software, Supervision, Validation, Visualization, Writing–original draft, Writing–review and editing.
Funding
The author(s) declare financial support was received for the research, authorship, and/or publication of this article. This work is a contribution to the R&D projects MLP 2017 (TeaM-RiSe) and MLP 2015 (MSEEPS) supported by Council of Scientific and Industrial Research (CSIR), Goverment of India.
Acknowledgments
The authors express gratitude to Prof. Sunil Kumar Singh, Director of CSIR-NIO, for granting permission to publish this paper. Special thanks are extended to the captain and crew of RV Sindhu Sadhana, as well as the CSIR-NIO research vessel management team, comprising Mr. Kallathian M., Mr. Buddhadas Patole, and Mr. Kuldeep Kumar, for their exceptional technical support during the SSD-085 expeditions onboard RV Sindhu Sadhana. The authors also acknowledge the NDR (National Data Repository)–Directorate General of Hydrocarbons (DGH), Ministry of Petroleum and Natural Gas, Government of India, for providing access to the regional seismic data. The project GAP3337 is acknowledged for sponsoring the fellowship to Mr. Ankush. This is CSIR-NIO contribution number 7213.
Conflict of interest
The authors declare that the research was conducted in the absence of any commercial or financial relationships that could be construed as a potential conflict of interest.
Publisher’s note
All claims expressed in this article are solely those of the authors and do not necessarily represent those of their affiliated organizations, or those of the publisher, the editors and the reviewers. Any product that may be evaluated in this article, or claim that may be made by its manufacturer, is not guaranteed or endorsed by the publisher.
Footnotes
1Peketi, A., Mazumdar, A., Subhashree, A., Dewangan, V., and Sriram, G. (under preparation). Methane derived authigenic carbonates from the forearc basin of the Andaman-Nicobar subduction zone.
References
Allen, R., Carter, A., Najman, Y., Bandopadhyay, D. P., Chapman, H., Bickle, M., et al. (2008). New constraints on the sedimentation and uplift history of the Andaman-Nicobar accretionary prism, South Andaman Island. Geol. Soc. Am. Special Pap. 436, 223–255. doi:10.1130/2008.2436(11)
Andreassen, K., Nilssen, E., and Ødegaard, C. (2007). Analysis of shallow gas and fluid migration within the Plio-Pleistocene sedimentary succession of the SW Barents Sea continental margin using 3D seismic data. Geo-Marine Lett. 27, 155–171. doi:10.1007/s00367-007-0071-5
Awasthi, N., George, B. G., and Ray, J. S. (2020). “Tracing the sources and depositional pathways for the Oligocene sediments in the andaman forearc,” in The andaman islands and adjoining offshore: geology, tectonics and palaeoclimate (Cham: Springer International Publishing), 93–106. doi:10.1007/978-3-030-39843-9_5
Awasthi, N., and Ray, J. S. (2019). The palaeogene record of himalayan erosion in the Andaman basin. J. Earth Syst. Sci. 129, 15. doi:10.1007/s12040-019-1266-7
Barber, A. J., Tjokrosapoetro, S., and Charlton, T. R. (1986). Mud volcanoes, shale diapirs, wrench faults and melanges in accretionary complexes, eastern Indonesia. Am. Assoc. Petroleum Geol. Bull. 70. doi:10.1306/94886ca9-1704-11d7-8645000102c1865d
Basu, P., Verma, R., Paul, R., and Viswanath, K. (2012a). Mass-transport complexes in deep water of andaman Forearc Basin. Geohorizons 1, 46–49.
Basu, P., Verma, R., Paul, R., and Viswanath, K. (2012b). “Mud volcanoes in deep water of andaman Forearc Basin,” in SPG 9th Bienn, Hyderabad, 105.
Bohrmann, G., Heeschen, K., Jung, C., Weinrebe, W., Baranov, B., Cailleau, B., et al. (2002). Widespread fluid expulsion along the seafloor of the Costa Rica convergent margin. Terra Nov. 14, 69–79. doi:10.1046/j.1365-3121.2002.00400.x
Böttner, C., Haeckel, M., Schmidt, M., Berndt, C., Vielstädte, L., Kutsch, J. A., et al. (2020). Greenhouse gas emissions from marine decommissioned hydrocarbon wells: leakage detection, monitoring and mitigation strategies. Int. J. Greenh. Gas. Control 100, 103119. doi:10.1016/j.ijggc.2020.103119
Bünz, S., Polyanov, S., Vadakkepuliyambatta, S., Consolaro, C., and Mienert, J. (2012). Active gas venting through hydrate-bearing sediments on the Vestnesa Ridge, offshore W-Svalbard. Mar. Geol. 334, 189–197. doi:10.1016/j.margeo.2012.09.012
Camerlenghi, A., Cita, M. B., Vedova, B., Della, Fusi, N., Mirabile, L., and Pellis, G. (1995). Geophysical evidence of mud diapirism on the Mediterranean Ridge accretionary complex. Mar. Geophys. Res. 17, 115–141. doi:10.1007/BF01203423
Canfield, D. E. (1991). Sulfate reduction in deep-sea sediments. Am. J. Sci. 291, 177–188. doi:10.2475/ajs.291.2.177
Chakraborty, P. P., and Pal, T. (2001). Anatomy of a forearc submarine fan: upper Eocene — Oligocene andaman Flysch group, andaman islands, India. Gondwana Res. 4, 477–486. doi:10.1016/S1342-937X(05)70347-6
Chand, S., and Minshull, T. A. (2003). Seismic constraints on the effects of gas hydrate on sediment physical properties and fluid flow: a review. Geofluids 3, 275–289. doi:10.1046/j.1468-8123.2003.00067.x
Cochran, J. R. (2010). Morphology and tectonics of the andaman forearc, northeastern Indian ocean. Geophys. J. Int. 182, 631–651. doi:10.1111/j.1365-246X.2010.04663.x
Colbo, K., Ross, T., Brown, C., and Weber, T. (2014). A review of oceanographic applications of water column data from multibeam echosounders. Estuar. Coast. Shelf Sci. 145, 41–56. doi:10.1016/j.ecss.2014.04.002
Cook, A. E., and Malinverno, A. (2013). Short migration of methane into a gas hydrate-bearing sand layer at Walker Ridge, Gulf of Mexico. Geochem. Geophys. Geosystems 14, 283–291. doi:10.1002/ggge.20040
Crutchley, G. J., Berndt, C., Geiger, S., Klaeschen, D., Papenberg, C., Klaucke, I., et al. (2013). Drivers of focused fluid flow and methane seepage at south Hydrate Ridge, offshore Oregon, USA. Geology 41, 551–554. doi:10.1130/G34057.1
Crutchley, G. J., Maslen, G., Pecher, I. A., and Mountjoy, J. J. (2016). High-resolution seismic velocity analysis as a tool for exploring gas hydrate systems: an example from New Zealand ’s southern Hikurangi margin. Interpretation 4, SA1–SA12. doi:10.1190/INT-2015-0042.1
Crutchley, G. J., Mountjoy, J. J., Hillman, J. I. T., Turco, F., Watson, S., Flemings, P. B., et al. (2021). Upward-doming zones of gas hydrate and free gas at the bases of gas chimneys, New Zealand’s hikurangi margin. J. Geophys. Res. Solid Earth 126, e2020JB021489. doi:10.1029/2020JB021489
Crutchley, G. J., Pecher, I. a., Gorman, A. R., Henrys, S. a., and Greinert, J. (2010). Seismic imaging of gas conduits beneath seafloor seep sites in a shallow marine gas hydrate province, Hikurangi Margin, New Zealand. Mar. Geol. 272, 114–126. doi:10.1016/j.margeo.2009.03.007
Curray, J. R. (2005). Tectonics and history of the Andaman Sea region. J. Asian Earth Sci. 25, 187–232. doi:10.1016/j.jseaes.2004.09.001
Dewangan, P., Sriram, G., Kumar, A., Mazumdar, A., Peketi, A., Mahale, V., et al. (2021). Widespread occurrence of methane seeps in deep-water regions of Krishna-Godavari basin, Bay of Bengal. Mar. Pet. Geol. 124, 104783. doi:10.1016/j.marpetgeo.2020.104783
Dickinson, W. R., and Seely, D. R. (1979). Structure and stratigraphy of forearc Regions1. Am. Assoc. Pet. Geol. Bull. 63, 2–31. doi:10.1306/C1EA55AD-16C9-11D7-8645000102C1865D
Dondurur, D., Cifci, G., Drahor, M., and Coskun, S. (2011). Acoustic evidence of shallow gas accumulations and active pockmarks in the İzmir Gulf, Aegean sea. Mar. Pet. Geol. - Mar. Pet. Geol. 28, 1505–1516. doi:10.1016/j.marpetgeo.2011.05.001
Duarte, H., Menezes Pinheiro, L., Curado Teixeira, F., and Monteiro, J. H. (2007). High-resolution seismic imaging of gas accumulations and seepage in the sediments of the Ria de Aveiro barrier lagoon (Portugal). Geo-Marine Lett. 27, 115–126. doi:10.1007/s00367-007-0069-z
Ergün, M., Dondurur, D., and Çifçi, G. (2002). Acoustic evidence for shallow gas accumulations in the sediments of the Eastern Black Sea*. Terra Nov. 14, 313–320. doi:10.1046/j.1365-3121.2002.00434.x
Fitch, T. J. (1972). Plate convergence, transcurrent faults, and internal deformation adjacent to Southeast Asia and the Western Pacific. J. Geophys. Res. Solid Earth 77, 4432–4460. doi:10.1029/JB077i023p04432
Foucher, J., Westbrook, G., Boetius, A., Ceramicola, S., Dupré, S., Mascle, J., et al. (2009). Structure and drivers of cold seep ecosystems. Oceanography 22, 92–109. doi:10.5670/oceanog.2009.11
Greinert, J., Artemov, Y., Egorov, V., De Batist, M., and McGinnis, D. (2006). 1300-m-high rising bubbles from mud volcanoes at 2080 m in the Black Sea: hydroacoustic characteristics and temporal variability. Earth Planet. Sci. Lett. 244, 1–15. doi:10.1016/j.epsl.2006.02.011
Gullapalli, S., Dewangan, P., Kumar, A., Dakara, G., and Mishra, C. K. (2019). Seismic evidence of free gas migration through the gas hydrate stability zone (GHSZ) and active methane seep in Krishna-Godavari offshore basin. Mar. Pet. Geol. 110, 695–705. doi:10.1016/j.marpetgeo.2019.07.052
Heeschen, K. U., Tréhu, A. M., Collier, R. W., Suess, E., and Rehder, G. (2003). Distribution and height of methane bubble plumes on the Cascadia Margin characterized by acoustic imaging. Geophys. Res. Lett. 30. doi:10.1029/2003GL016974
Henry, P., Lallemant, S., Nakamura, K., Tsunogai, U., Mazzotti, S., and Kobayashi, K. (2002). Surface expression of fluid venting at the toe of the Nankai wedge and implications for flow paths. Mar. Geol. 187, 119–143. doi:10.1016/S0025-3227(02)00262-1
Hillman, J. I. T., Cook, A. E., Daigle, H., Nole, M., Malinverno, A., Meazell, K., et al. (2017). Gas hydrate reservoirs and gas migration mechanisms in the Terrebonne Basin, Gulf of Mexico. J. Mar. Pet. Geol. 86, 1357–1373. doi:10.1016/j.marpetgeo.2017.07.029
Hillman, J. I. T., Crutchley, G. J., and Kroeger, K. F. (2020). Investigating the role of faults in fluid migration and gas hydrate formation along the southern Hikurangi Margin, New Zealand. Mar. Geophys. Res. 41, 8. doi:10.1007/s11001-020-09400-2
Hoffmann, J. J. L., Gorman, A. R., and Crutchley, G. J. (2019). Seismic evidence for repeated vertical fluid flow through polygonally faulted strata in the Canterbury Basin, New Zealand. Mar. Pet. Geol. 109, 317–329. doi:10.1016/j.marpetgeo.2019.06.025
Hustoft, S., Mienert, J., Bünz, S., and Nouzé, H. (2007). High-resolution 3D-seismic data indicate focussed fluid migration pathways above polygonal fault systems of the mid-Norwegian margin. Mar. Geol. 245, 89–106. doi:10.1016/j.margeo.2007.07.004
Judd, A., and Hovland, M. (2007). Seabed fluid flow: the impact on geology, biology and the marine environment. Cambridge: Cambridge University Press.
Judd, A. G. (2004). Natural seabed gas seeps as sources of atmospheric methane. Environ. Geol. 46, 988–996. doi:10.1007/s00254-004-1083-3
Judd, A. G., and Hovland, M. (1992). The evidence of shallow gas in marine sediments. Cont. Shelf Res. 12, 1081–1095. doi:10.1016/0278-4343(92)90070-Z
Kamesh Raju, K. A., Murty, G. P. S., Amarnath, D., and Kumar, M. L. M. (2007). The west Andaman fault and its influence on the aftershock pattern of the recent megathrust earthquakes in the Andaman-Sumatra region. Geophys. Res. Lett. 34, 1–5. doi:10.1029/2006GL028730
Karisiddaiah, S. M., and Veerayya, M. (1994). Methane-bearing shallow gas-charged sediments in the eastern Arabian Sea: a probable source for greenhouse gas. Cont. Shelf Res. 14, 1361–1370. doi:10.1016/0278-4343(94)90053-1
Kim, Y. J., Cheong, S., Chun, J. H., Cukur, D., Kim, S. P., Kim, J. K., et al. (2020). Identification of shallow gas by seismic data and AVO processing: example from the southwestern continental shelf of the Ulleung Basin, East Sea, Korea. Mar. Pet. Geol. 117, 104346. doi:10.1016/j.marpetgeo.2020.104346
Kopf, A. (1999). Fate of sediment during plate convergence at the Mediterranean Ridge accretionary complex: volume balance of mud extrusion versus subduction and/or accretion. Geology 27, 87. doi:10.1130/0091-7613(1999)027<0087:FOSDPC>2.3.CO;2
Krabbenhoeft, A., Bialas, J., Klaucke, I., Crutchley, G., Papenberg, C., and Netzeband, G. L. (2013). Patterns of subsurface fluid-flow at cold seeps: the Hikurangi Margin, offshore New Zealand. Mar. Pet. Geol. 39, 59–73. doi:10.1016/j.marpetgeo.2012.09.008
Kumar, P., Collett, T. S., Boswell, R., Cochran, J. R., Lall, M., Mazumdar, A., et al. (2014). Geologic implications of gas hydrates in the offshore of India: krishna–godavari basin, mahanadi basin, Andaman Sea, Kerala–konkan basin. Mar. Pet. Geol. 58, 29–98. doi:10.1016/j.marpetgeo.2014.07.031
Kuramoto, I., Ashi, J., Greinert, J., Gulick, S., Ishimura, T., Morita, S., et al. (2001). Surface observations of subduction related mud volcanoes and large thrust sheets in the Nankai subduction margin; report on YK00-10 and YK01-04 cruises. JAMSTEC J. Deep Sea Res. 19.
Kvenvolden, K. A. (1985). Comparison of marine gas hydrates in sediments of an active and passive continental margin. Mar. Pet. Geol. 2, 65–71. doi:10.1016/0264-8172(85)90049-2
Kvenvolden, K. A., and Rogers, B. W. (2005). Gaia’s breath—global methane exhalations. Mar. Pet. Geol. 22, 579–590. doi:10.1016/j.marpetgeo.2004.08.004
Law, C. S., Nodder, S. D., Mountjoy, J. J., Marriner, A., Orpin, A., Pilditch, C. A., et al. (2010). Geological, hydrodynamic and biogeochemical variability of a New Zealand deep-water methane cold seep during an integrated three-year time-series study. Mar. Geol. 272, 189–208. doi:10.1016/j.margeo.2009.06.018
Lazar, M., Lang, G., and Schattner, U. (2016). Coincidence or not? Interconnected gas/fluid migration and ocean–atmosphere oscillations in the Levant Basin. Geo-Marine Lett. 36, 293–306. doi:10.1007/s00367-016-0447-5
Leifer, I., and MacDonald, I. (2003). Dynamics of the gas flux from shallow gas hydrate deposits: interaction between oily hydrate bubbles and the oceanic environment. Earth Planet. Sci. Lett. 210, 411–424. doi:10.1016/S0012-821X(03)00173-0
Mazumdar, A., Dewangan, P., Joäo, H. M., Peketi, A., Khosla, V. R., Kocherla, M., et al. (2009). Evidence of paleo--cold seep activity from the Bay of Bengal, offshore India. Geochem. Geophys. Geosystems 10, Q06005. doi:10.1029/2008gc002337
Mazumdar, A., Dewangan, P., Peketi, A., Gullapalli, S., Kalpana, M. S., Naik, G. P., et al. (2019). The first record of active methane (cold) seep ecosystem associated with shallow methane hydrate from the Indian EEZ. J. Earth Syst. Sci. 128, 18. doi:10.1007/s12040-018-1044-y
Meldahl, P., Heggland, R., Bril, B., and de Groot, P. (2001). Identifying faults and gas chimneys using multiattributes and neural networks. Lead. Edge 20, 474–482. doi:10.1190/1.1438976
Miles, P. R. (1995). Potential distribution of methane hydrate beneath the European continental margins. Geophys. Res. Lett. 22, 3179–3182. doi:10.1029/95GL03013
Mishra, C. K., Dewangan, P., Sriram, G., Kumar, A., and Dakara, G. (2020). Spatial distribution of gas hydrate deposits in Krishna-Godavari offshore basin, Bay of Bengal. Mar. Pet. Geol. 112, 104037. doi:10.1016/j.marpetgeo.2019.104037
Moeremans, R. E., and Singh, S. C. (2015). Fore-arc basin deformation in the Andaman-Nicobar segment of the Sumatra-Andaman subduction zone: insight from high-resolution seismic reflection data. Tectonics 34, 1736–1750. doi:10.1002/2015TC003901
Morita, S., Ashi, J., Aoike, K., and Kuramoto, S. (2004). “Evolution of Kumano basin and sources of clastic ejecta and pore fluid in Kumano mud volcanoes, Eastern Nankai Trough,” in Proceedings of the international symposium on methane hydrates and fluid flow in upper accretionary prisms (Pune: Engineering Geology Laboratory, Department of Civil and Earth Resources), 92–99.
Nandi, A. K., and Samanta, B. G. (2011). “Application of seismic geomorphology in identifying features depicting hydrocarbon indications in the deepwater Andaman basin, India,” in SPE Asia pacific oil and gas conference and exhibition (Society of Petroleum Engineers).
Naudts, L., Greinert, J., Artemov, Y., Staelens, P., Poort, J., Van Rensbergen, P., et al. (2006). Geological and morphological setting of 2778 methane seeps in the Dnepr paleo-delta, northwestern Black Sea. Mar. Geol. 227, 177–199. doi:10.1016/j.margeo.2005.10.005
Nole, M., Daigle, H., Cook, A. E., and Malinverno, A. (2016). Short-range, overpressure-driven methane migration in coarse-grained gas hydrate reservoirs. Geophys. Res. Lett. 43, 9500–9508. doi:10.1002/2016GL070096
Obzhirov, A., Shakirov, R., Salyuk, A., Suess, E., Biebow, N., and Salomatin, A. (2004). Relations between methane venting, geological structure and seismo-tectonics in the Okhotsk Sea. Geo-Marine Lett. 24, 135–139. doi:10.1007/s00367-004-0175-0
Ojha, M., and Sain, K. (2013). Quantification of gas hydrate and free gas in the Andaman offshore from downhole data. Curr. Sci. 105, 512–516.
Pal, T., Chakraborty, P., Gupta, T., and Singh, C. (2003). Geodynamic evolution of the outer-arcforearc belt in the Andaman Islands, the central part of the BurmaJava subduction complex. Geol. Mag. - Geol. Mag. 140, 289–307. doi:10.1017/S0016756803007805
Pandey, D. K., Anitha, G., Prerna, R., and Pandey, A. (2017). Late cenozoic seismic stratigraphy of the andaman Forearc Basin, Indian ocean. Pet. Sci. 14, 648–661. doi:10.1007/s12182-017-0197-7
Pecher, I. a., Henrys, S. a., Wood, W. T., Kukowski, N., Crutchley, G. J., Fohrmann, M., et al. (2010). Focussed fluid flow on the Hikurangi Margin, New Zealand — evidence from possible local upwarping of the base of gas hydrate stability. Mar. Geol. 272, 99–113. doi:10.1016/j.margeo.2009.10.006
Pedersen, R. B., Searle, M., Carter, A., and Bandopadhyay, D. P. (2010). U-Pb zircon age of the Andaman ophiolite: implications for the beginning of subduction beneath the Andaman-Sumatra arc. J. Geol. Soc. Lond. 167, 1105–1112. doi:10.1144/0016-76492009-151
Petersen, C. J., Bunz, S., Hustoft, S., Mienert, J., and Klaeschen, D. (2010). High-resolution P-Cable 3D seismic imaging of gas chimney structures in gas hydrated sediments of an Arctic sediment drift. Mar. Pet. Geol. 27, 1981–1994. doi:10.1016/j.marpetgeo.2010.06.006
Prakash, A., Samanta, B. G., and Singh, N. P. (2010). A seismic study to investigate the prospect of gas hydrate in Mahanadi deep water basin, northeastern continental margin of India. Mar. Geophys. Res. 31, 253–262. doi:10.1007/s11001-010-9106-9
Prakash, A., Samanta, B. G., and Singh, N. P. (2013). Evidence of gas hydrate accumulation and its resource estimation in Andaman deep water basin from seismic and well log data. Mar. Geophys. Res. 34, 1–16. doi:10.1007/s11001-012-9163-3
Rastogi, A., Deka, B., Bhattacharya, G. C., Ramprasad, T., KameshRaju, K. A., Srinivas, K., et al. (1999). Gas hydrates stability zone thickness map of Indian deep offshore areas-A GIS based approach. Shanghai, China: NIO.
Rehder, G., Brewer, P. W., Peltzer, E. T., and Friederich, G. (2002). Enhanced lifetime of methane bubble streams within the deep ocean. Geophys. Res. Lett. 29, 21–24. doi:10.1029/2001GL013966
Rensbergen, P. V., Rabaute, A., Colpaert, A., Ghislain, T. S., Mathijs, M., and Bruggeman, A. (2007). Fluid migration and fluid seepage in the Connemara Field, Porcupine Basin interpreted from industrial 3D seismic and well data combined with high-resolution site survey data. Int. J. Earth Sci. 96, 185–197. doi:10.1007/s00531-005-0021-2
Rodolfo, K. S. (1969). Bathymetry and marine geology of the andaman basin, and tectonic implications for southeast asia. Bull. Geol. Soc. Am. 80, 1203–1230. doi:10.1130/0016-7606(1969)80[1203:BAMGOT]2.0.CO;2
Römer, M., Hsu, C.-W., Loher, M., MacDonald, I. R., dos Santos Ferreira, C., Pape, T., et al. (2019). Amount and fate of gas and oil discharged at 3400 m water depth from a natural seep site in the southern gulf of Mexico. Front. Mar. Sci. 6, 700. doi:10.3389/fmars.2019.00700
Roy, S. K., and Das Sharma, S. (1993). Evolution of Andaman forearc basin and its hydrocarbon potential. Proc. Second Semin. Pet. Basins India. Indian Pet. Publ. Dehra Dun. India 1, 407–434.
Rudolph, M. L., and Manga, M. (2010). Mud volcano response to the 4 april 2010 el mayor-cucapah earthquake. J. Geophys. Res. Solid Earth 115. doi:10.1029/2010JB007737
Satyavani, N., Sain, K., Lall, M., and Kumar, B. J. P. (2008). Seismic attribute study for gas hydrates in the Andaman Offshore India. Mar. Geophys. Res. 29, 167–175. doi:10.1007/s11001-008-9053-x
Schlüter, H. U., Prexl, A., Gaedicke, C., Roeser, H., Reichert, C., Meyer, H., et al. (2002). The Makran accretionary wedge: sediment thicknesses and ages and the origin of mud volcanoes. Mar. Geol. 185, 219–232. doi:10.1016/S0025-3227(02)00192-5
Shipley, T. H., Houston, H. H., and Buffler, R. T. (1979). “Widespread occurrence of possible gas-hydrate horizons from continental slopes as identified on seismic reflection profiles,” in Paper presented at the Offshore Technology Conference, Houston, Texas, April30-May 3 1979. doi:10.4043/3570-MS
Singh, S. C., Minshull, T. A., and Spence, G. D. (1993). Velocity structure of a gas hydrate reflector. Sci. (80-. ) 260, 204–207. doi:10.1126/science.260.5105.204
Singh, S. C., and Moeremans, R. (2017). Chapter 13 Anatomy of the Andaman–Nicobar subduction system from seismic reflection data. Geol. Soc. Mem. 47, 193–204. doi:10.1144/M47.13
Singh, S. C., Moeremans, R., McArdle, J., and Johansen, K. (2013). Seismic images of the sliver strike-slip fault and back thrust in the Andaman-Nicobar region. J. Geophys. Res. Solid Earth 118, 5208–5224. doi:10.1002/jgrb.50378
Srinivasan, M. S., and Azmi, R. J. (1976). New developments in the late cenozoic lithostratigraphy of andaman-nicobar islands, bay of bengal. Proc. 6th Indian Coll. Micropal. Strat., 302–327.
Sriram, G., Dewangan, P., Yatheesh, V., Peketi, A., Mahesh, P., Mazumdar, A., et al. (2023). Gas migration signatures over the volcanic cratered seamount, off the Nicobar Islands in the Andaman Sea. Geo-Marine Lett. 43, 16. doi:10.1007/s00367-023-00757-y
Srivastava, D. K., Dave, A., and Dangwal, V. (2021). Sequence stratigraphy of the Andaman basin, northern Indian ocean. Mar. Pet. Geol. 133, 105298. doi:10.1016/j.marpetgeo.2021.105298
Stott, L. D., Harazin, K. M., and Quintana Krupinski, N. B. (2019). Hydrothermal carbon release to the ocean and atmosphere from the eastern equatorial Pacific during the last glacial termination. Environ. Res. Lett. 14, 025007. doi:10.1088/1748-9326/aafe28
Taylor, D. I. (1992). Nearshore shallow gas around the U.K. coast. Cont. Shelf Res. 12, 1135–1144. doi:10.1016/0278-4343(92)90074-T
Turco, F., Ladroit, Y., Watson, S. J., Seabrook, S., Law, C. S., Crutchley, G. J., et al. (2022). Estimates of methane release from gas seeps at the southern hikurangi margin, New Zealand. Front. Earth Sci. 10. doi:10.3389/feart.2022.834047
Veloso, M., Greinert, J., Mienert, J., and De Batist, M. (2015). A new methodology for quantifying bubble flow rates in deep water using splitbeam echosounders: examples from the Arctic offshore NW-Svalbard. Limnol. Oceanogr. Methods 13, 267–287. doi:10.1002/lom3.10024
Watson, S. J., Mountjoy, J. J., Barnes, P. M., Crutchley, G. J., Lamarche, G., Higgs, B., et al. (2019). Focused fluid seepage related to variations in accretionary wedge structure, Hikurangi margin, New Zealand. Geology 48, 56–61. doi:10.1130/G46666.1
Wenau, S., Spiess, V., Pape, T., and Fekete, N. (2015). Cold seeps at the salt front in the Lower Congo Basin I: current methane accumulation and active seepage. Mar. Pet. Geol. 67, 894–908. doi:10.1016/j.marpetgeo.2014.07.032
Westbrook, G. K., and Smith, M. J. (1983). Long decollements and mud volcanoes: evidence from the Barbados Ridge Complex for the role of high pore-fluid pressure in the development of an accretionary complex. Geology 11, 279–283. doi:10.1130/0091-7613(1983)11<279:LDAMVE>2.0.CO;2
Keywords: Andaman-Nicobar, methane derived authigenic carbonates, gas hydrates and mud volcanos, mass transport deposit (MTD), methane bubble with hydrate film, Diligent fault
Citation: Ankush , Dewangan P and Sriram G (2024) Methane gas flares in the forearc basin of the Andaman-Nicobar subduction zone. Front. Earth Sci. 12:1334942. doi: 10.3389/feart.2024.1334942
Received: 13 November 2023; Accepted: 11 March 2024;
Published: 08 April 2024.
Edited by:
Aurélien Gay, UMR5243 Géosciences Montpellier, FranceReviewed by:
Lies Loncke, Université de Perpignan Via Domitia, FranceMichael Lazar, University of Haifa, Israel
Copyright © 2024 Ankush, Dewangan and Sriram. This is an open-access article distributed under the terms of the Creative Commons Attribution License (CC BY). The use, distribution or reproduction in other forums is permitted, provided the original author(s) and the copyright owner(s) are credited and that the original publication in this journal is cited, in accordance with accepted academic practice. No use, distribution or reproduction is permitted which does not comply with these terms.
*Correspondence: G. Sriram, c3JpcmFtQG5pby5vcmc=