- 1Xinjiang Institute of Architectural Sciences (Limited Liability Company), Urumqi, China
- 2School of Civil and Hydraulic Engineering, Huazhong University of Science and Technology, Wuhan, Hubei, China
A series of biaxial tests with different initial particle shapes, confining pressures, bond strengths and depositional angles were conducted on coral sand by using a 2D discrete element method simulation. The interactions between particle shape and particle breakage were investigated, and their combined effects on the mechanical behavior of coral sand were analyzed. The test results showed that particle breakage considerably weakens the effect of particle shape and inherent anisotropy on shear strength. The difference between the internal friction angles of unbreakable and breakable agglomerates Δφ decreases with increasing aspect ratio AR, sphericity S, and depositional angle θ. There exists a unique relationship between the relative breakage BrDe and the input energy E for the same agglomerates, which is independent of axial strain and confining pressure. However, this relationship is significantly influenced by the agglomerate shape and depositional angle, and irregular and low depositional angle specimens are more easily broken. In addition, the evolution of the aspect ratio AR and sphericity S of agglomerates was controlled by particle breakage, regardless of the axial strain, confining pressure, bond strength and depositional angle, and these trends were determined by the initial particle shape.
1 Introduction
Coral sand is a special type of granular soil that usually originates from coral or shell fragments and is widely distributed on coral reefs and seashores throughout the world. As an essential material in offshore engineering, coral sand is commonly used as a foundation soil for wind turbines, seawalls, embankments, and airport runways. It is well known that coral sand particles are usually irregular, porous, and fragile. The particle size and shape significantly change when particle breakage occurs, and the mechanical properties of coral sand are considerably affected (Rui et al., 2020; Xiao et al., 2022; Zeng and Liu, 2023a; Zeng and Liu, 2023b). Therefore, it is necessary to explore the interaction between particle shape and particle breakage and analyze their combined effects on the mechanical behavior of coral sand for better foundation designs in offshore and ocean engineering.
Many studies have been conducted to investigate the influence of particle breakage on the mechanical properties and shape evolution of breakable granular materials. The main research methods for this topic involve element tests and numerical analyses via the discrete element method (DEM). Most of these tests (Lade and Yamamuro, 1996; Luzzani and Coop, 2002; Jia et al., 2017; Wei et al., 2018; Yu, 2018; Liu et al., 2020; Zeng and Liu, 2023c) and simulations (Alaei and Mahboubi, 2012; De Bono and McDowell, 2014; Zhou et al., 2015; Xu et al., 2017; Zhou et al., 2017; Zhang et al., 2020; Fang et al., 2021; Liu et al., 2021) have focused on the influence of particle breakage on mechanical properties. Yu (2017) conducted a series of drained shear tests on coral sand and found that particle breakage resulted in a reduction in the peak friction angle and dilatancy angle. Fang et al. (2022b) performed DEM simulations on realistic particle shape models and found that particle breakage caused a decrease in dilatancy and an increase in coaxiality. There have been relatively few studies on the effect of particle breakage on particle shape evolution (Zhang et al., 2018; Zhu and Zhao, 2021; Li et al., 2022; Wu et al., 2022). Xiao et al. (2022) reported that the aspect ratio, sphericity, and roundness of carbonate sand increased with increasing particle breakage under impact loading, whereas convexity was not sensitive to particle breakage. Bisht and Das (2021) carried out a two-dimensional (2D) DEM simulation on circular crushable granular materials, and the results showed that crushing of circular particles enhanced the formation of elongated particles and that the particle shape, in terms of sphericity, was related to breakage.
In addition, the particle shape of the coral sand is irregular, and the shapes of the coral sand particles differ considerably. The particle shape also has a significant effect on the mechanical properties and particle breakage of granular materials. Most studies on this topic have involved numerical analyses of DEM data because it is difficult to change the particle shape during element tests while ensuring that other conditions are consistent. Most of these simulations were performed on unbreakable granular particles (Kafashan et al., 2019; Zhao and Zhao, 2019; Nie et al., 2020; Zhang et al., 2020; Zhang et al., 2020; Lai et al., 2021; Liu et al., 2021; Wu et al., 2021; Xu et al., 2021). Using 3D DEM simulation, Xu et al. (2021) reported that the shear strength and dilation of granular material increase with increasing irregularity and elongation. Nie et al. (2020) reported that the shear strength generally decreased and that the volumetric strain linearly and monotonically decreased with increasing roundness. Some studies found that the particle shape had significant effects on the critical state of granular materials (Nguyen et al., 2020; Nguyen et al., 2021; Nie et al., 2022). Nevertheless, relatively few studies have evaluated the effect of particle shape on the mechanical behavior and breakage of breakable granular particles (Seyedi Hosseininia and Mirghasemi, 2006; Ueda et al., 2013; Zhang et al., 2020; Fang et al., 2022a; Wu and Wang, 2023). Fang et al. (2022a) investigated the effect of elongation and flatness on the shear behavior of breakable granular materials using the DEM and found that more elongated or flattened particles are more likely to break under the same total energy input. Wu and Wang (2023) conducted an in situ μCT triaxial test on a miniature sand specimen and found that larger grains with lower values of sphericity and convexity are prone to breakage, with the angularities of the crushed particles closely related to their mother particles.
Overall, previous studies have demonstrated that particle shape and particle breakage significantly influence the mechanical behaviors of granular materials and that they affect each other. However, studies comprehensively involving the interaction between particle shape and particle breakage and their combined effects on the mechanical behavior of granular materials are rare. Furthermore, irregular granular assemblies, especially coral sand particles, are often accompanied by inherent anisotropy phenomena during application (Oda, 1972; Arthur et al., 1977; Oda et al., 1978; Nakata et al., 1999; Yoshimine et al., 1998; Uthayakumar and Vaid, 1998; Guo et al., 2022; Zeng and Liu, 2023b). The effect of inherent anisotropy on the interaction between particle shape and particle breakage is nonnegligible but has rarely been studied.
Therefore, to investigate the interaction between the particle shape and particle breakage of coral sand and promote research on breakable granular materials, in this study, a series of biaxial tests was conducted on eight agglomerates of different shapes via 2D DEM simulation. The particle shape included a two-dimensional projection of actual coral sand particles and seven ideal geometric shapes, and different confining pressures, axial strains, bond strengths and depositional angles (inherent anisotropy) were considered. Then, the influence of particle shape, particle breakage and inherent anisotropy on the micro- and micromechanical behavior of granular assemblies was analyzed. Finally, the interaction between the particle shape and particle breakage was investigated from several perspectives. We hope that the findings in this paper will be helpful for studying coral sand particle breakage.
2 Discrete element simulations
In this paper, the software PFC2D (Itasca Consulting Group Inc, 2008), which is one of the most widely used DEM codes, was used to perform the numerical simulations. The contact models used were the linear model (Cundall and Strack, 1979) and the linear parallel bond model (Holt et al., 2005), which were used to model the intercontact between crushable agglomerates and the interaction between crushable agglomerates, respectively. The specific numerical simulation process is as follows.
2.1 Crushable agglomerate modeling
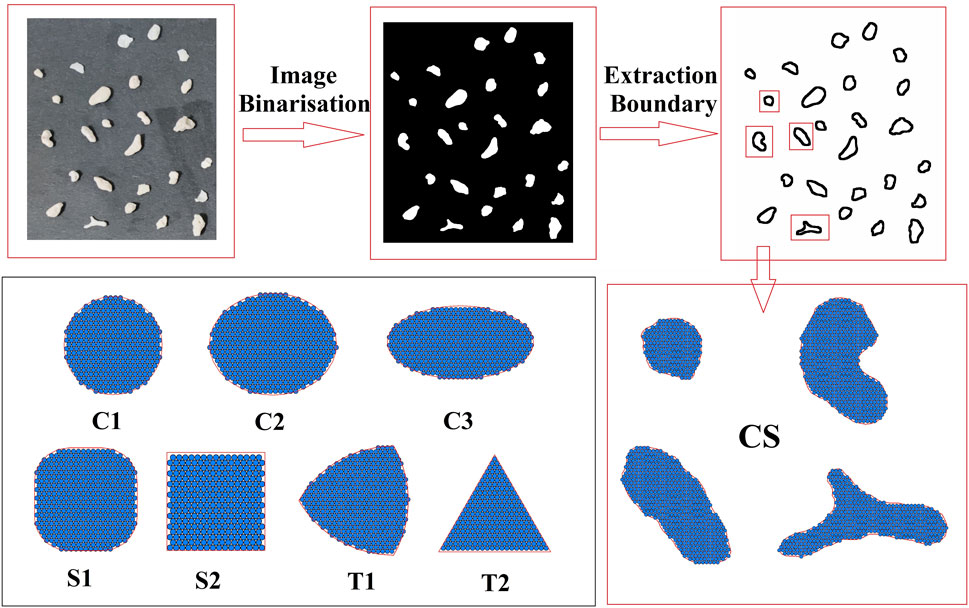
This study utilized eight distinct agglomerate shapes as research subjects. The first one, denoted as CS, was obtained from a two-dimensional projection of actual coral sand particles. The process for acquiring these projections is illustrated in Figure 1. First, photographs of the coral sand particles were taken using a smartphone, which proved to be adequate for this purpose. It was crucial to ensure that the particles did not overlap in the images to simplify the subsequent image processing. Next, the images were transformed into two-dimensional projections of the coral sand particles, and we utilized image binarization via the ImageJ program (Schneider et al., 2012) to complete this step. Following the image binarization, additional processing steps were performed, including noise removal, hole filling, and boundary extraction. Finally, the geometry files were generated using the particle boundary coordinates, and these files can be accessed from the corresponding author upon reasonable request. The other seven were ideal geometric shapes, as illustrated in Figure 1. C1 is the circle, and C2 and C3 are the ellipses with aspect ratios of 0.8 and 0.5, respectively. S1 and S2 are square-like and square, respectively. T1 and T2 are the Reuleaux triangle and equilateral triangle, respectively. The model parameters of the seven agglomerates with ideal geometric shapes were the same as those of actual coral sand (CS), and they were employed to analyze the influence of the initial particle shape.
Furthermore, the bonded agglomerate method (Cheng et al., 2003) was employed to generate crushable agglomerates in this study. In this method, crushable agglomerates are composed of many balls bonded together by breakable bonds. The crushable agglomerates were made by generating elementary balls in geometric shapes, and hexagonal close packing was adopted to avoid overlapping the elementary balls. Considering the simulation accuracy and computational efficiency, the radius of the elementary ball was set to 0.2 mm.
2.2 Particle size and shape distribution acquisition
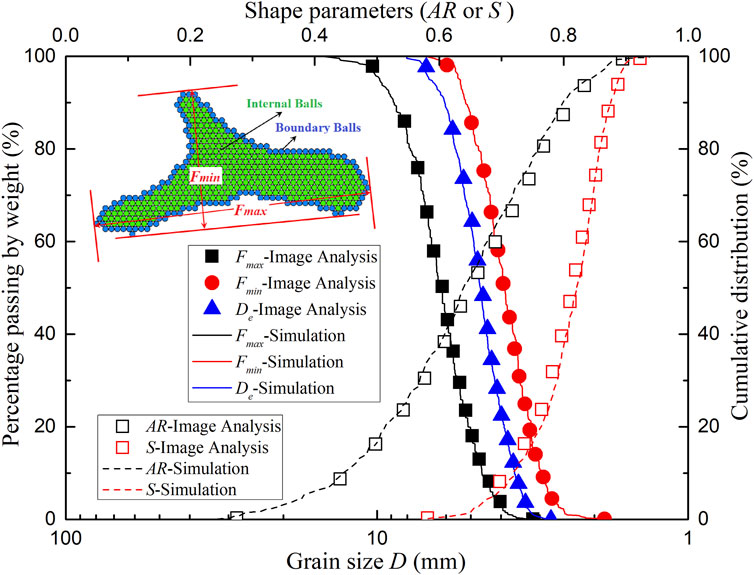
Three particle size parameters (i.e., maximum Feret diameter Fmax, minimum Feret diameter Fmin, and equivalent diameter De) and two shape parameters (i.e., aspect ratio AR and sphericity S) proposed by Altuhafi et al. (2013) were employed to describe the grain characteristics in this study. Tracking the evolution of particle size and shape is one of the most difficult tasks in actual tests. However, this can be easily achieved in DEM simulations. The acquisition methods used to determine the particle size and shape distributions before and after breakage in the simulation are as follows.
To obtain the particle size and shape distributions, one must first identify the fragments. In this study, Warshell’s algorithm (Warshall, 1962) was applied to identify the fragments, the elementary particles were deemed vertices, parallel bonds were deemed edges, and each intact agglomerate was deemed a contacted graph. If an agglomerate splits into several fragments, then each fragment is deemed a maximal connected subgraph. The specific stages of identifying fragments by Warshell’s algorithm can be found in previous studies (Laufer, 2015; Liu et al., 2017). After the fragments were identified, the boundary balls of each fragment needed to be identified. Due to the arrangement of the elementary balls as hexagonal close packs, balls with fewer than six parallel bonds are regarded as boundary balls, as shown in Figure 2. Finally, the geometrical information, including the area, perimeter, particle size and shape of each fragment, can be obtained from the coordinates of the boundary balls. Arranging the boundary balls clockwise, area A can be calculated by Eq. 1.
Herein, n is the number of boundary balls, and x and y are their coordinates. The perimeter C is simply noted as 0.02n. The maximum Feret diameter Fmax is the maximum distance between boundary balls. From the direction of Fmax, the plane is divided into 12 directions at 15° intervals. The maximum projection of the distance between the boundary balls in this direction is considered the diameter in this direction, of which the minimum value is the minimum Feret diameter Fmin. The equivalent diameter De is
2.3 Biaxial test procedures
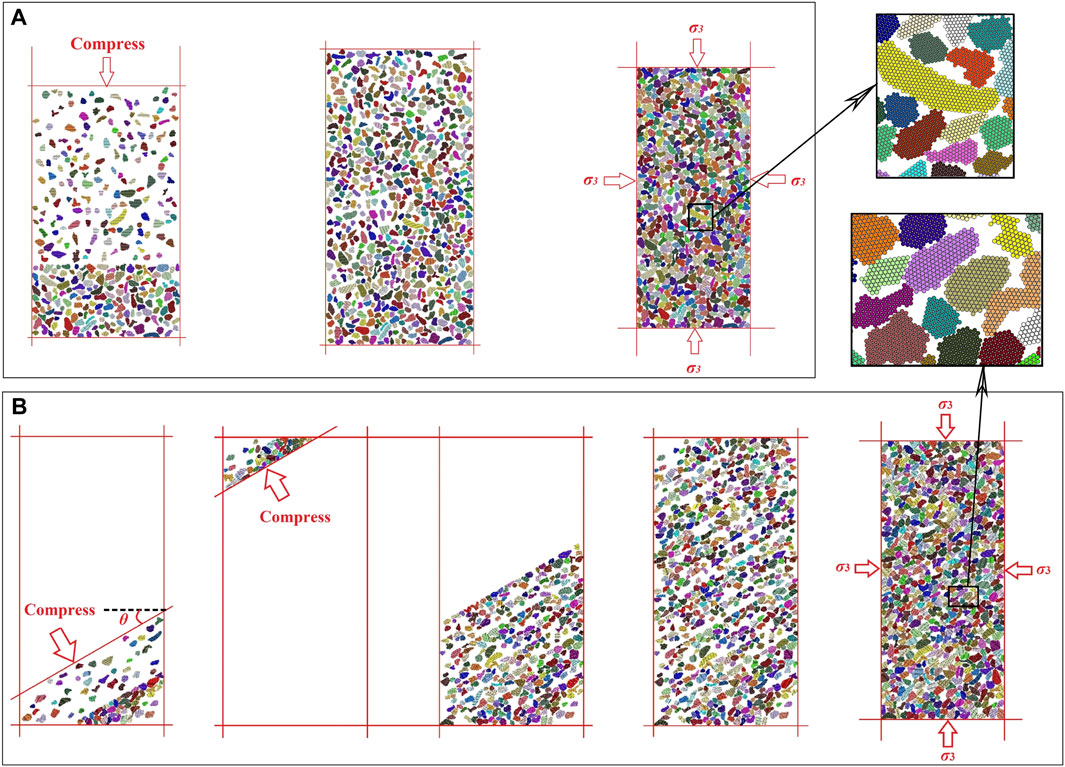
There are two methods of specimen generation in this study, both of which ignore gravity. Method A corresponds to the laboratory tests and is shown in Figure 3A. In method A, the specimens are generated by four-layer compaction to simulate the actual layered filling. The crushable agglomerates were generated in random directions and compressed by a frictionless wall to the target position. Method B is used to generate the anisotropic specimens and is shown in Figure 3B. To increase the anisotropy of the specimens, the specimens are generated by sixteen-layer compaction in Method B. The crushable agglomerates were generated at a preset angle θ and compressed by a frictionless and inclined wall toward the target position. After half of the specimen was generated, it was removed from the mold to make space for the other half to be generated. After all the crushable agglomerates were created, the plants were returned to their original position. The initial width and height of the specimens are the same as those of the actual specimens and are 101 mm and 200 mm, respectively. To exclude specimen size effects and minimize stress nonuniformities inside a test assembly, the ratio of specimen size to maximum particle size should be greater than 5 (Jamiolkowski et al., 2004; Nie et al., 2020). In this study, the ratio is approximately 10. The number of crushable agglomerates was determined by the initial void ratio n2D of the specimen and was 673 in this study. The total number of elementary balls was 76,636, and the number of elementary balls for a single crushable agglomerate was between 110 and 120. The initial two-dimensional porosity n2D represents the porosity between the agglomerates, excluding the pores within the agglomerates. The results can be converted from the actual three-dimensional porosity n3D (Hoomans et al., 1996) by Eq. 2. The initial two-dimensional porosity was 0.464 for all the specimens in this study.
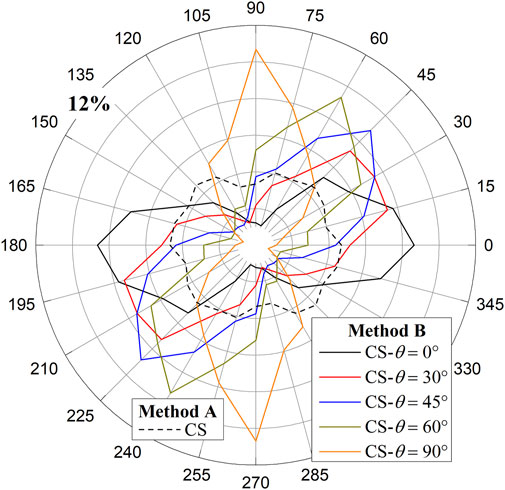
After the specimen was created, it was isotropically compressed by four frictionless walls to a given confining pressure, and the confining pressure was set to 100, 300, 600 and 1000 kPa, consistent with the laboratory tests. A servo algorithm was employed to ensure that this process was stable and controllable. In this stage, the parallel bond strength was set to a relatively high value of 2×10¹² N/m2 to ensure that no bond breakage occurred during isotropic compression. A similar approach was adopted in previous studies (Cheng et al., 2003; Liu et al., 2017). The specimens were considered in equilibrium when the stress tolerance was less than 0.1% and the ratio of the average static unbalanced force to the average contact force was less than 1×10⁻⁴. The specimens after isotropic compression are shown in Figure 3A, B. Notably, the maximum and minimum void ratios, as determined by the method proposed by Yang et al. (2012), varied among the eight different shapes of agglomerate samples, resulting in different initial relative densities for each shape. However, after isotropic compression, their relative densities became similar, ranging from 42% to 46%, due to differences in compressibility. Figure 4 shows the agglomerate orientation distribution of the CS after isotropic compression under a 300 kPa confining pressure, with similar results for other confining pressures. For the specimen created by Method A, the number of agglomerates along the horizontal direction is slightly greater than that along the vertical direction because the direction of compression is vertical. For the specimen created by method B, the inherent anisotropy of the specimens is significant, and most of the agglomerate orientations are close to the preset angle.
After isotropic compression, the normal and shear parallel bond strengths between the elementary balls are reduced to predetermined values. To ensure that the confining pressure on the left and right sides of the specimens was nearly constant during shearing, the servo control on the left and right walls remained unchanged. Subsequently, the servo control on the bottom and top walls was removed, and the specimens were sheared by moving the bottom and top walls toward each other at a constant velocity of 0.1 m/s. In addition, the index Iuf proposed by Ng (Ng, 2006) was employed to estimate whether the specimens were in a quasistatic condition during simulation. The results show that the value of Iuf is less than 1.0%, and the simulation in this study can be considered quasistatic (Fu et al., 2019).
It is noteworthy that the rigid boundaries were adopted in this study. Previous studies have indicated that numerical specimens with flexible boundaries are more representative because the boundary effect is minimized. However, the flexible boundaries were unstable and easily distorted at high confining pressures due to the high breakability and compressibility of the coral sand. Furthermore, we found that the stress‒strain relationship obtained using rigid and flexible boundaries are close to each other at low confining pressures. Our study’s objective was also not to simulate the mechanical response of coral sand under triaxial stress states. Therefore, we believe that the rigid boundary is available.
2.4 Model parameter determination
The variability of crushable agglomerates was also investigated by single-particle compression tests. The procedure of single-particle compression simulation was as follows: first, the long axis of the geometric shape was rotated to the horizontal orientation to ensure that the loading conditions were consistent with those of the laboratory tests, and the elementary balls were generated within the geometric shape. Then, the top and bottom walls were generated as rigid compression platens. Finally, compression was performed by moving the top platen downward at a fixed velocity of 0.1 m/s until particle breakage occurred.
Figure 5A shows the survival distribution curve of single-particle crushing from simulations and laboratory tests, and the fracture strengths of these agglomerates were analyzed using Weibull’s distribution (Nakata et al., 1999) by Eq. 3.
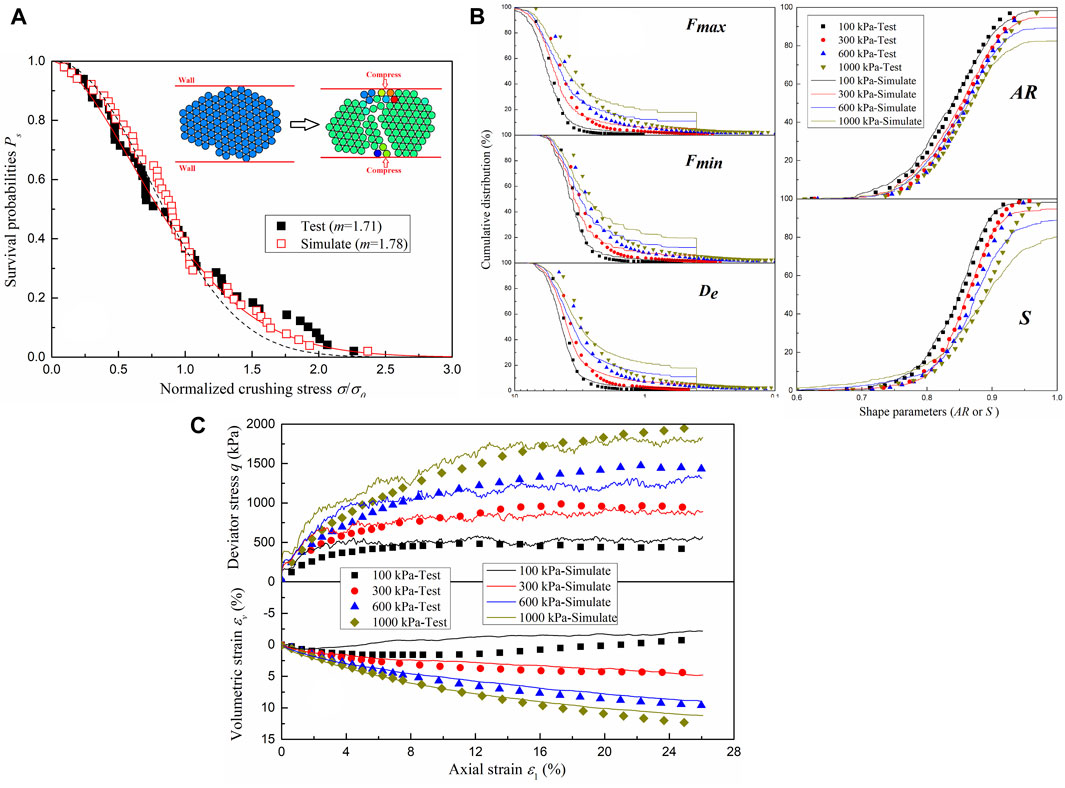
FIGURE 5. Comparison between the DEM simulation and the laboratory test results for the CS. (A) Deviator stress‒axial strain–volumetric strain relationships (B) Single-particle compression tests, and (C) Particle-size and shape distributions after the tests.
Herein, Ps is the survival probability of 50 agglomerates and can be calculated by Eq. 4.
Here, i is the rank position of an agglomerate when sorted in increasing order of equivalent stress, and N is the number of agglomerates, which is 50 in this study. σ is the induced tensile stress, σ0 is the characteristic tensile stress at which 37% of the tested particles survive, and m is the Weibull modulus. The Weibull moduli of the simulation and laboratory test are similar. This means that the variability of crushable agglomerates is close to that of actual coral sand. Furthermore, the particle strength was mainly controlled by the normal and shear parallel bond strengths, and increased with increasing the bond strengths. However, the bond strengths could not be determined by the single-particle compression tests due to the difference between the 2D DEM simulation and 3D actual test. Due to the objective of this study being to analyze the interaction between particle shape and particle breakage, the bond strengths of this study were adjusted until the particle size and shape distributions after the simulation were closed to that after the laboratory tests, as shown in Figure 5B. In this situation, the characteristic tensile stress σ0 of these breakable agglomerates was 61.52 MPa, which was approximately 4 times to that of actual coral particles (15.07 MPa).
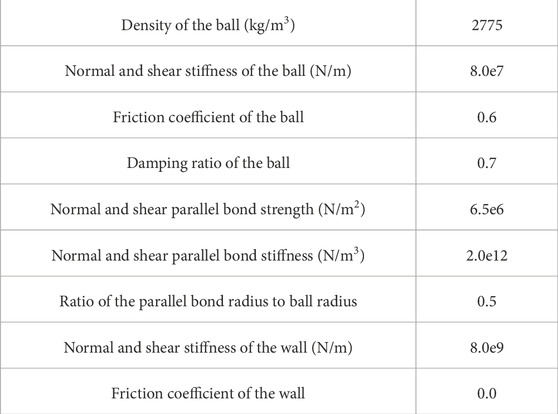
In addition, the other parameters, including the friction coefficient, normal and shear parallel bond stiffness, normal and shear stiffness of balls, were determined by the triaxial consolidated-drained tests. In previous studies, the parameters of most biaxial test models were determined by referencing classical studies (Zhou et al., 2017; Fu et al., 2019; Lü et al., 2019; Zhang et al., 2020; Bisht and Das, 2021; Wu et al., 2021). However, since this study focused on coral sand, these classical parameters were clearly inapplicable, necessitating the redetermination of model parameters. The biaxial test is difficult to perform in the laboratory; therefore, the triaxial test is commonly employed to determine the parameters of biaxial test models (Alaei and Mahboubi, 2012; Liu et al., 2017; Zhou et al., 2023), as its stress state closely resembles that of the biaxial test among all laboratory tests. In addition, our study’s objective was not to simulate the mechanical response of coral sand under triaxial stress states. Instead, we aimed to derive appropriate parameters for analyzing the interaction between particle shape and particle breakage. For this purpose, laboratory triaxial consolidated-drained tests (Zeng and Liu, 2023c) were taken as the benchmark. A comparison between the DEM simulation and the laboratory test results is shown in Figure 5C, and the model parameters of the crushable agglomerates and walls used in this study can be found in Table 2.
These findings indicate that these model parameters can be used to analyze the interaction between the particle shape and particle breakage. In addition, the simulation schemes are given in Table 3, and the subsequent analysis is based on these simulation results. Notably, the eight different shapes of agglomerates exhibited the same parameters, as presented in Table 2. The variation in the normal and shear parallel bond strengths was used to analyze the influence of particle breakage on the macro- and micromechanical behavior of coral sand.
3 Stress‒strain relationship
In this section, the analysis focuses on the influences of the particle shape, bond strength and deposition angle on the deviator stress‒axial strain–volumetric strain relationships. Considering space restrictions, some results are not presented, but their particle breakage results are analyzed in the following section.
3.1 Effect of the particle shape
Figures 6A, B show the deviator stress‒axial strain‒volumetric strain relationships of different particle shapes under 300 kPa confining pressure for both the unbreakable and breakable particulate assemblies. The relative density before shearing varied between 43% and 45%, and the effect of the relative density was basically negligible in this analysis. Figure 6A shows that as the aspect ratio AR and sphericity S decrease, the peak deviator stress and dilation of unbreakable agglomerates increase. This phenomenon is consistent with the findings of previous studies (Lashkari et al., 2020; Nie et al., 2020; Wu et al., 2021; Xu et al., 2021). Wu et al. (2021) and Nie et al. (2020) reported that a lower particle roundness results in a higher deviatoric stress and greater dilation during volumetric change. Nguyen et al. (2020, 2021) found that the peak drained deviatoric stress and the minimum dilatancy increased with decreasing sphericity and roundness. Nie et al. (2022) reported that with the increasing of particle overall regularity, the compressibility of the sands slightly changes, while the shear strength, stress dilatancy decrease. Figure 6B shows that the peak deviator stress and dilation of breakable agglomerates are lower than those of unbreakable agglomerates, and a similar phenomenon can be found in Figures 8A, B. This means that particle breakage leads to a reduction in strength and an increase in compressibility. In addition, Figure 6B also shows that the peak deviator stresses of breakable agglomerates with different particle shapes are similar, and the irregular agglomerates have greater compressibility than the smooth agglomerates. Furthermore, Figure 6C shows the internal friction angle φ of unbreakable agglomerates and breakable agglomerates. The internal friction angle φ was calculated by sinφ = qf/(qf+2σ3), where qf is the peak deviator stress. φnb, φb and Δφ are the internal friction angles of unbreakable and breakable agglomerates and their differences, respectively. Both φnb and Δφ also decrease with increasing aspect ratio AR50 and sphericity S50, and the influence of sphericity is greater. A similar behavior was also reported in previous studies, where the internal friction angles of unbreakable agglomerates decreased with increasing roundness (Nie et al., 2020) and aspect ratio (Liu et al., 2021). In addition, the particle shape has a small influence on φnb. The reason may be that irregular agglomerates are more easily broken, and particle breakage weakens the effect of particle shape on shear strength.
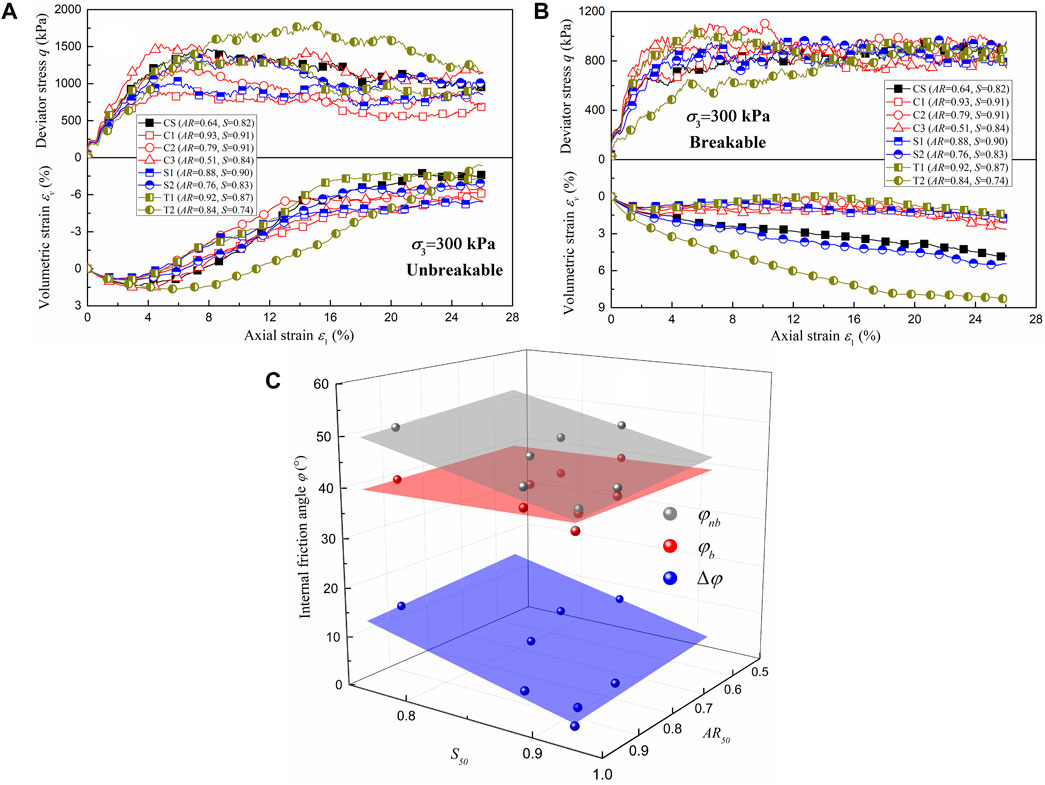
FIGURE 6. Deviator stress‒axial strain–volumetric strain relationships for different particle shapes. (A) Unbreakable (B) Breakable, and (C) Internal friction angle.
3.2 Effect of bond strength
Figure 7A shows the deviator stress‒axial strain–volumetric strain relationships of CS with different bond strengths under a 300 kPa confining pressure. The normal and shear parallel bond strengths are the same and are denoted Bs in this study. The bond strength can reflect the fragility of the agglomerates. The higher the bond strength is, the more difficult it is for the agglomerates to break. As shown in Figure 7A, the agglomerates exhibit evident softening and dilation phenomena under high bond strength. With decreasing bond strength, the particle breakage increases, the dilation gradually disappears, and the peak deviator stress gradually decreases. However, the bond strength has a small influence on the ultimate deviator stress. In addition, Figure 7B shows an approximately linear relationship between the internal friction angle and the bond strength in semilogarithmic coordinates when the agglomerates are breakable.
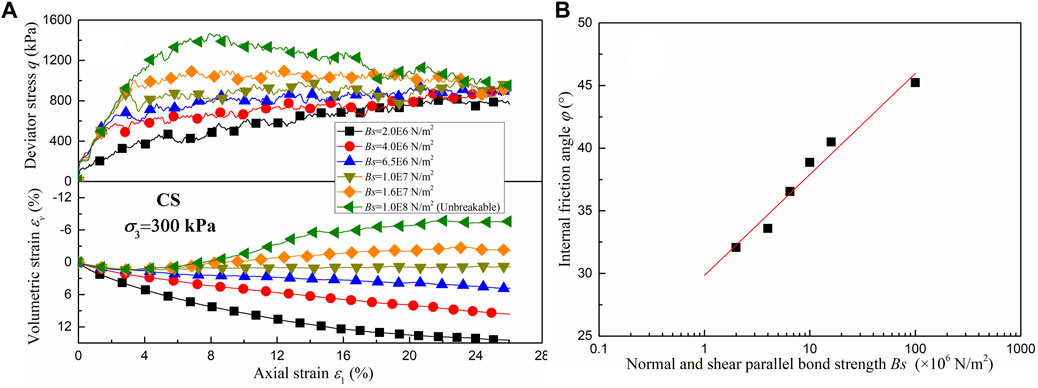
FIGURE 7. Effect of the bond strength. (A) Deviator stress‒axial strain–volumetric strain relationships and (B) Internal friction angle.
3.3 Effect of depositional angle
In this subsection, only agglomerates CS and C3 were considered due to their smaller aspect ratio and significant inherent anisotropy. Figures 8A, B show the deviator stress‒axial strain–volumetric strain relationships of CS with different depositional angles under 300 kPa confining pressure for both the unbreakable and breakable particulate assemblies. The inherent anisotropy (depositional angle) has a significant effect on the strength and deformation of the agglomerate CS regardless of whether it is unbreakable or breakable. The peak deviator stress of both unbreakable and breakable agglomerates decreases with increasing depositional angle. The compressibility of unbreakable agglomerates is greater at low depositional angles, but that of breakable agglomerates is greater at high depositional angles. The reason is that aggregates are more easily broken at low deposition angles. Additionally, the anisotropy phenomenon of breakable CS agglomerates is less obvious than that of unbreakable CS agglomerates. A similar trend can be found for C3. Figure 8C shows the relationship between the internal friction angle and depositional angle. The internal friction angle decreases with increasing depositional angle, and this phenomenon is consistent with the findings of previous laboratory tests (Oda, 1972; Zeng and Liu, 2023b) and DEM simulation (Guo et al., 2022). The difference between the 0° and 90° internal friction angles of unbreakable agglomerates is greater than that of breakable agglomerates. This means that particle breakage weakens the effect of inherent anisotropy (depositional angle) on shear strength.
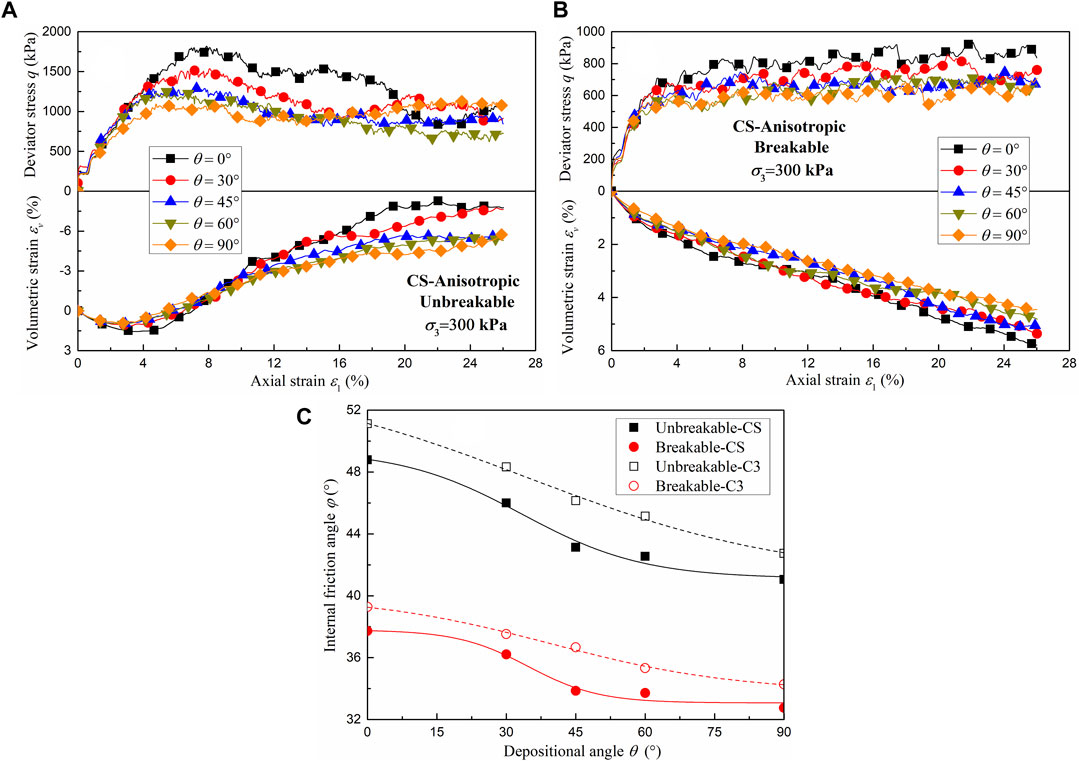
FIGURE 8. Deviator stress‒axial strain–volumetric strain relationships for different deposition angles. (A) Unbreakable CS (B) Breakable CS, and (C) Relationship between the internal friction angle and depositional angle.
4 Interaction between particle shape and particle breakage
4.1 Evolution of particle breakage
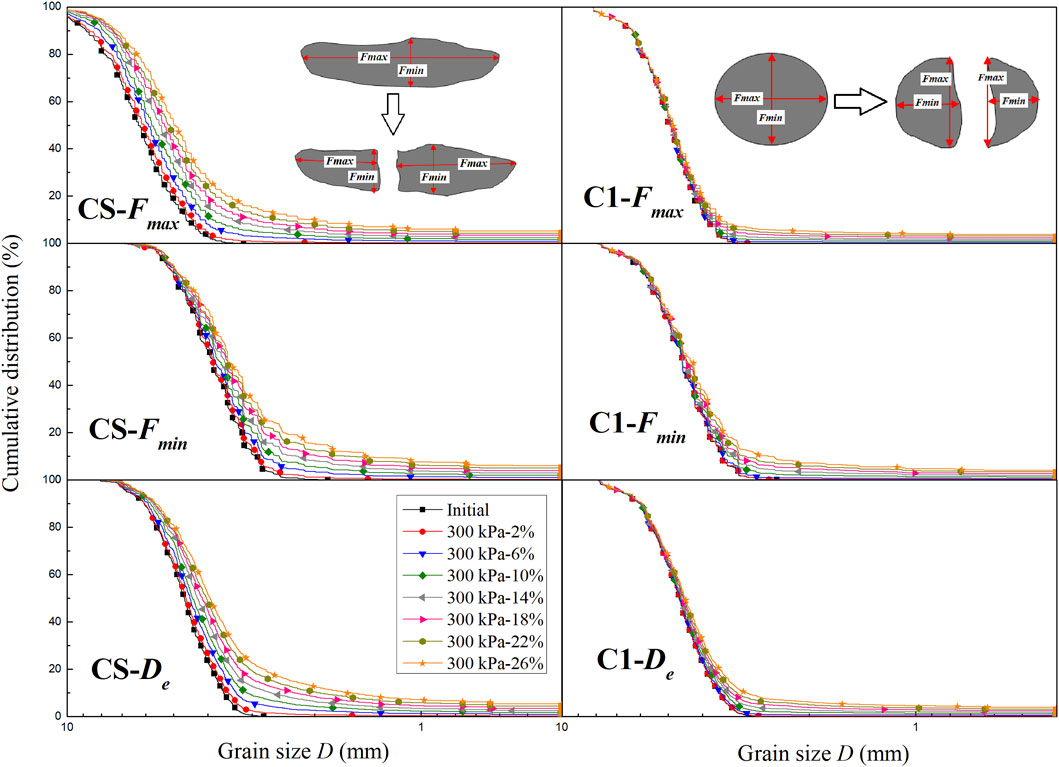
Figure 9 shows the particle size distribution curves of agglomerates CS and C1 at different axial strains, including the maximum Feret diameter Fmax, minimum Feret diameter Fmin and equivalent diameter De. Considering space restrictions, other results are not given in this paper, but their trends are briefly explained. As shown in Figure 9, the particle size distribution curves of agglomerates CS and C1 change significantly during the simulation tests. The degree of variation increases with increasing axial strain, and the variation in the irregular CS agglomerates is greater than that in the regular C1 agglomerates. Furthermore, other results show that the degree of variation increases with increasing confining pressure but decreases with increasing bond strength and depositional angle, and the variation in regular agglomerates decreases. In addition, for the irregular CS agglomerates, the variation in Fmax is greater than that in Fmin. However, in contrast to that of CS, the Fmax of regular C1 agglomerates varied more significantly. For irregular agglomerates, particle breakage is more likely to occur in the direction of Fmax. In this situation, the minimum Feret diameter Fmin of the fragments is similar to that of the original agglomerate, but the maximum Feret diameter Fmax decreases significantly. However, for the regular agglomerates, the maximum and minimum Feret diameters are close. When particle breakage occurs, the particle size that differs most between the fragment and the original agglomerate is the minimum Feret diameter Fmin, as shown in Figure 9.
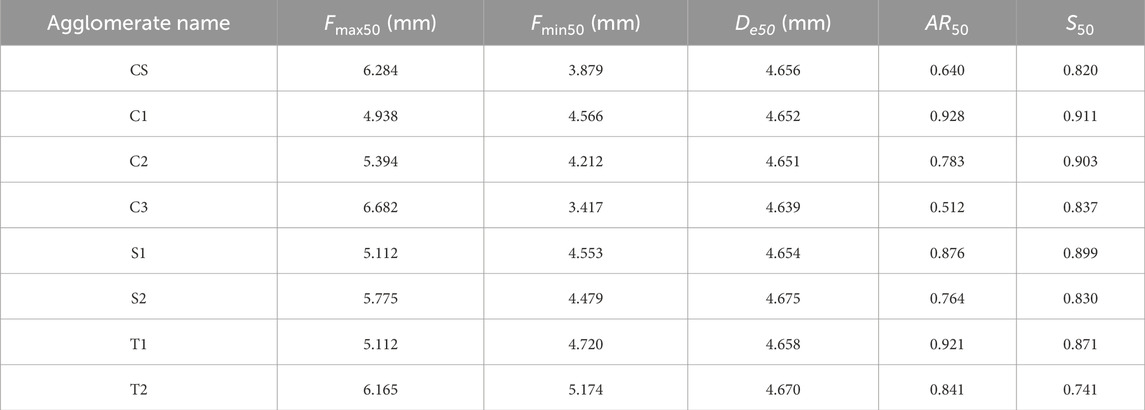
The relative breakage Br proposed by Hardin (1985) is used to quantify the particle breakage, and it was calculated by Fmax, Fmin and De in this study. Figure 10A shows the comparison between BrFmin or BrDe and BrFmax for eight different agglomerates, and the results for different confining pressures, axial strains, bond strengths and depositional angles were considered. Notably, there is an approximately linear relationship between the relative breakage Br calculated by Fmax, Fmin, and De, regardless of the agglomerate shape, and the slope is related to the aspect ratio AR50 and sphericity S50. In this study, the slopes kmm and kem of BrFmin-BrFmax and BrDe-BrFmax can be estimated by Eq. 5 and Eq. 6.
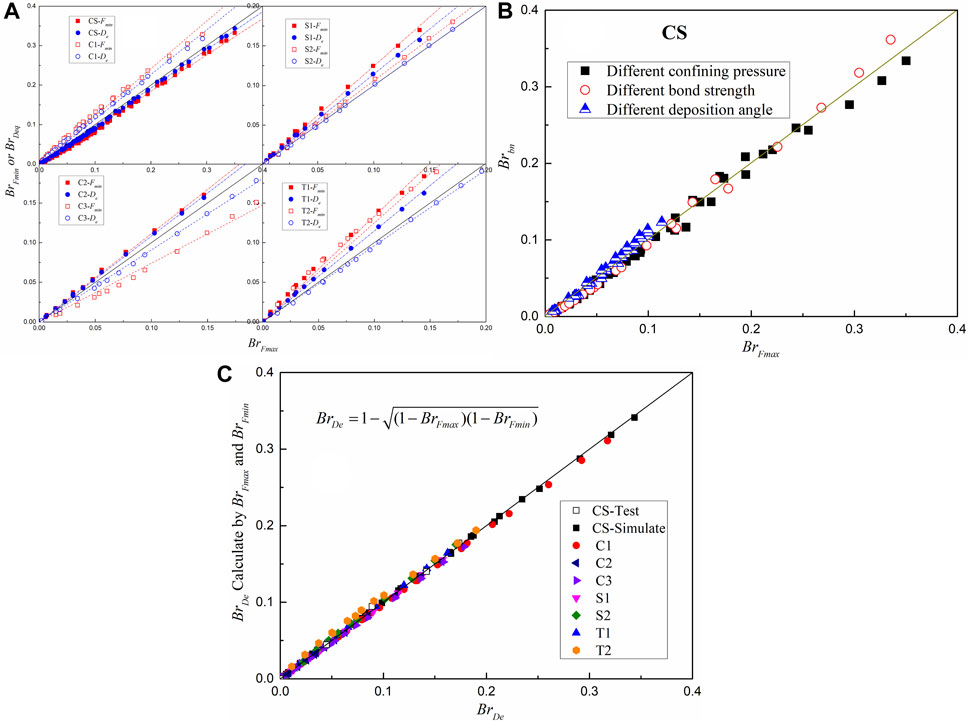
FIGURE 10. Comparison between different relative breakage factors. (A)Relationship between BrFmin or BrDe and BrFmax (B)Relationship between Brbn and BrFmax, and (C)Relationship between BrFm and BrDe.
Herein, AR50 and S50 are the initial AR and S corresponding to a 50% content, respectively.
Figure 10B shows the relationship between Brbn and BrFmax. Brbn is the relative breakage calculated from the number of broken parallel bonds by Eq. 7.
Herein, Nbroken is the number of broken parallel bonds, and Nall is the number of parallel bonds without particle breakage. Brbn and BrFmax are approximately equal for the CS agglomerates. In addition, Figure 10C indicates that BrDe can be estimated by BrFmin and BrFmax, and their relationship is Eq. 8.
For the simulation tests, the input energy per unit volume E from the start of the test (SOT) to the end of the test (EOT) can be expressed by Eq. 9.
where σ1 and σ3 are the major and minor effective principal stresses, respectively, and dε1 and dεv are the axial strain and volumetric strain increments, respectively. The isotropic compression process was also considered in the analyses, and a confining pressure of 10 kPa was used as the initial condition. Although the agglomerates were unbreakable during isotropic compression, the breakage caused by the reduction in bond strength before shearing can be regarded as particle breakage during isotropic compression. As shown in Figures 11A, B unique relationship can be established between the relative breakage BrDe and the input energy E, regardless of the axial strain and confining pressure, but this relationship is significantly influenced by the agglomerate shape and depositional angle. Under the same input energy E, the relative breakage BrDe increases with decreasing depositional angle, and the agglomerates with small aspect ratios AR and small sphericity S are more easily broken.
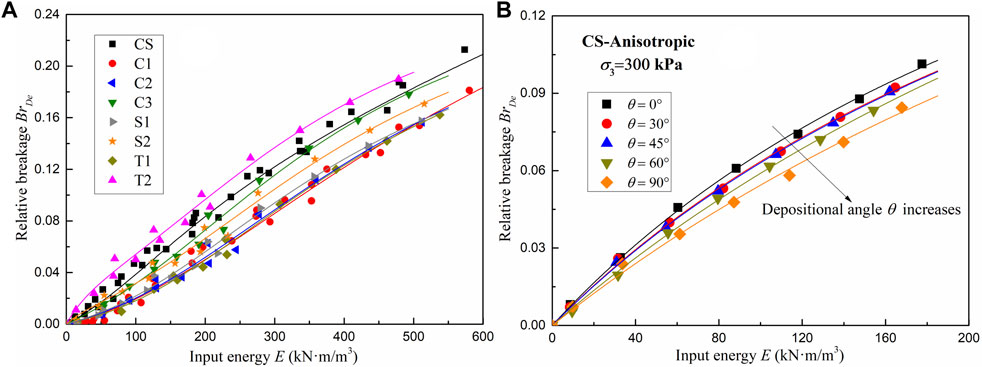
FIGURE 11. Relationship between relative breakage BrDe and input energy E. (A) Different particle shapes and (B) Different depositional angles of CS.
4.2 Evolution of the particle shape
Figure 12A shows the particle shape distribution curves of agglomerates CS and C1 at different axial strains, including the aspect ratio AR and sphericity S. Considering space restrictions, other results are not given in this paper, and the trends are similar. As shown in Figure 12A, the particle shape distribution curves of agglomerates CS and C1 also change significantly during the simulation tests. However, the trends of agglomerates CS and C1 are obviously different. For the irregular CS agglomerates, with increasing axial strain, the aspect ratio AR and sphericity S increase, and the particles become more regular. However, for the regular C1 agglomerate, the particles become more irregular with increasing axial strain.
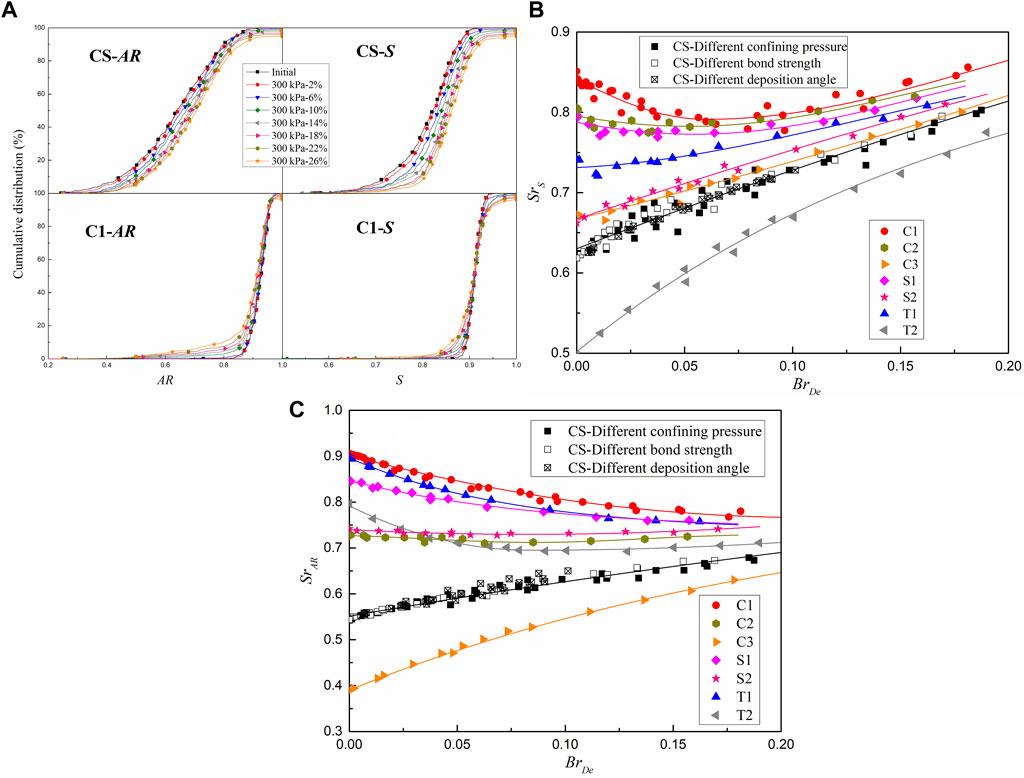
FIGURE 12. Evolution of Particle Shape. (A) Particle shape distributions of CS and C1 at different axial strains (B) Relationship between SrAR and BrDe, and (C) Relationship between SrS and BrDe.
The shape factors SrAR and SrS were employed to further analyze the evolution of the particle shape. Particles with aspect ratios less than 0.2 or sphericities less than 0.5 are basically nonexistent. Therefore, the shape factor SrAR was defined as the ratio of the area between the shape distribution curve and the vertical line with an AR of 0.2 to the area between the vertical lines with an AR of 0.2 and 1. The shape factor SrS was defined as the ratio of the area between the shape distribution curve and the vertical line with an S of 0.5 to the area between the vertical lines with an S of 0.5 and 1. A larger shape factor represents a more regular particle shape. Figures 12B,C show the evolution of SrAR and SrS during simulation, respectively. The evolution of the particle shape was controlled by the particle breakage, regardless of the axial strain, confining pressure, bond strength and depositional angle, and the trends were determined by the initial shape factors SrAR and SrS. The shape factor SrAR gradually tends to 0.7 with increasing particle breakage. The shape factor SrAR increases and decreases when the initial shape factor SrAR is less than or greater than 0.7, respectively. When the initial shape factor SrAR is close to 0.7, the shape factor SrAR changes slightly. The shape factor SrS decreases first and then increases when the initial shape factor SrS is greater than 0.75, and it has a significant increasing tendency when the initial shape factor SrS is less than 0.75.
Based on the analysis above, the interaction between the particle shape and particle breakage is highly significant. The particle shape affects the difficulty of particle breakage, and particle breakage controls the evolution of the particle shape. In addition, they have combined effects on the mechanical behavior of coral sand.
5 Conclusion
In this study, the particle breakage and shape evolution of coral sand were investigated, and a series of biaxial tests were conducted on eight different shapes of agglomerates by using 2D DEM simulation. The particle shape included a two-dimensional projection of actual coral sand particles and seven ideal geometric shapes, and the inherent anisotropy of the specimens was also considered. The main findings are summarized as follows.
(1) The particle shape, inherent anisotropy and particle breakage have significant effects on the shear strength of agglomerates. For the unbreakable agglomerates, the internal friction angles decrease with increasing aspect ratio AR, sphericity S and depositional angle θ. The internal friction angles of breakable agglomerates are significantly smaller than those of unbreakable agglomerates, and particle breakage considerably weakens the effect of particle shape and inherent anisotropy on shear strength. This may mean that the shear strength of coral sand is more influenced by breakage than by the initial shape of the particles. The difference between the internal friction angles of unbreakable and breakable agglomerates Δφ decreases with increasing aspect ratio AR, sphericity S, and depositional angle θ.
(2) There is an approximately linear relationship between the relative breakage Br calculated by Fmax, Fmin and De, regardless of the agglomerate shape, and the slope is related to the initial aspect ratio AR and sphericity S. In addition, a unique relationship can be established between the relative breakage BrDe and the input energy E, regardless of the axial strain and confining pressure, but this relationship is significantly influenced by the agglomerate shape and depositional angle. The irregular and low depositional angle specimens are more easily broken under the same input energy.
(3) The evolution of the aspect ratio AR and sphericity S of agglomerates was controlled by particle breakage, regardless of the axial strain, confining pressure, bond strength and depositional angle, and these trends were determined by the initial particle shape. With increasing particle breakage, the aspect ratio AR of agglomerates with a small initial aspect ratio and the sphericity S of agglomerates with low initial sphericity increase. However, the aspect ratio AR of agglomerates with a large initial aspect ratio decreases, while the sphericity S of agglomerates with high initial sphericity first decreases and then increases.
Overall, the simulation results and previous studies illustrated that the particle shape and inherent anisotropy had significant effects on the macro-mechanical behaviors of granular materials. Furthermore, this study introduced the effects of particle breakage, and found that the particle breakage considerably weakens the effect of particle shape and inherent anisotropy on shear strength, and the interaction between the particle shape and particle breakage is highly significant. It is hoped that the aforementioned findings could shed some light on the study of particle shape and breakage.
In addition, the interaction between the particle shape and particle breakage of coral sand was investigated via a series of biaxial 2D DEM simulation tests. The two-dimensional projection of actual coral sand particles and inherent anisotropy of the specimens were considered, and some valuable conclusions were drawn. However, these findings were based on 2D DEM simulations, and the particle interactions and breakage patterns in the two-dimensional state might be different from those in the three-dimensional state. The intraparticle pores of the coral particles were also neglected in the DEM model. More reliable results may be obtained by using new particle models considering intraparticle pores in 3D DEM simulations, and this is our future research direction.
Data availability statement
The original contributions presented in the study are included in the article/Supplementary material, further inquiries can be directed to the corresponding author.
Author contributions
XL: Writing–review and editing. KZ: Conceptualization, Methodology, Writing–original draft. FX: Methodology, Writing–review and editing. CW: Methodology, Writing–review and editing. XH: Writing–review and editing. YL: Writing–review and editing.
Funding
The author(s) declare financial support was received for the research, authorship, and/or publication of this article. This study was supported by the Xinjiang Institute of Architectural Sciences (Limited Liability Company) (No. 65000022859700210197), which is gratefully acknowledged.
Conflict of interest
The authors XL, XH and YL were employed by “Xinjiang Institute of Architectural Sciences (Limited Liability Company)”.
The remaining authors declare that the research was conducted in the absence of any commercial or financial relationships that could be construed as a potential conflict of interest.
The authors declare that this study received funding from “Xinjiang Institute of Architectural Sciences (Limited Liability Company)”. The funder had the following involvement in the study: writing of the article.
Publisher’s note
All claims expressed in this article are solely those of the authors and do not necessarily represent those of their affiliated organizations, or those of the publisher, the editors and the reviewers. Any product that may be evaluated in this article, or claim that may be made by its manufacturer, is not guaranteed or endorsed by the publisher.
References
Alaei, E., and Mahboubi, A. (2012). A discrete model for simulating shear strength and deformation behaviour of rockfill material, considering the particle breakage phenomenon. Granul. Matter 14, 707–717. doi:10.1007/s10035-012-0367-7
Altuhafi, F., O’Sullivan, C., and Cavarretta, I. (2013). Analysis of an image-based method to quantify the size and shape of sand particles. J. Geotech. Geoenviron. Eng. 139, 1290–1307. doi:10.1061/(ASCE)GT.1943-5606.0000855
Arthur, J. R. F., Chua, K. S., and Dunstan, T. (1977). Induced anisotropy in a sand. Geotechnique 27, 13–30. doi:10.1680/geot.1977.27.1.13
Bisht, M. S., and Das, A. (2021). DEM study on particle shape evolution during crushing of granular materials. Int. J. Geomech. 21, 04021101. doi:10.1061/(ASCE)GM.1943-5622.0002067
Cheng, Y. P., Nakata, Y., and Bolton, M. D. (2003). Discrete element simulation of crushable soil. Geotechnique 53, 633–641. doi:10.1680/geot.2003.53.7.633
Cundall, P. A., and Strack, O. D. (1979). A discrete numerical model for granular assemblies. Geotechnique 29, 47–65. doi:10.1680/geot.1979.29.1.47
De Bono, J. P., and McDowell, G. R. (2014). DEM of triaxial tests on crushable sand. Granul. Matter 16, 551–562. doi:10.1007/s10035-014-0500-x
Fang, C., Gong, J., Jia, M., Nie, Z., Hu, W., and Li, B. (2022b). Effect of the intermediate principal stress on the mechanical behaviour of breakable granular materials using realistic particle models. Acta Geotech. 17, 4887–4904. doi:10.1007/s11440-022-01566-w
Fang, C., Gong, J., Jia, M., Nie, Z., Li, B., and Mohammed, A. (2022a). Investigating the effects of elongation and flatness on the shear behaviour of breakable granular materials via the DEM. Granul. Matter 24, 78. doi:10.1007/s10035-022-01237-3
Fang, C., Gong, J., Nie, Z., Li, B., and Li, X. (2021). DEM study on the microscale and macroscale shear behaviours of granular materials with breakable and irregularly shaped particles. Comput. Geotech. 137, 104271. doi:10.1016/j.compgeo.2021.104271
Fu, L., Zhou, S., Guo, P., Wang, S., and Luo, Z. (2019). Induced force chain anisotropy of cohesionless granular materials during biaxial compression. Granul. Matter 21, 52. doi:10.1007/s10035-019-0899-1
Guo, N., Yang, F., Yang, Z. X., and Zhao, S. (2022). Deformation characteristics of inherently anisotropic granular media under repeated traffic loading: a DEM study. Acta Geotech. 17, 3377–3395. doi:10.1007/s11440-022-01466-z
Hardin, B. O. (1985). Crushing of soil particles. J. Geotech. Eng. 111, 1177–1192. doi:10.1061/(ASCE)0733-9410(1985)111:10(1177)
Holt, R. M., Kjølaas, J., Larsen, I., Li, L., Pillitteri, A. G., and Sønstebø, E. F. (2005). Comparison between controlled laboratory experiments and discrete particle simulations of the mechanical behaviour of rock. Int. J. Rock Mech. Min. Sci. 42, 985–995. doi:10.1016/j.ijrmms.2005.05.006
Hoomans, B. P. B., Kuipers, J. A. M., Briels, W. J., and van Swaaij, W. P. M. (1996). Discrete particle simulation of bubble and slug formation in a two-dimensional gas-fluidised bed: a hard-sphere approach. Chem. Eng. Sci. 51, 99–118. doi:10.1016/0009-2509(95)00271-5
Jamiolkowski, M., Kongsukprasert, L., and Presti, D. L. (2004). “Characterization of gravelly geomaterials,” in Proceedings of the fifth international geotechnical conference (November), New York, April 13 - 17, 2004.
Jia, Y. F., Xu, B., Chi, S. C., Xiang, B., and Zhou, Y. (2017). Research on the particle breakage of rockfill materials during triaxial tests. Int. J. Geomech. 17, 04017085. doi:10.1061/(ASCE)GM.1943-5622.0000977
Kafashan, J., Wiącek, J., Abd Rahman, N., and Gan, J. (2019). Two-dimensional particle shapes modelling for DEM simulations in engineering: a review. Granul. Matter 21, 80. doi:10.1007/s10035-019-0935-1
Lade, P. V., and Yamamuro, J. A. (1996). Undrained sand behavior in axisymmetric tests at high pressures. J. Geotech. Eng. 122, 120–129. doi:10.1061/(ASCE)0733-9410(1996)122:2(120)
Lai, Z., Zhao, S., Zhao, J., and Huang, L. (2021). Revisiting the GJK and shape erosion method for contact resolution in DEM. Powder Technol. 394, 363–371. doi:10.1016/j.powtec.2021.08.068
Lashkari, A., Falsafizadeh, S. R., Shourijeh, P. T., and Alipour, M. J. (2020). Instability of loose sand in constant volume direct simple shear tests in relation to particle shape. Acta Geotech. 15 (9), 2507–2527. doi:10.1007/s11440-019-00909-4
Laufer, I. (2015). Grain crushing and high-pressure oedometer tests simulated with the discrete element method. Granul. Matter 17, 389–412. doi:10.1007/s10035-015-0559-z
Li, X., Liu, J., and Li, J. (2022). Fractal dimension, particle shape, and particle breakage analysis for calcareous sand. Bull. Eng. Geol. Environ. 81, 106. doi:10.1007/s10064-022-02585-3
Liu, H. B., Zeng, K. F., and Zou, Y. (2020). Particle breakage of calcareous sand and its correlation with input energy. Int. J. Geomech. 20, 04019151. doi:10.1061/(ASCE)GM.1943-5622.0001541
Liu, Q., Liu, D., Tian, Y., and Liu, X. (2017). Numerical simulation of stress-strain behaviour of cemented paste backfill in triaxial compression. Eng. Geol. 231, 165–175. doi:10.1016/j.enggeo.2017.10.021
Liu, S., Nie, Z., Hu, W., Gong, J., and Lei, P. (2021). Effect of particle type on the shear behaviour of granular materials. Particuology 56, 124–131. doi:10.1016/j.partic.2020.11.001
Liu, Y., Liu, H., and Mao, H. (2017). DEM investigation of the effect of intermediate principle stress on particle breakage of granular materials. Comput. Geotech. 84, 58–67. doi:10.1016/j.compgeo.2016.11.020
Liu, Y., Xu, C., Xu, G., Mao, H., and Xiao, Z. (2021). Macro-micro mechanical behavior of crushable granular materials under generalized stress conditions. KSCE J. Civ. Eng. 25, 1634–1644. doi:10.1007/s12205-021-1035-4
Lü, X., Zeng, S., Li, L., Qian, J., and Huang, M. (2019). Two-dimensional discrete element simulation of the mechanical behavior and strain localization of anisotropic dense sands. Granul. Matter 21, 37. doi:10.1007/s10035-019-0891-9
Luzzani, L., and Coop, M. R. (2002). On the relationship between particle breakage and the critical state of sands. Soils Found. 42, 71–82. doi:10.3208/sandf.42.2_71
Nakata, Y., Hyde, A. F. L., Hyodo, M., and Murata, H. (1999). A probabilistic approach to sand particle crushing in the triaxial test. Geotechnique 49, 567–583. doi:10.1680/geot.1999.49.5.567
Ng, T. T. (2006). Input parameters of discrete element methods. J. Eng. Mech. 132, 723–729. doi:10.1061/(ASCE)0733-9399(2006)132:7(723)
Nguyen, H. B. K., Rahman, M. M., and Fourie, A. B. (2020). Effect of particle shape on constitutive relation: DEM study. J. Geotechnical Geoenvironmental Eng. 146 (7), 04020058. doi:10.1061/(asce)gt.1943-5606.0002278
Nguyen, H. B. K., Rahman, M. M., and Fourie, A. B. (2021). How particle shape affects the critical state, triggering of instability and dilatancy of granular materials – results from a DEM study. Géotechnique 71 (9), 749–764. doi:10.1680/jgeot.18.P.211
Nie, J. Y., Zhao, J., Cui, Y.-F., and Li, D.-Q. (2022). Correlation between grain shape and critical state characteristics of uniformly graded sands: a 3D DEM study. Acta Geotech. 17 (7), 2783–2798. doi:10.1007/s11440-021-01362-y
Nie, Z., Fang, C., Gong, J., and Liang, Z. (2020). DEM study on the effect of roundness on the shear behaviour of granular materials. Comput. Geotech. 121, 103457. doi:10.1016/j.compgeo.2020.103457
Oda, M. (1972). Initial fabrics and their relations to mechanical properties of granular material. Soils Found. 12, 17–36. doi:10.3208/sandf1960.12.17
Oda, M., Koishikawa, I., and Higuchi, T. (1978). Experimental study of anisotropic shear strength of sand by plane strain test. Soils Found. 18, 25–38. doi:10.3208/sandf1972.18.25
Rui, S. J., Guo, Z., Si, T. L., and Li, Y. J. (2020). Effect of particle shape on the liquefaction resistance of calcareous sands. Soil Dyn. Earthq. Eng. 137, 106302. doi:10.1016/j.soildyn.2020.106302
Schneider, C. A., Rasband, W. S., and Eliceiri, K. W. (2012). NIH Image to ImageJ: 25 years of image analysis. Nat. Methods 9, 671–675. doi:10.1038/nmeth.2089
Seyedi Hosseininia, S., and Mirghasemi, A. A. (2006). Numerical simulation of breakage of two-dimensional polygon-shaped particles using discrete element method. Powder Technol. 166 (2), 100–112. doi:10.1016/j.powtec.2006.05.006
Ueda, T., Matsushima, T., and Yamada, Y. (2013). DEM simulation on the one-dimensional compression behavior of various shaped crushable granular materials. Granul. Matter 15, 675–684. doi:10.1007/s10035-013-0415-y
Uthayakumar, M., and Vaid, Y. P. (1998). Static liquefaction of sands under multiaxial loading. Can. Geotech. J. 35 (2), 273–283. doi:10.1139/t98-007
Wei, H. Z., Zhao, T., He, J. Q., Meng, Q. S., and Wang, X. Z. (2018). Evolution of particle breakage for calcareous sands during ring shear tests. Int. J. Geomech. 18, 04017153. doi:10.1061/(ASCE)GM.1943-5622.0001073
Wu, M., and Wang, J. (2023). Exploring particle breakage in sand under triaxial shearing using combined X-ray tomography and particle tracking method. Géotechnique, 1–16. doi:10.1680/jgeot.22.00351
Wu, M., Wang, J., and Wu, F. (2022). DEM investigations of failure mode of sands under oedometric loading. Adv. Powder Technol. 33 (6), 103599. doi:10.1016/j.apt.2022.103599
Wu, M., Xiong, L., and Wang, J. (2021). DEM study on effect of particle roundness on biaxial shearing of sand. Undergr. Space 6, 678–694. doi:10.1016/j.undsp.2021.03.006
Xiao, Y., Sun, Y., Zhou, W., Shi, J. Q., and Desai, C. S. (2022). Evolution of particle shape produced by sand breakage. Int. J. Geomech. 22, 04022003. doi:10.1061/(ASCE)GM.1943-5622.0002333
Xu, M., Hong, J., and Song, E. (2017). DEM study on the effect of particle breakage on the macro-and micro-behavior of rockfill sheared along different stress paths. Comput. Geotech. 89, 113–127. doi:10.1016/j.compgeo.2017.04.012
Xu, M. Q., Guo, N., and Yang, Z. X. (2021). Particle shape effects on the shear behaviors of granular assemblies: irregularity and elongation. Granul. Matter 23, 25. doi:10.1007/s10035-021-01096-4
Yang, Z. X., Yang, J., and Wang, L. Z. (2012). On the influence of interparticle friction and dilatancy in granular materials: a numerical analysis. Granul. Matter 14, 433–447. doi:10.1007/s10035-012-0348-x
Yoshimine, M., Ishihara, K., and Vargas, W. (1998). Effects of principal stress direction and intermediate principal stress on undrained shear behavior of sand. Soils Found. 38 (3), 179–188. doi:10.3208/sandf.38.3_179
Yu, F. W. (2017). Particle breakage and the drained shear behavior of sands. Int. J. Geomech. 17, 04017041. doi:10.1061/(ASCE)GM.1943-5622.0000919
Yu, F. W. (2018). Particle breakage in triaxial shear of a coral sand. Soils Found. 58, 866–880. doi:10.1016/j.sandf.2018.04.001
Zeng, K. F., and Liu, H. B. (2023a). Experimental study on the time-dependent oedometric compression behavior of calcareous sand. J. Geotech. Geoenviron. Eng. 149, 04023025. doi:10.1061/JGGEFK.GTENG-10739
Zeng, K. F., and Liu, H. B. (2023b). Effect of inherent anisotropy on the triaxial compression behavior of coral sand. Int. J. Geomech. 23, 04023033. doi:10.1061/IJGNAI.GMENG-8003
Zeng, K. F., and Liu, H. B. (2023c). Effect of particle size distributions on the mechanical behavior and particle breakage of coral sands. Granul. Matter 25, 44. doi:10.1007/s10035-023-01334-x
Zhang, T., Zhang, C., Yang, Q., and Fu, R. (2020). Inter-particle friction and particle sphericity effects on isotropic compression behavior in real-shaped sand assemblies. Comput. Geotech. 126, 103741. doi:10.1016/j.compgeo.2020.103741
Zhang, T., Zhang, C., Zou, J., Wang, B., Song, F., and Yang, W. (2020). DEM exploration of the effect of particle shape on particle breakage in granular assemblies. Comput. Geotech. 122, 103542. doi:10.1016/j.compgeo.2020.103542
Zhang, X., Hu, W., Scaringi, G., Baudet, B. A., and Han, W. (2018). Particle shape factors and fractal dimension after large shear strains in carbonate sand. Géotechnique Lett. 8, 73–79. doi:10.1680/jgele.17.00150
Zhang, X. L., Wang, X. L., Chen, S. L., and Xu, C. S. (2020). Biaxial compression test and application considering interparticle rolling resistance and particle shape effects. Soil Dyn. Earthq. Eng. 139, 106394. doi:10.1016/j.soildyn.2020.106394
Zhao, S., and Zhao, J. (2019). A poly-superellipsoid-based approach on particle morphology for DEM modeling of granular media. Int. J. Numer. Anal. Methods Geomechanics 43 (13), 2147–2169. doi:10.1002/nag.2951
Zhou, W., Yang, L., Ma, G., Chang, X., and Cheng, Y. (2015). Macro–micro responses of crushable granular materials in simulated true triaxial tests. Granul. Matter 17, 497–509. doi:10.1007/s10035-015-0571-3
Zhou, W., Yang, L., Ma, G., Xu, K., Lai, Z., and Chang, X. (2017). DEM modeling of shear bands in crushable and irregularly shaped granular materials. Granul. Matter 19, 25. doi:10.1007/s10035-017-0712-y
Zhou, X. H., Zhou, Y. G., and Chen, Y. M. (2023). DEM analysis of undrained cyclic behavior and resistance of saturated dense sand without stress reversals. Granul. Matter 25, 36. doi:10.1007/s10035-023-01328-9
Keywords: discrete element method, coral sand, particle shape, particle breakage, inherent anisotropy, input energy
Citation: Liu X, Zeng K, Xiang F, Wang C, Hou X and Li Y (2024) Study on the interaction between particle shape and particle breakage of coral sand by discrete element method. Front. Earth Sci. 12:1343307. doi: 10.3389/feart.2024.1343307
Received: 23 November 2023; Accepted: 15 January 2024;
Published: 31 January 2024.
Edited by:
Xianwei Zhang, Chinese Academy of Sciences (CAS), ChinaReviewed by:
Mengmeng Wu, Hong Kong Polytechnic University, Hong Kong SAR, ChinaZhuang Cheng, Wuhan Institute of Technology, China
Ali Lashkari, Shiraz University of Technology, Iran
Hoang Bao Khoi Nguyen, University of South Australia, Australia
Copyright © 2024 Liu, Zeng, Xiang, Wang, Hou and Li. This is an open-access article distributed under the terms of the Creative Commons Attribution License (CC BY). The use, distribution or reproduction in other forums is permitted, provided the original author(s) and the copyright owner(s) are credited and that the original publication in this journal is cited, in accordance with accepted academic practice. No use, distribution or reproduction is permitted which does not comply with these terms.
*Correspondence: Kaifeng Zeng, RDIwMjA4MTEzM0BodXN0LmVkdS5jbg==
 Xuejun Liu1
 Kaifeng Zeng