 Dan Wang
 Jianping Chen1,2*
- 1School of Earth Sciences and Resources, China University of Geosciences (Beijing), Beijing, China
- 2Beijing Key Laboratory of Development and Research for Land Resources Information, Beijing, China
Introduction: China has the world’s largest amount of antimony resources and plays a vital role in the global antimony industry. The Huangyangling area in Xinjiang belongs to the Lazhulong-Huangyangling antimony mineralization belt; this area is rich in antimony ore resources, with potential for discovery of additional ore. This high-elevation mountainous area is located in the northwestern region of the northern Tibetan Plateau, with a harsh natural environment and poor transportation access; thus, the use of traditional geological exploration methods is limited, and remote sensing technology provides unique advantages.
Methods: Using Landsat 8 OLI and Gaofen-6 (GF-6) data, we extracted stratigraphic, lithologic and fault information from the study area through information enhancement processing of the images. Based on Landsat 8 OLI, Sentinel-2 and ASTER images and the use of remote sensing image preprocessing and interference information masking, the spectral characteristics of limonite, as well as hydroxyl, carbonate, and silicified alteration minerals were utilized; the characteristics included reflection or absorption in specific spectral bands. The spectral characteristics were then combined with principal component analysis (PCA) and the band ratio method to extract the alteration information for the study area.
Results: The stratigraphy and boundaries between stratigraphic and lithologic units extracted in this study were defined, and numerous small faults were identified based on a comparison with 1:250,000 geologic maps. And the overall distribution trends of the indicators of alteration extracted in this study were located along fault zones; additionally, the hydroxyl and carbonate alteration anomalies matched well with known deposits (occurrences). Thus, the alteration information is a good indication of antimony ore bodies. Based on the geological interpretation, alteration information extraction and geochemical exploration data, four prospecting areas were identified.
Discussion: The method of extracting geological and hydrothermal alteration information by remote sensing has practical significance because it provides the possibility for geological work and mineral exploration in difficult high-elevation environments.
1 Introduction
Huangyangling is located in the western part of the Qin-Qi-Kun central orogenic belt and belongs to the Tethys-Himalayan mineralization domain (level I), the Cocosilia-Songpan-Ganzi tectonic mineralization belt (level II), the Lazhulong-Dongyinshan antimony-mercury mineralization belt (level III), and the Lazhulong-Huangyangling antimony mineralization belt (level IV) (Zheng et al., 2015; He et al., 2017; Dong et al., 2023; Li et al., 2023). This region has a long geological history, well-developed fault structures, long-lasting hydrothermal activity, a superior geological background for mineralization (Zheng et al., 2022), and 16 known deposits (occurrences), such as Panshuihe, Wolonggang and Huangyangling. These deposits have high potential for containing more antimony ore. The study area is an ideal working area for remote sensing geology and mineral exploration because of its low temperature, low oxygen concentration, harsh climatic conditions, exposed bedrock, scarce vegetation, inconvenient transportation access and high difficulty in carrying out geological field work. Previous researchers have performed related studies on the stratigraphy, tectonics, intrusive rocks, and genesis of antimony deposits in the area by traditional geological means. The Huangyangling antimony ore is located in low-temperature hydrothermal rocks, and in this area, nearly east‒west north-dipping reverse faults control the ore deposit. NE‒SW secondary faults, fissures, and interlayer faults and joints control the output of the ore body, and the antimony ore exhibits a clear layer-controlled distribution (Chen et al., 2009; Yang et al., 2013; Wang et al., 2022). The extraction of hydrothermal alteration information is highly important for the prospecting and exploration of hydrothermal ore deposits (Sillitoe, 2015; Testa et al., 2018; Chen et al., 2019; Zhang et al., 2019; Kaufmann et al., 2023; Zhong et al., 2023; Zhou et al., 2023). The distributions of fault structures and ore-endowed strata are indicative of the antimony ore output in Huangyangling. Therefore, fully exploiting the advantages of remote sensing technology is practical for identifying the distribution of stratigraphy and lithology in the study area, determining the important aspects of tectonics and hydrothermal alteration in the area to further improve antimony mining in the Huangyangling area and performing future antimony exploration.
Remote sensing technology is characterized by a wide field of view, rapid and inexpensive data acquisition, and rich comprehensive information. To some degree, information on underground and deep mineralization geological features can be obtained, and mineralization information can be acquired at multiple levels and from multiple aspects (Ahmad et al., 2016; Pour et al., 2018; Eldosouky et al., 2021; Li, 2021; Peyghambari and Zhang, 2021; Gil et al., 2023). The application of remote sensing technology in mineral prospecting and prediction is a direct reflection of the application of modern high-tech methods in the field of mineral exploration (Ali and Ghoneim, 2022; Shirmard et al., 2022; Ousaid et al., 2023; Tagwai et al., 2023). Currently, remote sensing technology is constantly maturing and has been commonly used in lithology identification, tectonic information interpretation, mineralization and alteration information extraction and other geological and mineral prospecting prediction tasks. The main data used come from the Landsat series, Sentinel series, WorldView series and ASTER (Amri et al., 2017; El Desoky et al., 2020; Moradpour et al., 2021; Chen et al., 2022; Mahdi et al., 2022; Chen L. et al., 2023; Mohamed Taha et al., 2023; Zhang X et al., 2023). In terms of remote sensing geological interpretation, the main methods used are the direct judgment method, comparison method and comprehensive judgment method. The information enhancement processing methods for remote sensing images are used to acquire lithology and tectonic information; these methods include optimal waveband combination, principal component analysis (PCA) and direction filtering, (Honarmand et al., 2013; Shahriari et al., 2013; Xu et al., 2019; Ibrahim et al., 2021; Benaissi et al., 2022). In terms of mineral lithology mapping and alteration information extraction, the construction and improvement of a mineral spectrum library provides the potential for the extraction of the lithology and the alteration information from remote sensing data (Swayze et al., 1993; Wang et al., 2012; Abubakar et al., 2017; Wang et al., 2018; Jain et al., 2024). The main methods used are matched filtering, the spectral area method, the mineral index method, PCA, the band ratio, and machine learning; among these methods, PCA and the band ratio are more widely used in the extraction of etching information (Crosta and Moore, 1989; Rowan et al., 2004; Leverington and Moon, 2012; Pour et al., 2013; Ninomiya and Fu, 2017; Abdolmaleki et al., 2020; Ahmadi and Uygucgil, 2021; Osinowo et al., 2021). The application of remote sensing technology allows the geological lithology division to be more detailed and the lithology boundary outline to be clearer and more definite; this compensates for the deficiency that field geology can only roughly distinguish lithology units due to the condition restrictions. Moreover, remote sensing technology can also provide comprehensive information on the spatial distribution of linear tectonic features. The combination of medium- and high-resolution data is conducive to the comprehensive extraction of lineament information at the regional scale and at the small and medium scales; moreover, these data can be used in the extraction of large-scale alteration zones and small-scale geological outcrop alteration information (Eldosouky et al., 2020; Zaghlol et al., 2021; Prabhakar et al., 2024).
Based on these applications, in this study, Landsat 8 OLI, Sentinel-2, ASTER and GF-6 satellite images are selected as the data sources for remote sensing geological interpretation, alteration information extraction and antimony ore prediction in the Huangyangling area. The Landsat 8 OLI and GF-6 data is modified by image enhancement processing combined with texture, color tone and other features to establish the stratigraphic and lithological information and fault markers; from these data, we identified the stratigraphy, lithology, faults and other ore-controlling factors in the study area. Based on the spectral characteristics of the alteration minerals in Landsat 8 OLI, Sentinel-2, and ASTER data, we extracted the alteration information on limonite, hydroxyl groups, carbonate and silicification. Finally, we synthesized the fault structure, alteration and geochemical information, combined these data with stratigraphic and lithological interpretation results, and defined the target area for mineral prospecting in the study area. In this study, the extraction methods for stratigraphy, lithology and fault structure in the Huangyangling area are explored, the distribution of alteration minerals is preliminarily mapped, and a prospecting area is defined; the objective is to provide theoretical value and technical support for further antimony ore prospecting in this area.
2 Geological setting
The study area is located in Minfeng County, Hoten Region, Xinjiang Uygur Autonomous Region, China, and is adjacent to the Tibet Autonomous Region to the south (Figure 1B). The area has a continental desert climate that is cold, windy and harsh, and 70% of the surface is exposed bedrock and sparse vegetation. The available mineral resources are mainly antimony ore.
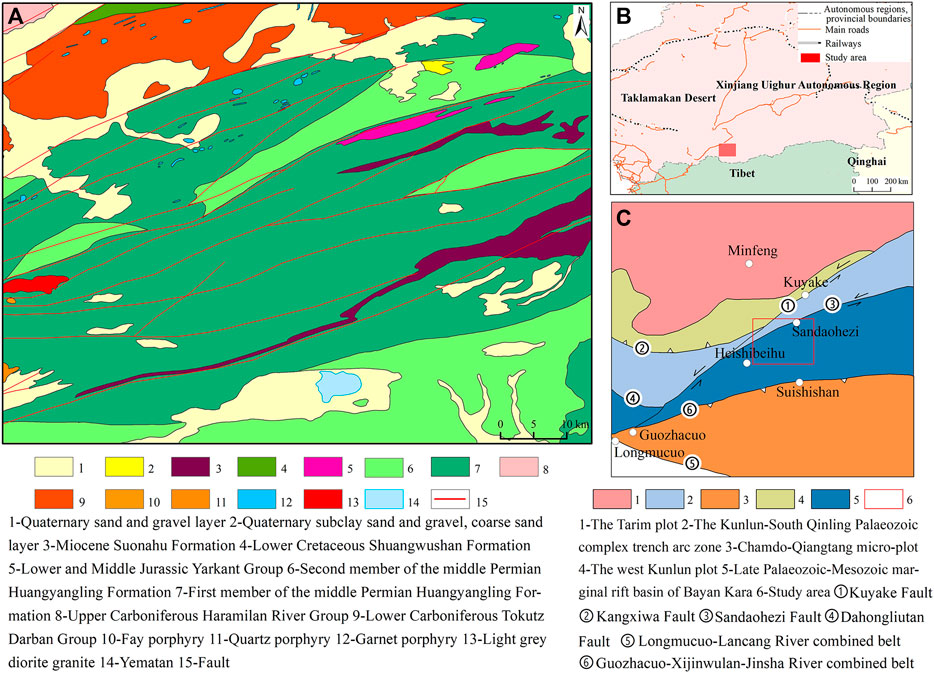
Figure 1. (A) Geological map of Huangyangling (According to the Xinjiang Minfeng County Wolonggang-Huifengkou Antimony Mine Preliminary Geological Report, 2011); (B) Geographic location of Huangyangling (According to the Xinjiang Minfeng Huangyangling Antimony Mine Investigation Report, 2009, modified); (C) Geotectonic subdivision of Huangyangling (According to the Xinjiang Minfeng Huangyangling Antimony Mine Investigation Report, 2009, modified).
The main part of the study area is located in the Bayan Kara stratigraphic subdivision. The exposed strata in the area include Quaternary (Q), the Miocene Suonahu Formation (N1s), the Lower Cretaceous Shuangwushan Formation (K1s), the Lower and Middle Jurassic Yarkant Group (J1-2Y), the Upper Triassic Wolonggang Formation (T3w), the Middle Permian Huangyangling Formation (P2h), the Upper Carboniferous Haramilan River Group (C2H), and the Lower Carboniferous Tokutz Darban Group (C1T) (Figure 1A) (Huang et al., 2017; Fu, 2018). Fine-grained late Paleozoic and early Mesozoic marine clastic rocks are present in the area, and the lithologies include uneven rhythmic deposits of blocky sandstone, muddy siltstone and silty mudstone; this is in accordance with the previously proposed observation that “interbedding of supportive and plastic rocks is the most favorable lithological combination for antimony ore.” Additionally, the migration ability of low-temperature hydrothermal elements such as mercury and antimony is strong, which is similar to gas–liquid mineralization in an ore-forming environment. In a mineralization environment, a shield layer formed by plastic rocks needs to be present, and this is similar to those in gas‒liquid mineralization deposits. The Permian Huangyangling Formation in this area has basic conditions conducive to mineralization, and the Sb and Hg contents are high in this stratum; thus, this is a possible ore source layer.
Geotectonically, the study area is located between the Tarim-North China Plate and the South China Plate, and the main portion of the area is part of the late Paleozoic-Mesozoic marginal rift basin of the Bayan Kara (also known as the Mesozoic Marginal Activity Belt of Hoh Xil). The region has experienced a long history of tectonic changes and a series of geologic activities, such as extension, erosion, subduction and collision, forming a unique tectonic and geologic landscape in the region. The Altyn Tagh fault, a major regional fault with a NNE‒WSW orientation, is exposed to the northwest, and all the fault structures in the region are affected by this fault. The overall characteristics of this steeply dipping northward left-trending strike-slip fault are shown in Figure 1C (Lai et al., 2015; Xing et al., 2023). Fault activity was strongest in the Yanshanian period, and the rocks in the fault zones were fractured, muddied, carbonated and discolored. Certain faults in the area are ore-controlling structures for mercury and antimony ores.
The antimony ore in this area is a type of low-temperature hydrothermal filling (accountable) deposit controlled by tectonic (magmatic) activity (Yang et al., 2013; Zhang Z et al., 2023). Antimony ore formation involved multiple periods and multiple mineralization events. Mineralization occurred in the Mesozoic, specifically in the Indosinian, Yanshanian and Himalayan periods, and the main mineralization period was the Yanshanian. The main useful metal minerals in the area are stibnite, accompanied by small amounts of sphalerite, pyrite, wolframite and other ores, and the primary vein mineral is quartz. The main peripheral rock alteration (mineralization) types include silicification, carbonatization, sericification, stibnite mineralization, limonitization, pyrite mineralization, brecciation, and mudification.
3 Materials and methods
The process of this study included remote sensing data acquisition, data preprocessing, extraction of information on geological conditions favorable for mineralization (such as stratigraphy and lithology, lineament information, and hydrothermal alteration information), and delineation of a target area for prospecting, as shown in Figure 2.
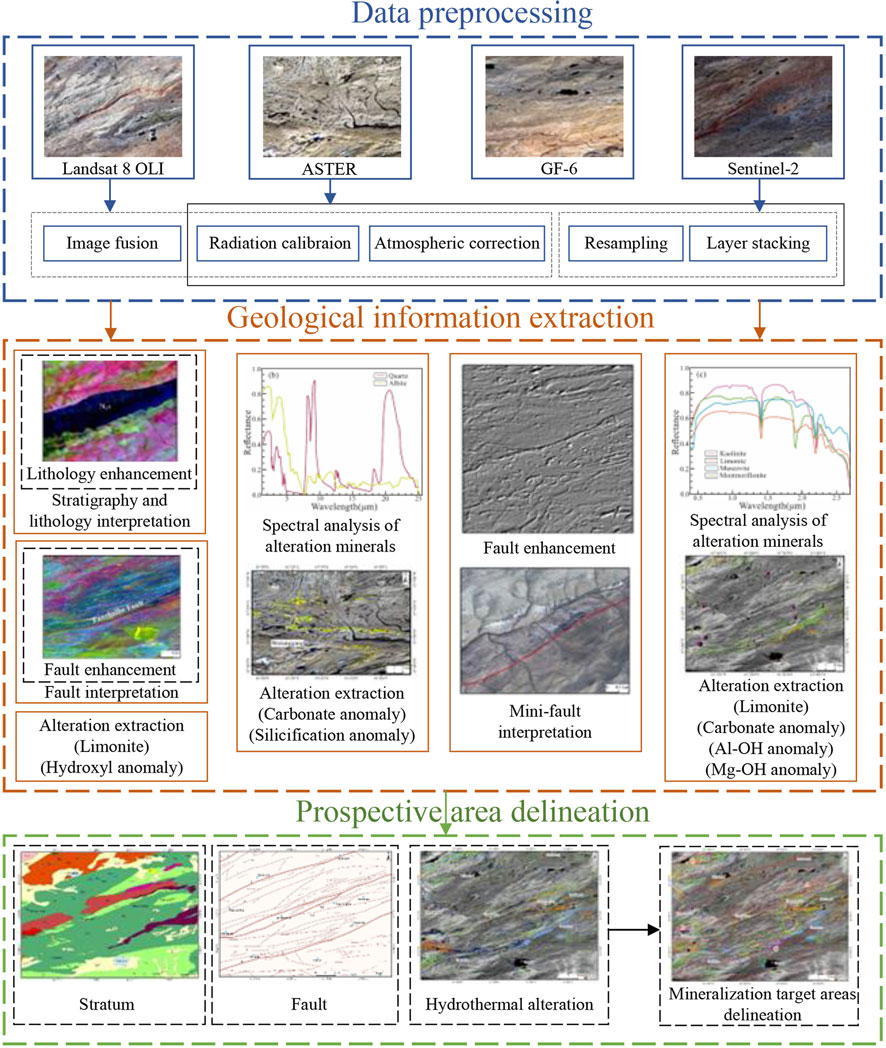
Figure 2. The workflow of this study.
3.1 Data acquisition and preprocessing
In this study, Landsat 8 OLI, Sentinel-2, ASTER, and GF-6 remote sensing data were used, and the acquisition times and numbers are shown in Supplementary Table S1.
When satellite sensors observe the Earth, particles and gases suspended in the atmosphere absorb and scatter electromagnetic radiation, and errors in the sensors themselves, as well as terrain and other factors, can affect the quality of the images (Chen C. et al., 2023). Radiation calibration can be performed based on the sensor voltage or digital quantitative value and the absolute radiation brightness value to eliminate the influence of the sensor itself; additionally, atmospheric correction can eliminate the influence of the atmosphere, the environment and other factors to obtain the real radiation value of the feature.
The Landsat 8 OLI data preprocessing used in this study included radiometric calibration, atmospheric correction and image fusion; these were all performed in ENVI5.3. Radiometric calibration and atmospheric correction were performed using the ENVI5.3 radiometric calibration and the FLAASH atmospheric correction model that came with the software. The image fusion was performed by Gram‒Schmidt pan sharpening, which fused the multispectral band with the panchromatic band such that the image was characterized by a high spectral resolution in the multispectral band and a high spatial resolution in the panchromatic band.
The Sentinel-2 data are L2A data were processed with orthometric and atmospheric corrections; thus, the preprocessing of the Sentinel-2 data mainly consisted of resampling and band synthesis. SNAP was used to resample the data; each band was resampled to 10 m, and the 13 resampled bands were synthesized into one file in ENVI5.3.
The ASTER data are L1T-level data, and the preprocessing included radiometric calibration, atmospheric correction, resampling, and band synthesis; these were performed in ENVI5.3. After radiometric calibration in the visible and near-infrared (VNIR) and shortwave infrared (SWIR) regions, the FLAASH atmospheric correction module was used, and after radiometric calibration in the thermal infrared (TIR) region, atmospheric correction was performed using the Thermal Atm Correction tool.
The GF-6 data are L5A-level fusion data, which were preprocessed with geometric fine correction, ortho-correction, radiometric correction, and image fusion; therefore, these data were not processed again.
Due to the higher reflectivity of ice, snow, water bodies and other features, which greatly impacts information extraction, interfering information needed to be removed by mask processing before extracting alteration information.
3.2 Data analysis and extraction methods
Landsat 8 OLI data have a medium spatial resolution and rich spectral information and are suitable for lithology information extraction and large-scale lineament information interpretation. GF-6 data have a high spatial resolution and can be used for small-scale lineament feature identification. The Landsat 8 OLI, Sentinel-2, and ASTER data have a high number of bands and can be used for alteration information extraction. In this study, due to the severe snow and cloud cover conditions of the ASTER images of the study area, only one view with good image quality was selected for the extraction of alteration information in a high-priority mining area.
3.2.1 Methods for extracting stratigraphic and lithologic information
Remote sensing data reflect the spectral and spatial information of various lithologies on the surface of the Earth’s crust, and lithologies, rock types and lithostratigraphic units can be interpreted from remote sensing images. However, the interpreted lithologic and stratigraphic information lacks geologic age and stratigraphic sequence information; thus existing geologic information and relevant geologic research assistance need to be used before lithologic mapping can be performed.
Due to differences in the lithological composition, hardness and surface smoothness of the different strata, different color tones and textures are expressed in the remote sensing images. In the identification and delineation of stratigraphy and lithology based on remotely sensed data, a single true-color image contains minimal lithological information and often requires lithological enhancement processing. Stretching, fusion, band combination, band ratio analysis, PCA, independent component analysis (ICA), minimum noise fraction (MNF), color synthesis and other operations on remote sensing images can be used to highlight differences in the spectral features, colors and textures to achieve lithological enhancement; this processing aid in the determination of the lithological boundaries and the extraction of lithological and stratigraphic information.
The optimal band combination method refers to the selection of suitable bands for image combination and subsequent RGB color synthesis and is a practical and fast method for extracting lithological information. The bands involved in color compositing need to be selected because they contain a large amount of information, with high independence between the bands and low mutual repetition of information. Specifically, if the standard deviation is as large as possible, the correlation coefficient should be as small as possible. The optimal index factor (OIF) can effectively reflect this, and the formula is as follows:
where Si represents the standard deviation of the ith band and Rij represents the correlation coefficient between bands i and j. A larger OIF correlates to a richer amount of information contained in the combination of bands and a more significant reflection of the geological information.
The band ratio is a method for increasing the difference between the features for lithology enhancement by selecting two bands with large reflectance differences for ratio calculation.
PCA is an orthogonal transformation of the original data that concentrates the information of all bands in the image to be expressed in the first few principal components. After PCA, the image has no correlation between the bands and contains different feature information; this process is performed to remove redundant information between the image bands. PCA color synthesis refers to the selection of suitable principal components for RGB color synthesis after PCA processing of the image bands to achieve enhancement of the lithological information. ICA refers to independent PCA, which can further eliminate higher-order correlations within the data. MNF refers to the minimum noise separation transform, which is a method of PCA transformation on the basis of denoising. The ICA and MNF methods enable denoising, data compression, and spectral information centralization; these methods can aid in the extraction of mixed lithology samples and the differentiation of lithological boundaries in small areas.
3.2.2 Methods for extracting lineament information
Tectonic factors are important controls on the formation and distribution of ore deposits. For the Huangyangling antimony deposit, which is a type of endogenous deposit, large faults often acted as channels for the upward migration of magma and hydrothermal fluids and played a role in controlling the distributions of rocks and ore. Secondary faults directly controlled the output and distribution of deposits (ore bodies). Fault structures are characterized by linear features in remote sensing images due to differences in physical and chemical structures and environments. Remote sensing images can be used to interpret fault structures via interpretation and analysis through the use of interpretation markers such as hue, color, morphology and relationships with surrounding features combined with existing relevant geological data.
To enhance the spectral information and spatial distribution of fault structures in remote sensing images, remote sensing data can be processed by PCA, color synthesis and convolutional enhancement. Convolutional enhancement divides an image into blocks according to the image elements and performs average processing. This spatial enhancement method can weaken or filter out the tectonic components in other directions and preserve tectonic features in specific directions; this approach is very effective at individually extracting fault structures in certain directions.
3.2.3 Spectral analysis and methods for extracting hydrothermal alteration information
In the process of hydrothermal mineralization, hydrothermal fluid and the country rock undergo chemical reactions; these reactions cause a series of structural, tectonic and material composition changes known as peripheral rock alteration. Peripheral rock alteration is one of the main features of hydrothermal deposits and an important part of hydrothermal mineralization, and alteration anomalies are important signs of hydrothermal deposits (Kampmann et al., 2017; Simusokwe et al., 2021; Mulja and Heriawan, 2022).
Based on the alteration minerals related to antimony ore in the study area, limonite, as well as the carbonate, Al-OH, Mg-OH, and silicified alteration minerals, were selected for spectral characterization (Figure 3, selected from the USGS spectral library). The absorption positions of limonite (Fe3+) are approximately 0.5 μm and 0.9 μm, and the reflection positions are approximately 0.65 μm and 1.6 μm (selected limonite HS41.3 spectral curve). The silicified alteration minerals (quartz+albite) absorb at positions near 2.5 μm and 9.0 μm and reflect at positions near 10.0 μm and 21.5 μm. The hydroxyl alteration minerals have absorption features near 0.9 μm, 1.4 μm, 1.9 μm, and 2.2 μm and reflection features near 0.5 μm, 1.6 μm, and 2.1 μm. The carbonate minerals have three types of vibrations: a symmetric stretching vibration (v1), an asymmetric stretching vibration (v3), and a bending vibration (v2); these vibrational modes play a key role in the infrared spectral analyses of carbonate minerals. The band ranges involved in the Landsat 8 OLI, Sentinel-2A, and Sentinel-2B data are 0.433–2.300 μm, 0.412–2.320 μm, and 0.411–2.303 μm, respectively (Supplementary Table S2). Therefore, in this study, the characteristic curves of the carbonate alteration minerals (dolomite+calcite) in the range of 0–2.5 μm are selected for the analysis of the reflectance and absorption characteristics in this range. The absorption and reflection positions of dolomite and calcite features are similar, with absorption features at 0.9 μm, 1.9 μm, and 2.3 μm, and reflection features at 0.5 μm, 2.1 μm, and 2.4 μm (Figure 3E). A strong absorption feature is present at 2.3 μm, corresponding to a symmetric stretching vibration mode of the carbonate minerals (v1).
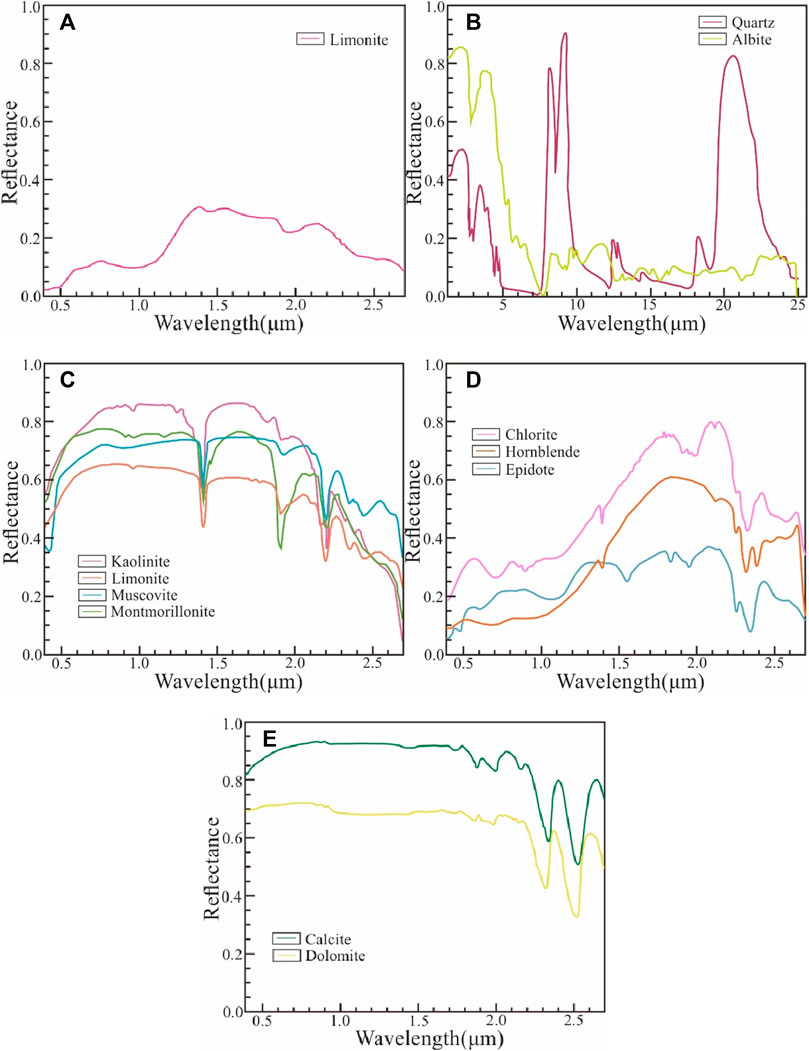
Figure 3. Typical alteration mineral spectral curves (from USGS spectral library) (A) Limonite; (B) Silicification minerals; (C) Al-OH minerals; (D) Mg-OH minerals; (E) Carbonate minerals.
In this remote sensing extraction of hydrothermal alteration information, PCA and the band ratio method were used. PCA is widely used for the extraction of hydrothermal alteration information and has many advantages, such as a fast processing speed, simple implementation process and good extraction effect (Xu et al., 2019; Feng et al., 2021). By amplifying the differences between the bands, the band ratio method highlights some weak anomalies and suppresses other information that interferes with the features; this method enhances the small differences between different features and rocks for the extraction of information on the lithology and mineralization-related alteration (Mohy et al., 2016).
4 Results
4.1 Interpretation of stratigraphic and lithologic information
Since the OIF should be as large as possible, B7, B5, and B2 from the Landsat 8 OLI data were selected as the best band combinations for lithological information interpretation based on the actual situation of the study area and on the visual effect and the degree of lithological differentiation after band color combination. According to the known geological map (Figure 1A), the lithological boundaries of the image (Figure 4C) after the optimal band combination are significantly enhanced, but the overall lithological differences are remain unclear and need to be further differentiated.
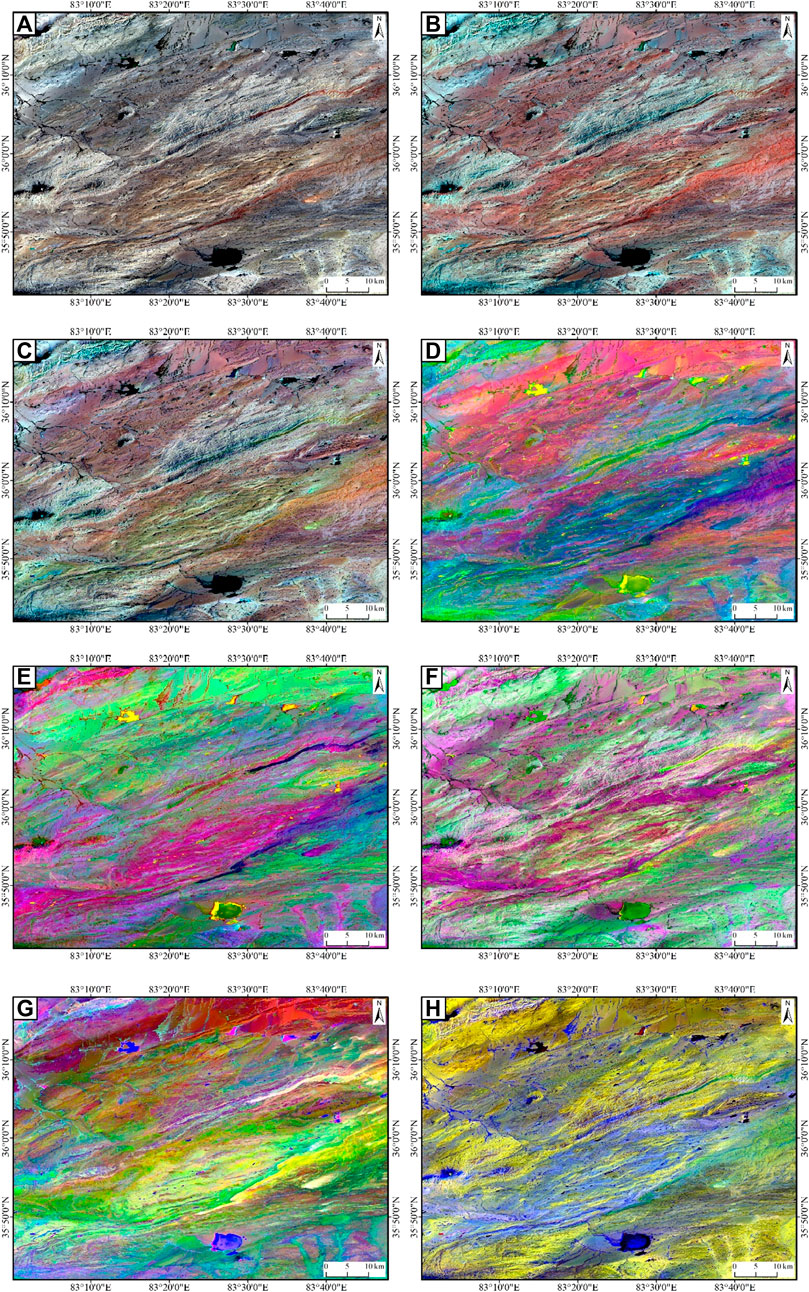
Figure 4. Lithology information enhancement using Landsat 8 data (A) B4(R)B3(G)B2(B); (B) B6(R)B3(G)B2(B); (C) B7(R)B5(G)B2(B); (D) PC3(R)PC2(G)PC1(B); (E) PC5(R)PC3(G)PC1(B); (F) IC6(R)IC3(G)B1(B); (G) IC6(R)MNF2(G)MNF1(B); (H) B3(R)B5(G)B6/B7(B).
The seven bands of the Landsat 8 OLI image were processed by PCA; the first three principal components containing large amounts of information were selected for the color synthesis (Figure 4D), and the synthesized image was rich in color, with clear differences in hue among the different features and significant enhancement of spectral features. The third principal component (PC3) mainly included the lithological information, and PC5(R)PC3(G)PC1(B) was selected for color synthesis (Figure 4E). Based on a comparison with the geologic map (Figure 1A), the boundaries of the Miocene Suonahu Formation (N1s) and the Lower Cretaceous Shuangwushan Formation (K1s) were evident, and the enhancement effect was excellent. After ICA and MNF transformation of the Landsat 8 images and comparative analysis, the IC6(R)IC3(G)B1(B) synthesis scheme was selected to highlight the Quaternary system, as indicated by the light purple–light fuchsia area in Figure 4F. Additionally, the IC6(R)MNF2(G)MNF1(B) synthesis scheme highlighted the lower Carboniferous Tokutz Darban Group and the Wolonggang Formation (Figure 4G), and the lithological boundaries were clear and easy to delineate.
The lithology of the middle Permian Huangyangling Formation (P2h) is mainly mudstone and mud siltstone, and the main constituents of mudstone are clay minerals such as hydrous mica, kaolinite, and montmorillonite. The hydroxyl functional groups can be used to positively reflect clay minerals. As shown in Figure 3, the hydroxyl ionophore has reflective features at 1.6 μm and absorptive features at 2.2 μm; these correspond to Landsat 8 B6 and B7, respectively, and the ratio operation was performed on these two bands. The results of the operation are color synthesized with B3 and B5, which can help to enhance the information on mudstone and the mudstone type. This study has implications for the identification and delineation of the middle Permian Huangyangling Formation (P2h). As shown in Figure 4H, the area with a light blue‒blue color effectively matches with the distribution of the first member of the Huangyangling Formation (P2h1).
By combining the results of color tone, texture and lithology enhancement with the existing geological map and geological data, we established interpretation markers for the stratigraphy and lithology information in the study area, as shown in Table 1.
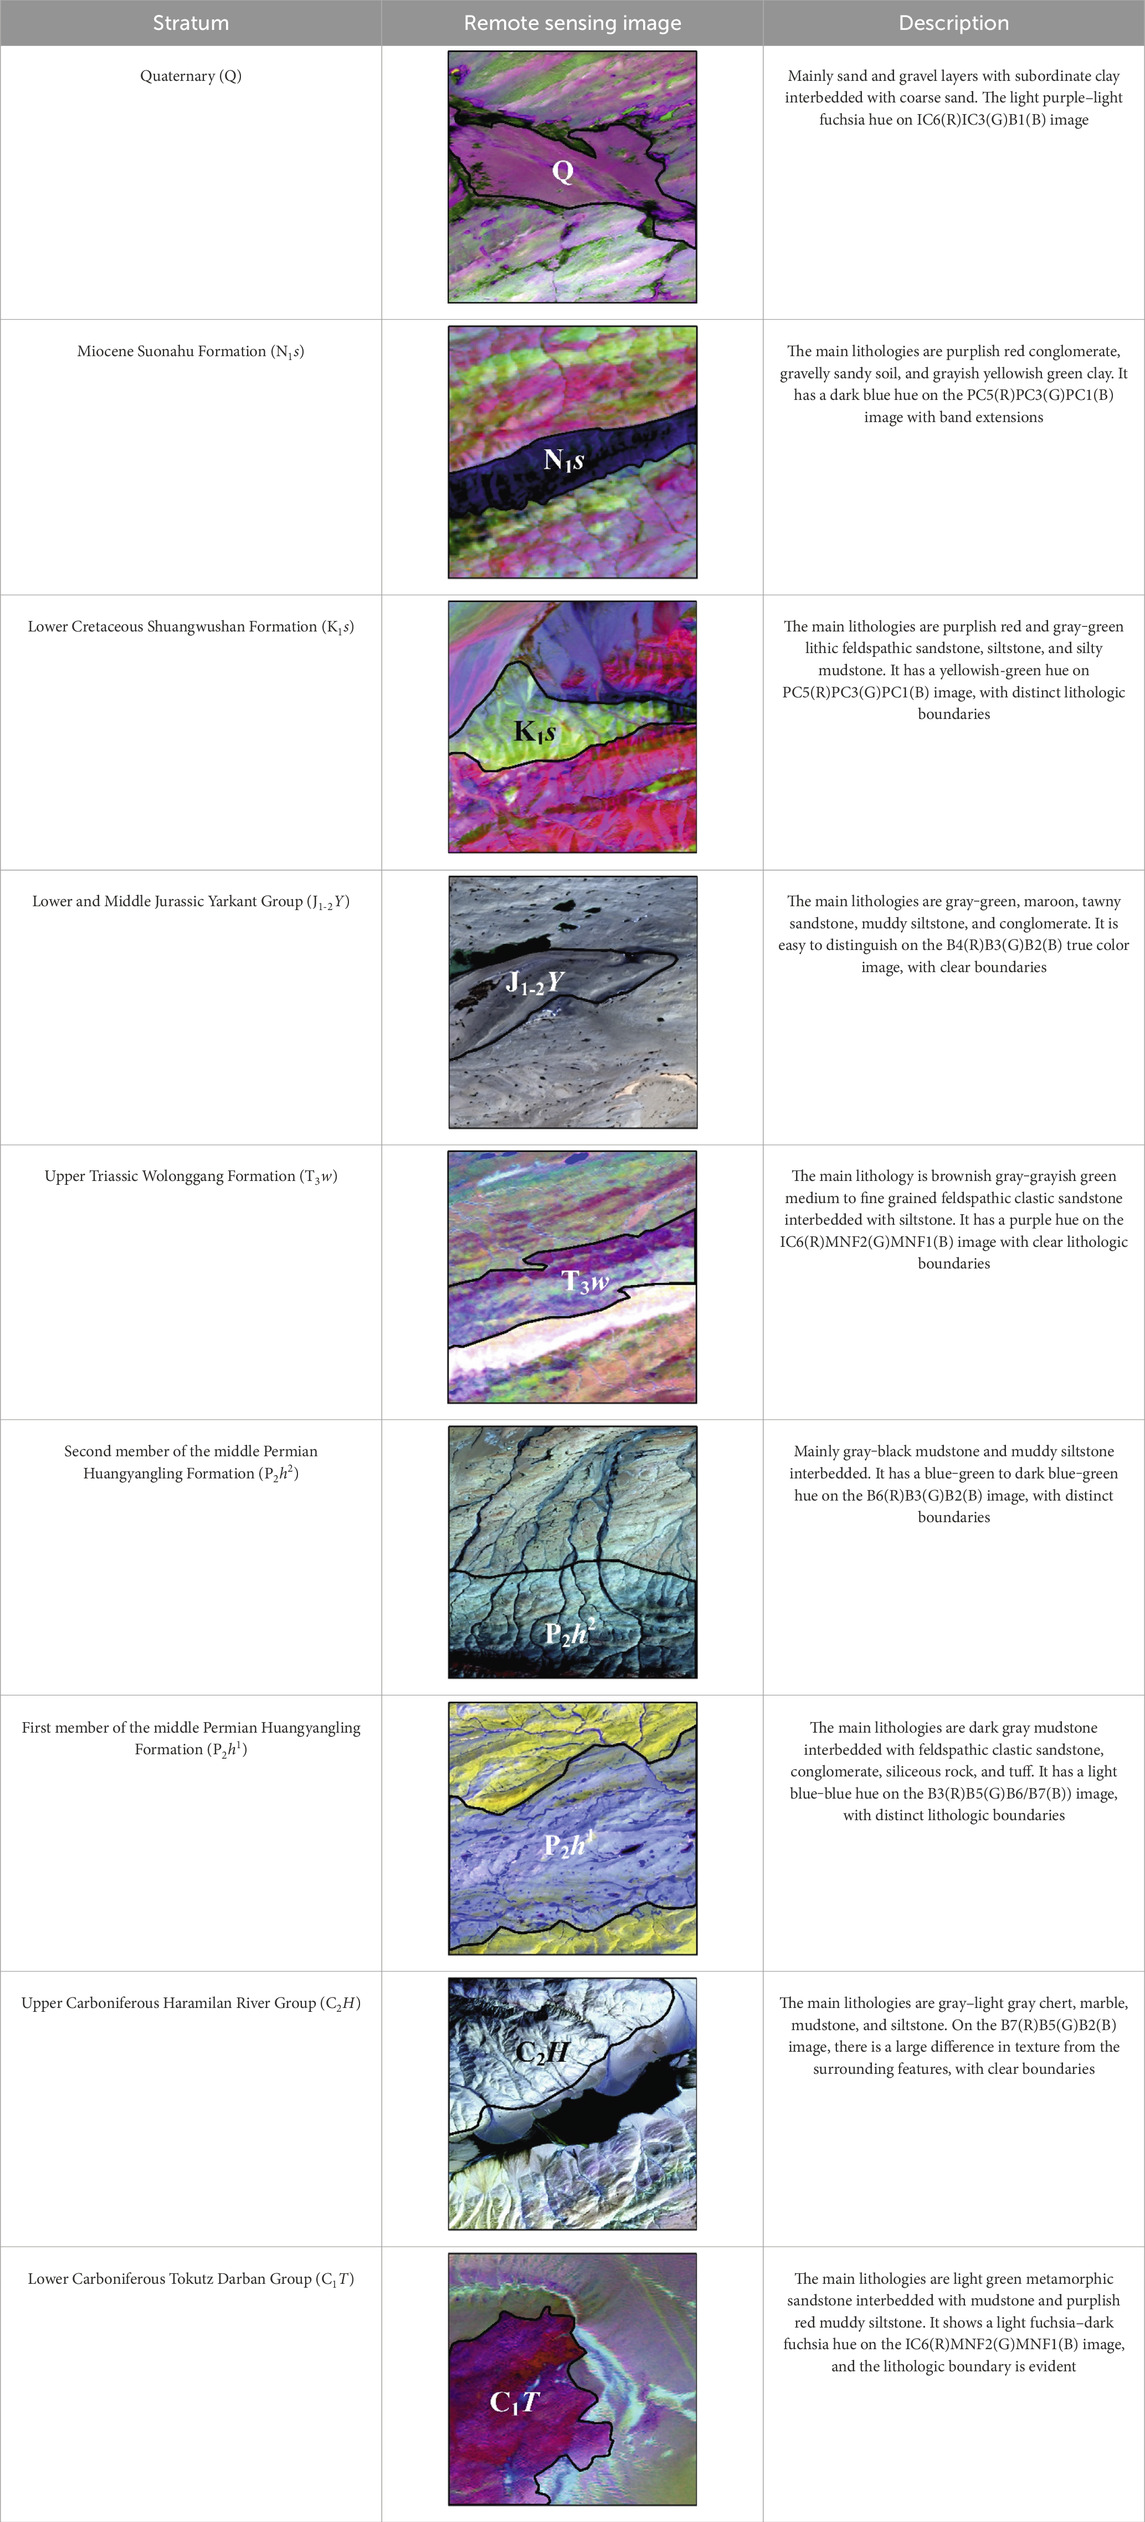
Table 1. Stratigraphic and lithologic interpretation flags using Landsat 8 data.
Based on the above lithological enhancement results and the established remote sensing interpretation signatures and with reference to the existing geological maps and data in the study area, a 1:250,000 scale stratigraphic and lithological interpretation of Landsat 8 images was carried out in the study area (Figure 5). Compared with those in Figure 1A, the lithology and stratigraphy of the remote sensing interpretation map were subdivided: the Wolonggang Formation (T3w) was newly delineated, the second member of the middle Permian Huangyangling Formation (P2h2) and the Quaternary gravel formation (Qhapl) were more detailed, and the boundaries of the lithologies were clearer and more definite.
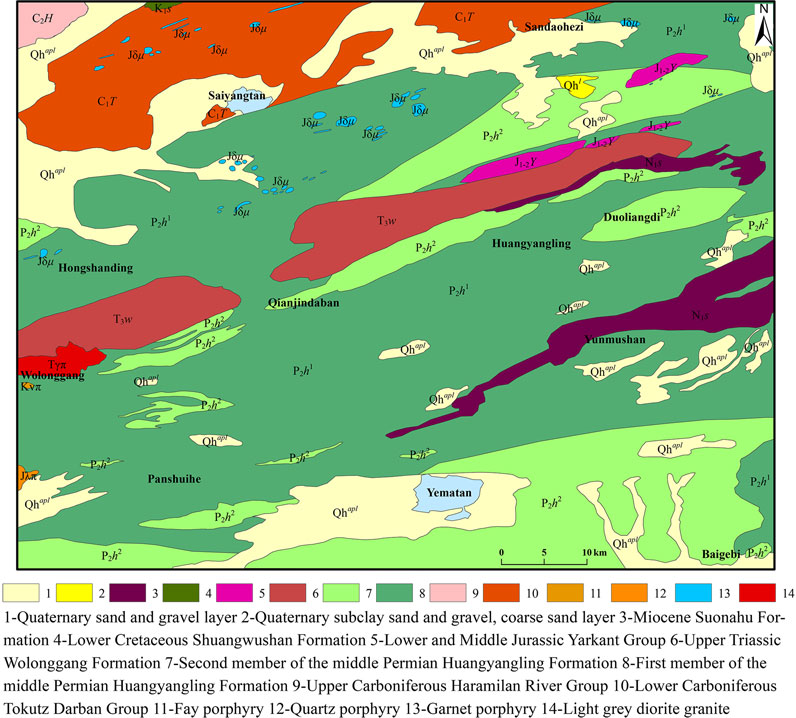
Figure 5. Remote sensing interpretation of stratigraphy and lithology.
4.2 Interpretation of lineament information
The fault structure in the Huangyangling area is extremely well developed, and some faults in the area are the ore-controlling structures in the antimony mines. In this study, remote sensing interpretation of the fault structure in the area was performed. Before interpretation, the fault structure information is first enhanced. The best band combinations OLI752 (Figure 4C) and PCA321 (Figure 4D) yield rich geological information and large differences between different features, which is conducive to interpreting the fault structure. Combined with the fault strike in the study area, a 3 × 3 convolution kernel is selected to enhance the Landsat 8 OLI B1-7 bands via NE-oriented convolution filtering, and the local image of the B1 band after enhancement (Supplementary Figure S1), with clear linear features, is bright white.
Faults are often characterized by linear features in remote sensing images, which are mainly interpreted by the following signs: 1) the formation of tonal anomaly lines (bands) on the image due to the different features on both sides of the fault; 2) the characteristics of the rock layers that are incorrectly fractured, repeated, missing, or changed during production due to tectonic effects; and 3) the appearance of special geological phenomena, such as fault triangles and straight-line distributions of steep canyons, ridges, or valleys. In this study, we used Landsat 8 data to interpret regional, large and medium-sized faults and GF-6 high-resolution data to interpret small faults.
A regional large-scale fault, the Kuyake fault, passes through this area and has evident linear features in the remote sensing image (Figure 6A). The lithologies on the two sides of the fault are different, as shown in different shades on the image. The Sandaohezi fault, Wolonggang fault, and Panshuihe fault are large faults in the study area and are clearly visible in the remote sensing images (Figures 6B–D). In addition, the small and medium-sized faults are clearly observed in the GF-6 high-resolution images (Figures 6E–H).
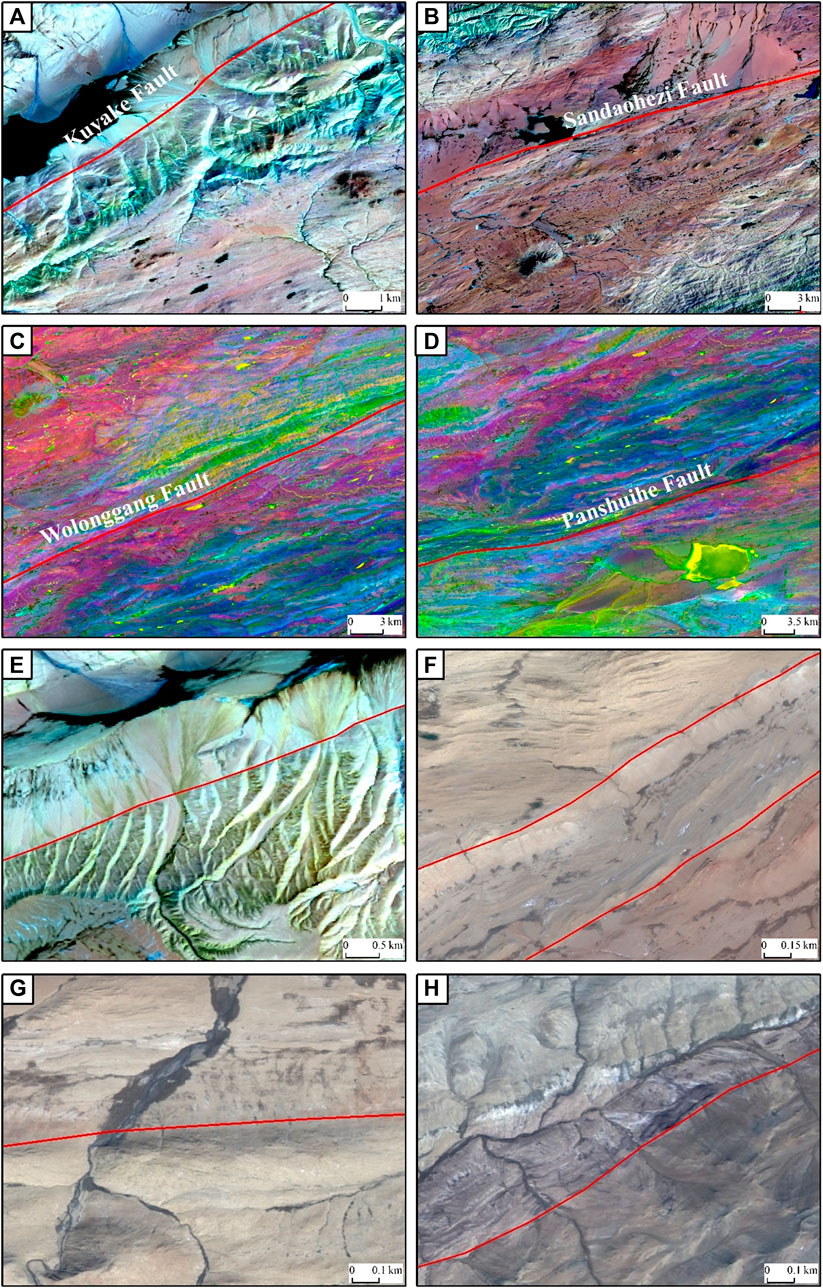
Figure 6. Fault interpretation flags (A) Landsat 8 B7(R)B5(G)B2(B); (B) Landsat 8 B7(R)B5(G)B2(B); (C) Landsat 8 PC3(R)PC2(G)PC1(B); (D) Landsat 8 PC3(R)PC2(G)PC1(B); (E) Landsat 8 B7(R)B5(G)B2(B); (F) GF-6 B3(R)B2(G)B1(B); (G) GF-6 B3(R)B2(G)B1(B); (H) GF-6 B3(R)B2(G)B1(B).
In this study, according to the above interpretation and combined with the results from the image enhancement, a total of 145 fault structures were found (Figure 7). The main directions of the fault structures are NE, NNE, and ENE, and regional faults, such as the Kuyake, Sandaohezi, Wolonggang, and Panshuihe faults, are distributed in the NE‒SW direction at nearly equal intervals; these faults control the tectonic pattern of the entire region.
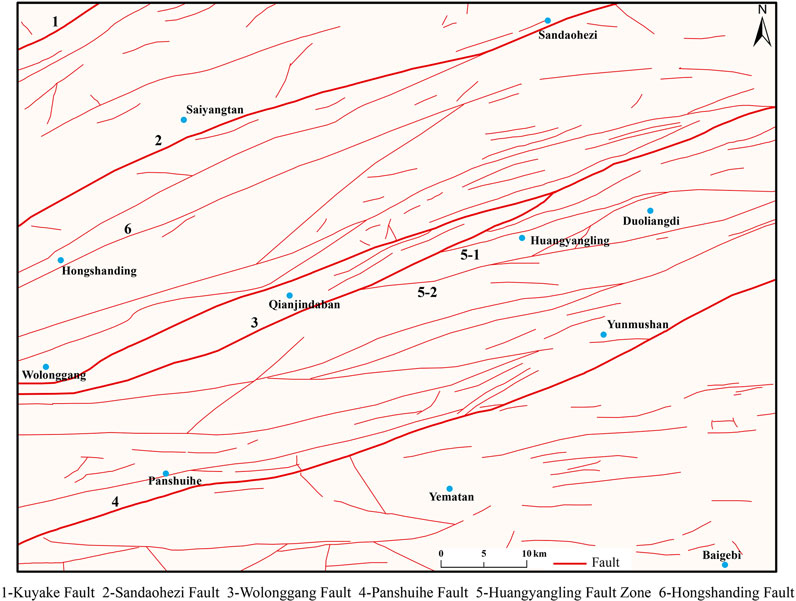
Figure 7. Remote sensing interpretation of lineaments.
4.3 Extraction of hydrothermal alteration information
4.3.1 Limonite
The spectral curve of limonite (Figure 3A) had absorption features at 0.45–0.52 μm and 0.86–0.92 μm, and these corresponded to the B2 and B5 bands of the Landsat 8 OLI data and the B2 and B8A bands of the Sentinel-2 data, respectively; additionally, limonite exhibited reflection features near 0.60–0.75 μm and 1.45–1.65 μm, which corresponded to the B4 and B6 bands of the Landsat 8 OLI data and the B5 and B11 bands of the Sentinel-2 data, respectively. Therefore, the Landsat 8 OLI B2, B4, B5, and B6 bands and the Sentinel-2 B2, B5, B8A, and B11 bands were selected for PCA. The anomalous principal components extracted from the Landsat 8 OLI data were characterized by OLI5 with coefficients opposite in sign to those of OLI4 and coefficients of the same sign as those of OLI2. The anomalous principal components extracted based on the Sentinel-2 data were characterized by the contribution coefficients of opposite signs in the B11 and B8A bands. Based on Table 2, Landsat 8 OLI PC4 and Sentinel-2 PC3 were selected as the main components for the limonite extraction.
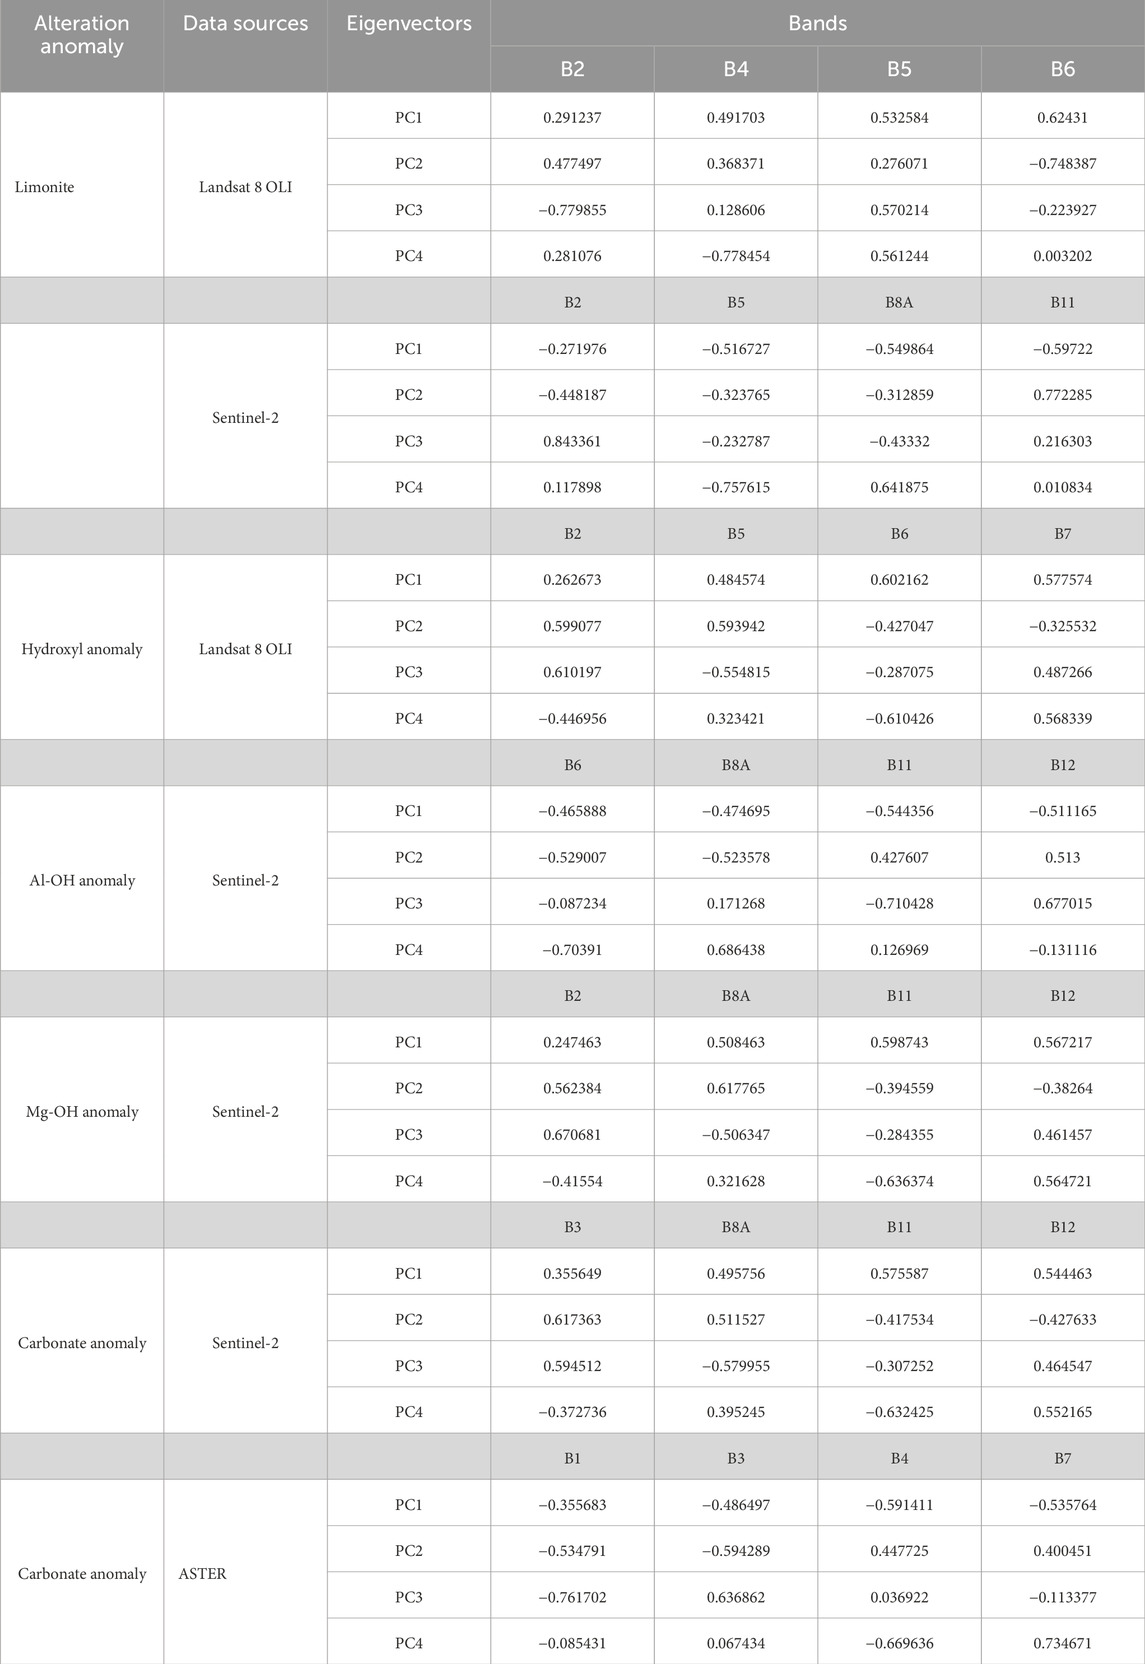
Table 2. PCA eigenvector matrix of alteration information extraction.
4.3.2 Hydroxyl alteration
The alteration anomalies that are most closely related to antimony mineralization in the Huangyangling area are the hydroxyl alteration anomalies. According to the spectral characteristics of the altered hydroxyl minerals (Figures 3C, D), 0.85–1.0 μm and 2.15–2.3 μm were selected as the absorption spectra corresponding to the Landsat 8 OLI B5 and B7 bands, respectively, and 0.49–0.58 μm and 1.60–1.70 μm were the reflection spectra corresponding to the Landsat 8 OLI B2 and B6 bands, respectively. Therefore, the Landsat 8 OLI B2, B5, B6, and B7 bands were selected for PCA, and the anomalous principal components were characterized by OLI6 contributing coefficients opposite in sign to those of OLI7 and of the same sign as those of OLI2. PC4 was selected as the principal component reflecting the information on hydroxyl alteration based on Table 2.
According to the spectral characteristics of the aluminum hydroxyl (Al-OH) groups of the alteration minerals (Figure 3C), the Sentinel-2 B6, B8A, B11, and B12 bands were selected for PCA; additionally, the anomalous principal component was characterized by the opposite sign of the contribution coefficients of B11 and B12. PC3 was used as a principal component reflecting the information of Al-OH alteration based on Table 2.
According to the spectral characteristics of the magnesium hydroxyl (Mg-OH) alteration minerals (Figure 3D), the Sentinel-2 B2, B8A, B11, and B12 bands were selected for PCA, and the anomalous principal components were characterized by the same sign of the B11 and B8A contribution coefficients and the opposite signs of the B11 and B12 contribution coefficients. PC3 was selected as the principal component reflecting the information on Mg-OH alterations based on Table 2.
4.3.3 Carbonate alteration
Carbonatization, mudification and other alterations in the Huangyangling area are accompanied by stibnite mineralization and silicification, and carbonatization is one of the alteration hallmarks of antimony mineralization in the area. According to the spectral characteristics of carbonate alteration minerals (Figure 3E), the characteristic absorption bands of carbonate alteration minerals are 0.86–0.98 μm, 1.80–2.0 μm, and 2.30–2.55 μm, and the characteristic reflectance bands are 0.49–0.58 μm, 1.65–2.75 μm, and 2.35–2.45 μm, respectively; therefore, we selected the Landsat 8 OLI B2, B5, B6, and B7 bands (same as in Section 4.3.2 Extraction of hydroxyl alteration information), the Sentinel-2 B3, B8A, B11, and B12 bands, and the ASTER B1, B3, B4, and B7 bands for PCA to extract carbonate alteration anomalies. Based on the Sentinel-2 data, the anomalous principal components are characterized by the same sign of contribution coefficients for B3 and B12 and by opposite signs of contribution coefficients for B3 and B11. Based on the ASTER data, the anomalous principal components are characterized by opposite signs of the contribution coefficients of B4 and B5. According to Table 2, PC3 is selected as the main component reflecting carbonate alteration information in the Sentinel-2 data, and the best component in the ASTER data is PC4 after inversion. Since the reflection values of the carbonate alteration minerals in the Landsat 8 OLI B6 band are significantly greater than those in the B7 band, the anomaly can also be extracted by selecting B6 and B7 for the ratio operation.
4.3.4 Silicified alteration
According to the spectral characteristics of silicified alteration minerals (Figure 3B), characteristic absorption bands were observed near 2.0–2.5 μm and 9.0–9.5 μm and characteristic reflection bands were observed near 10.0–10.65 μm. Therefore, the ASTER B12 and B13 band data could be selected for comparison to extract information on silicified alteration minerals. In addition, the silica content was extracted based on the ASTER thermal infrared band via the following formula (Chen et al., 2007):
where b10, b12, b13, and b14 represent the ASTER thermal infrared band radiance brightness values.
4.3.5 Results from the alteration information extraction via remote sensing
According to the above statistics on the extraction of the alteration information, the intensities of alteration anomalies were graded. The threshold value of the anomaly grade was divided by “mean + N×standard variance (σ),” and N was taken to be 2, 2.5 and 3 (N is taken to be 1.5, 2, 2.5 for limonite). The anomaly information was divided into three grades: weak anomaly, secondary anomaly and intense anomaly. The density segmentation data were processed by 3 × 3 median filtering, and pseudo-anomaly information was removed by combining the geologic, geographic and mineral data of the study area to obtain the final results of the alteration anomaly extraction. The remote sensing image was used as the base map, and the results of the alteration information extraction were superimposed to obtain a remote sensing alteration anomaly distribution map (Figures 8–11). The hydroxyl anomalies, carbonate anomalies, and limonite extracted from Landsat 8 OLI data were basically consistent with the distribution ranges of aluminum hydroxyl and magnesium hydroxyl anomalies, carbonate anomalies, and limonite extracted from Sentinel-2 data, reflecting the effectiveness of the extraction of alteration information based on multisource remote sensing data.
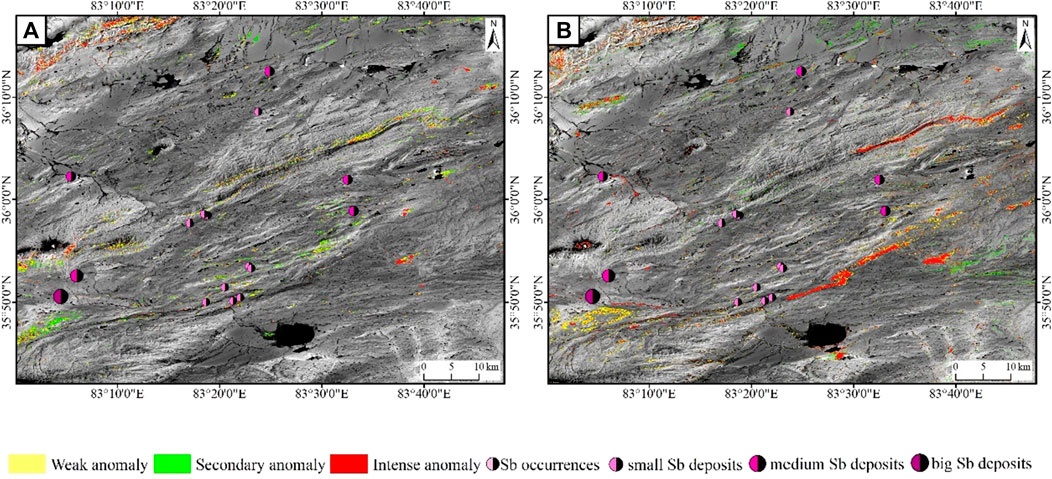
Figure 8. Results of limonite (A) Landsat 8 PCA B2, B4, B5, B6; (B) Sentinel-2 PCA B2, B5, B8A, B11.
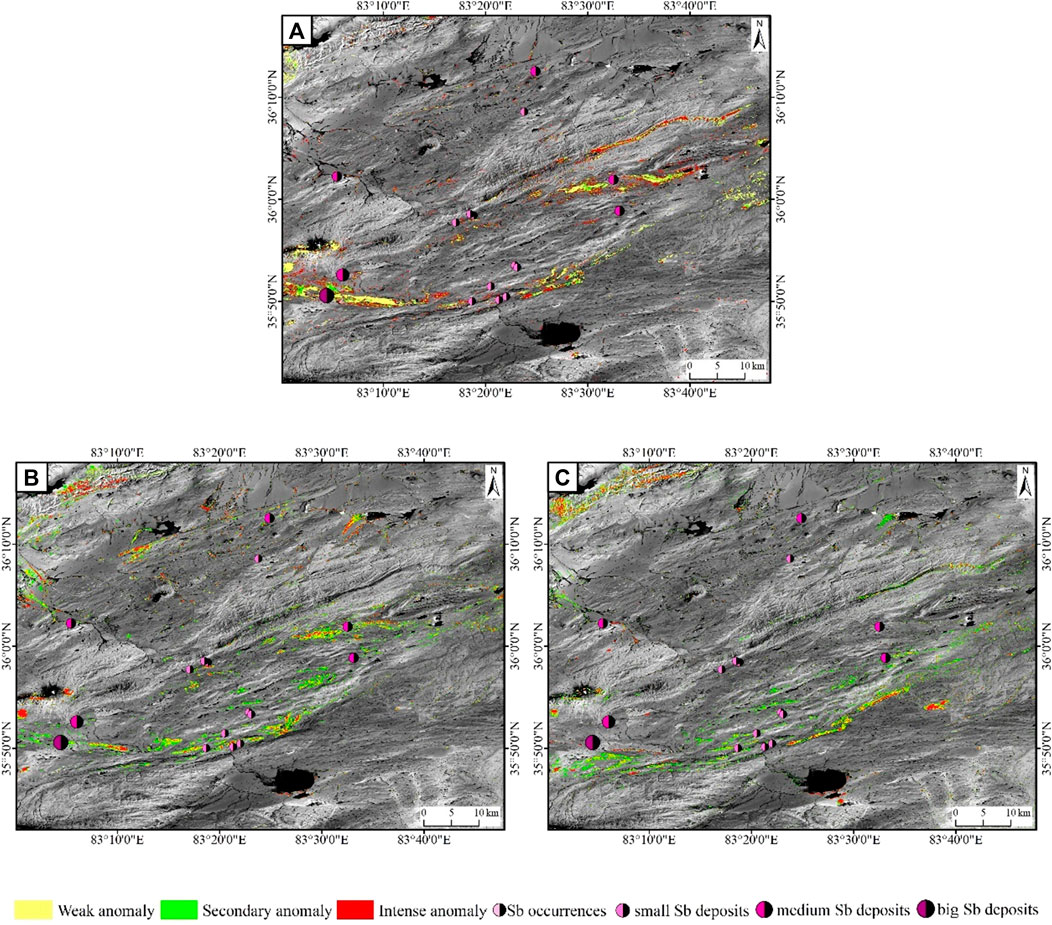
Figure 9. Results of hydroxyl alteration (A) Hydroxyl-Landsat 8 PCA B2, B5, B6, B7; (B) Al-OH-Sentinel-2 PCA B6, B8A, B11, B12; (C) Mg-OH-Sentinel-2 PCA B2, B8A, B11, B12.
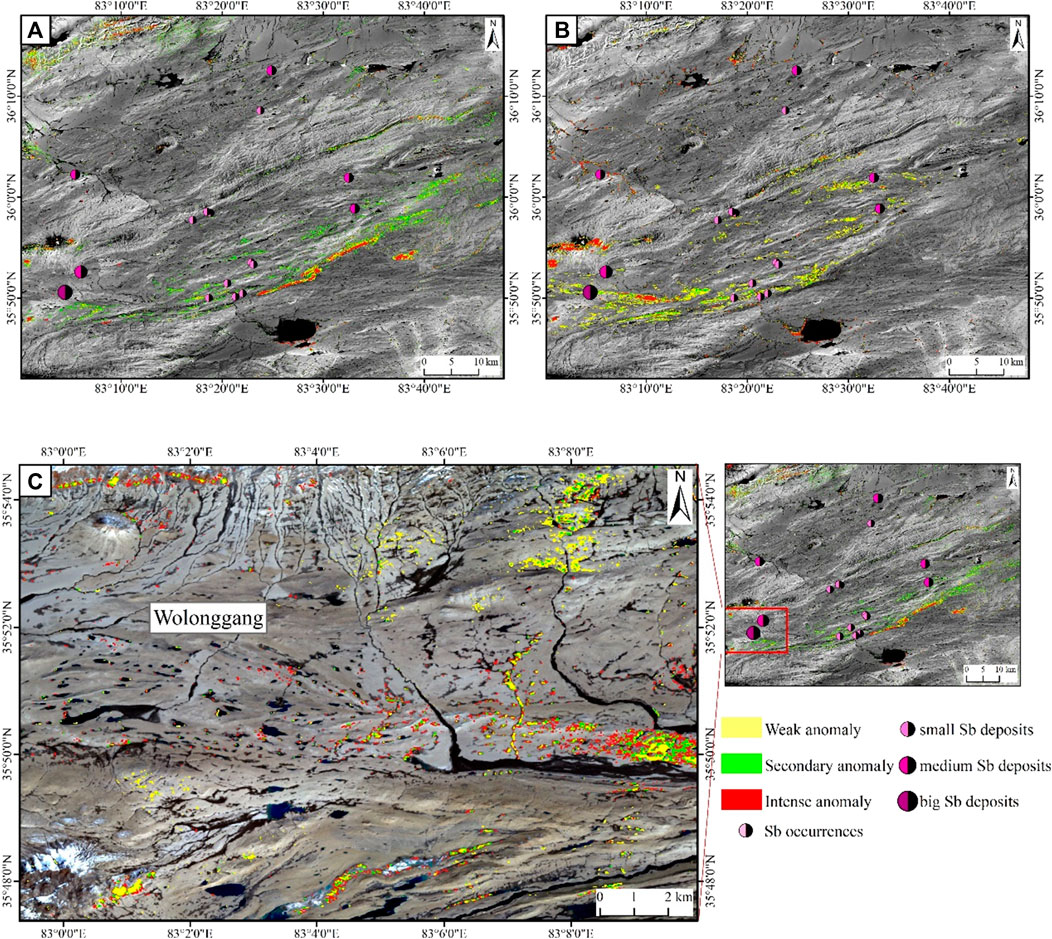
Figure 10. Results of carbonate alteration (A) Sentinel-2 PCA B3, B8A, B11, B12; (B) Landsat 8 B6/B7; (C) ASTER PCA B1, B3, B4, B7.
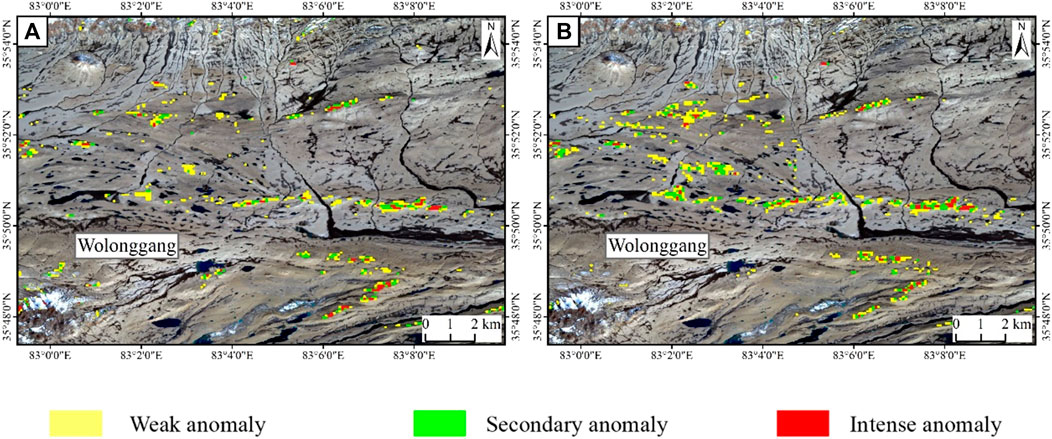
Figure 11. Results of silicified alteration (A) ASTER SiO2 content; (B) ASTER B12/B13.
The four kinds of alteration information extracted above (limonite, hydroxyl, carbonatization and silicification hydrothermal alterations) were combined in the Arcmap platform for superposition analysis and combined with known Sb deposits (occurrences) in the Huangyangling area to construct a comprehensive distribution map of the alteration information (Figure 12). Stibnite mineralization in the Huangyangling area is often accompanied by silicification, carbonatization, mudification and other alterations. As shown in Figure 13, the hydroxyl and carbonate alterations are mainly distributed in the central part of the study area and are continuously distributed in a strip in the east‒west direction. Based on the geological conditions of the study area (Figure 1A), the remote sensing anomalies are generally distributed along the fault zones, with a high degree of coincidence with the known deposits (occurrences) and an evident ability to indicate ore bodies. Limonite anomalies are widely distributed in both the central and northern parts of the area, and several anomalous extremely developed areas appear near Wolonggang, Huangyangling, and Saiyangtan in the northwestern part of the area. In this study, due to data limitations, silicification anomalies were not extracted for the whole study area, and the Wolonggang mine area was selected for extraction of silicified alteration information. In summary, the extraction of hydroxyl and carbonate alteration anomaly information was indicative of the distribution of antimony ore bodies in the study area.
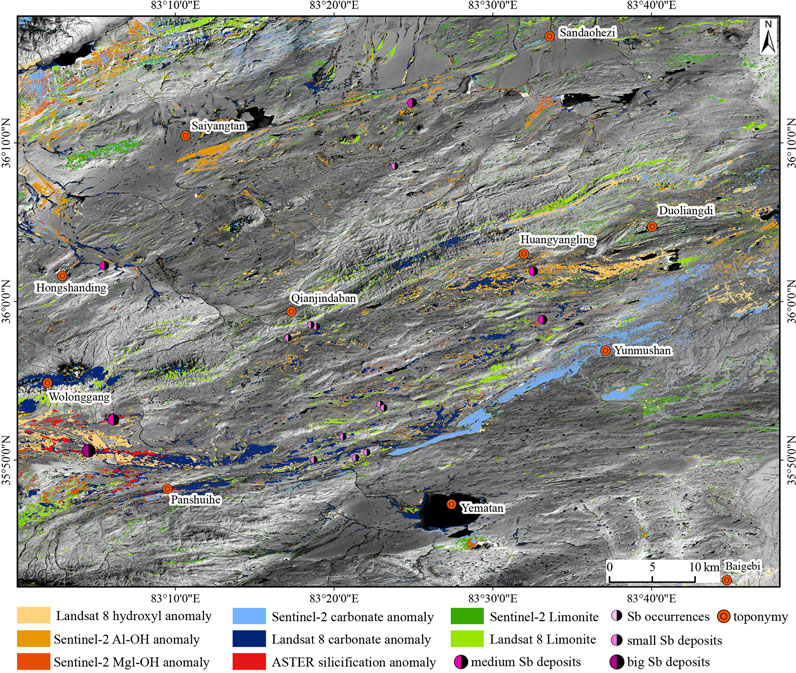
Figure 12. Comprehensive distribution map of alteration information.
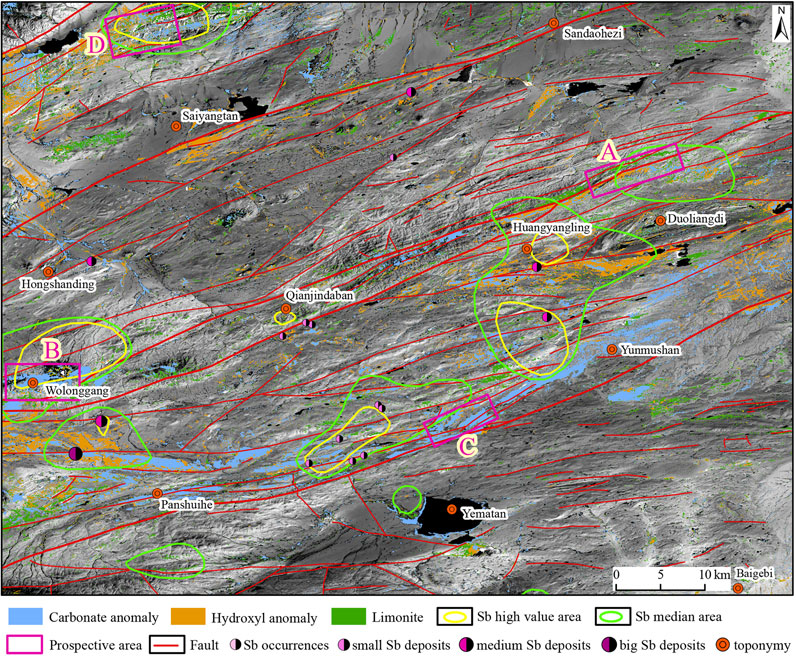
Figure 13. Multiple information superposition and antimony ore prospecting prediction (the Landsat 8 image is the base map).
4.4 Prospecting prediction of antimony ore
Mineralization is a complex process, and the use of a single type of information often fails to meet the needs of actual mineral prospecting and exploration. Therefore, combining remote sensing data, geological data, geochemical exploration data and other multivariate information for comprehensive mineral prediction can compensate for the limitations of a single dataset. In this study, we utilized remote sensing-derived fault information, remote sensing-derived alteration information, antimony geochemical anomaly information (from the Xinjiang Minfeng Huangyangling Antimony Mine Investigation Report, 2009), geological and mineralogical information and remote sensing-derived stratigraphic and lithologic information to comprehensively analyze the study area and define target areas for antimony ore prospecting.
The antimony ore in the Huangyangling area is mainly distributed in the middle Permian Huangyangling Formation, and the distribution of antimony ore is controlled by faults. Additionally, alteration anomalies are distributed along the fault zones. Based on our remote sensing extraction results and according to the conditions of antimony ore mineralization in Huangyangling, four target zones were identified in the study area (Figure 13): the northeastern part of Huangyangling (A), Wolonggang (B), the northern part of Yematan (C) and the northwestern part of Saiyangtan (D). The four target zones all have Sb anomalies; additionally, all have hydroxyl and carbonate alteration anomalies that are similar to those of areas with known antimony ore formation. Among the study area, target zones B, D and D show Sb anomalies. Additionally, target areas B and D contain high levels of Sb. Target areas A and B are located in the Wolonggang fault zone, target area C is located in the Panshuihe fault zone, and target area D is near the Kuyake fault. In summary, all four target areas have good prospects for mineralization.
5 Discussion
The Landsat 8 OLI data include six visible and near-infrared (VNIR) bands (including the panchromatic band B8) and three SWIR bands (including the cirrus band B9); thus, this dataset is rich in band information. Hence, the ability to extract information from these data is strong. Through the use of information enhancement methods, such as PCA, ICA, MNF color synthesis and band ratio, lithologic and stratigraphic information can be effectively extracted from the Landsat 8 images by establishing lithology and stratigraphy identification flags in the study area. Since the bands correspond to the characteristic spectral bands of limonite and hydroxyl alteration minerals, the data can be applied to the extraction of information on limonite and hydroxyl alterations. In addition, the data have a moderate spatial resolution, with three SWIR bands (including cirrus band B9) and an outstanding ability to interpret large- and medium-sized lineament information. The Sentinel-2 data have more near-infrared (NIR) bands than the Landsat 8 data and can be used to distinguish between magnesium hydroxyls, aluminum hydroxyls, and carbonate alteration information. The ASTER data include six SWIR bands; these bands are often used for extracting alteration information since most altered minerals have at least one pair of reflection peaks and absorption valleys in the SWIR region (Mujabar and Dajkumar, 2019; Son et al., 2019; Wang et al., 2020; Zhang X et al., 2023). Additionally, the ASTER data include five thermal infrared (TIR) bands, which are useful for the inversion of silica content and the extraction of silicified alteration information. The GF-6 data have fewer bands, but the panchromatic band has a high spatial resolution of 2 m; this resolution is suitable for the identification of small structures. By combining the above sources of remote sensing data, researchers can effectively extract geological and mineral information.
In this study, based on the Landsat 8 data, a series of processing steps, such as optimal band combination, PCA, and band ratio analysis, are performed; afterward, the lithological information is clearly enhanced (Figure 4), the boundaries are clearer, and the stratigraphic and lithologic information based on this interpretation can be subdivided more finely than that based on the data in 1:250,000 geologic maps. Moreover, the boundaries of geologic bodies are more refined; this effectively solves the shortcomings from previous geological mapping, which was limited by the conditions encountered during field work. These findings reflect the effectiveness of extracting lithologic and stratigraphic information in the area based on remote sensing data combined with geological information. Based on the use of Landsat 8 and GF-6 data to extract fault structures in the study area, remote sensing-derived linear features are clearly observable in the image after image enhancement. However, not all linear features present in remote sensing images are formed by geological action. Therefore, we need to incorporate geologic information on the study area into the interpretation and identify these features based on established interpretation flags and existing geologic data. Using the Landsat 8 and Sentinel-2 data combined with PCA and the band ratio method, we extracted information on limonite, Mg-OH, Al-OH, and carbonate alteration in the study area. Moreover, based on the ASTER data, we extracted information on carbonate and silicified alteration in the Wolonggang mining area. Considering the above alteration information extraction results, the overall spatial distribution trend along the fault zones and the high degree of coincidence with known deposits (occurrences) indicate the accuracy of the extraction of the alteration information. In this study, different remote sensing data and different methods are used to extract the same type of alteration information, and the spatial distributions are generally the same, indicating the effectiveness of the extraction.
The Permian Huangyangling Formation is the possible source of antimony ore in this area, and the antimony ore is mostly distributed in the first member of the formation, where gray‒brown rocky sandstone is interbedded with muddy siltstone and mudstone. The distribution of antimony ore in the area is related to the fault structure. Large-scale NE-oriented faults acted as channels for ore-bearing hydrothermal fluid transport, and secondary faults, joints and fissures provided space for the formation of the antimony ore body. For instance, the Wolonggang antimony mine is related to NE-trending faults and secondary NE‒SW faults, joints and fissures; the Huangyangling antimony mine and Panshuihe antimony mine are related to nearly E‒W reverse faults and secondary NE‒SW faults, joints and fissures. In general, the NE–SW-trending secondary joints and fissures in the area are favorable sites for antimony ore mineralization (Yang et al., 2013; Yan et al., 2016; Wang et al., 2022). Therefore, remote sensing extraction of the stratigraphy, lithology and fault structure in the study area has practical significance for identifying antimony ore in the area. The antimony mineralization in the district is accompanied by evident silicification, carbonatization and mudification; these are direct signs of ore in the district. The hydroxyl and carbonate alteration anomalies obtained by Landsat 8 and Sentinel-2 are highly consistent with the distribution ranges of ore bodies, and the extraction effect is good (Figure 12). The distribution of the limonite anomalies is more dispersed, and development zones in the central part of the district with a strip-like distribution and development zones in the northwestern part of the district are observed (Figure 8). The overlaying of alteration information shows that the extraction of hydroxyl and carbonate alteration information has certain significance for the distribution of antimony ore. Comprehensive remote sensing fault and alteration information, combined with Sb geochemical exploration anomaly information and other favorable factors for mineralization, can guide further exploration of antimony ore in this region.
In this study, multisource remote sensing data were comprehensively utilized to systematically extract geological and hydrothermal alteration information from the Huangyangling area. The advantages of each remote sensing dataset were fully utilized, with the following results: 1) the stratigraphic lithology was subdivided, 2) the boundaries of the geological bodies were clarified, 3) the lineaments on the small and medium scales were identified, and 4) the spatial distribution of the hydrothermal alteration information was preliminarily clarified. Presently, due to geographical and environmental limitations, the geology and minerals of the Huangyangling area are not effectively studied; based on the present study, more detailed basic information has been provided for geological study and resource exploration in this area. The remote sensing geological and mineral prospecting information were combined with antimony geochemical anomalies, and new antimony mineral prospecting target areas were defined. By combining new remote sensing technology and traditional geological methods, more reliable results can be obtained by synthesizing multiple favorable information on ore searching. This study further provides an important scientific basis and theoretical guidance for antimony ore exploration in this area.
Due to the quality limitations of the ASTER data, we selected only the Wolonggang mining area to extract the carbonate and silicified alteration information from ASTER data in this study; the Wolonggang mining area is a medium-to large-sized deposit. In subsequent remote sensing mineral search work, we plan to consider combining multispectral and hyperspectral remote sensing data to extract relevant the alteration information for the entire area. Moreover, by including hyperspectral data, the alteration minerals and alteration types in the study area could be further identified and classified (Xu et al., 2015; Abdolmaleki et al., 2017; Chen L. et al., 2023).
6 Conclusion
In this study, based on Landsat 8 OLI, Sentinel-2, ASTER, and GF-6 data, we extracted information on stratigraphy, lithology, faults, and hydrothermal alteration in the Huangyangling area. The existing geological data and the distribution of known antimony deposits (occurrences) in the area were compared, and the feasibility of extracting geological and hydrothermal alteration information via remote sensing was shown. Moreover, the antimony ore prospecting potential in the study area could be predicted by combining the multidimensional remote sensing-derived information on faults, alteration and geochemical prospecting; additionally, this method could be generalized and applied to the extraction of other regional geological information and mineral prospecting work. The main conclusions are as follows:
(1) After comprehensive remote sensing-extracted fault information, hydrothermal alteration information and antimony geochemical exploration anomalies in the study area were combined with remote sensing interpretation of stratigraphic and lithologic information; consequently, four target areas were identified for mineral exploration, representing the next step for antimony mineral exploration in the Huangyangling area.
(2) Based on Landsat 8 data, the stratigraphy and lithology of the study area were determined and compared with the 1:250,000 geological map. The lithology and stratigraphy were subdivided, and lithological boundaries were clearly defined. The lithology information extracted by remote sensing was reliable, and the lithology-related hue and texture information greatly contributed in identification of the lithology of the strata; moreover, an increase in lithology information could highlight the characteristics of different lithologies in stratigraphy, resulting in a better interpretation.
(3) In the study area, based on the combination of Landsat 8 and GF-6 medium- and high-spatial-resolution data, 145 faults were found. The main faults in the area are oriented NE, NNE, and ENE, and the main faults controlling the tectonic pattern of the entire area are oriented NE‒SW with nearly equal spacing.
(4) Based on Landsat 8 OLI, Sentinel-2, and ASTER data, limonite, as well as hydroxyl, carbonate, and silicified alteration information was extracted. Our results showed (Figure 12) that the alteration indicators were generally distributed along the fault zones; furthermore, the distribution of hydroxyl and carbonate alteration anomalies was important for determining the location of antimony deposits. In this study, the extraction of alteration anomaly information from different datasets and through different methods played a role in mutual verification, which further verified the reliability of the extraction results.
Data availability statement
The original contributions presented in the study are included in the article/Supplementary Material, further inquiries can be directed to the corresponding author.
Author contributions
DW: Writing–original draft. JC: Writing–review and editing. XD: Writing–review and editing.
Funding
The author(s) declare financial support was received for the research, authorship, and/or publication of this article. This study was funded by the National Key Research and Development Program of China (2023YFC2906404).
Acknowledgments
We would like to thank the Geological Survey Institute of the Xinjiang Uygur Autonomous Region for providing the basic geologic data. The authors would also like to thank the editor and reviewers for their constructive comments, which played a great role in improving this paper.
Conflict of interest
The authors declare that the research was conducted in the absence of any commercial or financial relationships that could be construed as a potential conflict of interest.
Publisher’s note
All claims expressed in this article are solely those of the authors and do not necessarily represent those of their affiliated organizations, or those of the publisher, the editors and the reviewers. Any product that may be evaluated in this article, or claim that may be made by its manufacturer, is not guaranteed or endorsed by the publisher.
Supplementary material
The Supplementary Material for this article can be found online at: https://www.frontiersin.org/articles/10.3389/feart.2024.1366727/full#supplementary-material
References
Abdolmaleki, M., Rasmussen, T. M., and Pal, M. K. (2020). Exploration of IOCG mineralizations using integration of space-borne remote sensing data with airborne geophysical data. Int. Archives Photogrammetry, Remote Sens. Spatial Inf. Sci. 3, 9–16. doi:10.5194/isprs-archives-xliii-b3-2020-9-2020
Abdolmaleki, M., Tabaei, M., Fathianpour, N., and Gorte, B. G. H. (2017). Selecting optimum base wavelet for extracting spectral alteration features associated with porphyry copper mineralization using hyperspectral images. Int. J. Appl. Earth Observation Geoinformation 58, 134–144. doi:10.1016/j.jag.2017.02.005
Abubakar, A. J., Hashim, M., and Pour, A. B. (2017). Spectral mineral mapping for characterization of subtle geothermal prospects using ASTER data. J. Phys. Conf. Ser. 852 (1), 012024. doi:10.1088/1742-6596/852/1/012024
Ahmad, L., Shah, M. T., and Khan, S. D. (2016). Reflectance spectroscopy and remote sensing data for finding sulfide-bearing alteration zones and mapping geology in Gilgit-Baltistan, Pakistan. Earth Sci. Inf. 9 (1), 113–121. doi:10.1007/s12145-015-0239-x
Ahmadi, H., and Uygucgil, H. (2021). Targeting iron prospective within the Kabul Block (SE Afghanistan) via hydrothermal alteration mapping using remote sensing techniques. Arabian J. Geosciences 14 (3), 1–22. doi:10.1007/s12517-020-06430-3
Ali, H. F., and Ghoneim, S. M. (2022). Satellite-based silica mapping as an essential mineral for clean energy transition: remote sensing mineral exploration as a climate change adaptation approach. J. Afr. Earth Sci. 196, 104683. doi:10.1016/j.jafrearsci.2022.104683
Amri, K., Rabai, G., Benbakhti, I. M., and Khennouche, M. N. (2017). Mapping geology in Djelfa District (Saharan Atlas, Algeria), using Landsat 7 ETM+ data: an alternative method to discern lithology and structural elements. Arabian J. Geosciences 10 (4), 87. doi:10.1007/s12517-017-2883-6
Ba, M. H., Ibouh, H., Lo, K., Youbi, N., Jaffal, M., Ernst, R. E., et al. (2020). Spatial and temporal distribution patterns of Precambrian mafic dyke swarms in northern Mauritania (West African craton): analysis and results from remote-sensing interpretation, geographical information systems (GIS), Google Earth ™ images, and regional geology. Arabian J. Geosciences 13 (5), 209. doi:10.1007/s12517-020-5194-2
Benaissi, L., Tarek, A., Tobi, A., Ibouh, H., Zaid, K., Elamari, K., et al. (2022). Geological mapping and mining prospecting in the Aouli inlier (Eastern Meseta, Morocco) based on remote sensing and geographic information systems (GIS). China Geol. 5 (0), 1–16. doi:10.31035/cg2022035
Chen, J., Cooke, D. R., Piquer, J., Selley, D., Zhang, L., and White, N. C. (2019). Hydrothermal alteration, mineralization, and structural geology of the zijinshan high-sulfidation Au-Cu deposit, fujian province, southeast China. Econ. Geol. 114 (4), 639–666. doi:10.5382/econgeo.4657
Chen, L., Sui, X., Liu, R., Chen, H., Li, Y., Zhang, X., et al. (2023). Mapping alteration minerals using ZY-1 02D hyperspectral remote sensing data in coalbed methane enrichment areas. Remote Sens. 15 (14), 3590. doi:10.3390/rs15143590
Chen, Q., Zhao, Z., Zhou, J., Zhu, R., Xia, J., Sun, T., et al. (2022). ASTER and GF-5 satellite data for mapping hydrothermal alteration minerals in the longtoushan Pb-Zn deposit, SW China. Remote Sens. 14 (5), 1253. doi:10.3390/rs14051253
Chen, W., Lv, J., and Han, X. (2009). Application of ETM∼+ data in antimony ore searching in Wolonggang-Huangyangling area,Xinjiang. Xinjiang Geol. (2), 180–183. (in Chinese with English abstract).
Chen C, C., Gao, L., Xie, F., Xia, F., and Li, S. (2023). Extracting hydrothermally altered information using WorldView-3 data: a case study of Huitongshan, NW Gansu, China. Front. Earth Sci. 11. doi:10.3389/feart.2023.1250591
Crosta, A. P., and Moore, J. M. (1989). Enhancement of Landsat Thematic Mapper imagery for residual soil mapping in SW Minais Gerais State, Brazil: a prospecting case history in Greenstone belt terrain.
Dong, R., Wang, H., Yan, Q., Guo, R., and Li, P. (2023). Geochronology and skarn mineralogy of the akesayi Fe deposit in the western kunlun, Xinjiang: implications for mineralization process. Ore Geol. Rev. 156, 105378. doi:10.1016/j.oregeorev.2023.105378
El Desoky, H. M., Shahin, T. M., Abu El-Leil, I., and Shafea, E. A. (2020). Geology and mapping of laterites, South Eastern Desert, Egypt: based on field and ASTER data approach. Geol. J. 55 (12), 8339. doi:10.1002/gj.4032
Eldosouky, A. M., El-Qassas, R. A. Y., Pour, A. B., Mohamed, H., and Sekandari, M. (2021). Integration of ASTER satellite imagery and 3D inversion of aeromagnetic data for deep mineral exploration. Adv. Space Res. 68 (9), 3641–3662. doi:10.1016/j.asr.2021.07.016
Eldosouky, A. M., Sehsah, H., Elkhateeb, S. O., and Pour, A. B. (2020). Integrating aeromagnetic data and Landsat-8 imagery for detection of post-accretionary shear zones controlling hydrothermal alterations: the Allaqi-Heiani Suture zone, South Eastern Desert, Egypt. Adv. Space Res. 65 (3), 1008–1024. doi:10.1016/j.asr.2019.10.030
Feng, T., Pang, Z., Jiang, W., Pei, G., and Li, H. (2021). Remote sensing abnormal extraction of hydroxyl alteration based on PCA method. IOP Conf. Ser. Earth Environ. Sci. 671, 012007. doi:10.1088/1755-1315/671/1/012007
Fu, Y. (2018). East Kunlun Huangyangling sb deposit geological characteristics and metallogenic regularity. World Nonferrous Met. (02), 131–132.
Gil, L. K. T. K., Martinez, D. V., and Saba, M. (2023). The widespread use of remote sensing in asbestos, vegetation, oil and gas, and geology applications. Atmosphere 14 (1), 172. doi:10.3390/atmos14010172
He, J., Zhou, Y., Wang, S., and Zhang, Y. (2017). Hydrothermal activities and related antimony mineralization in Shalagang mine of southern Tibet. Acta Geol. Sin. - Engl. Ed. 91 (1), 177–178. doi:10.1111/1755-6724.13244
Honarmand, M., Ranjbar, H., and Shahabpour, J. (2013). Combined use of ASTER and ALI data for hydrothermal alteration mapping in the northwestern part of the Kerman magmatic arc, Iran. Int. J. Remote Sens. 34 (6), 2023–2046. doi:10.1080/01431161.2012.731540
Huang, Y., Lin, B., and Zhang, L. (2017). Geological characteristics and genetic research of the nan-lead antimony deposit in the south of Xinjiang in Minfeng county. World Nonferrous Met. (22), 126–128.
Ibrahim, M., Kotelnikov, A., Podolko, P., and Kotelnikova, E. (2021). Remote sensing data for Geological mapping and gold prospecting of Inteet area, northern Sudan. EDP Sci. 258, 03009. doi:10.1051/e3sconf/202125803009
Jain, R., Bhu, H., and Purohit, R. (2024). Airborne imaging spectrometer dataset for spectral characterization and predictive mineral mapping using sub-pixel based classifier in parts of Udaipur, Rajasthan, India. Adv. Space Res. 73 (2), 1491–1516. doi:10.1016/j.asr.2022.08.032
Kampmann, T. C., Jansson, N. F., Stephens, M. B., Majka, J., and Lasskogen, J. (2017). Systematics of hydrothermal alteration at the falun base metal sulfide deposit and implications for ore genesis and exploration, bergslagen ore district, fennoscandian shield, Sweden. Econ. Geol. 112 (5), 1111–1152. doi:10.5382/econgeo.2017.4504
Kaufmann, A. B., Lazarov, M., Weyer, S., Stevko, M., Kiefer, S., and Majzlan, J. (2023). Changes in antimony isotopic composition as a tracer of hydrothermal fluid evolution at the Sb deposits in Pezinok (Slovakia). Miner. Deposita 59, 559–575. doi:10.1007/s00126-023-01222-7
Lai, Y., Gong, D., Zhou, Y., and Zhou, J. (2015). Ore characteristics and genesis of Sb ore deposit in kushui lake, Minfeng county, Xinjiang. Northwest. Geol. 48 (3), 280–288.
Leverington, D. W., and Moon, W. M. (2012). Landsat-TM-based discrimination of lithological units associated with the purtuniq ophiolite, quebec, Canada. Remote Sens. 4 (5), 1208–1231. doi:10.3390/rs4051208
Li, J., Li, P., Yan, Q., Wang, D., Ren, G., and Ding, X. (2023). Geology and mineralization of the Songpan-Ganze-West Kunlun pegmatite-type rare-metal metallogenic belt in China: an overview and synthesis. Sci. China-Earth Sci. 66 (8), 1702–1724. doi:10.1007/s11430-022-1084-x
Li, Y. (2021). Metallogenic prediction of metal minerals based on remote sensing technology. J. Phys. Conf. Ser. 1852 (2), 022075. doi:10.1088/1742-6596/1852/2/022075
Mahdi, A. M., Eldosouky, A. M., Khateeb, S. O. E., Youssef, A. M., and Saad, A. A. (2022). Integration of remote sensing and geophysical data for the extraction of hydrothermal alteration zones and lineaments; Gabal Shilman basement area, Southeastern Desert, Egypt. J. Afr. Earth Sci. 194, 104640. doi:10.1016/j.jafrearsci.2022.104640
Malainine, C.-E., Raji, O., Ouabid, M., Khouakhi, A., Bodinier, J.-L., Laamrani, A., et al. (2022). An integrated ASTER-based approach for mapping carbonatite and iron oxide-apatite deposits. Geocarto Int. 37 (22), 6579–6601. doi:10.1080/10106049.2021.1953617
Mohamed Taha, A. M., Xi, Y., He, Q., Hu, A., Wang, S., and Liu, X. (2023). Investigating the capabilities of various multispectral remote sensors data to map mineral prospectivity based on random forest predictive model: a case study for gold deposits in hamissana area, NE Sudan. Minerals 13 (1), 49. doi:10.3390/min13010049
Mohy, H., Abou El-Magd, I., and Basta, F. F. (2016). Newly improved band ratio of ASTER data for lithological mapping of the fawakhir area, central eastern desert, Egypt. J. Indian Soc. Remote Sens. 44 (5), 735–746. doi:10.1007/s12524-015-0539-0
Moradpour, H., Paydar, G. R., Feizizadeh, B., Blaschke, T., Hossain, M. S., Valizadeh Kamran, K., et al. (2021). Fusion of ASTER satellite imagery, geochemical and geology data for gold prospecting in the Astaneh granite intrusive, West Central Iran. Int. J. Image Data Fusion 13 (1), 71–94. doi:10.1080/19479832.2021.1915395
Mujabar, P. S., and Dajkumar, S. (2019). Mapping of bauxite mineral deposits in the northern region of Saudi Arabia by using Advanced Spaceborne Thermal Emission and Reflection Radiometer satellite data. Geo-Spatial Inf. Sci. 22 (1), 35–44. doi:10.1080/10095020.2018.1530857
Mulja, T., and Heriawan, M. N. (2022). The Miwah high sulphidation epithermal Au-Ag deposit, Aceh, Indonesia: dynamics of hydrothermal alteration and mineralisation interpreted from principal component analysis of lithogeochemical data. Ore Geol. Rev. 147, 104988. doi:10.1016/j.oregeorev.2022.104988
Ninomiya, Y., and Fu, B. (2017). Wide area lithologic mapping with ASTER thermal infrared data: case studies for the regions in/around the Pamir Mountains and the Tarim basin. IOP Conf. Ser. Earth Environ. Sci. 74 (1), 012006. doi:10.1088/1755-1315/74/1/012006
Osinowo, O. O., Gomy, A., and Isseini, M. (2021). Mapping hydrothermal alteration mineral deposits from Landsat 8 satellite data in pala, mayo kebbi region, southwestern Chad. Sci. Afr. 11, e00687. doi:10.1016/j.sciaf.2020.e00687
Ousaid, L., El Amrani, M., Hahou, Y., Ben Atmane, M., Aafir, Z., Diani, K., et al. (2023). Prediction of new polymetallic mineralization prospectivity zones using a combination of remote sensing, geology, and geochemistry data in the northeastern part of the Saghro inlier, Moroccan Anti-Atlas belt. Environ. Earth Sci. 82 (24), 584. doi:10.1007/s12665-023-11285-4
Peyghambari, S., and Zhang, Y. (2021). Hyperspectral remote sensing in lithological mapping, mineral exploration, and environmental geology: an updated review. J. Appl. Remote Sens. 15 (3). doi:10.1117/1.Jrs.15.031501
Pour, A. B., Hashim, M., and van Genderen, J. (2013). Detection of hydrothermal alteration zones in a tropical region using satellite remote sensing data: bau goldfield, Sarawak, Malaysia. Ore Geol. Rev. 54, 181–196. doi:10.1016/j.oregeorev.2013.03.010
Pour, A. B., Park, Y., Park, T.-Y. S., Hong, J. K., Hashim, M., Woo, J., et al. (2018). Regional geology mapping using satellite-based remote sensing approach in Northern Victoria Land, Antarctica. Polar Sci. 16, 23–46. doi:10.1016/j.polar.2018.02.004
Prabhakar, K., Dhananjaya Rao, E. N., Lakshmi Venkatesh, A., Ankita Varma, N., and Aruna, Ch. (2024). Improving lineament mapping using RISAT-1 SAR data, Nagpur and surrounding area in central India. Data brief, 52 109939–109939. doi:10.1016/j.dib.2023.109939
Rowan, L. C., Simpson, C. J., and Mars, J. C. (2004). Hyperspectral analysis of the ultramafic complex and adjacent lithologies at Mordor, NT, Australia. Remote Sens. Environ. 91 (3-4), 419–431. doi:10.1016/j.rse.2004.04.007
Shahriari, H., Ranjbar, H., and Honarmand, M. (2013). Image segmentation for hydrothermal alteration mapping using PCA and concentration–area fractal model. Nat. Resour. Res. 22 (3), 191–206. doi:10.1007/s11053-013-9211-y
Shebl, A., and Csámer, A. (2021). Lithological, structural and hydrothermal alteration mapping utilizing remote sensing datasets: a case study around Um Salim area, Egypt. IOP Conf. Ser. Earth Environ. Sci. 942, 012032. doi:10.1088/1755-1315/942/1/012032
Shirmard, H., Farahbakhsh, E., Muller, R. D., and Chandra, R. (2022). A review of machine learning in processing remote sensing data for mineral exploration. Remote Sens. Environ. 268, 112750. doi:10.1016/j.rse.2021.112750
Sillitoe, R. H. (2015). Geological criteria for porphyry copper exploration. Acta Geol. Sin. 88 (2), 597–598. doi:10.1111/1755-6724.12374_47
Simusokwe, M., Watanabe, Y., and Echigo, T. (2021). Hydrothermal alteration and Cu-Co mineralization at the peripheral zone (Target H) of the Kitumba iron-oxide copper-gold system, Mumbwa District, Zambia. Resour. Geol. 71 (4), 409–435. doi:10.1111/rge.12274
Son, Y.-S., Kim, K.-E., Yoon, W.-J., and Cho, S.-J. (2019). Regional mineral mapping of island arc terranes in southeastern Mongolia using multi-spectral remote sensing data. Ore Geol. Rev. 113, 103106. doi:10.1016/j.oregeorev.2019.103106
Swayze, G. A., Clark, R. N., King, T. V. V., Gallagher, A. J., and Calvin, W. M. (1993). The U. S. Geological Survey, digital spectral library: version 1: 0.2 to 3.0 μm. Bulletin of the American Astronomical Society.
Tagwai, M. G., Jimoh, O. A., Shehu, S. A., and Zabidi, H. (2023). Application of GIS and remote sensing in mineral exploration: current and future perspectives. World J. Eng. doi:10.1108/wje-09-2022-0395
Testa, F. J., Villanueva, C., Cooke, D. R., and Zhang, L. (2018). Lithological and hydrothermal alteration mapping of epithermal, porphyry and tourmaline breccia districts in the Argentine andes using ASTER imagery. Remote Sens. 10 (2), 203. doi:10.3390/rs10020203
Wang, F., Bowen, B. B., Seo, J., and Michalski, G. (2018). Laboratory and field characterization of visible to near-infrared spectral reflectance of nitrate minerals from the Atacama Desert, Chile, and implications for Mars. Am. Mineralogist 103 (2), 197–206. doi:10.2138/am-2018-6141
Wang, X., Li, X., Ma, H., An, G., and Wang, H. (2022). Geologic characteristics and genesis of antimony ore deposit in Panshuihe, Minfeng County, Xinjiang, China. China Manganese Ind. 40 (3), 76–80. (in Chinese with English abstract). doi:10.14101/j.cnki.issn.1002-4336.2022.03.012
Wang, Y., Lin, Q., Wang, Q., and Li, S. (2012). Study of using regional mineral spectra library and section noise filtering to improve mineral identification accuracy. Spectrosc. Spectr. Analysis 32 (8), 2065–2069. doi:10.3964/j.issn.1000-0593(2012)08-2065-05
Wang, Z., Zhou, C., and Qin, H. (2020). Detection of hydrothermal alteration zones using ASTER data in Nimu porphyry copper deposit, south Tibet, China. Adv. Space Res. 65 (7), 1818–1830. doi:10.1016/j.asr.2020.01.008
Xing, L., Li, W., Zang, M., Yang, F., Liu, J., Shi, Y., et al. (2023). Genesis and mineralization implications of dissolution-regrowth pyrite in the large Qukulekedong Au-Sb deposit, East Kunlun, NW China. Ore Geol. Rev. 157, 105448. doi:10.1016/j.oregeorev.2023.105448
Xu, K., Wang, X., Kong, C., Feng, R., Liu, G., and Wu, C. (2019). Identification of hydrothermal alteration minerals for exploring gold deposits based on svm and PCA using ASTER data: a case study of gulong. Remote Sens. 11 (24), 3003. doi:10.3390/rs11243003
Xu, Y., Ma, H., Meng, P., and Yang, M. (2015). Extraction of the information of altered minerals and altered rocks from hyperspectral imagery of vegetation covered area. Acta Geosci. Sin. 36 (2), 229–236. doi:10.3975/cagsb.2015.02.12
Yan, L., Yang, Y., Zhang, W., Ma, F., Cheng, L., and Lu, X. (2016). Searching potential of wolonggang-huangyangling antimony metallogenic belt in Minfeng county, Xinjiang, China. Geol. Bull. China 35 (9), 1536–1543. (in Chinese with English abstract).
Yang, W., Zhou, J., Zhuang, D., and Ren, Y. (2013). A progress of region geochemical exploration of metallogenic belt from west kunlun to altun ranges in Xinjiang. Northwest. Geol. 46 (1), 110–118.
Zaghlol, K., Sakran, S., El-Sharkawi, M., and Said, A. (2021). Petrographical, structural, and remote sensing–based mapping of Gebel Atawi area, central Eastern Desert, Egypt. Arabian J. Geosciences 14 (14), 1368. doi:10.1007/s12517-021-07547-9
Zhang, L., Li, X., Wang, G., Wang, M., Yang, W., Zhang, L., et al. (2019). Hydrothermal alteration and mineral chemistry of the giant Baiyanghe Be-U deposit in Xinjiang, northwest China: implications for its mineralization. Ore Geol. Rev. 111, 102972. doi:10.1016/j.oregeorev.2019.102972
Zhang, X., Zhao, Z., Chen, Q., Chai, W., Li, Z., Zhang, G., et al. (2023). Mapping hydrothermal alteration of the Pulang porphyry copper deposit, SW China, using ASTER and ZY1-02D satellite data. Ore Geol. Rev. 161, 105605. doi:10.1016/j.oregeorev.2023.105605
Zhang, Z., Li, N., Huang, B., Fan, X., Zhang, H., and Shi, H. (2023). Research on the progress of antimony ore mining and main metallogenic pattern in the area of Xiaoerkule, Central Kunlun Mountains. Xinjiang Geol. 41 (208), 48.
Zhao, Z., Zhou, J., Lu, Y., Chen, Q., Cao, X., He, X., et al. (2021). Mapping alteration minerals in the Pulang porphyry copper ore district, SW China, using ASTER and WorldView-3 data: implications for exploration targeting. Ore Geol. Rev. 134, 104171. doi:10.1016/j.oregeorev.2021.104171
Zheng, B., Zhu, Y., An, F., Huang, Q., and Qiu, T. (2015). As-Sb-Bi-Au mineralization in the Baogutu gold deposit, Xinjiang, NW China. Ore Geol. Rev. 69, 17–32. doi:10.1016/j.oregeorev.2015.01.019
Zheng, Y., Wang, D., Yi, J., Yu, Z., Jiang, Z., Li, X., et al. (2022). Antimony mineralization and prospecting orientation in the north himalayan metallogenic belt, Tibet. Earth Sci. Front. 29 (1), 200–230. doi:10.13745/j.esf.sf.2021.8.5
Zhong, F., Wang, L., Wang, K., Liu, J., Zhang, Y., Li, H., et al. (2023). Mineralogy and geochemistry of hydrothermal alteration of the Mianhuakeng uranium deposit in South China: implications for mineralization and exploration. Ore Geol. Rev. 160, 105606. doi:10.1016/j.oregeorev.2023.105606
Zhou, Y., Chen, S., Li, L., Fan, F., Zhang, H., Chen, J., et al. (2023). Mapping hydrothermal alteration of the Au-Cu deposits in the Zhenghe magmatic-hydrothermal mineralization system, SE China, using Short Wavelength Infrared (SWIR) reflectance spectroscopy. J. Geochem. Explor. 244, 107113. doi:10.1016/j.gexplo.2022.107113
Keywords: Huangyangling antimony deposit, multisource remote sensing, geological information extraction, hydrothermal alteration, ore prediction
Citation: Wang D, Chen J and Dai X (2024) Extracting geological and alteration information and predicting antimony ore based on multisource remote sensing data in Huangyangling, Xinjiang. Front. Earth Sci. 12:1366727. doi: 10.3389/feart.2024.1366727
Received: 07 January 2024; Accepted: 08 March 2024;
Published: 04 April 2024.
Edited by:
Claudia Belviso, National Research Council (CNR), ItalyReviewed by:
Ahmed M. Eldosouky, Suez University, EgyptŁukasz Kruszewski, Polish Academy of Sciences, Poland
Copyright © 2024 Wang, Chen and Dai. This is an open-access article distributed under the terms of the Creative Commons Attribution License (CC BY). The use, distribution or reproduction in other forums is permitted, provided the original author(s) and the copyright owner(s) are credited and that the original publication in this journal is cited, in accordance with accepted academic practice. No use, distribution or reproduction is permitted which does not comply with these terms.
*Correspondence: Jianping Chen, M3NAY3VnYi5lZHUuY24=