 Rhiannon Rees1,2
 Emma J. Watts
 Carolina Pagli
 Derek Keir
- 1School of Ocean and Earth Science, University of Southampton, Southampton, United Kingdom
- 2Environment Agency, Bristol, United Kingdom
- 3Department of Geography, Swansea University, Swansea, United Kingdom
- 4Department of Earth Sciences, University of Pisa, Pisa, Italy
- 5Department of Earth Sciences, University of Florence, Florence, Italy
Along-rift variations in the stage of continental separation are observed in the northern East African Rift System (EARS), from magma-assisted continental rifting in the Main Ethiopian Rift (MER) to nascent oceanic spreading in Afar. However, the implications on spatial and temporal changes in mantle melting and melt evolution remain poorly understood. Given that the EARS is the longest and best-exposed example of continental rifting in the world, the MER and Afar are an ideal place to investigate magmatism and volcanism in late-stage continental rifts. Here, we focus on the Adda’do Magmatic Segment (AMS) in the northernmost sector of the MER, that has experienced the most prolonged lithospheric thinning. We present new trace element data and petrographic observations from around 50 samples, and combine these with geochemical modelling to investigate depth of melt origin and melt evolution, in the AMS. Using mixing modelling of garnet lherzolite and spinel lherzolite mantle peridotite sources, we show that the AMS magmas are produced from a relatively deep source with 10%–60% garnet lherzolite, corresponding to depths of around 85 km, and generated by approximately 4%–9.5% partial melting of the mantle. We find no significant variation of these characteristics with either sample age or sample location at the AMS, suggesting no systematic temporal variations occurred in either the depth or the degree of melting within a single magmatic segment. However, on a regional scale, depth of melting is between that interpreted for the MER and northern Afar, implicating the stage of rift evolution and consequent degree of lithospheric thinning as a major control. MELTS modelling of the samples indicates that the observed variations in sample compositions in the AMS can be explained predominantly by fractional crystallisation, with negligible crustal contamination in the basaltic samples. Crustal contamination may play a greater role in the composition of intermediate and evolved samples in the AMS.
1 Introduction
The MER and Afar are the two northernmost sections of the East African Rift System (EARS), which at 3,000 km long is the world’s longest active continental rift system (e.g., Ebinger, 2005; Corti, 2009; Corti et al., 2013). Together, the MER and Afar represent the final stages of transition from continental rifting to a proto-oceanic ridge system (Ebinger, 2005; Ayele et al., 2007; Nicotra et al., 2021) (Figure 1), making this region an ideal place to study the characteristics of volcanism associated with late-stage continental rifting. Recent and current volcanic activity in the MER and Afar is generally confined to localised magmatic segments respectively (Barberi and Varet, 1970; Hayward and Ebinger, 1996; Mazzarini et al., 2013; Pagli et al., 2019), and includes both caldera-forming silicic centres (such as Kone, Aluto and Gedemsa in the MER; Peccerillo et al., 2003; Rampey, 2005; Hutchison et al., 2016), basaltic axial ranges (e.g., Erta Ale and Manda Harraro in Afar; Barberi and Varet, 1970; Barrat et al., 2003), and rift-controlled basaltic fields associated with monogenetic centres (Abebe et al., 2007) (Figure 1).

Figure 1. Generalised geological setting of the Ethiopian rift and Afar. a) simplified map of major rift border faults, magmatic segments and key volcanoes. Da is Danakil microplate and the TGD is the Tendaho Goba’ad discontinuity, and tectonic structure that is considered to separate the Red Sea and Gulf of Aden rifts in central, north and east Afar, from the northern end of the MER in southern Afar. Arrows are simplified GNSS measured plate motions with those of the Danakil microplate and Arabia from Viltres et al. (2020), and those from Somalia-Nubia from Kogan et al. (2012). b) is a simplified version of classical in-rift geological map of Afar and the MER showing the major rift volcanic units (modified after Varet, 1975; Rees et al., 2023). The geology of the plateau regions are not shown.
Regional studies and detailed geochemical investigations of Quaternary volcanic systems are available across the MER and Afar (e.g., MER: Giordano et al., 2014; Ayalew et al., 2016; Hutchison et al., 2016; Siegburg, 2019; Afar: Barrat et al., 1998; Ferguson et al., 2013; Field et al., 2013; Watts et al., 2023; Tortelli et al., 2021; Tortelli et al.,2022; Tortelli et al.,2024). These geochemical studies have revealed a wide range in estimates of depth of melting across the MER and Afar region. The Dabbahu Magmatic Segment (central–north Afar) and Erta Ale Magmatic Segment (Danikil Depression, northern Afar) show evidence for melt generation at depths of 80–95 km and 65–85 km, respectively (Ferguson et al., 2013; Watts et al., 2023), whilst estimates from basalts from the Ethiopian Plateau are somewhat shallower at 30–60 km (Ayalew et al., 2019). In the MER, estimates for melt generation depth are higher, at around 110 km (Chiasera et al., 2018; Chiasera et al., 2021). The range of melting depths observed across the MER and Afar suggest that the depth of melt decreases with the stage of rift evolution. However current melt depth estimate data across the region lacks the resolution to confirm this.
In particular, there are no detailed volcanological and geochemical studies in Southern Afar where the MER propagates into Afar – a key area where rift history and amount of plate stretching changes (Figure 1). Consequently, very little is currently known about the conditions of magma generation and evolution in this region, and how these may have varied both spatially and temporally. In this study, we present trace element and petrographic data from three volcanoes in the Adda’do Magmatic Segment (AMS) in southernmost Afar (Figures 1, 2), to constrain the depth of melting and melt fraction involved in melt generation in the AMS, and to investigate how these may vary by stage of rift evolution. We use these petrographic and trace data in conjunction with major element data and geochemical modelling to investigate the evolution from basaltic to intermediate and silicic compositions in the AMS.
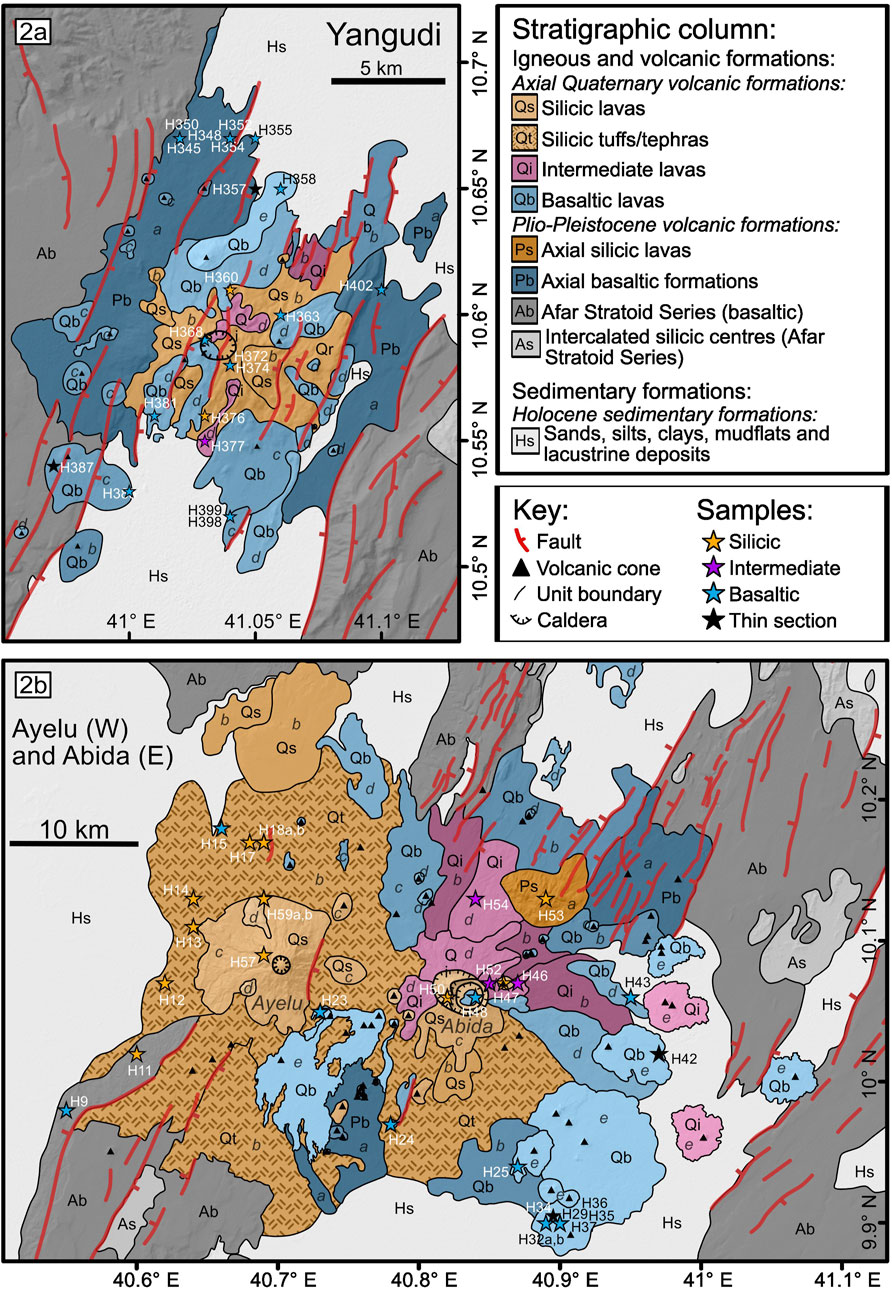
Figure 2. Geological maps of the volcanoes in study region along with sample locations. (a) is the geological map of Yangudi and (b) of Ayelu – Abida (modified after Rees et al., 2023; Hayward and Ebinger, 1996). Lava flows and deposits are coloured by broad rock type and shaded according to relative chronology.
2 Geological background
2.1 The Main Ethiopian Rift and Afar
Rifting in Afar is thought to have started around ∼30 Ma from the NE directed extension of the Arabian plate from the rest of Africa (Wolfenden et al., 2004). On a regional scale, this rifting started around ∼35 Ma in the East of the Gulf of Aden, propagated to Afar by ∼30 Ma, followed by initiation of rifting in the Red Sea around 29–26 Ma (Zwaan et al., 2020). The triple junction tectonics only started later in the rift history. Initial rifting of the Somalian plate in an ∼ E-W direction away from Africa began in the central and southern parts of MER during the Miocene-Pliocene between 18 and 15 Ma (WoldeGabriel et al., 1990; Ebinger et al., 2000; Wolfenden et al., 2004). Starting ∼11 Ma, the MER then propagated northwards into southern Afar to form a triple junction (Wolfenden et al., 2004). Southern Afar has therefore experienced a complicated rift history of around 20 myrs of dominantly NE directed extension, followed by ∼10 myrs of mainly ∼ E-W extension (Tesfaye et al., 2003; Maestrelli et al., 2024). Extension of most of the MER and Afar is thought to have been initially controlled by displacement along boundary faults (e.g., Wolfenden et al., 2004; Erbello et al., 2022; Kebede et al., 2024). Since the Quaternary however, extension has predominantly focussed in a rift floor system of right-stepping en-echelon magmatic segments with small offset faults, aligned cones and volcanic centres (Ebinger and Casey, 2001; Agostini et al., 2011; Keir et al., 2015; Trippanera et al., 2015; Siegburg et al., 2020). Extension in the magmatic segments is thought to be dominated by episodic dyke intrusion and largely aseismic creep along extensional fault networks (e.g., Ebinger et al., 2010; Ferguson et al., 2013; Barnie et al., 2016; La Rosa et al., 2021; Siegburg et al., 2023; Keir et al., 2025).
Volcanic activity in the near Afar began at around 30 Ma with the eruption and rapid emplacement of Ethiopian–Yemen flood basalts believed to be related to the Afar plume (e.g., Ebinger et al., 1993; Hofmann et al., 1997; Pik et al., 1998; Kieffer et al., 2004) (Figure 1). This was concomitant with the onset of rifting in Afar region (Wolfenden et al., 2005), This emplacement was followed by a renewed increase in flood volcanism at around 10 Ma, with eruption of the Dahla Basalts and then since at ∼4.5–1 Ma by the Stratoid Series (e.g., Kidane et al., 2003; Tortelli et al., 2025). Since 0.65 Ma, volcanic activity within the MER has been restricted to distinct magmatic segments (e.g., Ebinger and Hayward, 1996; Chernet et al., 1998; Abebe et al., 2007; Corti, 2009). Similarly, in Afar, recent (since 0.6 Ma) volcanic activity is mainly confined to distinct axial rift zones and magmatic segments (e.g., Figure 1, in Barberi et al., 1972; Lahitte et al., 2003; Watts et al., 2020; Watts et al., 2025). Quaternary volcanism in the NMER and Southern Afar is characterised by predominantly bimodal basalt–rhyolite volcanism (Gasparon et al., 1993; Trua et al., 1999). Since the late Palaeogene, the proportion of basaltic volcanism relative to felsic volcanism in Afar has increased, reflecting increasing rift evolution (Deniel et al., 1994; Ayalew et al., 2006; 2016; 2019).
2.2 The Adda’do magmatic segment
The Adda’do Graben is in Southern Afar where the northern MER has propagated into Afar (Tesfaye et al., 2003), and is sometimes referred to as the northern MER – Southern Afar Transition Zone, e.g., Chernet et al., 1998), and is the youngest and most tectonically active graben in Southern Afar (Varet, 2017) (Figures 1, 2). During its early stages, the development of Afar was tectonically controlled by the opening of the Red Sea and the Gulf of Aden (at around 26–29 Ma and 35 Ma respectively; Wolfenden et al., 2005; Leroy et al., 2010; Zwaan et al., 2020), but since the development of the MER this region is characterised structurally and volcanically as the northernmost expression of the MER. The Adda’do Magmatic Segment (AMS) is formed of a group of three stratovolcanoes within this graben, Ayelu and Abida in the south and Yangudi in the north (Figure 2). Ayelu and Abida lie on a region of rift lateral offset at the southern end of the AMS, whilst Yangudi is situated approximately 60 km to the NNE within the centre of the rift (Figure 2). Several NNE-trending faults cut through Yangudi, whilst Ayelu and Abida are relatively un-faulted (Figure 2).
Like much of Afar and the MER, Quaternary volcanic activity in the AMS is dominated by bimodal volcanism (e.g., Trua et al., 1999; Abebe et al., 2007), although both Abida and Yangudi also have a small range of intermediate compositions (Rees et al., 2023). All three volcanoes are believed to have originated in the late Pliocene–Early Pleistocene with an initial base of predominantly basaltic lavas (47.5–54.2 wt% SiO2), which was followed by several cycles of mafic-to-felsic evolution (46.5–72.6 wt% SiO2), including large caldera-forming eruptions (Rees et al., 2023). All three volcanoes are believed to have been active throughout the Quaternary (Rees et al., 2023), with the most recent activity to the east of Abida believed to be only a few hundred years old (Global Volcanism Program and Venzke, 2023).
3 Data and methodology
3.1 Trace element geochemical analyses
A total of 47 rock samples from the Afar Repository collection at the University of Pisa (https://repositories.dst.unipi.it/index.php/afar-repositories) were chosen for trace element analysis by ICP-MS (sample names, locations, rock types, and trace element results are given in Table 1). The samples were crushed and sieved to obtain the 0.5–1 mm size fraction. Following this, they were then cleaned and ultrasonicated in deionized water to remove powder and dust. Samples were then dried at 85°C for 12 h and were handpicked under a microscope to remove weathered grains and non-rock material. The cleaned samples were then ground to a fine powder using an agate mortar and pestle, to eliminate contamination that could occur using a porcelain or metal grinder.
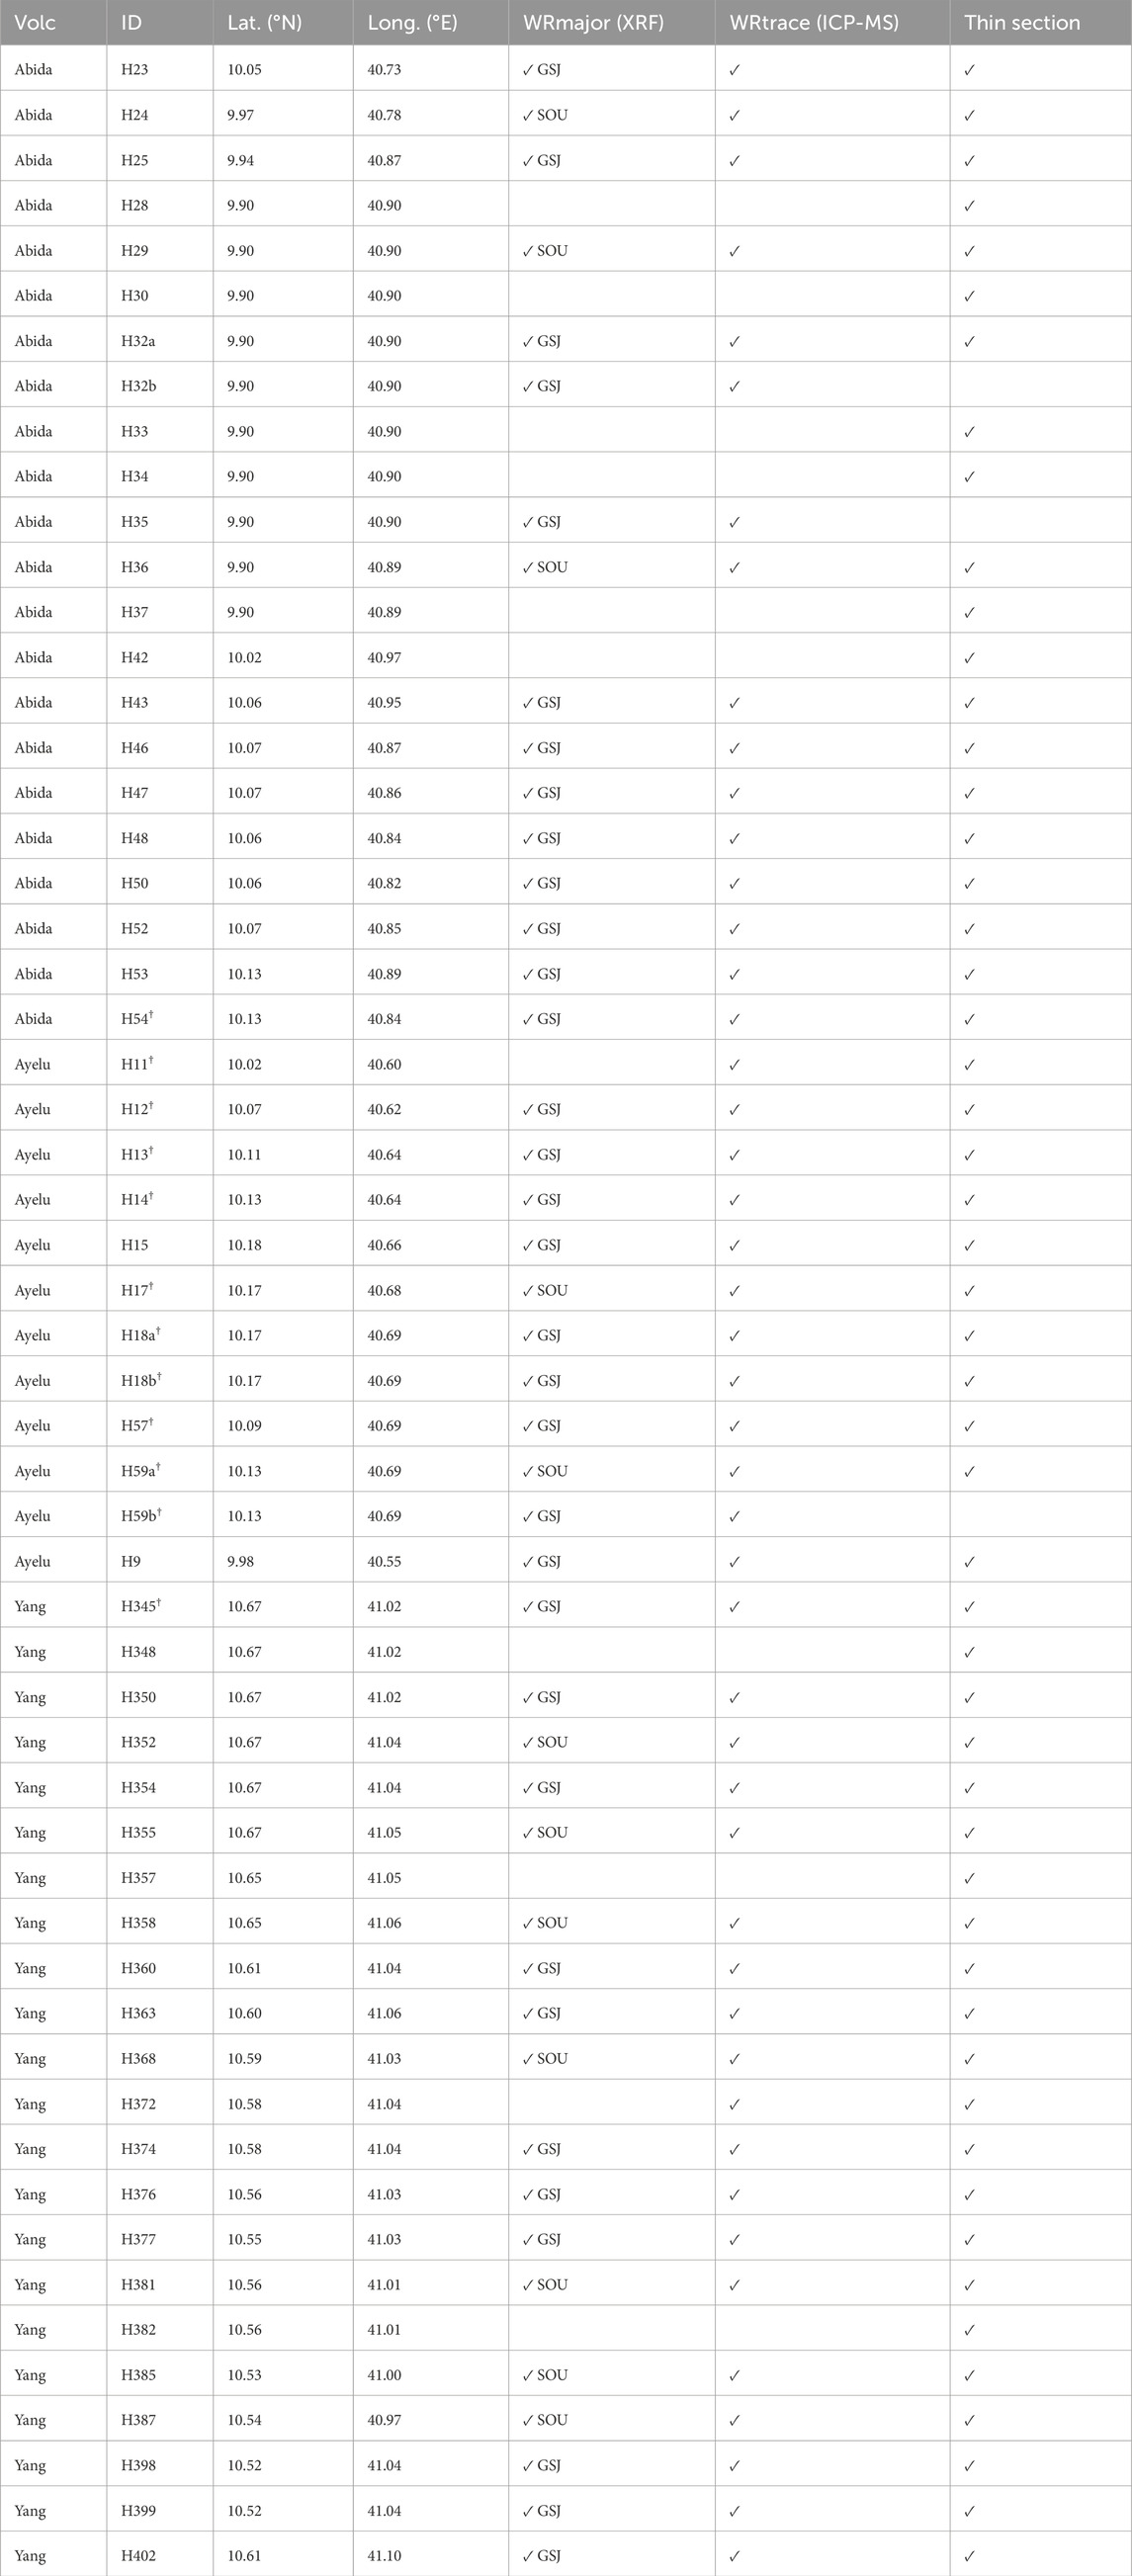
Table 1. Sample locations and indication of analyses conducted on them. Major elements analysis is published in Rees et al. (2023).
The powdered samples were then digested in sealed Savillex Teflon vials with a HNO3 HF mixture on a hotplate at 130°C for 24 h. The HNO3/HF was evaporated off, and the samples were refluxed in 6M HCl for another 24 h on a hotplate at 130°C. The 6M HCl was evaporated off, and the samples were redissolved in 6M HCl. Mother solutions were prepared by adding 6M HCl and MQ water (total 30 mL) to the dissolved samples. Daughter solutions were prepared using 0.5 mL of mother solution, diluted to 5 mL with 3% HNO3 (containing the internal standards In/Re/Be), resulting in an overall dilution factor of c. 4,000.
Whole rock trace element analyses were undertaken on the ThermoScientific XSeries2 quadrupole inductively coupled plasma mass spectrometer (ICP-MS) at the University of Southampton. Analytical standards and accuracy were monitored using international standards BCR-2, BHVO2, BIR-1, JA-2 and JB-3 (Supplementary Table S2). Accuracy relative to the reference values is typically less than <6% with the exception of Hf, Ta, U. Reproducibility is typically <4% with the exception of V, Cr, Co, Ni and Cu. Results in counts per second were processed with the calculated dissolution factors and blank corrections to calculate concentrations in ppm for the trace elements analysed.
3.2 Petrography
Petrographic observations of 51 thin section samples from the Afar Repository collection at the University of Pisa were undertaken using a Meiji MT9300 petrographic microscope. For each thin section, total percentage surface areas of groundmass, vesicles, and major phenocryst phases were estimated, and textural observations were recorded. Percentage area charts after Terry and Chilingar (1955) were used to aid and improve accuracy of percentage area estimates. Selected representative thin sections were photographed using an Olympus BX60 microscope with Plan Apo ×1.25 objective and Canon EOS 60D camera. Sample names and locations are given in Table 1 and shown in Figure 2.
4 Results
4.1 Petrography
Descriptions of the 51 thin section samples from Ayelu, Abida and Yangudi are provided below. In this work, the thin section samples have been grouped and described according to their major rock types (Supplementary Table S1; Figures 2, 3). For each thin section, total percentage surface areas of groundmass, vesicles, and major phenocryst phases were estimated, and textural observations were recorded. The Supplementary Material provides more detailed descriptions, with the thin sections grouped by volcano and their relative ages. A graphical summary of the whole-rock and phenocryst content for each of the thin sections analysed from Abida, Ayelu and Yangudi is provided in Figure 3, with representative photomicrographs provided in Figure 4.
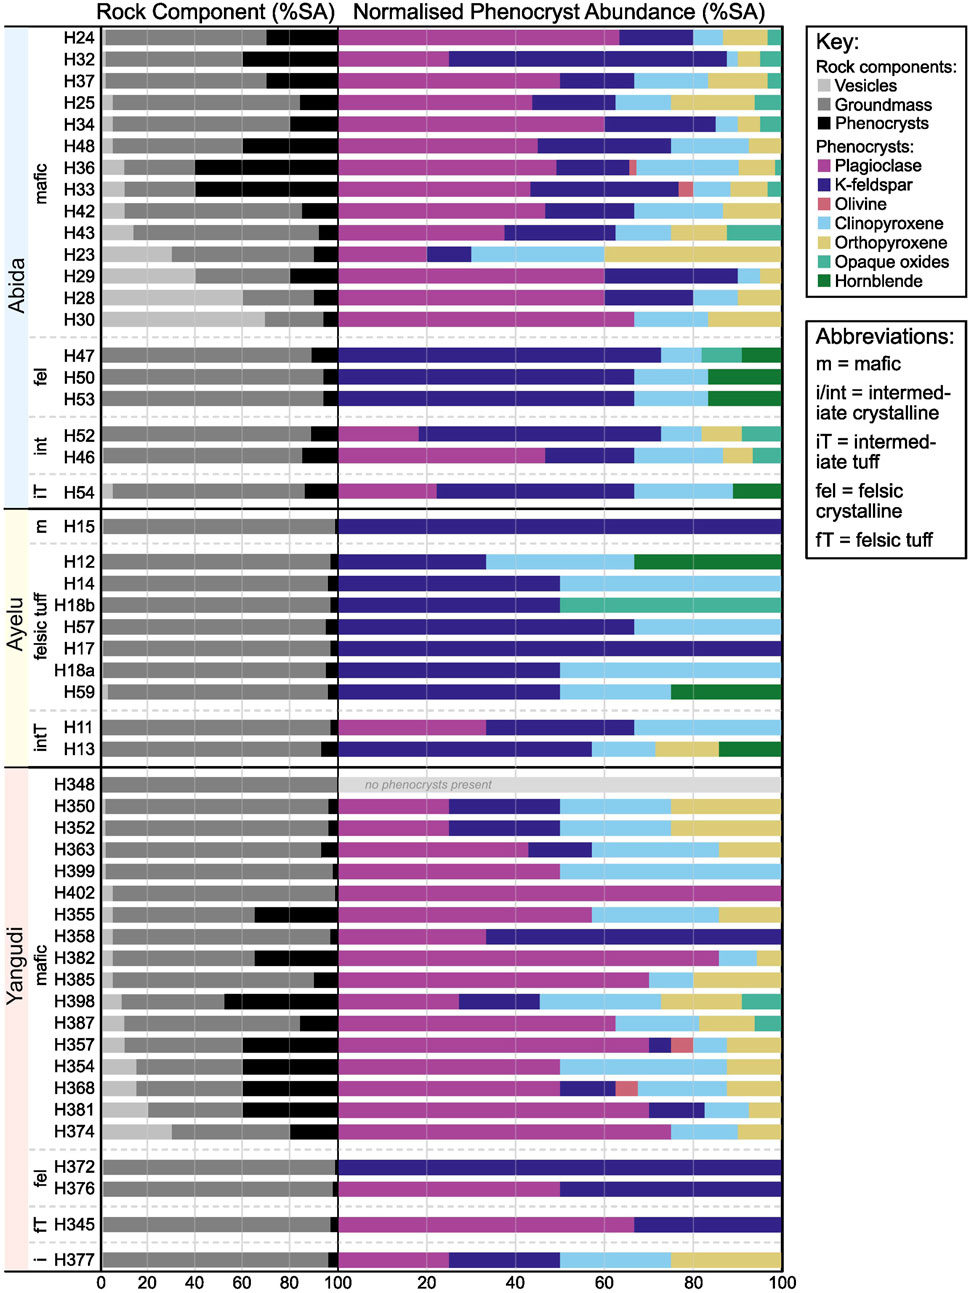
Figure 3. Graphical petrological overview of the whole-rock and phenocryst phase content of 51 thin sections from Ayelu, Abida and Yangudi. Thin sections are arranged by volcano, and by rock type (basalt, crystalline intermediate, intermediate tuff, rhyolite/microgranite and felsic tuff). Rock chemistry was determined via major element analysis (Rees et al., 2023). Percentage surface area (%SA) modal abundances of rock components (vesicles, groundmass and phenocrysts) are provided.
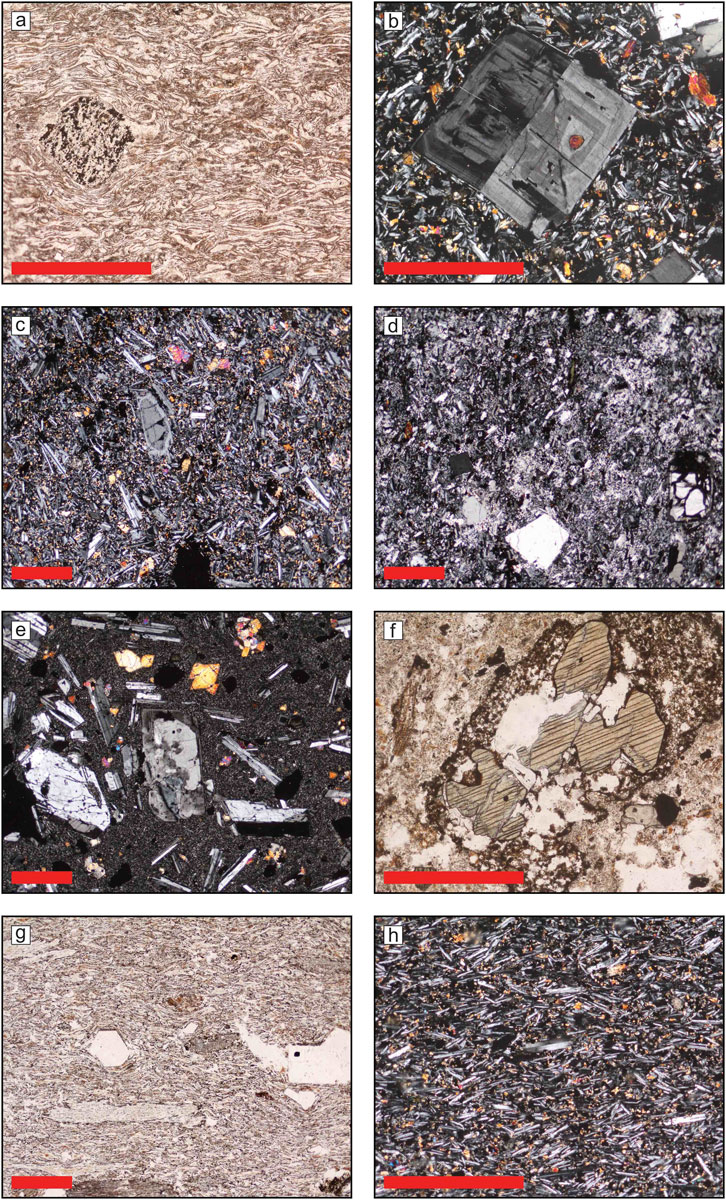
Figure 4. Representative thin section photomicrographs from Abida, Ayelu and Yangudi, selected to showcase the variability in petrography from the Adda’do Graben volcanoes. (a) H17: Welded tuff from a distal ignimbrite, N Ayelu. (b) H24: Porphyritic basalt from a recent (Quaternary) distal basaltic lava flow to the SE of Abida, highlighting a large plagioclase phenocryst showing oscillatory zoning. (c) H32: fine grained porphyritic basalt from a very recent (Quaternary/historical) basaltic lava flow to the SE of Abida. (d) H47: holocrystalline rhyolite from the summit of Abida. (e) H48: porphyritic basalt with a very fine-grained groundmass from the summit of Abida. (f) H54: trachytic ashy tuff from the northern flank of Abida. (g) H57: Welded tuff from near the summit of Ayelu. (h) H350: fine grained basalt from a recent (Quaternary) distal basaltic flow to the north of Yangudi. Red scale bar in all photos is 1 mm. Please refer to Table 1 for the coordinates of the samples.
4.1.1 Mafic crystalline rocks (basalts and microgabbros)
Including samples: H24, H32, H37, H25, H34, H48, H36, H33, H42, H43, H23, H29, H28, H30 (Abida); H15 (Ayelu); H348, H350, H352, H363, H399, H402, H355, H358, H382, H385, H398, H387, H357, H354, H368, H381, H374 (Yangudi).
The mafic crystalline rocks from Ayelu, Abida and Yangudi are variably vesicular (0%–30%, mean 8%; apart from glassy samples H28, H29 and H30 from Abida with 40%–70% vesicles, mean 56%). The majority are porphyritic (phenocryst content 0%–60%, mean 22%), with over three-quarters of the samples containing at least 5% phenocrysts by surface area (Figures 4b,e). Groundmass textures are generally fine to very fine grained microcrystalline, and where visible appear to be formed predominantly of plagioclase feldspar, pyroxene, opaque oxides, and interstitial glassy material. Three of the samples (H28, H29 and H30 from Abida) have glassy groundmasses, and four of the samples have a coarse microgabbroic texture (porphyritic microgabbros H33 and H36 from Abida, and holocrystalline microgabbros H15 and H348 from Ayelu and Yangudi).
The dominant phenocryst phase in all but two of the samples is plagioclase, which makes up an average of 49% of the phenocrysts present (Supplementary Table S1). Plagioclase phenocrysts are generally euhedral to subhedral, although in some samples (H32, H33, H36, H37) there is notable evidence of zoning, pitting and rim resorption, particularly in larger (>1.5 mm) phenocrysts (Figure 4c). The other dominant phenocryst phases are K-feldspar (average 19% of total phenocryst content), clinopyroxene (average 16% of total phenocryst content) and orthopyroxene (average 11% of total phenocryst content), all of which are present in almost all the samples. Four samples contain small amounts of olivine (2%–5% of total phenocryst content in those samples), and 13 samples contain varying amounts of opaque oxides (2%–13% of total phenocryst content in those samples).
4.1.2 Intermediate crystalline rocks
Including samples: H52, H46 (Abida); H377 (Yangudi).
Samples H377 (Yangudi), H46 and H52 (Abida) are crystalline intermediate rocks. They contain very few vesicles (0%–1%) and few phenocrysts (4%–15%, mean 10%; Supplementary Table S1). The dominant phenocryst phases are plagioclase and K-feldspar (18%–47% and 20%–55% of total phenocryst content respectively). Clinopyroxene, orthopyroxene and opaque oxides are present in varying amounts (0%–25% of total phenocryst content). H377 and H52 have very fine crystalline groundmasses, whereas H46 has a slightly coarse groundmass. As in the basalt samples described above, large plagioclase phenocrysts in these samples can exhibit a degree of zoning, pitting and rim resorption.
4.1.3 Felsic crystalline rocks (rhyolites and microgranites)
Including samples: H47, H50, H53 (Abida); H360, H372, H376 (Yangudi).
Samples H372, H376 and H360 are very fine grained aphanitic crystalline rocks from Yangudi. They contain <1% vesicles and very rare (1%–2% of total rock content; Supplementary Table S1) plagioclase or K-feldspar phenocrysts. The phenocrysts present are generally complete, unfractured and euhedral, though sometimes there is evidence for slight dissolution around the rims.
Samples H47, H50 and H53 from Abida are coarser rhyolites, containing no vesicles and 6%–11% (mean 8%; Supplementary Table S1) phenocrysts (Figure 4d). The dominant phenocryst phase is K-feldspar, with which are commonly fractured and often display significant disequilibria textures such as resorbed rims and, in some cases, partial or total overgrowth and replacement. Subordinate amounts of hornblende are present in all samples (9%–17% of total phenocryst content), and clinopyroxene and opaque oxides are present in some of the samples.
4.1.4 Intermediate tuffs
Including samples: H11, H13 (Ayelu); H54 (Abida).
H54 (Abida), H11 and H13 (Ayelu) are tuffs of intermediate composition. H54 is a fine-grained tuff with an ashy matrix, containing around 14% phenocrysts (Figure 4f). The dominant phenocryst type is K-feldspar (44% of total phenocryst content), with subordinate plagioclase, clinopyroxene and hornblende. Phenocrysts are generally irregular in shape, either due to fracturing or resorption and dissolution. H11 has a strongly flattened and welded matrix, with phenocrysts (plagioclase, K-feldspar and clinopyroxene, totalling 3% of total rock content) aligned parallel to the direction of flattening. H13 has a clear glassy groundmass, with generally well-aligned phenocrysts.
4.1.5 Felsic tuffs
Including samples: H12, H14, H18a, H18b, H57, H17, H59 (Ayelu); H345 (Yangudi).
The majority of the felsic tuff samples come from Ayelu (seven) with one from Yangudi. The felsic tuffs from Ayelu contain almost no vesicles (0%–1%; Supplementary Table S1), and few phenocrysts (3%–5%, mean 4%). The groundmass of samples H12, H14, H17 and H57 is strongly welded, flattened and stretched, with phenocrysts generally aligned parallel to this flattening direction (Figures 4a,g). The groundmass is formed of generally colourless to light brown glassy material. H59, H18a and H18b are less strongly welded, with no distinct flattening and stretching direction, and no evidence of phenocryst alignment. The dominant phenocryst type is orthoclase, generally angular and euhedral in form, although in some samples (notably H12, H18a and H18b) the crystals are fractured and display subtle signs of dissolution. H345 from Yangudi has a very fine glassy welded matrix, with few phenocrysts (3%).
4.2 Trace element geochemistry
Trace element analyses for 47 whole-rock samples from Ayelu, Abida and Yangudi are shown in Supplementary Tables S1, S2, along with their locations and rock types as determined by the rock classification through the Total Alkali-Silica (TAS; Le Maitre et al., 2005) diagram for the same dataset, already published along with major element compositions by Rees et al. (2023). Zirconium (used as a fractionation index) is plotted against selected trace elements in Figures 5a–i, and selected trace element ratios are plotted in Figures 5j–p. The Zr concentrations range from 65.38 to 1,051.50 ppm, with concentrations over 300 ppm generally associated with compositionally intermediate and evolved samples (Figure 5) With respect to Zr, trace element variations show an increase in Rb, Sm, Yb, Pb, Nb and Th, and a decrease in Sr and Sc. Barium increases with Zr for most samples, with the exception of lava samples H360, H372, H53 and H356, and tuff samples from Ayelu (Supplementary Table S2).
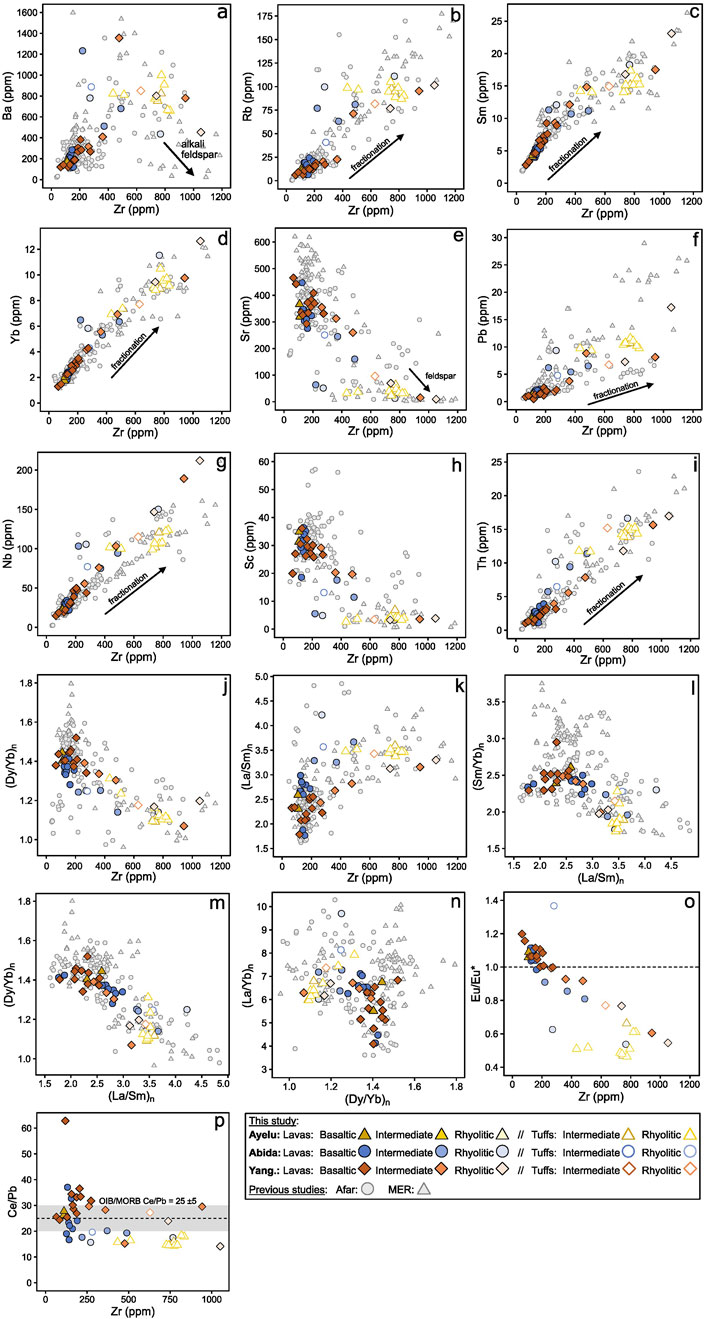
Figure 5. Trace elements and trace element ratios. (a) Zr vs. Ba, (b) Zr vs. Rb, (c) Zr vs. Sm, (d) Zr vs. Yb, (e) Zr vs. Sr, (f) Zr vs. Pb, (g) Zr vs. Pb, (h) Zr vs. Sc, (i) Zr vs. Th, (j) Zr vs. (Dy/Yb)n, (k) Zr vs. (La/Sm)n, (l) (La/Sm)n vs. (Sm/Yb)n, (m) (La/Sm)n vs. (Dy/Yb)n, (n) (Dy/Yb)n vs. (La/Yb)n; (o) Zr vs. Eu/Eu* (where Eu/Eu* = Eun/(Smn * Gdn)0.5); (p) Zr vs. Ce/Pb. All trace element concentrations are in ppm. Basaltic = SiO2 < 55 wt%, intermediate = SiO2 55–65 wt%, rhyolitic = SiO2 wt% > 65%. Previous studies: Afar data from Duffield et al. (1997); Ferguson et al. (2013); Hutchison et al. (2018); Hagos et al. (2016); Barrat et al. (2003); Watts et al. (2023). MER data from Siegburg (2019); Ayalew et al. (2016); Furman et al. (2006); Ronga et al. (2010); Rooney et al. (2012); Giordano et al. (2014); Peccerillo et al. (2003); Peccerillo et al. (2007).
Rare Earth Element (REE) patterns (Chondrite normalised; Sun and McDonough, 1989) for all three volcanoes are similar (Figure 6, left). All samples are enriched in light REE (LREE) relative to middle REE (MREE; Lan/Smn ∼2.3–3.6 for Ayelu; ∼1.7–4.2 for Abida; and ∼1.8–3.4 for Yangudi), increasing slightly with fractionation (Figure 5k). Samples are moderately enriched in MREE relative to heavy REE (HREE; Dyn/Ybn ∼1.1–1.4 for Ayelu; ∼1.1–1.4 for Abida; and ∼1.1–1.5 for Yangudi), decreasing slightly with fractionation (Figure 5j). Multi-element primitive mantle normalised spider diagrams show similar patterns across all three volcanoes (Figure 6, right). Evolved samples have very low Sr and Ti values, whereas basaltic samples are characterised by typically low Cs, Rb, Ba and Pb.
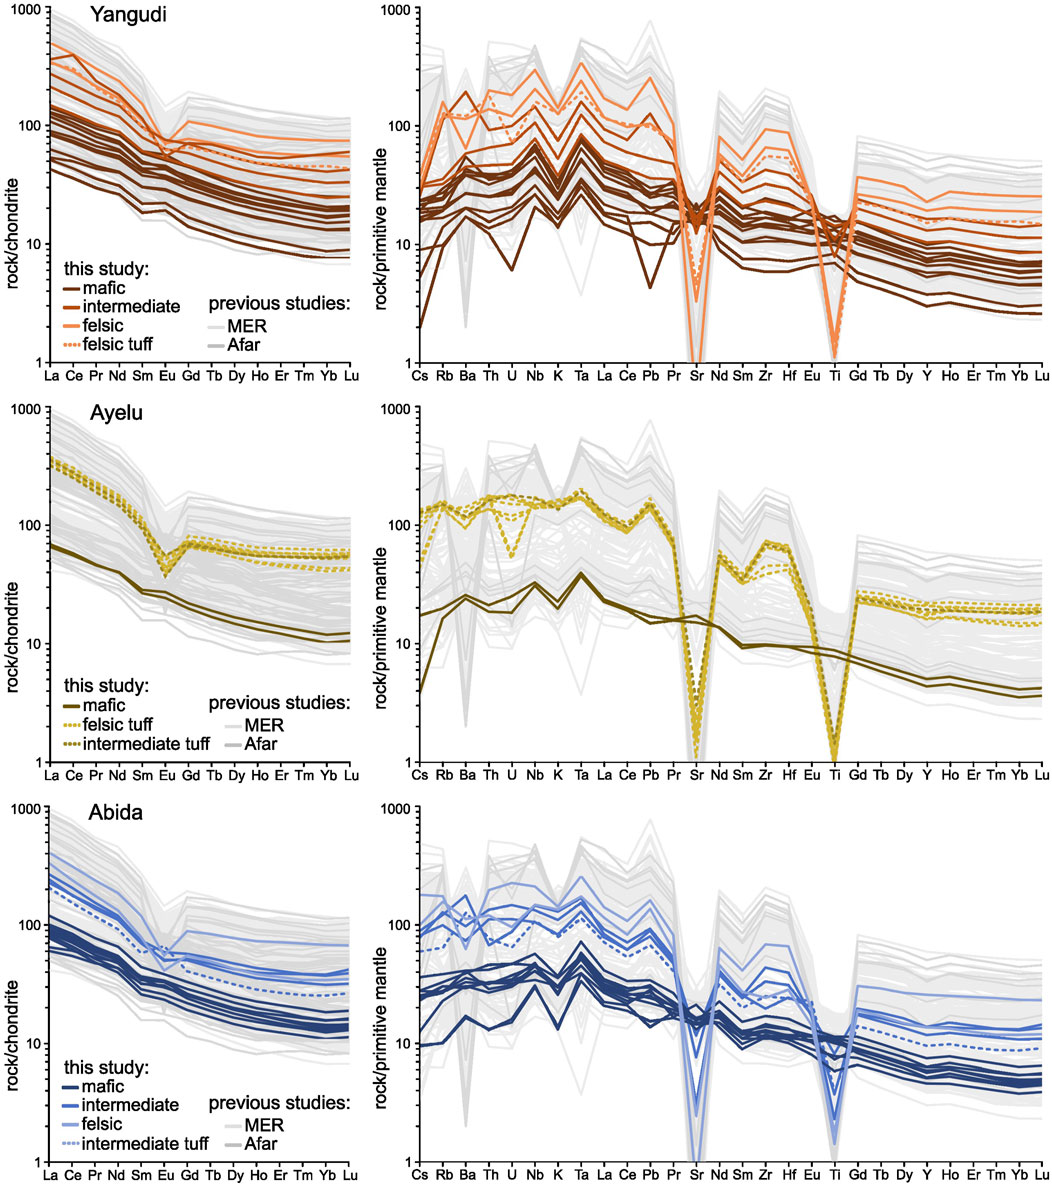
Figure 6. (left) REE profiles (chondrite normalised; Sun and McDonough, 1989), for Yangudi, Ayelu and Abida, and (right) trace element profiles normalised to primitive mantle (Sun and McDonough, 1989). Colours of lines from dark to light indicate whole-rock chemistry (dark = basaltic, SiO2 < 55 wt%; mid = intermediate, SiO2 55–65 wt%; pale = rhyolitic SiO2 wt% > 65%). Solid lines indicate lava samples, dashed lines indicate tuff samples. Grey lines show selected published REE analyses from other Quaternary volcanoes in Afar (Badi, Alid, Nabro, Tat Ali, Borawli, Dabbahu, Afdera, Gabilema; darker grey) and the MER (Boset-Bericha Volcanic Complex, Dofa, Fantale, Hertali, Kone, Gedemsa, Aluto; light grey). Published data from Lowenstern et al. (2006); Ronga et al. (2010); Ferguson et al. (2013); Giordano et al. (2014); Ayalew et al. (2016), Ayalew et al. (2019); Hutchison et al. (2016); Donovan et al. (2017); Siegburg (2019); Castillo, Liu and Scarsi (2020); Hoare et al. (2020)
Compositionally evolved and intermediate samples (Zr > 300 ppm) from all three volcanoes have significant to negligible negative Eu/Eu* anomalies (0.46–0.99, excluding H54 being anomalously high sample; Figure 5o; Equation 1). Whereas, basaltic samples have negligible to positive Eu/Eu* anomalies (0.98–1.20; Figure 5o). Europium anomaly (Eu/Eu*)) values from Yangudi are typically slightly higher relative to Ayelu and Abida, for both basaltic and evolved samples. Cerium-Lead ratios (Ce/Pb) from Yangudi range from 14.13 to 36.55 (mean 27.70; excluding anomalously high sample H355), and from 14.34 to 37.06 (mean 20.31) for Ayelu and Abida Figure 5p – typically higher than MORB Ce/Pb (25 ± 5, calculated from Atlantic, Pacific, and Indian Oceans; Hofmann et al., 1986).
Equation 1 used to calculate Eu/Eu*, from McLennan et al. (1990). Trace element concentrations have been normalised to chondrite compositions of Sun and McDonough (1989).
5 Discussion
Reasonably steep REE patterns (Figure 6, left) and moderate enrichment in MREE relative to HREE (Dyn/Ybn ratios: Ayelu 1.40–1.45, average 1.43; Abida 1.28–1.43, average 1.36; Yangudi 1.34–1.52, average 1.42) (Figures 5j,m,n) are observed in basaltic samples (Zr < 300 ppm) from Ayelu, Abida and Yangudi. This indicates that a garnet phase was present during the partial melting of the mantle as garnet strongly retains HREE (e.g., Devoir et al., 2021; Su et al., 2010), thus resulting in a depletion of HREE relative to LREE/MREE in the subsequent partial melt. The depth of the garnet lherzolite – spinel lherzolite transition within the mantle is debated, with estimates from the Main Ethiopian Rift in excess of ∼85 km (Wong et al., 2022).
Relative to other volcanic centres in Afar, the basaltic samples from Ayelu, Abida and Yangudi are more enriched in MREE compared to HREE. For example, average Dyn/Ybn ratios for basaltic samples from Afar volcanoes are Alid 1.15 (Duffield et al., 1997), Erta Ale magmatic segment 1.39 (Watts et al., 2023), Manda Hararo 1.28 (Barrat et al., 2003). Conversely, the AMS samples are more depleted in MREE compared to HREE than other volcanic centres in the MER (average Dyn/Ybn ratios for basaltic samples from MER volcanoes are Boset-Bericha 1.49 (Siegburg, 2019), Dofan 1.57 (Furman et al., 2006), Fentale 1.52 (Furman et al., 2006), Gedemsa 1.50 (Giordano et al., 2014), Kone 1.50 (Furman et al., 2006). The changes in these REE ratios along the volcanic rift centres can therefore be used to estimate the spatial variation in melting depth as these ratios correspond to the amount of garnet lherzolite in the melt source (e.g., Wood et al., 2013). As such, these geochemical observations suggest a southward increase in melt depth from Afar through to the MER, with values from the AMS lying somewhere between the two.
Independent modelling of trace elements are consistent with our findings, with melting depths in Afar having been estimated at 65–95 km (Watts et al., 2023; Ferguson et al., 2013) whereas melting depths for the central MER are estimated to be predominantly more than 100 km (Chiasera et al., 2018; 2021) These along rift variation in depth of the melt zone is supported by geophysical evidence of southwards increase in depth range of the high amplitude slow velocity anomalies (interpreted as the melt zone from seismic tomographic imaging of the mantle) from ∼120–90 km beneath the central portions of the MER to ∼120–60 km beneath Afar (e.g., Gallacher et al., 2016; Chambers et al., 2022). The depth to the base of the melt zone is relatively constant with the deep onset of melting primarily controlled by a regionally elevated mantle potential temperature caused by presence of a mantle plume (e.g., Ferguson et al., 2013). However, the depth of the top of the melt zone shows significant spatial variations both in tomographic images and geochemical models, and correlates well with the limited measurements of decreasing plate thickness towards Afar (e.g., Lavayssière et al., 2018; Dugda et al., 2007). This strongly indicates that the range of melting depths during continental rifting and breakup are primarily modulated by degree of extension related plate thinning, and supports recent global interpretations of a primary control on depth of melting from thickness of the overlying lithosphere (Niu, 2021).
To assess the relative proportions of spinel lherzolite vs. garnet lherzolite in the melt source of the samples, we modelled partial melting and mixing of a garnet lherzolite and a spinel lherzolite mantle source, using the PetroGram magmatic petrology program (Gündüz and Asan, 2021). Using the REE compositions of garnet mantle peridotite from Frey (1980) and spinel mantle peridotite from McDonough (1990) as starting values (Table 2), we modelled the forward non-modal dynamic melting and mixing of these two sources. Dynamic melting assumes that the melt is in equilibrium with the mantle source until a critical proportion of melt is reached to achieve permeability, and then it is extracted (cf. fractional melting, in which melt is extracted immediately after formation) (e.g., Shaw, 2000). Modal melting (an uncommon melting type) assumes the minerals undergoing melting are in proportion to the modal mineralogy of the rock, whereas in non-modal melting (a more common melting type) the mineral proportions in the melt may be different to the proportions in the source (Wilson, 1989; Gündüz and Asan, 2021). Here, we assume the mode of melting to be non-modal and dynamic, as S-wave tomographic images suggest a moderate degree of melt is present in the upper mantle in southern Afar (Chambers et al., 2019).
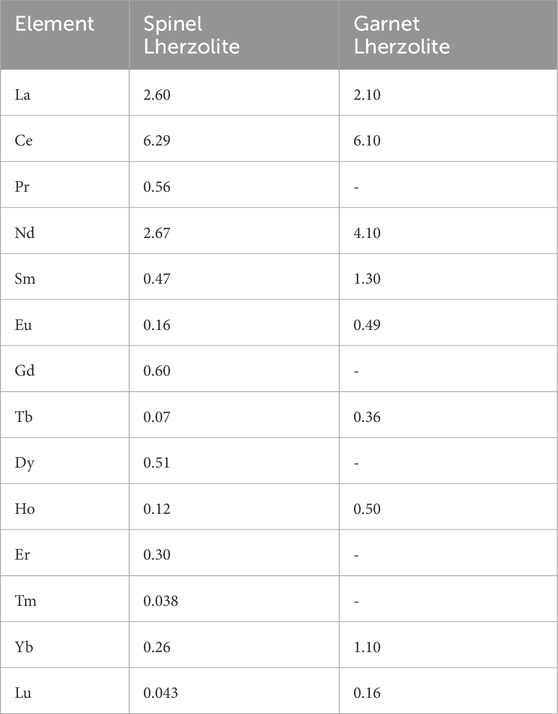
Table 2. REE compositions of the mantle peridotites used in the PetroGram melt modelling. Spinel lherzolite values after McDonough (1990), garnet lherzolite values after Frey (1980).
We compared the composition of basaltic samples from the AMS (Zr > 300 ppm, with MgO >5.5 wt%; to minimise the effects of fractionation) with the modelled melting and mixing lines. We find that our geochemical data is best modelled by invoking a reasonably high degree of partial melting (melt fraction, F, between 4% and 9.5%), with garnet lherzolite contributions between <10% and 60% (Figure 7). The modelled degree of partial melting is reasonably similar to other volcanoes in East Africa (e.g., Erta Ale magmatic segment, Afar: 3%–4.5% partial melt, Watts et al., 2023; Bishoftu/Debre Zeyit, MER: 7% partial melt, Rooney et al., 2005; Turkana, North Kenya: 5%–7% partial melt, Furman et al., 2004). Although there is a wide range in modelled values for both F and mantle source contributions for all three volcanoes of the AMS, there does not appear to be any discernible trends in these values with respect to relative sample age (Figure 7). There also does not appear to be any particular trends in F or mantle source contribution between the three volcanoes (Figure 7), suggesting that the melt generation conditions at the volcanoes have not varied systematically with space or time, and that melt generation conditions at all three volcanoes are likely to be similar. These similarities come despite the fact that the three volcanoes have slightly different tectonic settings (Yangudi lies on the central rift axis whilst Ayelu and Abida lie on a region of rift laterally offset (Figure 2), suggesting that these tectonic differences have little to no impact on the conditions of melt generation in the AMS. The results are consistent with the mantle melt source zones being at least of comparable spatial scale to the magmatic segments. The lack of clear difference in melt generation along segment is also consistent with recent numerical models showing that deep sedimentary basins such as that between Ayelu/Abida and Yangudi can deflect crustal melt pathways towards the segment tips (Armeni et al., 2024). As such, organisation of the crustal sub-volcanic plumbing systems in the magmatic segments could be strongly influenced by crustal processes such as unloading (ref), and stress focusing around intrusion zones (Beutel et al., 2010), rather than directly correlating to mantle processes. Consistent with this interpretation and true to the data and results is that the melt source modelling cannot rule out whether these tectonic differences influence the melt evolution during its ascent from source to eruption.
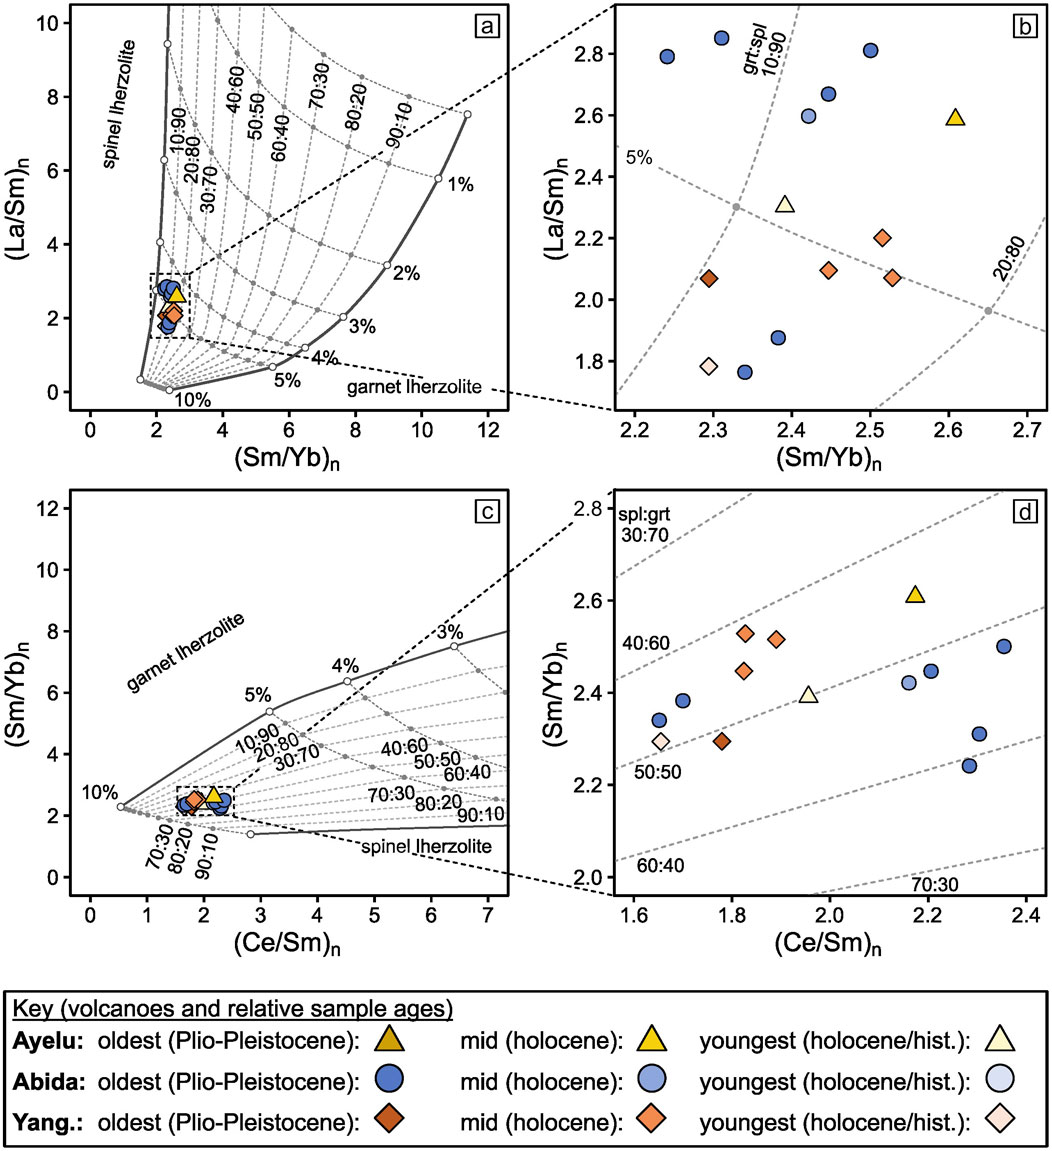
Figure 7. Results from trace element modelling (using PetroGram, Gündüz and Asan, 2021) of non-modal batch melting and mixing of garnet lherzolite (Frey, 1980) and spinel lherzolite (McDonough, 1990). (b) and (d) are enlarged views of (a) and (c) respectively, with dashed boxes indicating the extent shown. Samples are normalised to the chondrite values of Sun and McDonough (1989). Only basaltic samples (where Zr < 300 ppm and MgO >5.5 wt%) are shown here, to minimise the effects of fractionation.
5.1 Basaltic melt evolution in the AMS
Significant variation in trace element concentrations across the range of samples (e.g., Nd: Yangudi 12.17–110 ppm; Ayelu 18.50–83.00 ppm; Abida 18.48–86.59 ppm; see Supplementary Table S2; Figures 5a–i for further examples) suggests that fractional crystallisation has played a key role in their petrogenesis (Barrat et al., 1998). Samples with similar degrees of fractionation (i.e., similar Zr or MgO contents (Figures 5, 8; Supplementary Table S2) have broadly similar incompatible elements (e.g., Rb and Th, Figures 5b,i), suggesting that much of the chemical variation observed in the AMS can be explained by fractional crystallisation.
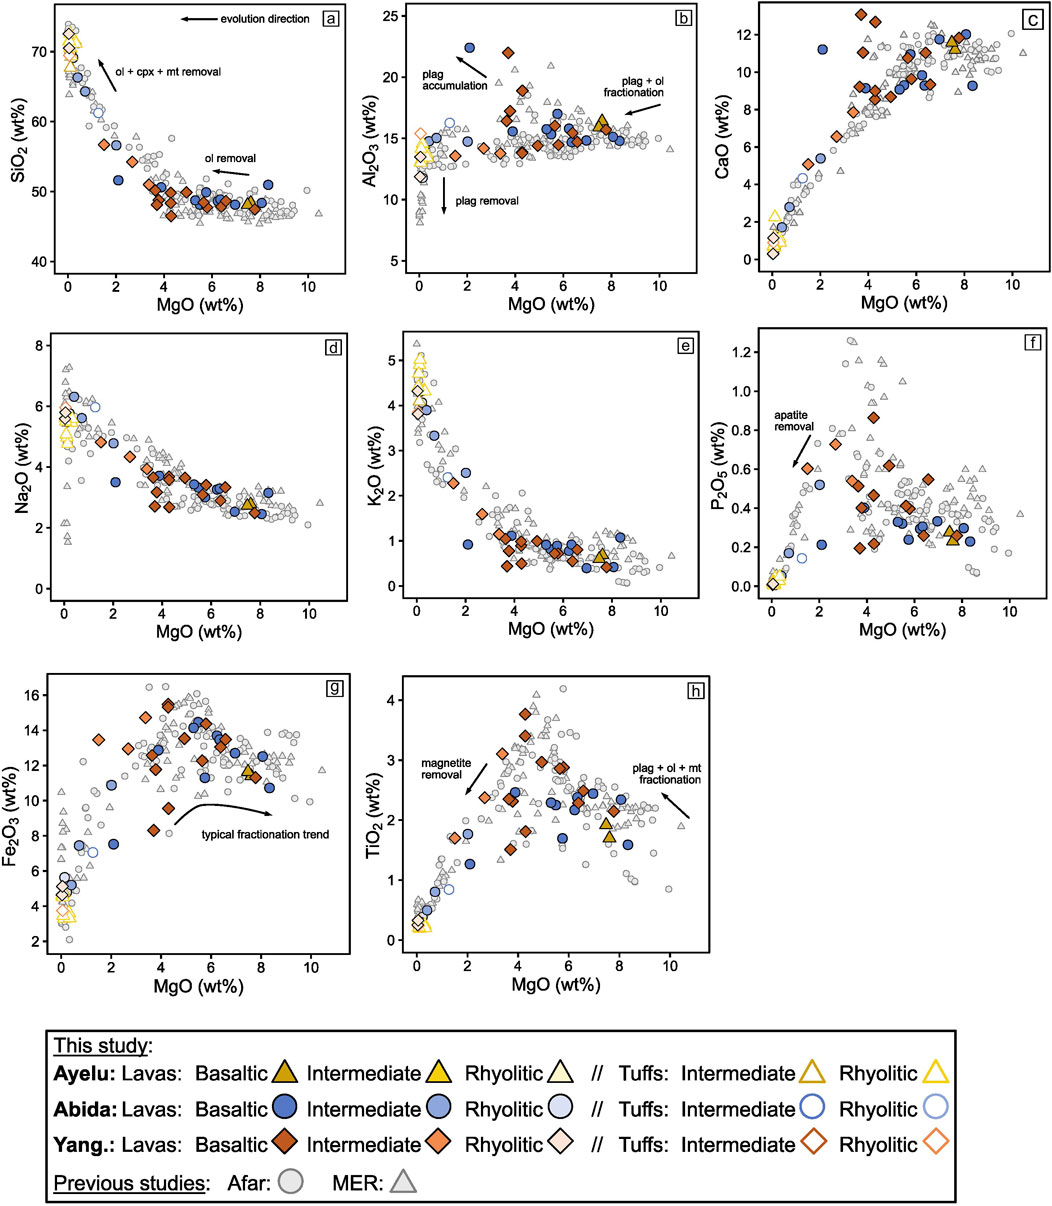
Figure 8. Major element oxides in wt% vs. MgO. (a) MgO vs. SiO2; (b) Al2O3 vs. MgO; (c) CaO vs. MgO; (d) Na2O vs. MgO; (e) K2O vs. MgO; (f) P2O5 vs. MgO; (g) Fe2O3 vs. MgO; (h) TiO2 vs. MgO. Basaltic = SiO2 < 55 wt%, intermediate = SiO2 55–65 wt%, rhyolitic = SiO2 wt% > 65%. Previous studies: Afar data from Duffield et al. (1997); Ferguson et al. (2013); Hutchison et al. (2018); Hagos et al. (2016); Barrat et al. (2003); Watts et al. (2023). MER data from Siegburg (2019); Ayalew et al. (2016); Furman et al. (2006); Ronga et al. (2010); Rooney et al. (2012); Giordano et al. (2014); Peccerillo et al. (2003); Peccerillo et al. (2007).
Trace element variations with respect to degree of fractionation show an increase in Rb, Sm, Yb, Pb, Nb and Th, and a decrease in Sr and Sc (Figures 5a–i). These trends, along with major element trends (Rees et al., 2023), display the behaviour that would be predicted from fractionation involving olivine, plagioclase, clinopyroxene and Fe-Ti oxides (e.g., Figures 5a,i; Figure 8; Barrat et al., 1998). This is consistent with petrographic analysis, which finds plagioclase and clinopyroxene phenocrysts are present in the majority (94%) of basaltic samples, whilst opaque oxides are seen in 31% of basaltic samples (Figure 3). Olivine phenocrysts are only seen in 12% of the samples (Figure 3), but it is possible they may have formed in more of the melts and settled out prior to eruption (e.g., Larsen and Pedersen, 2000; Earle, 2019). Barium increases with Zr (up to Zr concentration of 600 ppm, Figure 5a) – suggesting that for most samples, the dominant crystallising phase is plagioclase, rather than alkali feldspar. This finding too is consistent with observations of the mineralogy of the thin section samples (Figures 3, 4), where we observe that the dominant phenocryst phase for most basaltic samples (84%) is plagioclase.
The Mg# (Mg/(Mg + Fe) * 100) for basaltic samples (Zr < 300 ppm) from Ayelu, Abida and Yangudi range from 39.4 to 14.7, with average values from Ayelu and Abida (35.3 and 27.8 respectively) slightly higher than those from Yangudi (23.8). We find that all values are significantly lower than basaltic melts in equilibrium with the residual upper-mantle (Mg# ∼70; Wilkinson, 1982). All basaltic samples from the AMS contain low to moderate MgO (2.1–8.3 wt%, average 5.4 wt%; Figure 8; Rees et al., 2023), as well as low Ni (173.5–1.1 ppm, average 51.5 ppm; Supplementary Table S2) and low Cr (413.6–0.26 ppm, average 110.5 ppm; Supplementary Table S2. These values are all significantly lower than the values that would be expected from a primary magma that is in equilibrium with the upper mantle (i.e., MgO 10–15 wt%, Cr > 1,000 ppm, Ni > 450 ppm; Frey et al., 1978; Hess, 1992). This suggests that even the most primitive basalts from the AMS have undergone some degree of fractionation (likely olivine, clinopyroxene and plagioclase) prior to eruption.
Positive Eu/Eu* anomalies observed in all basaltic samples (Figure 5o) are indicative of plagioclase crystallisation and accumulation, supported by the dominant plagioclase phenocryst phase in thin section observation (Figure 3). Negative Eu/Eu* anomalies in most intermediate and felsic samples (Figure 5o) are indicative of prior plagioclase crystallisation and removal leaving behind a melt depleted in Eu, again supported by thin section observations (Figures 3, 4). Decreasing major element trends of Al2O3 and CaO with MgO are consistent with fractionation and removal of olivine, clinopyroxene and plagioclase with increasing magma evolution.
We modelled the fractionating phases using Rhyolite MELTS v1.2. For Microsoft Excel (Gualda and Ghiorso, 2015). This model allows for the investigation of crystallisation and is customisable for starting and ending temperatures and pressures, and oxidation conditions. We used the most primitive sample (lowest SiO2 concentration, where MgO >5.5 wt%) from Ayelu, Abida and Yangudi as three starting compositions in our experiments (samples H9, H35 and H355 respectively; Table 3). The pressure-temperature (P-T) ranges used in the model were T = 1,300°C–700°C and P = 700–100 MPa. A maximum pressure of 700 MPa was chosen based on the accepted values for crustal thickness of ∼25–30 km beneath the AMS (Maguire et al., 2006), whilst a maximum temperature of 1,300°C was chosen as it is both consistent with the crustal thickness in the region and less than the estimated mantle temperature of 1,490°C (Rooney et al., 2012).
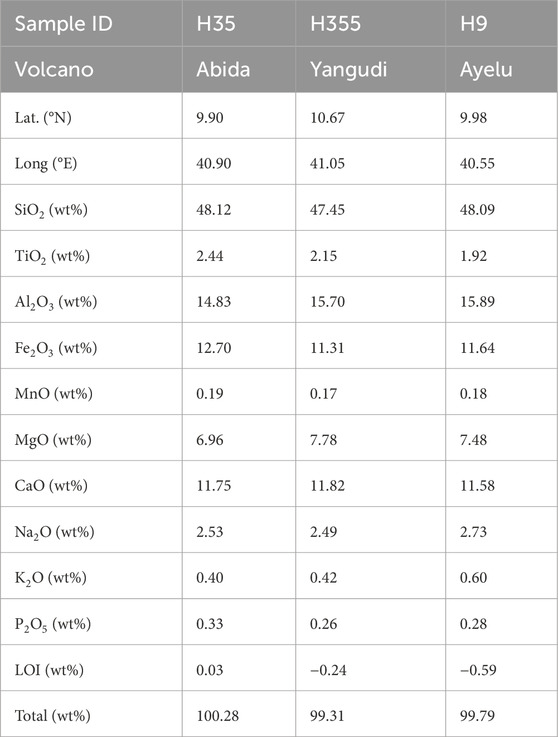
Table 3. Major element compositions (Rees et al., 2023) of the three samples chosen as starting compositions for the MELTS modelling.
A H2O value of 1 wt% and fO2 (oxygen fugacity) value of −2 NNO were determined using iterative modelling of Abida and Yangudi to ascertain the best fit for the data by visual inspection (Supplementary Figures S1-S5). Due to the lack of any intermediate samples from Ayelu, it was not possible to determine which H2O and fO2 values resulted in the best fit for this volcano. Instead, a modelled line using a H2O value of 1 wt% and fO2 contents of −2 NNO are shown in Figure 9, as these were the values which resulted in the best fit for samples from both Abida and Yangudi. This initial H2O value is similar to other volcanoes reported in the MER and Afar (e.g., Aluto, MER, H2O 0.5 wt%, Gleeson et al., 2017; aligned cones between Fentale and Kone volcanoes (Nicotra et al., 2021; Dabbahu, Afar, H2O < 1 wt%; Field et al., 2013). fO2 values too are within range of previous estimates from Afar and the MER (e.g., Field et al., 2013; Gleeson et al., 2017).
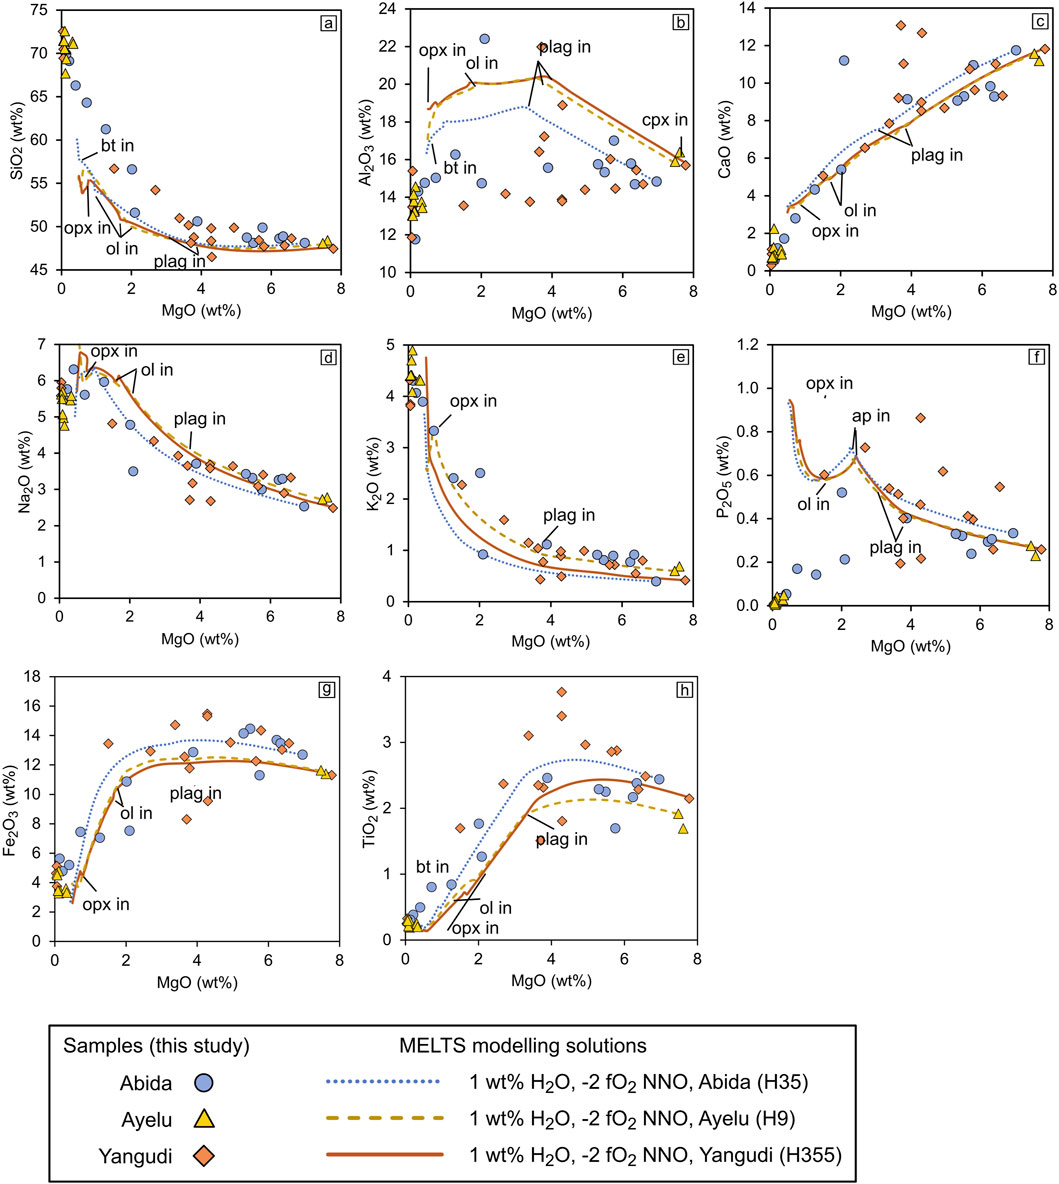
Figure 9. Major element oxides in wt% vs. MgO diagrams, (a) MgO vs. SiO2; (b) Al2O3 vs. MgO; (c) CaO vs. MgO; (d) Na2O vs. MgO; (e) K2O vs. MgO; (f) P2O5 vs. MgO; (g) Fe2O3 vs. MgO; (h) TiO2 vs. MgO, showing the modelled liquid line of descent during melt evolution. Lines indicate the best fit results from the Rhyolite Melts v.1.2 model, using 1 wt% H2O, −2 fO2 NNO, temperature 1,300°C–700°C, pressure 700–100 MPa, point symbols represent major element data from Ayelu, Abida and Yangudi. Starting composition sample names for each volcanic system are given in brackets. Labels show when each mineral phase begins crystalising.
The results of the best-fit models are shown in Figure 9. The main phases predicted by the models were feldspar, clinopyroxene, orthopyroxene and olivine, with minor amounts of apatite and Fe-Ti oxides with fractional crystallization beginning at ∼21 km depth and ∼1,240°C for each model (see Table 4). The depth of onset of fractional crystallisation is consistent with being near the base of the crust in Afar (La Rosa et al., 2024). Although most crystal phases predicted by the MELTS model match those seen in thin sections (see Figure 3; Table 4), none of the calculated lines of liquid descent fit the observed geochemical data perfectly (Figure 9). In particular, the modelled Al2O3 is too high especially across the intermediate samples and the modelled P2O5 is too high for the evolved samples, whilst the modelled TiO2 is low for the evolved samples. This discrepancy could be due to a number of factors, for example, that rhyolite MELTS is not optimised for alkaline systems (note the samples from the AMS mostly lie on the alkaline–subalkaline division as reported by Rees et al., 2023) Another factor could be that the model predicted a late crystallisation of feldspar, which could cause the Al2O3 to continue increasing too much throughout the range of intermediate samples. Despite this, the modelled lines of liquid descent still provide a good fit for most geochemical data (Figure 9), indicating that the variation in samples can be primarily attributed to fractional crystallisation, with little requirement for substantial crustal contamination.
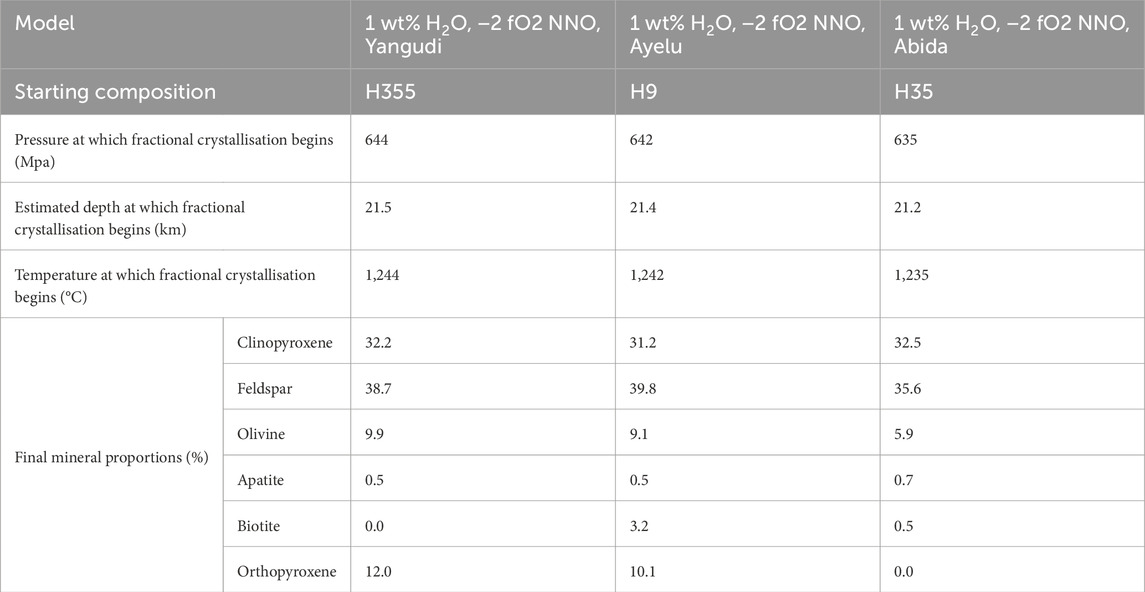
Table 4. Temperature, pressure and mineral proportions estimated through MELTS modelling of each starting composition. Depth is estimated by approximating 30 MPa to 1 km depth.
Incompatible element ratios for basaltic samples (e.g., Ba/Nb 5.39–9.01; Rb/Nb 0.26–0.79) suggest that the basalts are not considerably affected by crustal contamination, as the element ratios are far lower than the values expected for continental crust (Ba/Nb ∼54; Rb/Nb ∼4.7; Weaver, 1991). Rather, the incompatible trace element ratios from the AMS are more similar to a depleted mantle-like component (Ba/Nb 4.70–17.80; Rb/Nb 0.30–1.23; Hofmann et al., 1986). Lanthanum-Niobium (La/Nb) ratios for basalts from Ayelu, Abida and Yangudi are 0.60–0.75, below the value expected for basalts with crustal contamination (>0.90; Pik et al., 1999).
Average Ce/Pb values for basalts from Yangudi are higher than those from Ayelu and Abida (31.92 vs. 23.92, excluding anomalously high sample H355; Figure 5p), whilst Ce/Pb values for evolved samples are much lower for both Yangudi and Ayelu/Abida (22.03 and 16.70 respectively; Figure 5p). The Ce/Pb values for MORB and OIB are consistent at 25 ± 5, characterising a depleted mantle (Hofmann et al., 1986), and high Ce/Pb ratios (>30) are associated with an EM1 or EM2-type mantle source (Hofmann and White, 1982; Hofmann et al., 1986). Therefore, mantle sources alone can explain the Ce/Pb ratios seen in all but two of the basaltic samples (H29 and H35 from Abida; Figure 5p), which appear to be potentially affected by contamination with crustal material (Ce/Pb value for crust ∼4 Hofmann et al., 1986). However, within the suite of basaltic samples we find no correlation between the degree of evolution (Zr) and decreasing Ce/Pb (in fact, samples from Yangudi show an inverse correlation), suggesting that crustal contamination is not a dominant process affecting basaltic samples (Ayalew et al., 2016).
Trace element data suggests that crustal contamination has not played a significant role during the petrogenesis of basalts in the AMS. However, much lower Ce/Pb values seen in most of the intermediate and evolved samples from the AMS (Ce/Pb < 20; Figure 5p) are likely explained by contamination with a crustal or sub-crustal source with a low Ce/Pb ratio. It is however difficult to identify a likely source of contamination using trace element ratios alone. Thus, future work may examine this scenario using radiogenic isotope constraints.
5.2 Origin and evolution of intermediate and evolved rocks in the AMS
The felsic samples (nine tuff samples, four lava samples) in the AMS suite are dominated by tuffs, predominantly from Ayelu, along with rhyolite lavas from Yangudi and Abida (Figure 8a). Intermediate samples from the AMS consist of four lava samples from Abida and Yangudi, and two tuff samples from Ayelu and Abida. Relative to basaltic rocks from the AMS, intermediate and felsic samples, including tuffs, are characterised by negative Eu anomalies and large depletions in Sr and Ti, as well as minor depletions in Y and enrichments in Pb (Figure 6). Depletions in Sr, Ti and Eu could be related to increasing fractionation of plagioclase, alkali feldspar and Ti- and Mg-oxides (Figures 5e,o; Figure 8h).
Deposits of intermediate composition occur far less frequently than basaltic and felsic deposits in the AMS (Rees et al., 2023). This bimodal style of volcanism is common in the MER where it is observed across the wider region (e.g., Trua et al., 1999; Abebe et al., 2007). The origins of this scarcity of intermediate products (known as the “Daly Gap”; Daly, 1925) could be attributed to a range of factors. This includes the trapping of intermediate and basaltic magmas by shallower low-density silicic magmas (viscous/gravitational trapping and density stratification) (e.g., Baker et al., 1977; Peccerillo et al., 2003), large crystal loads limiting melt convection (Brophy, 1991), or variations in magma residence time and rate of cooling (Bonnefoi et al., 1995). Elsewhere in the MER, the spatial distribution and restriction of intermediate and basaltic lavas to volcanic cones and fissures away from the main central volcanic complexes has been attributed to this density stratification and trapping process, preventing the eruption of basaltic or intermediate magmas from the central volcano (e.g., Gleeson et al., 2017; Boset-Bericha Volcanic Complex; Siegburg et al., 2018). In the AMS, recent (that is, late Quaternary/historical) basaltic and intermediate flows are predominantly associated with cones distal to the main volcanic centres of Abida and Yangudi (Figure 2; Rees et al., 2023). However, older basaltic and intermediate flows appear to originate from, or near to, the main central volcanic edifices (Figure 2; Rees et al., 2023), ruling out density stratification and trapping as likely processes during the early stages of the volcano formation. As such, it may be more likely that small variations in magma residence time and/or cooling rates (e.g., Bonnefoi et al., 1995) could be responsible for the predominantly bimodal volcanism seen in the AMS.
6 Summary and conclusion
We present trace element analyses from 47 whole rock samples from the AMS, alongside detailed petrographic descriptions from 51 corresponding thin sections. We then used these data in geochemical models PetroGram (Gündüz and Asan, 2021) and Rhyolite MELTS (Gualda and Ghiorso, 2015) to investigate melt generation conditions and melt evolution in the AMS. Our main findings are:
Forward non-modal dynamic melting and mixing modelling using PetroGram (Gündüz and Asan, 2021) of spinel lherzolite and garnet lherzolite mantle peridotite sources suggests that the magmas in the AMS are produced from a relatively deep source with 10%–60% garnet lherzolite, corresponding to depths of >85 km. Modelling suggests that the parental melts for all three AMS volcanoes were generated from a similar source by around 4%–9.5% total partial melting (F). We find no significant variation of these characteristics with either sample age or sample location at the AMS, suggesting no systematic temporal variations occurred in either the depth or the degree of melting within a single magmatic segment. However, our new results place the depth of melting intermediate between the more highly extended lithosphere in Afar, and the less thinned lithosphere of the MER. These results suggest that degree of lithospheric thinning plays a major role in rift magma geochemistry.
Major element geochemical modelling of whole rock samples suggests that the observed variation in compositions of the samples can be explained predominantly by fractional crystallisation. We find that basaltic samples from the AMS have experienced negligible crustal contamination (Ce/Pb > 20 for all but two basaltic samples), but crustal contamination may have a greater influence on the composition of intermediate and evolved samples (where Zr < 300 ppm). Best-fit modelling suggests that during initial pre-eruption conditions at Abida and Yangudi, magmas have a H2O content of 1 wt%, with an fO2 of −2 NNO, consistent with previous estimates for other volcanic centres in the MER and Afar.
Data availability statement
The original contributions presented in the study are included in the article/Supplementary Material, further inquiries can be directed to the corresponding author.
Author contributions
RR: Conceptualization, Data curation, Formal Analysis, Investigation, Methodology, Software, Visualization, Writing – original draft, Writing – review and editing. EW: Investigation, Methodology, Software, Supervision, Writing – original draft, Writing – review and editing. TG: Conceptualization, Funding acquisition, Project administration, Supervision, Writing – original draft, Writing – review and editing. RT: Conceptualization, Formal Analysis, Methodology, Supervision, Writing – original draft, Writing – review and editing. CP: Conceptualization, Data curation, Funding acquisition, Resources, Writing – original draft, Writing – review and editing. DK: Conceptualization, Funding acquisition, Project administration, Supervision, Writing – original draft, Writing – review and editing.
Funding
The author(s) declare that financial support was received for the research and/or publication of this article. RR was funded by the INSPIRE Doctoral Training Program from the Natural Environmental Research Council (NERC) under grant number NE/S007210/1 as part of the INSPIRE Doctoral Training Program. DK was supported by NERC grant NE/L013509/1. EJW is supported by NERC Spitfire studentship grant NE/L002531/1 and is also currently supported as part of the UKRI FLF award held at Swansea University (MR/Y011767/1).
Acknowledgments
We acknowledge the use of rocks from the Afar Repository of the University of Pisa (https://repositories.dst.unipi.it/index.php/home-afar), and would like to acknowledge the efforts and contributions of everyone involved in these 1970s sample collection expeditions in Afar.
Conflict of interest
The authors declare that the research was conducted in the absence of any commercial or financial relationships that could be construed as a potential conflict of interest.
The author(s) declared that they were an editorial board member of Frontiers, at the time of submission. This had no impact on the peer review process and the final decision.
Generative AI statement
The author(s) declare that no Generative AI was used in the creation of this manuscript.
Publisher’s note
All claims expressed in this article are solely those of the authors and do not necessarily represent those of their affiliated organizations, or those of the publisher, the editors and the reviewers. Any product that may be evaluated in this article, or claim that may be made by its manufacturer, is not guaranteed or endorsed by the publisher.
Author Disclaimer
The views expressed in this paper are those of the authors and do not necessarily represent the views of the Environment Agency.
Supplementary material
The Supplementary Material for this article can be found online at: https://www.frontiersin.org/articles/10.3389/feart.2025.1575660/full#supplementary-material
References
Abebe, B., Acocella, V., Korme, T., and Ayalew, D. (2007). Quaternary faulting and volcanism in the main Ethiopian rift. J. Afr. Earth Sci. 48 (2–3), 115–124. doi:10.1016/j.jafrearsci.2006.10.005
Agostini, A., Bonini, M., Corti, G., Sani, F., and Mazzarini, F. (2011). Fault architecture in the main Ethiopian rift and comparison with experimental models: implications for rift evolution and Nubia–Somalia kinematics. Earth Planet. Sci. Lett. 301 (3–4), 479–492. doi:10.1016/J.EPSL.2010.11.024
Armeni, V., Mantiloni, L., Acocella, V., Rivalta, E., Bookhagen, B., and Strecker, M. R. (2024). “What controls inter-rift volcanism?,” in EGU general assembly conference abstracts 17383. 14-19 April, 2024. Vienna, Austria.
Ayalew, D., Ebinger, C., Bourdon, E., Wolfenden, E., Yirgu, G., and Grassineau, N. (2006). Temporal compositional variation of syn-rift rhyolites along the Western margin of the Southern Red Sea and northern main Ethiopian rift. Geol. Soc. Spec. Publ. 259. doi:10.1144/GSL.SP.2006.259
Ayalew, D., Jung, S., Romer, R. L., Kersten, F., Pfänder, J. A., and Garbe-Schönberg, D. (2016). Petrogenesis and origin of modern Ethiopian rift basalts: constraints from isotope and trace element geochemistry. Lithos 258–259, 1–14. doi:10.1016/j.lithos.2016.04.001
Ayalew, D., Pik, R., Bellahsen, N., France, L., and Yirgu, G. (2019). Differential fractionation of rhyolites during the course of crustal extension, Western Afar (Ethiopian rift). Geochem. Geophys. Geosystems 20 (2), 571–593. doi:10.1029/2018GC007446
Ayele, A., Stuart, G., Bastow, I., and Keir, D. (2007). The August 2002 earthquake sequence in north Afar: insights into the neotectonics of the danakil microplate. J. Afr. Earth Sci. 48 (2-3), 70–79. doi:10.1016/j.jafrearsci.2006.06.011
Baker, B. H., Goles, G. G., Leeman, W. P., and Lindstrom, M. M. (1977). Geochemistry and petrogenesis of a basalt-benmoreite-trachyte suite from the southern part of the gregory rift, Kenya. Contributions Mineralogy Petrology 64 (3), 303–332. doi:10.1007/bf00371759
Barberi, F., Tazieff, H., and Varet, J. (1972). Volcanism in the Afar depression: its tectonic and magmatic significance. Tectonophysics 15 (1–2), 19–29. doi:10.1016/0040-1951(72)90046-7
Barberi, F., and Varet, J. (1970). The erta ale volcanic range (danakil depression, northern Afar, Ethiopia). Bull. Volcanol. 34 (4), 848–917. doi:10.1007/BF02596805
Barnie, T. D., Keir, D., Hamling, I., Hofmann, B., Belachew, M., Carn, S., et al. (2016). A multidisciplinary study of the final episode of the manda hararo dyke sequence, Ethiopia, and implications for trends in volcanism during the rifting cycle. Spec. Publ. 420 (1), 149–163. doi:10.1144/SP420.6
Barrat, J. A., Fourcade, S., Jahn, B. M., Cheminée, J. L., and Capdevila, R. (1998). Isotope (sr, Nd, Pb, O) and trace-element geochemistry of volcanics from the erta’ale range (ethiopia). J. Volcanol. Geotherm. Res. 80 (1–2), 85–100. doi:10.1016/S0377-0273(97)00016-4
Barrat, J. A., Joron, J. L., Taylor, R. N., Fourcade, S., Nesbitt, R. W., and Jahn, B. M. (2003). Geochemistry of basalts from manda hararo, Ethiopia: LREE-depleted basalts in central Afar. Lithos 69 (1–2), 1–13. doi:10.1016/S0024-4937(03)00044-6
Beutel, E., van Wijk, J., Ebinger, C., Keir, D., and Agostini, A. (2010). Formation and stability of magmatic segments in the main Ethiopian and Afar rifts. Earth Planet. Sci. Lett. 293 (3-4), 225–235. doi:10.1016/j.epsl.2010.02.006
Bonnefoi, C. C., Provost, A., and Albarède, F. (1995). The “Daly gap” as a magmatic catastrophe. Nature 378 (6554), 270–272. doi:10.1038/378270a0
Brophy, J. G. (1991). Composition gaps, critical crystallinity, and fractional crystallization in orogenic (calc-alkaline) magmatic systems. Contributions Mineralogy Petrology 109 (2), 173–182. doi:10.1007/bf00306477
Castillo, P. R., Liu, X., and Scarsi, P. (2020). The geochemistry and sr-nd-pb isotopic ratios of high 3He/4He Afar and MER basalts indicate a significant role of the African superplume in EARS magmatism. Lithos 376–377, 105791. doi:10.1016/J.LITHOS.2020.105791
Chambers, E. L., Harmon, N., Keir, D., and Rychert, C. A. (2019). Using ambient noise to image the northern east African rift. Geochem. Geophys. Geosystems 20 (4), 2091–2109. doi:10.1029/2018GC008129
Chambers, E. L., Harmon, N., Rychert, C. A., Gallacher, R. J., and Keir, D. (2022). Imaging the seismic velocity structure of the crust and upper mantle in the northern east African rift using rayleigh wave tomography. Geophys. J. Int. 230 (3), 2036–2055. doi:10.1093/GJI/GGAC156
Chernet, T., Hart, W. K., Aronson, J. L., and Walter, R. C. (1998). New age constraints on the timing of volcanism and tectonism in the northern main Ethiopian rift - southern Afar transition zone (ethiopia). J. Volcanol. Geotherm. Res. 80 (3–4), 267–280. doi:10.1016/S0377-0273(97)00035-8
Chiasera, B., Rooney, T. O., Bastow, I. D., Yirgu, G., Grosfils, E. B., Ayalew, D., et al. (2021). Magmatic rifting in the main Ethiopian rift began in thick Continental lithosphere; the case of the galema range. Lithos 406–407, 106494. doi:10.1016/J.LITHOS.2021.106494
Chiasera, B., Rooney, T. O., Girard, G., Yirgu, G., Grosfils, E., Ayalew, D., et al. (2018). Magmatically assisted off-rift extension—The case for broadly distributed strain accommodation. Geosphere 14 (4), 1544–1563. doi:10.1130/GES01615.1
Corti, G. (2009). Continental rift evolution: from rift initiation to incipient break-up in the main Ethiopian rift, East Africa. Earth-Science Rev. 96 (1–2), 1–53. doi:10.1016/j.earscirev.2009.06.005
Corti, G., Sani, F., Philippon, M., Sokoutis, D., Willingshofer, E., and Molin, P. (2013). Quaternary volcano-tectonic activity in the soddo region, Western margin of the southern main Ethiopian rift. Tectonics 32 (4), 861–879. doi:10.1002/TECT.20052
Daly, R. A. (1925). The geology of Ascension island. Proc. Am. Acad. Arts Sci. 60 (1), 3–80. doi:10.2307/25130043
Deniel, C., Vidal, P., Coulon, C., Vellutini, P. J., and Piguet, P. (1994). Temporal evolution of mantle sources during Continental rifting: the volcanism of Djibouti (afar). J. Geophys. Res. Solid Earth 99 (B2), 2853–2869. doi:10.1029/93JB02576
Devoir, A., Bloch, E., and Müntener, O. (2021). Residence time of igneous garnet in Si-rich magmatic systems: insights from diffusion modeling of major and trace elements. Earth Planet. Sci. Lett. 560, 116771. doi:10.1016/J.EPSL.2021.116771
Donovan, A., Blundy, J. D., Oppenheimer, C., and Buisman, I. (2017). The 2011 eruption of nabro volcano, Eritrea: perspectives on magmatic processes from melt inclusions. Contributions Mineralogy Petrology 173 (1), 1–23. doi:10.1007/S00410-017-1425-2
Duffield, W. A., Bullen, T. D., Clynne, M. A., Fournier, R. O., Janik, C. J., Lanphere, M. A., et al. (1997). Geothermal potential of the alid volcanic center, danakil depression, Eritrea. U. S. Geol. Surv. Open-File Rep., 97–291. doi:10.3133/ofr97291
Dugda, M. T., Nyblade, A. A., and Julia, J. (2007). Thin lithosphere beneath the ethiopian Plateau revealed by a joint inversion of rayleigh wave group velocities and receiver functions. J. Geophys. Res. Solid Earth 112 (B8). doi:10.1029/2006JB004918
Earle, S. (2019). Physical geology. 2nd Edition. Victoria, B.C: University of British Columbia. Available online at: https://opentextbc.ca/physicalgeology.
Ebinger, C., Ayele, A., Keir, D., Rowland, J., Yirgu, G., Wright, T., et al. (2010). Length and timescales of rift faulting and magma intrusion: the Afar rifting cycle from 2005 to present. Annu. Rev. Earth Planet. Sci. 38 439–466. doi:10.1146/annurev-earth-040809-152333
Ebinger, C. J. (2005). Continental break-up: the East African perspective. Astronomy Geophys. 46 (2), 2.16–2.21. doi:10.1111/j.1468-4004.2005.46216.x
Ebinger, C. J., and Casey, M. (2001). Continental breakup in magmatic provinces: an Ethiopian example. Geology 29 (6), 527–530. doi:10.1130/0091-7613(2001)029<0527:CBIMPA>2.0.CO;2
Ebinger, C. J., and Hayward, N. J. (1996). Soft plates and hot spots: views from Afar. J. Geophys. Res. Solid Earth 101 (B10), 21859–21876. doi:10.1029/96jb02118
Ebinger, C. J., Yemane, T., Harding, D. J., Tesfaye, S., Kelley, S. P., and Rex, D. C. (2000). Rift deflection, migration, and propagation: linkage of the Ethiopian and eastern rifts, Africa. Bull. Geol. Soc. Am. 112 (2), 163–176. doi:10.1130/0016-7606(2000)112<163:RDMAPL>2.0.CO;2
Ebinger, C. J., Yemane, T., Woldegabriel, G., Aronson, J. L., and Walter, R. C. (1993). Late eocene–recent volcanism and faulting in the southern main Ethiopian rift. J. Geol. Soc. 150 (1), 99–108. doi:10.1144/gsjgs.150.1.0099
Erbello, A., Melnick, D., Zeilinger, G., Bookhagen, B., Pingel, H., and Strecker, M. R. (2022). Geomorphic expression of a tectonically active rift-transfer zone in southern Ethiopia. Geomorphology 403, 108162. doi:10.1016/j.geomorph.2022.108162
Ferguson, D. J., MacLennan, J., Bastow, I. D., Pyle, D. M., Jones, S. M., Keir, D., et al. (2013). Melting during late-stage rifting in Afar is hot and deep. Nature 499 (7456), 70–73. doi:10.1038/nature12292
Field, L., Blundy, J. D., Calvert, A., and Yirgu, G. (2013). Magmatic history of dabbahu, a composite volcano in the Afar rift, Ethiopia. GSA Bull. 125 (1–2), 128–147. doi:10.1130/B30560.1
Frey, F. A. (1980). The origin of pyroxenites and garnet pyroxenites from salt Lake crater, oahu, Hawaii: trace element evidence. Am. J. Sci. 280, 427–449.
Frey, F. A., Green, D. H., and Roy, S. D. (1978). Integrated models of basalt petrogenesis: a study of quartz tholeiites to olivine melilitites from south eastern Australia utilizing geochemical and experimental petrological data. J. Petrology 19 (3), 463–513. doi:10.1093/PETROLOGY/19.3.463
Furman, T., Bryce, J., Rooney, T. O., Hanan, B. B., Yirgu, G., and Ayalew, D. (2006). “Heads and tails: 30 million years of the Afar plume,” in The Afar volcanic province within the east African rift system. Editors G. Yirgu, C. J. Ebinger, and P. K. H. Maguire (London: Geological Society Special Publications), 95–119. doi:10.1144/GSL.SP.2006.259.01.09
Furman, T., Bryce, J. G., Karson, J., and Iotti, A. (2004). East african rift system (EARS) plume structure: insights from Quaternary mafic lavas of Turkana, Kenya. J. Petrology 45 (5), 1069–1088. doi:10.1093/PETROLOGY/EGH004
Gallacher, R. J., Keir, D., Harmon, N., Stuart, G., Leroy, S., Hammond, J. O., et al. (2016). The initiation of segmented buoyancy-driven melting during Continental breakup. Nat. Commun. 7 (1), 13110. doi:10.1038/ncomms13110
Gasparon, M., Innocenti, F., Manetti, P., Peccerillo, A., and Tsegaye, A. (1993). Genesis of the Pliocene to recent bimodal mafic-felsic volcanism in the debre zeyt area, central Ethiopia: volcanological and geochemical constraints. J. Afr. Earth Sci. 17 (2), 145–165. doi:10.1016/0899-5362(93)90032-L
Giordano, F., D’Antonio, M., Civetta, L., Tonarini, S., Orsi, G., Ayalew, D., et al. (2014). Genesis and evolution of mafic and felsic magmas at Quaternary volcanoes within the main Ethiopian rift: insights from gedemsa and fanta ’ale complexes. Lithos 188, 130–144. doi:10.1016/j.lithos.2013.08.008
Gleeson, M. L. M., Stock, M. J., Pyle, D. M., Mather, T. A., Hutchison, W., Yirgu, G., et al. (2017). Constraining magma storage conditions at a restless volcano in the main Ethiopian rift using phase equilibria models. J. Volcanol. Geotherm. Res. 337, 44–61. doi:10.1016/J.JVOLGEORES.2017.02.026
Gualda, G. A. R., and Ghiorso, M. S. (2015). MELTS_Excel: a microsoft Excel-based MELTS interface for research and teaching of magma properties and evolution. Geochem. Geophys. Geosystems 16 (1), 315–324. doi:10.1002/2014GC005545
Gündüz, M., and Asan, K. (2021). PetroGram: an excel-based petrology program for modeling of magmatic processes. Geosci. Front. 12 (1), 81–92. doi:10.1016/J.GSF.2020.06.010
Hagos, M., Koeberl, C., and van Wyk de Vries, B. (2016). The Quaternary volcanic rocks of the northern Afar depression (northern Ethiopia): perspectives on petrology, geochemistry, and tectonics. J. Afr. Earth Sci. 117, 29–47. doi:10.1016/j.jafrearsci.2015.11.022
Hayward, N. J., and Ebinger, C. J. (1996). Variations in the along-axis segmentation of the Afar rift system. Tectonics 15 (2), 244–257. doi:10.1029/95TC02292
Hess, P. C. (1992). “Phase equilibria constraints on the origin of ocean floor basalts,” in Mantle flow and melt generation at mid-ocean ridges. Editors J. P. Morgan, D. K. Blackman, and J. M. Sinton (American Geophysical Union AGU), 67–102. doi:10.1029/GM071P0067
Hoare, L., Klaver, M., Saji, N. S., Gillies, J., Parkinson, I. J., Lissenberg, C. J., et al. (2020). Melt chemistry and redox conditions control titanium isotope fractionation during magmatic differentiation. Geochimica Cosmochimica Acta 282, 38–54. doi:10.1016/J.GCA.2020.05.015
Hofmann, A. W., Jochum, K. P., Seufert, M., and White, W. M. (1986). Nb and Pb in Oceanic basalts: new constraints on mantle evolution. Earth Planet. Sci. Lett. 79 (1–2), 33–45. doi:10.1016/0012-821X(86)90038-5
Hofmann, A. W., and White, W. M. (1982). Mantle plumes from ancient Oceanic crust. Earth Planet. Sci. Lett. 57 (2), 421–436. doi:10.1016/0012-821X(82)90161-3
Hofmann, C., Courtillot, V., Féraud, G., Rochette, P., Yirgu, G., Ketefo, E., et al. (1997). Timing of the Ethiopian flood basalt event and implications for plume birth and global change. Nature 389 (6653), 838–841. doi:10.1038/39853
Hutchison, W., Mather, T. A., Pyle, D. M., Boyce, A. J., Gleeson, M. L. M., Yirgu, G., et al. (2018). The evolution of magma during Continental rifting: new constraints from the isotopic and trace element signatures of silicic magmas from Ethiopian volcanoes. Earth Planet. Sci. Lett. 489, 203–218. doi:10.1016/j.epsl.2018.02.027
Hutchison, W., Pyle, D. M., Mather, T. A., Yirgu, G., Biggs, J., Cohen, B. E., et al. (2016). The eruptive history and magmatic evolution of aluto volcano: new insights into silicic peralkaline volcanism in the Ethiopian rift. J. Volcanol. Geotherm. Res. 328, 9–33. doi:10.1016/j.jvolgeores.2016.09.010
Kebede, B., Mammo, T., Shawel, M., and Alemu, T. (2024). Integrated seismic stratigraphic and structural analysis of southern main Ethiopian rift basin: implications for hydrocarbon potentials. Acta Geophys. 72 (2), 597–617. doi:10.1007/s11600-023-01111-7
Keir, D., Bastow, I. D., Corti, G., Mazzarini, F., and Rooney, T. O. (2015). The origin of along-rift variations in faulting and magmatism in the Ethiopian rift. Tectonics 34 (3), 464–477. doi:10.1002/2014TC003698
Keir, D., La Rosa, A., Pagli, C., Wang, H., Ayele, A., Lewi, E., et al. (2025). The 2024 fentale diking episode in a slow extending Continental rift. Geophys. Res. Lett. 52, e2024GL113214. doi:10.1029/2024GL113214
Kidane, T., Courtillot, V., Manighetti, I., Audin, L., Lahitte, P., Quidelleur, X., et al. (2003). New paleomagnetic and geochronologic results from Ethiopian Afar: block rotations linked to rift overlap and propagation and determination of a ∼2 Ma reference pole for stable Africa. J. Geophys. Res. 108 (B2). doi:10.1029/2001JB000645
Kieffer, B., Arndt, N., Lapierre, H., Bastien, F., Bosch, D., Pecher, A., et al. (2004). Flood and shield basalts from Ethiopia: magmas from the African superswell. J. Petrology 45 (4), 793–834. doi:10.1093/petrology/egg112
Kogan, L., Fisseha, S., Bendick, R., Reilinger, R., McClusky, S., King, R., et al. (2012). Lithospheric strength and strain localization in Continental extension from observations of the east African rift. J. Geophys. Res. Solid Earth 117 (3), B03402. doi:10.1029/2011jb008516
Lahitte, P., Gillot, P. Y., and Courtillot, V. (2003). Silicic central volcanoes as precursors to rift propagation: the Afar case. Earth Planet. Sci. Lett. 207 (1–4), 103–116. doi:10.1016/S0012-821X(02)01130-5
La Rosa, A., Pagli, C., Wang, H., Doubre, C., Leroy, S., Sani, F., et al. (2021). Plate-boundary kinematics of the afrera linkage zone (afar) from InSAR and seismicity. J. Geophys. Res. Solid Earth 126, e2020JB021387. doi:10.1029/2020JB021387
La Rosa, A., Pagli, C., Wang, H., Sigmundsson, F., Pinel, V., and Keir, D. (2024). Simultaneous rift-scale inflation of a deep crustal sill network in Afar, East Africa. Nat. Commun. 15, 4287. doi:10.1038/s41467-024-47136-4
Larsen, L. M., and Pedersen, A. K. (2000). Processes in high-mg, High-T magmas: evidence from olivine, chromite and glass in Palaeogene picrites from west Greenland. J. Petrology 41 (7), 1071–1098. doi:10.1093/PETROLOGY/41.7.1071
Lavayssière, A., Rychert, C., Harmon, N., Keir, D., Hammond, J. O. S., Kendall, J.-M., et al. (2018). Imaging lithospheric discontinuities beneath the northern east African rift using S-to-P receiver functions. Geochem. Geophys. Geosystems 19, 4048–4062. doi:10.1029/2018GC007463
Le Maitre, R. W., Streckeisen, A., Zanettin, B., Le Bas, M. J., Bonin, B., and Bateman, P. (2005). Igneous rocks: a classification and glossary of terms: recommendations of the international union of geological sciences subcommission on the systematics of igneous rocks. Cambridge University Press.
Leroy, S., d’Acremont, E., Tiberi, C., Basuyau, C., Autin, J., Lucazeau, F., et al. (2010). Recent off-axis volcanism in the eastern gulf of Aden: implications for plume–ridge interaction. Earth Planet. Sci. Lett. 293 (1–2), 140–153. doi:10.1016/J.EPSL.2010.02.036
Lowenstern, J. B., Charlier, B. L. A., Clynne, M. A., and Wooden, J. L. (2006). Extreme U–Th disequilibrium in rift-related basalts, rhyolites and granophyric granite and the timescale of rhyolite generation, intrusion and crystallization at alid volcanic center, Eritrea. J. Petrology 47 (11), 2105–2122. doi:10.1093/petrology/egl038
Maestrelli, D., Sani, F., Keir, D., Pagli, C., Rosa, A. L., Muluneh, A. A., et al. (2024). Reconciling plate motion and faulting at a rift-rift-rift triple junction. Geology 52 (5), 362–366. doi:10.1130/G51909.1
Maguire, P. K. H., Keller, G. R., Klemperer, S. L., Mackenzie, G. D., Keranen, K., Harder, S., et al. (2006). Crustal structure of the northern main Ethiopian rift from the EAGLE controlled-source survey; a snapshot of incipient lithospheric break-up. Geol. Soc. Spec. Publ. 259, 269–292. doi:10.1144/GSL.SP.2006.259.01.21
Mazzarini, F., Keir, D., and Isola, I. (2013). Spatial relationship between earthquakes and volcanic vents in the central-northern main Ethiopian rift. J. Volcanol. Geotherm. Res. 262, 123–133. doi:10.1016/j.jvolgeores.2013.05.007
McDonough, W. F. (1990). Constraints on the composition of the Continental lithospheric mantle. Earth Planet. Sci. Lett. 101 (1), 1–18. doi:10.1016/0012-821X(90)90119-I
McLennan, S. M., Taylor, S. R., McCulloch, M. T., and Maynard, J. B. (1990). Geochemical and Nd-Sr isotopic composition of deep-sea turbidites: crustal evolution and plate tectonic associations. Geochimica Cosmochimica Acta 54 (7), 2015–2050. doi:10.1016/0016-7037(90)90269-Q
Nicotra, E., Viccaro, M., Donato, P., Acocella, V., and De Rosa, R. (2021). Catching the main Ethiopian rift evolving towards plate divergence. Sci. Rep. 11 (1), 21821. doi:10.1038/s41598-021-01259-6
Niu, Y. (2021). Lithosphere thickness controls the extent of mantle melting, depth of melt extraction and basalt compositions in all tectonic settings on Earth – a review and new perspectives. Earth-Science Rev. 217, 103614. doi:10.1016/J.EARSCIREV.2021.103614
Pagli, C., Yun, S. H., Ebinger, C., Keir, D., and Wang, H. (2019). Strike-slip tectonics during rift linkage. Geology 47 (1), 31–34. doi:10.1130/G45345.1
Peccerillo, A., Barberio, M. R., Yirgu, G., Ayalew, D., Barbieri, M., and Wu, T. W. (2003). Relationships between mafic and peralkaline silicic magmatism in Continental rift settings: a petrological, geochemical and isotopic study of the gedemsa volcano, central Ethiopian rift. J. Petrology 44 (11), 2003–2032. doi:10.1093/petrology/egg068
Peccerillo, A., Donati, C., Santo, A. P., Orlando, A., Yirgu, G., and Ayalew, D. (2007). Petrogenesis of silicic peralkaline rocks in the Ethiopian rift: geochemical evidence and volcanological implications. J. Afr. Earth Sci. 48 (2–3), 161–173. doi:10.1016/j.jafrearsci.2006.06.010
Pik, R., Deniel, C., Coulon, C., Yirgu, G., Hofmann, C., and Ayalew, D. (1998). The northwestern ethiopian Plateau flood basalts: classification and spatial distribution of magma types. J. Volcanol. Geotherm. Res. 81 (1–2), 91–111. doi:10.1016/S0377-0273(97)00073-5
Pik, R., Deniel, C., Coulon, C., Yirgu, G., and Marty, B. (1999). Isotopic and trace element signatures of Ethiopian flood basalts: evidence for plume-lithosphere interactions. Geochimica Cosmochimica Acta 63 (15), 2263–2279. doi:10.1016/s0016-7037(99)00141-6
Rampey, M. L. (2005). The geology of the kone volcanic complex. Ethiopia: University of Cambridge. PhD thesis.
Rees, R., Gernon, T. M., Keir, D., Taylor, R. N., and Pagli, C. (2023). The spatial and volcanic evolution of ayelu, abida and yangudi volcanoes in the northern main Ethiopian rift–southern Afar, Ethiopia. J. Volcanol. Geotherm. Res. 440, 107846. doi:10.1016/j.jvolgeores.2023.107846
Ronga, F., Lustrino, M., Marzoli, A., and Melluso, L. (2010). Petrogenesis of a basalt-comendite-pantellerite rock suite: the boseti volcanic complex (main Ethiopian rift). Mineralogy Petrology 98 (1–2), 227–243. doi:10.1007/s00710-009-0064-3
Rooney, T. O., Furman, T., Yirgu, G., and Ayalew, D. (2005). Structure of the Ethiopian lithosphere: xenolith evidence in the main Ethiopian rift. Geochimica Cosmochimica Acta 69 (15), 3889–3910. doi:10.1016/j.gca.2005.03.043
Rooney, T. O., Herzberg, C., and Bastow, I. D. (2012). Elevated mantle temperature beneath East Africa. Geology 40 (1), 27–30. doi:10.1130/G32382.1
Shaw, D. M. (2000). Continuous (dynamic) melting theory revisited. Can. Mineralogist 38 (5), 1041–1063. doi:10.2113/GSCANMIN.38.5.1041
Siegburg, M. (2019). Evolution of faulting and magmatism during volcanic rifting in the Ethiopian rift. Southampton: University of Southampton. PhD thesis.
Siegburg, M., Bull, J. M., Nixon, C. W., Keir, D., Gernon, T. M., Corti, G., et al. (2020). Quantitative constraints on faulting and fault slip rates in the northern main Ethiopian rift. Tectonics 39 (8), e2019TC006046. doi:10.1029/2019TC006046
Siegburg, M., Gernon, T. M., Bull, J. M., Keir, D., Barfod, D. N., Taylor, R. N., et al. (2018). Geological evolution of the boset-bericha volcanic complex, main Ethiopian rift: 40ar/39ar evidence for episodic Pleistocene to Holocene volcanism. J. Volcanol. Geotherm. Res. 351, 115–133. doi:10.1016/j.jvolgeores.2017.12.014
Siegburg, M., Gernon, T. M., Keir, D., Bull, J. M., Taylor, R. N., Watts, E. J., et al. (2023). Temporal clustering of fissural eruption across multiple segments within the Ethiopian rift. Front. Earth Sci. 11, 588. doi:10.3389/FEART.2023.1169635
Su, B., Zhang, H., Asamoah, S. P., Qin, K., Tang, Y., Ying, J., et al. (2010). Garnet-spinel transition in the upper mantle: review and interpretation. J. Earth Sci. 21 (5), 635–640. doi:10.1007/s12583-010-0117-x
Sun, S. S., and McDonough, W. F. (1989). Chemical and isotopic systematics of Oceanic basalts: implications for mantle composition and processes. Geol. Soc. Lond. Spec. Publ. 42 (1), 313–345. doi:10.1144/GSL.SP.1989.042.01.19
Terry, R. D., and Chilingar, G. V. (1955). Summary of concerning some additional aids in studying sedimentary formations, by M. S. Shvetsov. J. Sediment. Res. Editor M. S. Shvetsov, 25 3, 229–234. doi:10.1306/74D70466-2B21-11D7-8648000102C1865D
Tesfaye, S., Harding, D. J., and Kusky, T. M. (2003). Early Continental breakup boundary and migration of the Afar triple junction, Ethiopia. Geol. Soc. Am. Bull. 115 (9), 1053–1067. doi:10.1130/B25149.1
Tortelli, G., Gioncada, A., Pagli, C., Barfod, D., Corti, G., Sani, F., et al. (2025). Volcanism records plate thinning driven rift localization in Afar (ethiopia) since 2-2.5 million years ago. Commun. Earth Environ. 6, 395. doi:10.1038/s43247-025-02356-4
Tortelli, G., Gioncada, A., Pagli, C., Braschi, E., Gebru, E. F., and Keir, D. (2022). Constraints on the magma source and rift evolution from geochemistry of the stratoid flood basalts (afar, Ethiopia). Geochem. Geophys. Geosystems 23 (8), e2022GC010434. doi:10.1029/2022GC010434
Tortelli, G., Gioncada, A., Pagli, C., Braschi, E., Gebru, E. F., and Keir, D. (2024). From melt-to crystal-rich magmatic systems during rift localization: insights from mineral chemistry in central Afar (ethiopia). Contributions Mineralogy Petrology 179 (10), 87. doi:10.1007/s00410-024-02164-7
Tortelli, G., Gioncada, A., Pagli, C., Rosi, M., De Dosso, L., and Keir, D. (2021). Evidence of active magmatic rifting at the ma’Alalta volcanic field (afar, Ethiopia). Bull. Volcanol. 83 (6), 38. doi:10.1007/s00445-021-01461-4
Trippanera, D., Acocella, V., Ruch, J., and Abebe, B. (2015). Fault and graben growth along active magmatic divergent plate boundaries in Iceland and Ethiopia. Tectonics 34 (11), 2318–2348. doi:10.1002/2015TC003991
Trua, T., Deniel, C., and Mazzuoli, R. (1999). Crustal control in the genesis of plio-quaternary bimodal magmatism of the main ethiopian rift (MER): geochemical and isotopic (sr, Nd, pb) evidence. Chem. Geol. 155 (3–4), 201–231. doi:10.1016/S0009-2541(98)00174-0
Varet, J. (2017). in Geology of Afar (east Africa). Editors R. Oberhänsli, de Wit, J. Maarten, and F. M. Roure 1st ed (Cham: Springer Nature).
Viltres, R., Jónsson, S., Ruch, J., Doubre, C., Reilinger, R., Floyd, M., et al. (2020). Kinematics and deformation of the Southern Red Sea region from GPS observations. Geophys. J. Int. 221 (3), 2143–2154. doi:10.1093/gji/ggaa109
Watts, E. J., Gernon, T. M., Taylor, R. N., Keir, D., and Pagli, C. (2023). Magmatic evolution during proto-oceanic rifting at alu, dalafilla and borale volcanoes (afar) determined by trace element and Sr-Nd-Pb isotope geochemistry. Lithos 456–457, 107311. doi:10.1016/J.LITHOS.2023.107311
Watts, E. J., Gernon, T. M., Taylor, R. N., Keir, D., Siegburg, M., Jarman, J., et al. (2020). Evolution of the alu-dalafilla and borale volcanoes, Afar, Ethiopia. J. Volcanol. Geotherm. Res. 408, 107094. doi:10.1016/j.jvolgeores.2020.107094
Watts, E. J., Rees, R., Jonathan, P., Keir, D., Tylor, R. N., Siegburg, M., et al. (2025). Mantle upwelling at Afar triple junction shaped by overriding plate dynamics. Nat. Geosci. 18, 661–669. doi:10.1038/s41561-025-01717-0
Weaver, B. L. (1991). The origin of ocean island basalt end-member compositions: trace element and isotopic constraints. Earth Planet. Sci. Lett. 104 (2–4), 381–397. doi:10.1016/0012-821X(91)90217-6
Wilkinson, J. F. G. (1982). The genesis of mid-ocean ridge basalt. Earth-Science Rev. 18 (1), 1–57. doi:10.1016/0012-8252(82)90002-2
Wilson, M. (1989). in Igneous petrogenesis: a global tectonic approach. Editor M. Wilson 1st ed (Berlin: Springer Dordrecht).
WoldeGabriel, G., Aronson, J. L., and Walter, R. C. (1990). Geology, geochronology, and rift basin development in the central sector of the main Ethiopia rift. GSA Bull. 102 (4), 439–458. Available online at: https://pubs.geoscienceworld.org/gsa/gsabulletin/article/102/4/439/182414/Geology-geochronology-and-rift-basin-development (Accessed December 15, 2023).
Wolfenden, E., Ebinger, C. J., Yirgu, G., Deino, A. L., and Ayalew, D. (2004). Evolution of the northern main Ethiopian rift: birth of a triple junction. Earth Planet. Sci. Lett. 224 (1–2), 213–228. doi:10.1016/j.epsl.2004.04.022
Wolfenden, E., Ebinger, C. J., Yirgu, G., Renne, P. R., and Kelley, S. P. (2005). Evolution of a volcanic rifted margin: southern Red Sea, Ethiopia. Bull. Geol. Soc. Am. 117 (7–8), 846–864. doi:10.1130/B25516.1
Wong, K., Ferguson, D. J., Matthews, S., Morgan, D., Tadesse, A. Z., Sinetebeb, Y., et al. (2022). Exploring rift geodynamics in Ethiopia through olivine-spinel Al-exchange thermometry and rare-earth element distributions. Earth Planet. Sci. Lett. 597, 117820. doi:10.1016/J.EPSL.2022.117820
Wood, B. J., Kiseeva, E. S., and Matzen, A. K. (2013). Garnet in the earth’s mantle. Elements 9 (6), 421–426. doi:10.2113/GSELEMENTS.9.6.421
Keywords: trace elements, AFAR, volcano, rift, geochemistry
Citation: Rees R, Watts EJ, Gernon TM, Taylor RN, Pagli C and Keir D (2025) Melt generation and evolution in the Adda’do rift segment of the Afar rift from trace elements and petrography. Front. Earth Sci. 13:1575660. doi: 10.3389/feart.2025.1575660
Received: 12 February 2025; Accepted: 14 July 2025;
Published: 25 July 2025.
Edited by:
Marco Viccaro, University of Catania, ItalyReviewed by:
Eugenio Nicotra, University of Calabria, ItalyCynthia J. Ebinger, Tulane University, United States
Copyright © 2025 Rees, Watts, Gernon, Taylor, Pagli and Keir. This is an open-access article distributed under the terms of the Creative Commons Attribution License (CC BY). The use, distribution or reproduction in other forums is permitted, provided the original author(s) and the copyright owner(s) are credited and that the original publication in this journal is cited, in accordance with accepted academic practice. No use, distribution or reproduction is permitted which does not comply with these terms.
*Correspondence: Derek Keir, ZC5rZWlyQHNvdG9uLmFjLnVr