 Hu He1
 Wei Wang
- 1Technical Test Centre of Sinopec Shengli Oil Field, Dongying, China
- 2School of Geosciences and Info-Physics, Central South University, Changsha, China
Calibrating traditional inventory-based emission estimates with top-down point source inversion results is of significant importance. To address the challenges posed by satellite remote sensing in accurately assessing methane point source emissions and the inefficiency of ground-based mobile measurement due to the lack of prior information, this paper proposes a novel space-ground integration system of methane emission monitoring and quantification. The system utilizes a classic matched filter (CMF) algorithm to retrieve greenhouse gas concentration increments from multi-temporal hyperspectral images, thereby identifying continuous point sources, which subsequently guides the development of ground-based emission data collection plans. The EMISSION-PARTITION model is applied to quantify point source emission intensities. In April 2024, our team conducted an experiment based on this system in a petrochemical industrial park in Dongying, China. Satellite observations identified key continuous point sources with an uncertainty of 8.08%. The point source emission intensities quantified from mobile measurement ranged from a minimum of 139.36 kg/hto a maximum of 107.42 kg/h, with uncertainties controlled within 19.1%. This experiment provides valuable insights for similar greenhouse gas emission monitoring and quantification tasks.
1 Introduction
Anthropogenic greenhouse gas emissions are the primary drivers of climate change, leading to a range of severe environmental issues (Levy et al., 1999). Methane is the second-largest greenhouse gas after carbon dioxide, with a 20-year global warming potential (GWP) 84 times that of carbon dioxide for the same mass (Commission et al., 2021). Therefore, methane emission control is a key measure for mitigating the rapid intensification of global warming in the short term (Erland et al., 2022). Currently, over 150 countries worldwide have signed the Global Methane Pledge, calling for a one-third reduction in anthropogenic methane emissions by 2030. In 2023, China also issued the ‘Methane Emission Control Action Plan,’ explicitly incorporating the control of anthropogenic methane emissions into its next Five-Year Plan.
Currently, reports on anthropogenic methane emissions primarily rely on the ‘bottom-up’ inventory (Omara et al., 2023). Unlike carbon dioxide emission inventories (Xu et al., 2024), compiling methane emission inventories is more challenging and has greater uncertainty (Han et al., 2024a). The reason is that, first, the locations of methane emission sources are often unknown (Jacob et al., 2022; Naus et al., 2023). In recent years, numerous studies have focused on using satellite remote sensing to identify methane super-emitters in the oil, gas, and coal mining industries to address the issue of unknown emission source locations and magnitudes (Irakulis-Loitxate et al., 2021; Cusworth et al., 2022; He T.-L. et al., 2024; Sherwin et al., 2024; Williams et al., 2024; Zhang et al., 2023; Wang et al., 2025a). Second, the applicability of emission factor data can directly determine the accuracy of the emission inventory (Kirschke et al., 2013). Within a specific industry, natural endowments of different basins and the extraction techniques of different companies can significantly impact emission factors, making it difficult to apply default or country-level emission factors to specific regions and enterprises (Buchwitz et al., 2017a; Zhang et al., 2020; Chen et al., 2022; Collins et al., 2022; Meyer et al., 2022). To address these issues, the ‘2019 Refinement to the 2006 IPCC Guidelines for National Greenhouse Gas Inventories’ proposed the use of ‘top-down’ greenhouse gas concentration observations to calibrate emission inventories (Allan et al., 2023). The quality of observational data plays a critical role in atmospheric retrieval, and the measurement results obtained from different observation methods and platforms vary significantly in form and characteristics (Zhang et al., 2022; Shi et al., 2022; Yi et al., 2024; Shi et al., 2023a; Wang et al., 2025b). For large-scale detection, satellite remote sensing is the optimal observation method, as it can conduct low-cost, repeated observations over specific regions (Hu et al., 2018; He J. et al., 2024). At present, TROPOMI provides routine
To address the aforementioned issues, this work proposes a space-ground integration method for identifying and quantifying methane emissions. First, hyperspectral satellites are used to conduct multiple repeated observations of methane emission areas, employing multi-scene averaging method to identify key methane emission sources within the industrial park. Based on this, meteorological data guide the mobile measurement tasks, involving multiple measurements downwind of the key emission sources to collect reliable and accurate methane concentration data. Finally, the methane emission quantification method is applied to the mobile measurement data to determine the emission rates of the key sources. The remainder of this paper is organized as follows: Chapter 2 describes the study area, as well as the measurement equipment and data used in this study. In this chapter, we will also provide a detailed description of the key algorithms, methods, and processes employed in each step of the work. In Chapter 3, we present the results of identifying key emission sources within the industrial park using the space-ground integration method of methane emission identification and quantification, along with the emission intensities quantified from the mobile measurement data.
2 Materials and methods
2.1 Description of study area
This study selected the Dongying Port Petrochemical Industrial Park in Dongying City, Shandong Province as the study area, as shown in Figure 1. The energy industry is a priority area for methane emission control. In recent years, multiple research groups have focused on super-emitters in the oil and gas sectors in the Permian Basin (United States), Algeria, and Uzbekistan. In China, coal mine is a significant source of the methane emission. Some researchers have conducted quantification experiments on these super-emitters using satellite and ground-based observations. A notable limitation of the above studies is their relatively high detection threshold for emissions. Currently, the widely recognized detection threshold for point-source methane emissions based on satellite remote sensing is approximately 400–500 kg/h. However, recent studies suggest that low-intensity, continuous emission sources can account for over 50% of total emissions, highlighting the need for improvements in current detection technologies. The Shengli Oilfield in Dongying City is China’s second-largest oilfield by crude oil production. According to statistics, approximately 80% of the oil geological reserves and 85% of the crude oil production of Shengli Oilfield are concentrated in Dongying City, Shandong Province, forming a typical large-scale oil extraction and processing cluster in China. As the most important petrochemical base in the region, the Dongying Port Petrochemical Industrial Park has a primary crude oil processing capacity of 15.8 million tons per year, with an annual output of about 80 million tons of energy and chemical products, and an annual industrial output value exceeding 200 billion RMB. The park integrates crude oil extraction, storage and transportation, refining, and downstream product processing. It features a wide variety of methane emission sources with a complex emission structure, encompassing both point and area sources, making it highly representative. Therefore, conducting methane emission monitoring in this area has significant practical relevance and replicability, and can serve as a model for emission verification and intergration observation methods in typical petrochemical industrial parks. Due to its advanced extraction technologies, super-emitters with emission intensities above 500 kg/h are rarely observed in this oilfield. Most emissions belong to low-flux sources. Thus, it provides suitable conditions for testing the detection threshold of this method.
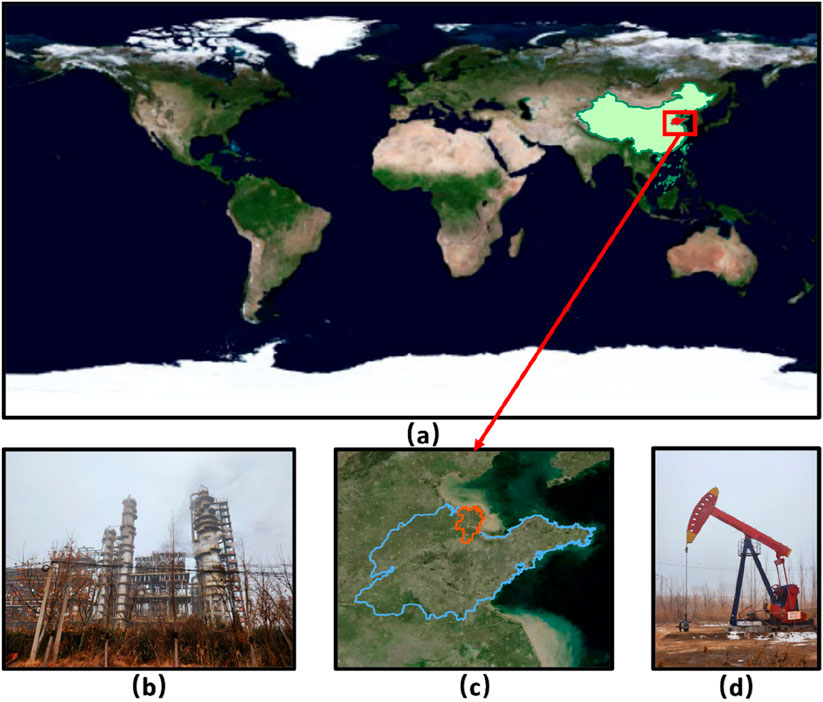
Figure 1. Experimental area and data collection objects: (a) location of Shandong Province in China; (b) petroleum refining facilities; (c) location of Dongying City in Shandong Province; (d) oil extraction facilities.
2.2 Space-based emission tracking system (SETS)
2.2.1 Description of data and procedure
This study utilizes the Gaofen-5 (GF-5) and Ziyuan-1 (ZY-1) satellites, developed and operated by the China National Space Administration, which is designed to provide multi-band, high-resolution Earth observation data. The satellites are equipped with the Advanced Hyperspectral Imager (AHSI) payload (Tang et al., 2023), which primarily collects spectral data with a spatial resolution of 30 m in the 400–2,500 nm range, covering the visible, infrared, and near-infrared bands.
This study utilized 35 scenes of satellite imagery data, including four scenes from GF5A, 14 scenes from GF5B, seven scenes from ZY1E and 10 scenes from ZY1F. For the GF-5 satellite series, the Advanced Hyperspectral Imager (AHSI) has a spectral resolution of approximately 10 nm in the Short-Wave Infrared (SWIR) bands and 5 nm in the Visible-Near Infrared (VNIR) bands. The VNIR bands consist of 150 spectral channels, while the SWIR bands contain 180 spectral channels, resulting in a total of 330 spectral bands. For the ZY-1 satellite series, the AHSI sensor has a spectral resolution of approximately 20 nm in the SWIR bands and 10 nm in the VNIR bands. The VNIR section consists of 76 spectral channels, and the SWIR section comprises 90 spectral channels, totaling 166 spectral bands. Detailed information about the data is provided in Table 1. The data can be accessed at: https://data.cresda.cn/#/home.
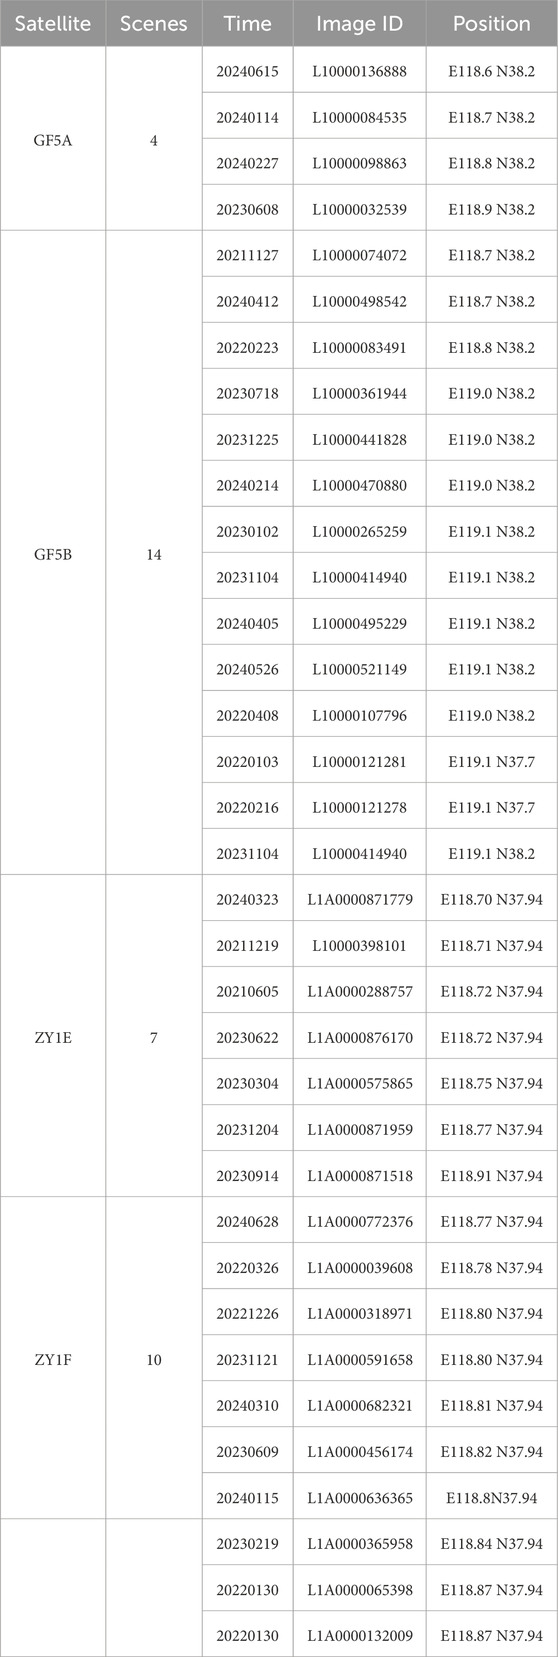
Table 1. Details of Satellite data retrieval.
After acquiring the 35 scenes of hyperspectral remote sensing data, standard preprocessing steps such as radiometric calibration and geometric correction are applied. Next, land cover masks that could interfere with the CMF results are extracted, including cloud masks, water masks, and shadow masks. Radiometric calibration and masks’ extraction are performed using MATLAB code, while geometric correction is implemented using Python by invoking the GDAL library.
In this study, the Normalized Difference Water Index (NDWI) was used to extract water masks (Qiao et al., 2012). NDWI is a normalized ratio index based on the green and near-infrared bands (Qiu et al., 2024), with the formula shown in Equation 1.
The red, green, and blue channels correspond to spectral bands of 640 nm, 550 nm, and 460 nm, respectively, while the NIR channel utilizes the 850 nm band. After calculating the NDWI values for each pixel, a water segmentation threshold was determined (Yang et al., 2024). Pixels with NDWI values greater than this threshold are classified as water, while those with NDWI values below the threshold are classified as non-water.
In this study, shadow masks are extracted based on the
Shadow regions in the RGB space exhibit a decrease in pixel values, with
Cloud masks are extracted using the cloud detection method proposed by Wang (Wang et al., 2021). This method first calculates the equivalent apparent reflectance
The formulas for calculating the equivalent apparent reflectance for different bands are provided in Equations 6, 7.
Calculate the methane concentration increment using CMF for each scene of the imagery after extracting the interference masks, and perform multi-scene averaging. The purpose of averaging is twofold: first, to reduce the noise impact of the CMF results from individual scenes. Multi-scene averaging is grounded in the statistical principle of signal averaging. By computing the pixel-wise arithmetic mean of satellite images acquired over the same area at different times, this technique takes advantage of the assumption that non-systematic background noise follows a zero-mean Gaussian distribution. If the background noise across scenes is independent and identically distributed with constant variance, then averaging N observations reduces the variance of noise by a factor of 1/N. This significantly improves the signal-to-noise ratio (SNR) and helps enhance weak emission signals. Since actual emission sources exhibit spatial consistency across scenes, their signals remain coherent and are preserved during averaging. In contrast, incoherent noise is averaged out, approaching a mean of zero. The second purpose is to identify persistent emission sources within the industrial park. Due to the instantaneous nature of single-scene imagery, methane emission sources identified based on the CMF results of individual scenes may be non-persistent. The retrieval results of such sources have limited reference value for emission inventory corrections. In ground-based data collection efforts, focusing on persistent emission point sources based on the CMF results can enhance the efficiency and quality of data collection.
2.2.2 Classic matched filter
The Classic Matched Filter (CMF) is a data-driven statistical method used to extract spectral background values and enhance signals (Stocker, 1990). In this study, the CMF model effectively isolates the
In this study, two methane absorption spectral windows at 1.66 µm and 2.3 µm are utilized. The specific bands employed are listed in the Table 2 below.
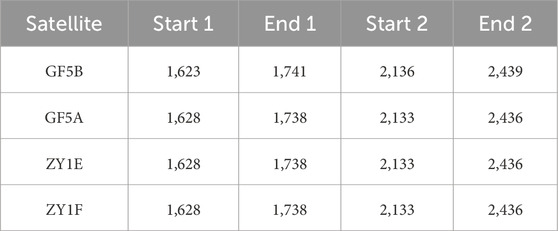
Table 2. Details of Satellite data retrieval.
Since the AHSI sensor acquires data using a column-by-column scanning mode, the retrieval is performed on a column basis. According to Beer’s Law, the formula obtained is given by Equation 8.
By solving this formula using the least squares method, the gas concentration increment for each pixel can be obtained, as shown in Equation 9.
2.3 Ground-based emission collecting system (GECS)
2.3.1 Description of data and devices
The ground-based emission collection system (GECS) primarily consists of a civilian vehicle, a methane concentration analyzer (PICARRO G2301), a Global Positioning System (GPS), and an acoustic anemometer (AIRMAR Weather Station 200WX), as shown in Figure 2. The PICARRO G2301 is used to measure
Figure 2. Devices of ground-based emission collecting system.
A detailed explanation of how the ultrasonic anemometer was set up is necessary. This instrument is equipped with an internal GPS module, which in theory allows for wind speed measurements on a moving platform by vector summation of the platform’s motion and the measured wind. However, field tests revealed that wind data collected during vehicle movement were significantly affected by platform-induced perturbations, resulting in insufficient accuracy for dynamic observations. To address this issue, we adopted a static wind measurement strategy downwind of the emission sources. The procedure is as follows:
a) The vehicle is stopped at the location exhibiting the maximum methane concentration enhancement;
b) The AIRMAR 200WX is mounted at a height of 1.5 m above ground level, matching the height of the intake tube of the PICARRO analyzer mounted on the vehicle roof, ensuring consistent airflow sampling conditions between the two instruments;
c) The anemometer is left stationary for 2 min, during which wind speed and direction were recorded at a 1 Hz sampling rate;
d) The representative wind speed and direction at each location are determined by computing the arithmetic mean of the 2-min data, which are then used as wind field inputs for downwind flux inversion along the corresponding mobile survey transect;
e) To evaluate measurement uncertainty, the standard deviation of wind speed and direction is also computed at each site, providing a quantitative assessment of the anemometer’s precision under static deployment conditions.
We utilized the GECS to collect data on 1 April 2024, around noon. The timing for data collection was chosen based on preliminary field surveys: at noon, the number of large oil tankers and other heavy vehicles on internal park roads is minimal, which effectively reduces the influence of traffic emissions on the ambient methane background. During the survey period, the weather was cloudy with an air temperature of approximately 20°C and a stable near-surface wind field, conditions that are favorable for back-trajectory analysis of mobile survey data and for conducting high-precision flux inversions. Whenever a
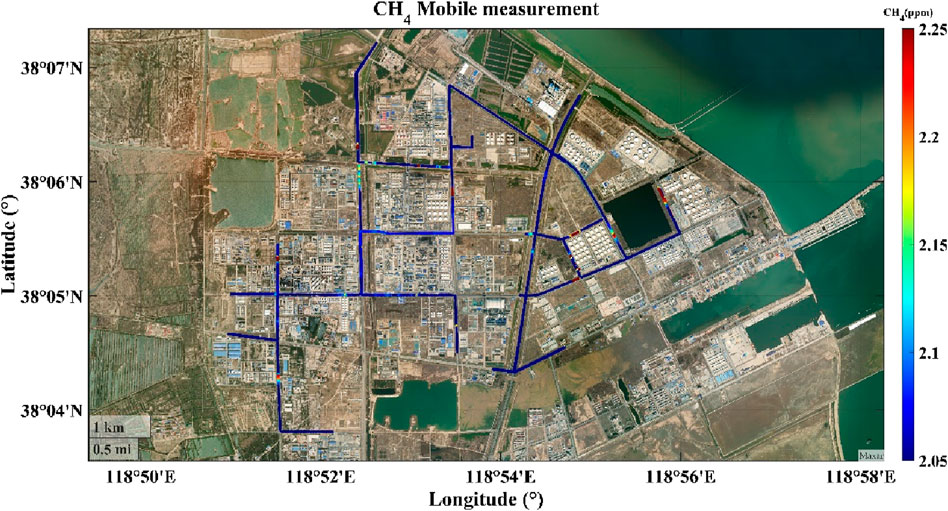
Figure 3. Data collected by ground-based emission collecting system.
2.3.2 EMISSION-PARTITION model
The EMISSION-PARTITION model can compute point source emission intensities rapidly and adaptively with only prior information on parameter initial value ranges (Shi et al., 2023b). Its core is the Gaussian dispersion model, as described by Equations 10–12 (Bovensmann et al., 2010).
A three-dimensional coordinate system is set up based on the location of the emission point source and wind direction, with the point source located at the origin. The
The core of the EMISSION-PARTITION model involves solving the unknowns in Equations 10–12 using Particle Swarm Optimization (PSO) and Interior Point Penalty Function (IPPF) (Shi et al., 2020). The fitness function is defined as Equation 13. First, the potential range of the unknown parameters is defined based on the PSO model. Then, using this range as the parameter domain, the unknown parameters are precisely solved using the Interior Point Penalty Function, yielding the optimized parameter results.
2.4 Space-ground integration system
The space-ground integration methane emission monitoring and quantification system consists of a space-based emission tracking system (SETS) and a ground-based emission collection system (GECS), as shown in Figure 4. Due to the current limitations in satellite image precision for methane plume extraction, the primary function of the SETS in this system is to continuously observe the experimental area and acquire multi-temporal GF-5 hyperspectral remote sensing data. Since single-scene images are instantaneous, the methane emission sources identified from CMF results of individual scenes may be non-persistent sources. The emission intensity retrieval results from such sources provide limited reference value for emission inventory corrections. Therefore, multi-scene averaging is performed to reduce noise in each CMF result, thereby filtering out persistent point sources. This process guides the planning of the collection path for the GECS, improving data acquisition efficiency. The primary function of the GECS is to collect emission data from persistent methane sources within the experimental area. Using the GECS, emission data are precisely collected downwind of the point source to obtain Gaussian plume profiles, and the EMISSION-PARTITION model is then employed to rapidly quantify point source emission intensities. This system uses continuously repeated observations from space-based remote sensing data to provide prior knowledge for ground-based data collection experiments. Additionally, high-precision ground-level methane concentration data help to overcome the challenges of extracting methane plumes from CMF results. The space-ground collaborative observation provides researchers with a new, efficient, and high-precision method for greenhouse gas emission monitoring and quantification.
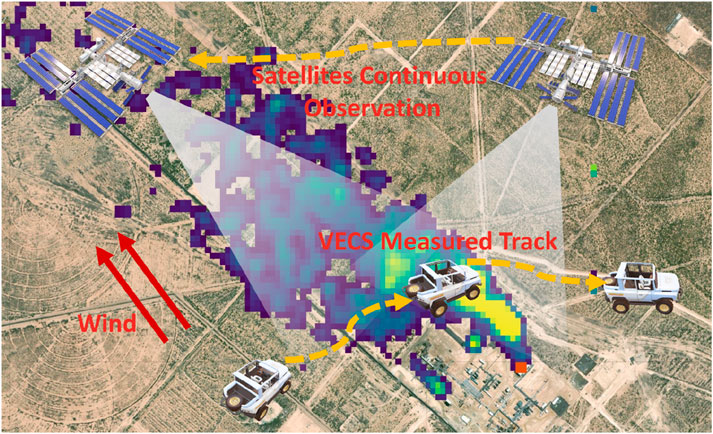
Figure 4. Concept map of space-ground integration system.
3 Results
We performed multi-scene averaging on the matched filter results from 35 hyperspectral images. Before selecting key methane emission sources, a series of processing steps must be applied to the multi-scene average results to achieve better visualization. First, we manually removed false-positive enhancements from the preliminary results. Due to the relatively low spatial resolution of 30 m from the AHSI sensor, linear anomalies with abnormally high values inevitably appear along water-land boundaries, which significantly interfere with the final map output and subsequent observation planning. Additionally, there are several rooftops with solar panels that caused false-positive enhancements. We manually delineated the vector boundaries of solar panel areas through visual inspection and generated corresponding masks. In the future, solar panels should be extracted during the process of applying masks for interfering ground objects. Second, we filtered and mapped the data where the
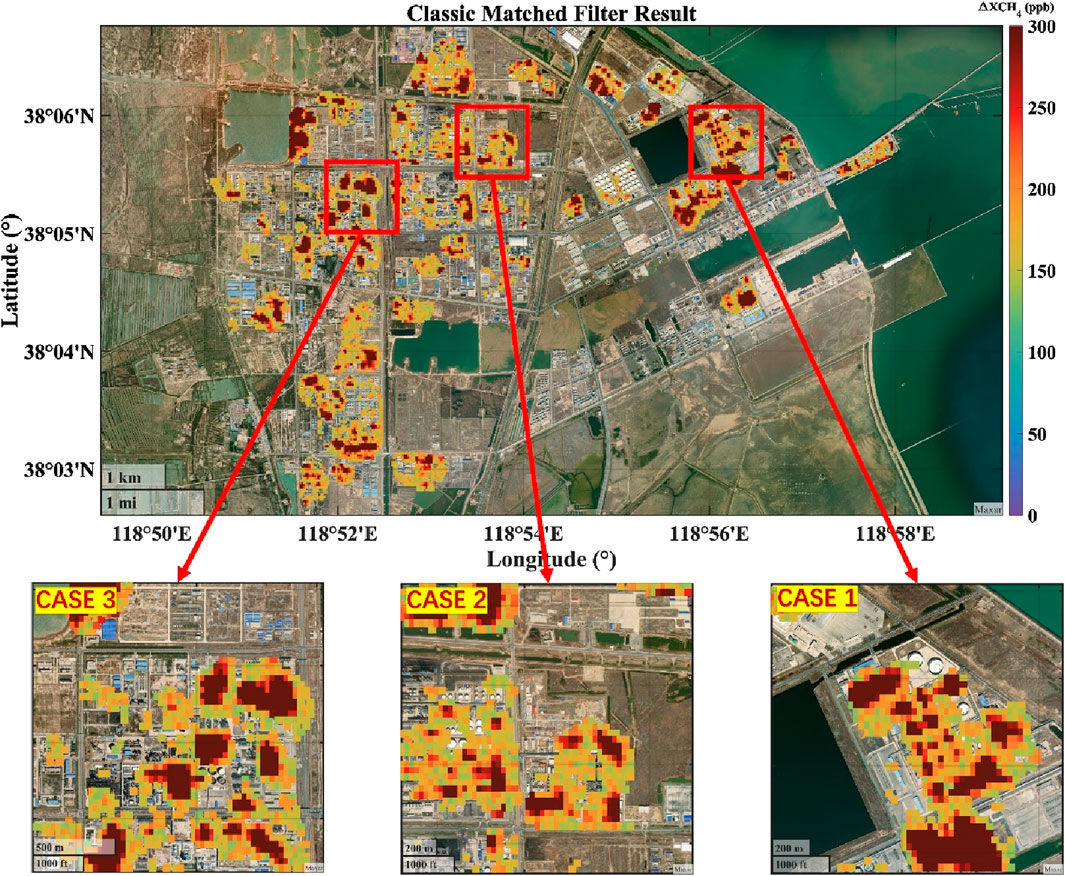
Figure 5. Results of CMF, including case 1, case 2 and case 3.
Based on the retrieval results from satellite data, a ground-based emission data collection plan was formulated. The plan involves conducting surrounding measurements of suspected emission sources identified in the satellite retrieval results, with a focus on collecting emission data from downwind locations of the sources. The EMISSION-PARTITION method is then used to invert the emission intensity. In this paper, three sets of emission cases are selected for retrieval analysis.
As shown in Figure 3, the
The first case received emission data from the oil storage tanks in the eastern part of the industrial park. During the actual mobile measurement, the wind direction was recorded as easterly with a wind speed of 2.6 m/s, and three emission plumes were detected downwind of the emission source. These plumes were numbered as the first, second, and third plumes, in order of proximity to the source, corresponding to Figures 6–8. In each figure, (a) represents the
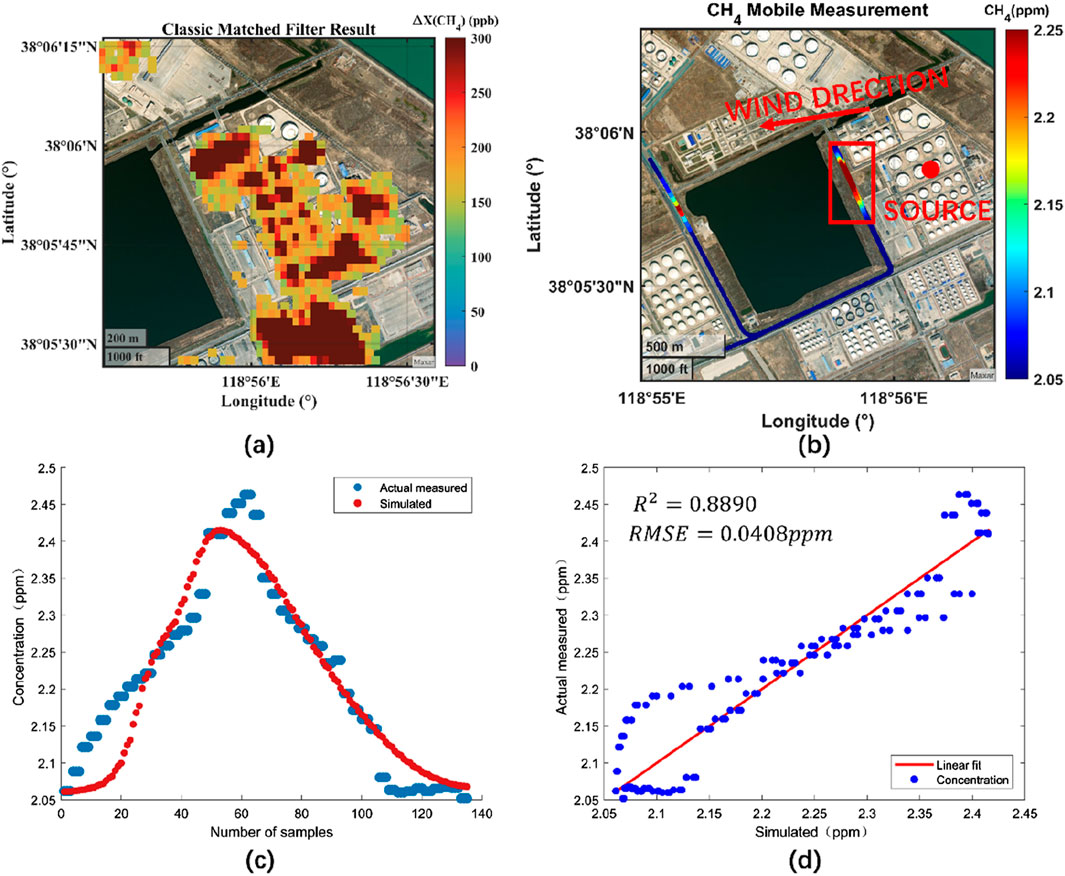
Figure 6. The result of the first strip in Case 1, (a) CMF results of the source, (b) locations of the source, (c) simulated
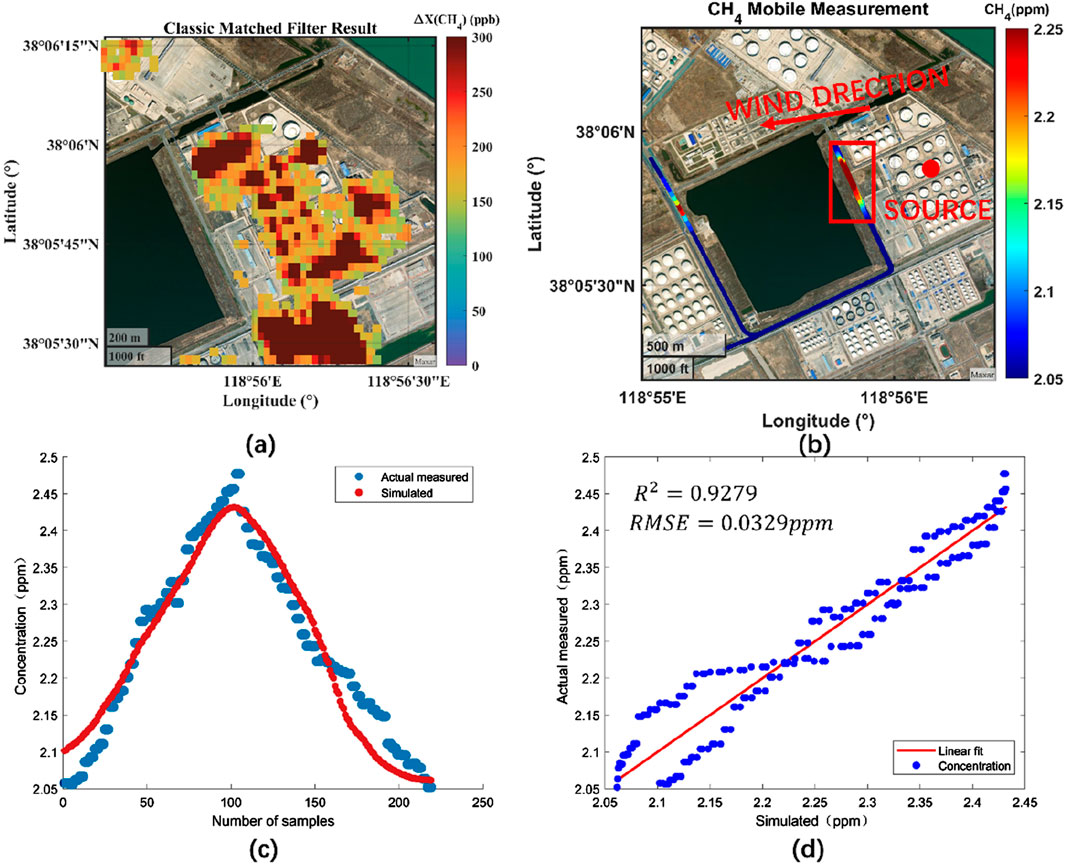
Figure 7. The result of the second strip in Case 1, (a) CMF results of the source, (b) locations of the source, (c) simulated
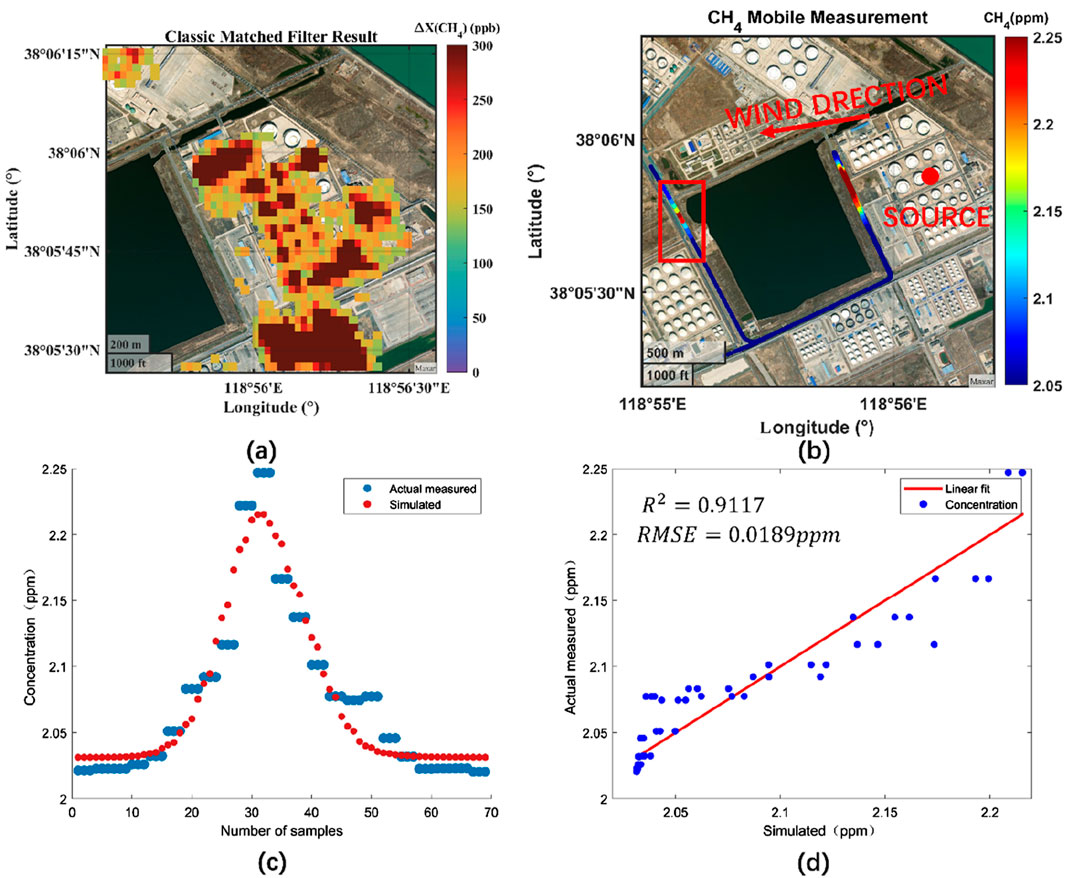
Figure 8. The result of the third strip in Case 1, (a) CMF results of the source, (b) locations of the source, (c) simulated
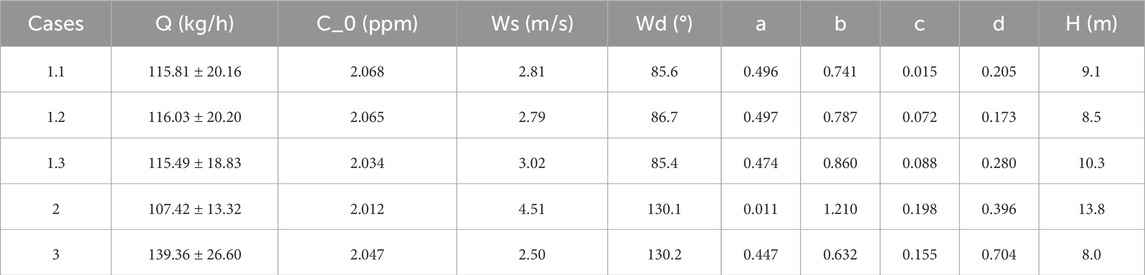
Table 3. Details of ground-based data retrieval.
The second case collected emission data from the petroleum refinery in the central part of the industrial park, where methane leakage may occur during the refining process. As shown in Figure 9, during the actual mobile measurement, the wind direction was recorded as southeast with a wind speed of 2.1 m/s, and the GECS captured elevated methane concentrations downwind of the emission source. Seventy-five data points are extracted from the plume to reconstruct the Gaussian diffusion model, with fitting results of
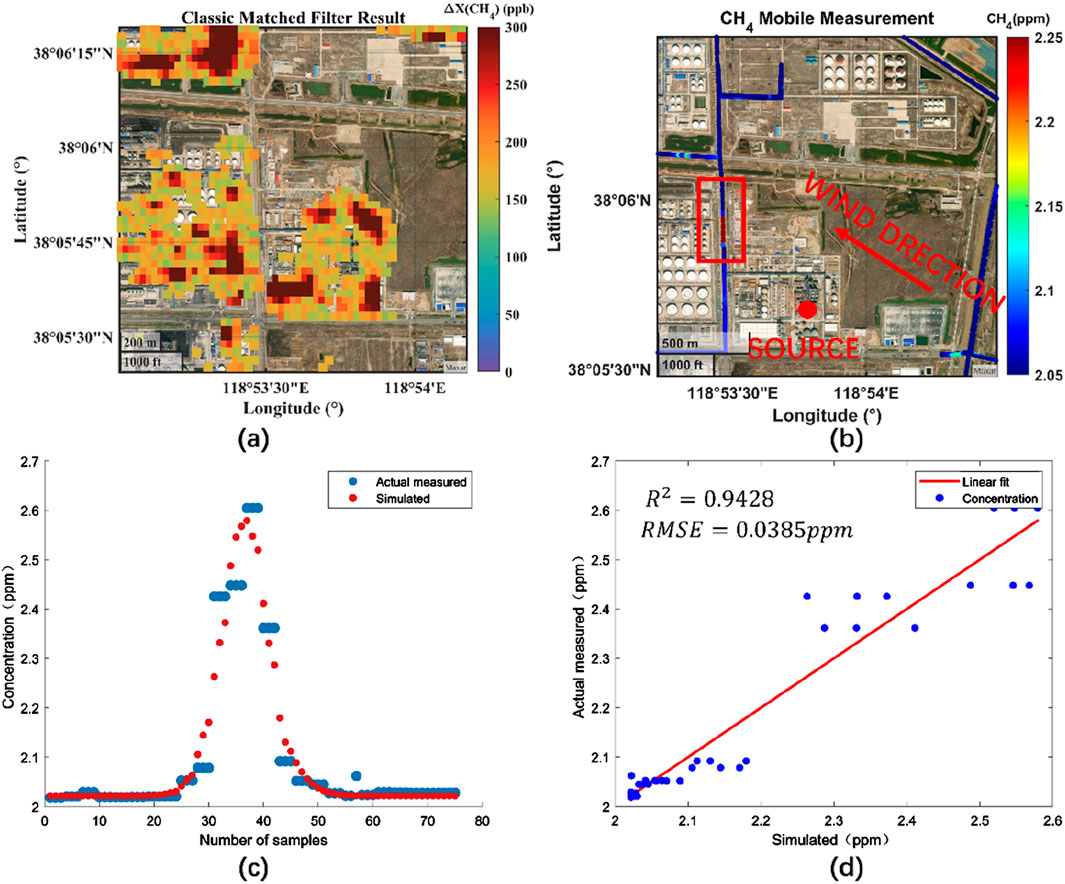
Figure 9. The result of case 2, (a) CMF results of the source, (b) locations of the source, (c) simulated
The third case received mixed emission data from the petroleum refinery and oil storage tanks in the western part of the industrial park. As shown in Figure 10, during the actual mobile measurement, the wind direction was southeast with a wind speed of 2.8 m/s. Due to the distance between the road and the emission source, the plume had narrowed by the time it descended to the road surface, and the GECS captured only 54 data points. Despite the limited number of data points, the EMISSION-PARTITION method successfully reconstructed the point source model, yielding an
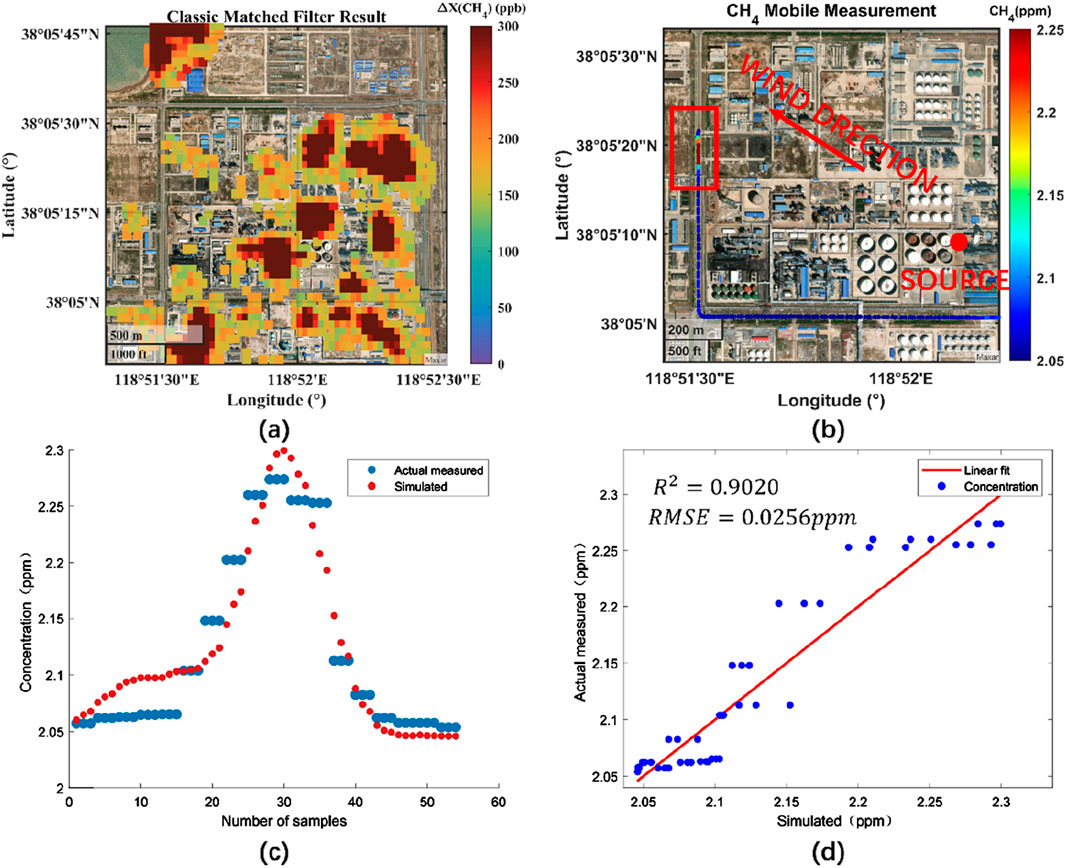
Figure 10. The result of case 3, (a) CMF results of the source, (b) locations of the source, (c) simulated
Table 3 presents the retrieved emission intensity, background concentration, wind speed, wind direction, horizontal and vertical diffusion coefficients, and source height for the three cases. The first three cases are sub-cases of Case 1, where three downwind plumes were used to reconstruct the same emission source. The retrieved wind speeds and directions for the three sub-cases are nearly identical. Similarly, for the more abstract parameters of horizontal and vertical diffusion coefficients, the retrieval results show a high degree of consistency. The retrieved source height and background concentration are consistent with the actual conditions. Among all the cases, the highest emission intensity is from Case 3, reaching 139.36 kg/h, while the lowest is from Case 2, at 107.42 kg/h.
4 Discussion
4.1 Uncertainty calculation of CMF
In the CMF algorithm, the standard deviation (std) of non-plume background pixels is typically used to describe the uncertainty of the retrieval increment (Guanter et al., 2021). However, in this study, unlike
In the study area of this paper, various surface types such as clouds, shadows, and water bodies may lead to incorrect calculations of methane concentration enhancements. Before performing the matched filter calculation, we extracted masks for these three surface types to ensure that they were excluded from the computation. Therefore, when analyzing the sources of uncertainty in identifying the emission source locations, both the spectral uncertainty of the raw data and the uncertainties in the extraction methods for these three masks need to be considered. The calculation formula is shown in Equation 14.
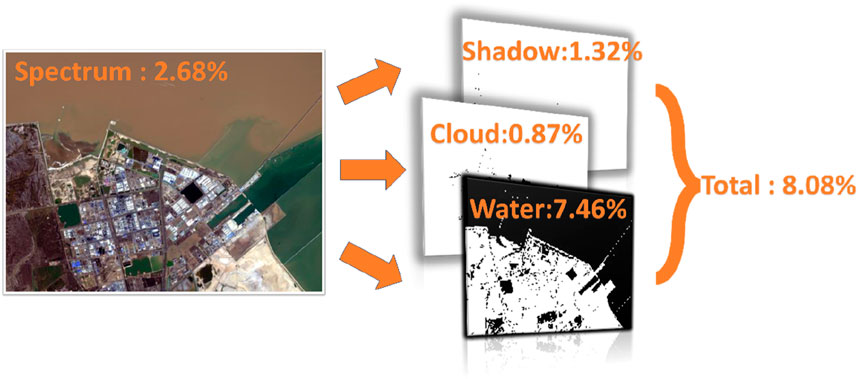
Figure 11. The sources of uncertainty in identifying the location of emission sources.
4.2 Uncertainty analysis of EMISSION-PARTITION model
In the Gaussian diffusion model, factors such as wind speed and wind direction play a crucial role, and the accuracy of emission sample collection also affects the retrieval value of point source emission intensity. The uncertainty in emission intensity calculated by the EMISSION-PARTITION model is derived from the uncertainties of sample accuracy, wind speed, and wind direction, with the calculation formula shown in Equation 15.
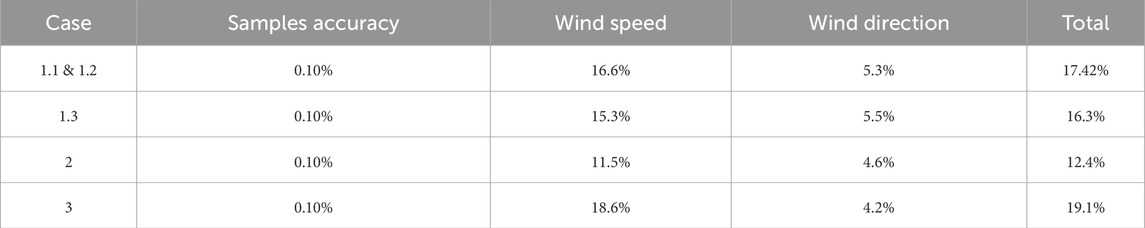
Table 4. Details of uncertainty analysis.
By examining Tables 3, 4 together and comparing wind speed with wind speed uncertainty, it is evident that higher wind speeds result in lower uncertainty, with the most pronounced difference observed between Cases 2 and 3. This is because when the wind speed is low, air movement becomes more chaotic, and atmospheric transport exhibits higher randomness. As the wind speed increases, the correlation coefficient
4.3 Future prospects
Currently, hyperspectral satellites such as the GF-5 series, PRISMA, and EMIT generally have a detection limit for methane emissions of around 400–500 kg/h. For low flux emission sources, the multi-scene averaging approach presented in this study can be used for detection. However, quantification is nearly impossible. With the advancement of satellite remote sensing technology, the addition of higher-performance satellite data will play a crucial role in enhancing the space-ground integration observation system. In recent years, the launch of new satellites such as Methanesat and Carbon mapper will contribute to the direct quantification of low flux emissions based on satellite remote sensing data.
In the ground-based measurement component, integrating site-specific data into a integration system will be crucial. For example, in the oil and gas industry, methane emissions from tanks originate from the irregular release of high-pressure gas through breathing valves. The emission intensity is a highly variable parameter, and it is difficult to estimate the annual emissions from these facilities based on only a few sampling observations. Similar issues are not uncommon; many methane emission sources exhibit significant temporal variability, such as rice paddies, landfills, and sewage treatment plants. Ground-based observations can provide temporally continuous concentration measurements, which help reveal the temporal characteristics of these emission sources—an advantage that satellite remote sensing and airborne observations do not possess (Shi et al., 2021).
5 Conclusion
In this study, we propose a space-ground integration system of methane emission monitoring and quantification, offering a solution to the problem of limited precision in satellite remote sensing for methane point source emissions and the inefficiency of data collection in ground-based mobile measurement tasks.
The system first acquires multi-temporal hyperspectral imaging data of the target area and uses the classical matched filter method to retrieve methane emission increments in the region, identifying continuous emission sources based on multi-scene averaging results. Then, a ground-based emission collection system is used to perform circumferential observations around the emission facilities, and the EMISSION-PARTITION model is employed to accurately retrieve the methane point source emission intensity. Using this system, we conducted experiments at the Dongying Port Oil Refining Park, identifying three key emission areas and efficiently quantifying methane emissions from oil production, refining, and storage processes. In the selected cases, the maximum emission intensity was 139.36 kg/h while the minimum was 107.42 kg/h. We performed an uncertainty analysis of the matched filter results, determining that water bodies are the main source of uncertainty affecting methane concentration increments, with the uncertainty controlled within 8.08%. An uncertainty analysis of the EMISSION-PARTITION model concluded that wind speed is the primary factor affecting emission intensity, with the retrieval uncertainty at 19.1%. Experiments demonstrate that the system can effectively combine the advantages of satellite remote sensing and ground-based mobile measurements to efficiently collect and quantify methane point source emission data. In the future, we will use this system to complete more methane point source emission intensity quantification tasks, providing robust data support for the development and revision of emission inventories and policy-making by environmental agencies.
Data availability statement
The original contributions presented in the study are included in the article/supplementary material, further inquiries can be directed to the corresponding authors.
Author contributions
HH: Conceptualization, Funding acquisition, Writing – original draft, Writing – review and editing. DS: Methodology, Visualization, Writing – original draft, Writing – review and editing. JZ: Formal Analysis, Writing – original draft, Writing – review and editing. XY: Supervision, Writing – original draft, Writing – review and editing. HL: Data curation, Investigation, Project administration, Writing – original draft, Writing – review and editing. FL: Formal Analysis, Writing – original draft, Writing – review and editing. WW: Conceptualization, Investigation, Writing – original draft, Writing – review and editing.
Funding
The author(s) declare that financial support was received for the research and/or publication of this article. This research was funded by Basic Science-Center Project of National Natural Science Foundation of China (Grant no. 72088101), National Natural Science Foundation of China (Grant no. 42371392) and Beijing Natural Science Foundation, funding number L211045.
Conflict of interest
Authors HH, DS, JZ, XY, HL, and FL were employed by Technical Test Centre of Sinopec Shengli Oil Field.
The remaining author declares that the research was conducted in the absence of any commercial or financial relationships that could be construed as a potential conflict of interest.
Generative AI statement
The author(s) declare that no Generative AI was used in the creation of this manuscript.
Publisher’s note
All claims expressed in this article are solely those of the authors and do not necessarily represent those of their affiliated organizations, or those of the publisher, the editors and the reviewers. Any product that may be evaluated in this article, or claim that may be made by its manufacturer, is not guaranteed or endorsed by the publisher.
References
Allan, R. P., Arias, P. A., Berger, S., Canadell, J. G., Cassou, C., Chen, D., et al. (2023). “Intergovernmental panel on climate change (ipcc). Summary for policymakers,” in Climate change 2021: the physical science basis. Contribution of working group i to the sixth assessment report of the intergovernmental panel on climate change (Cambridge University Press), 3–32.
Besheer, M., and Abdelhafiz, A. (2015). Modified invariant colour model for shadow detection. Int. J. Remote Sens. 36, 6214–6223. doi:10.1080/01431161.2015.1112930
Bovensmann, H., Buchwitz, M., Burrows, J. P., Reuter, M., Krings, T., Gerilowski, K., et al. (2010). A remote sensing technique for global monitoring of power plant co2 emissions from space and related applications. Atmos. Meas. Tech. 3, 781–811. doi:10.5194/amt-3-781-2010
Buchwitz, M., Reuter, M., Schneising, O., Hewson, W., Detmers, R. G., Boesch, H., et al. (2017b). Global satellite observations of column-averaged carbon dioxide and methane: the ghg-cci xco2 and xch4 crdp3 data set. Remote Sens. Environ. 203, 276–295. doi:10.1016/j.rse.2016.12.027
Buchwitz, M., Schneising, O., Reuter, M., Heymann, J., Krautwurst, S., Bovensmann, H., et al. (2017a). Satellite-derived methane hotspot emission estimates using a fast data-driven method. Atmos. Chem. Phys. 17, 5751–5774. doi:10.5194/acp-17-5751-2017
Chen, Y. L., Sherwin, E. D., Berman, E. S. F., Jones, B. B., Gordon, M. P., Wetherley, E. B., et al. (2022). Quantifying regional methane emissions in the New Mexico permian basin with a comprehensive aerial survey. Environ. Sci. Technol. 56, 4317–4323. doi:10.1021/acs.est.1c06458
Collins, W., Orbach, R., Bailey, M., Biraud, S., Coddington, I., DiCarlo, D., et al. (2022). Monitoring methane emissions from oil and gas operations. Opt. Express 30, 24326–24327. doi:10.1364/oe.464421
Crippa, M., Guizzardi, D., Solazzo, E., Muntean, M., Schaff, E., Monforti-Farrario, F., et al. (2021). JRC Science for policy report: 2021 Report. GHG emissions of all world countries. Available online at: https://edgar.jrc.ec.europa.eu/report_2021.
Crosson, E. R. (2008). A cavity ring-down analyzer for measuring atmospheric levels of methane, carbon dioxide, and water vapor. Appl. Phys. B 92, 403–408. doi:10.1007/s00340-008-3135-y
Cusworth, D. H., Thorpe, A. K., Ayasse, A. K., Stepp, D., Heckler, J., Asner, G. P., et al. (2022). Strong methane point sources contribute a disproportionate fraction of total emissions across multiple basins in the United States, Proc. Natl. Acad. Sci. U. S. A. 119, e2202338119, doi:10.1073/pnas.2202338119
Erland, B. M., Thorpe, A. K., and Gamon, J. A. (2022). Recent advances toward transparent methane emissions monitoring: a review. Environ. Sci. Technol. 56, 16567–16581. doi:10.1021/acs.est.2c02136
Guanter, L., Irakulis-Loitxate, I., Gorroño, J., Sánchez-García, E., Cusworth, D. H., Varon, D. J., et al. (2021). Mapping methane point emissions with the prisma spaceborne imaging spectrometer. Remote Sens. Environ. 265, 112671. doi:10.1016/j.rse.2021.112671
Han, G., Huang, Y., Shi, T., Zhang, H., Li, S., Zhang, H., et al. (2024b). Quantifying co2 emissions of power plants with aerosols and carbon dioxide lidar onboard dq-1. Remote Sens. Environ. 313, 114368. doi:10.1016/j.rse.2024.114368
Han, G., Pei, Z., Shi, T., Mao, H., Li, S., Mao, F., et al. (2024a). Unveiling unprecedented methane hotspots in China's leading coal production hub: a satellite mapping revelation. Geophys. Res. Lett. 51, e2024GL109065. doi:10.1029/2024gl109065
He, J., Wang, W., Fu, M., and Wang, Y. (2024b). Insights into global visibility patterns: spatiotemporal distributions revealed by satellite remote sensing. J. Clean. Prod. 468, 143069. doi:10.1016/j.jclepro.2024.143069
He, T.-L., Boyd, R. J., Varon, D. J., and Turner, A. J. (2024a). Increased methane emissions from oil and gas following the soviet union’s collapse. Proc. Natl. Acad. Sci. U.S.A. 121, e2314600121. doi:10.1073/pnas.2314600121
Hu, H., Landgraf, J., Detmers, R., Borsdorff, T., de Brugh, J. A., Aben, I., et al. (2018). Toward global mapping of methane with tropomi: first results and intersatellite comparison to gosat. Geophys. Res. Lett. 45, 3682–3689. doi:10.1002/2018gl077259
Huang, Y., Han, G., Shi, T., Li, S., Mao, H., Nie, Y., et al. (2024). Fi-scape: a divergence theorem based emission quantification model for air/space-borne imaging spectrometer derived xch4 observations. IEEE J. Sel. Top. Appl. Earth Observations Remote Sens., 1–21. doi:10.1109/JSTARS.2024.3490896
Irakulis-Loitxate, I., Guanter, L., Liu, Y.-N., Varon, D. J., Maasakkers, J. D., Zhang, Y., et al. (2021). Satellite-based survey of extreme methane emissions in the permian basin. Sci. Adv. 7, eabf4507. doi:10.1126/sciadv.abf4507
Jacob, D. J., Varon, D. J., Cusworth, D. H., Dennison, P. E., Frankenberg, C., Gautam, R., et al. (2022). Quantifying methane emissions from the global scale down to point sources using satellite observations of atmospheric methane. Atmos. Chem. Phys. 22, 9617–9646. doi:10.5194/acp-22-9617-2022
Kirschke, S., Bousquet, P., Ciais, P., Saunois, M., Canadell, J. G., Dlugokencky, E. J., et al. (2013). Three decades of global methane sources and sinks. Nat. Geosci. 6, 813–823. doi:10.1038/ngeo1955
Levy, P. E., Grelle, A., Lindroth, A., Mölder, M., Jarvis, P. G., Kruijt, B., et al. (1999). Regional-scale co2 fluxes over central Sweden by a boundary layer budget method. Agric. For. Meteorol. 98, 169–180. doi:10.1016/s0168-1923(99)00096-9
Li, H., Liu, B., Gong, W., Ma, Y., Jin, S., Wang, W., et al. (2025). Influence of clouds on planetary boundary layer height: a comparative study and factors analysis. Atmos. Res. 314, 107784. doi:10.1016/j.atmosres.2024.107784
Liu, B., Ma, X., Guo, J., Wen, R., Li, H., Jin, S., et al. (2024). Extending the wind profile beyond the surface layer by combining physical and machine learning approaches. Atmos. Chem. Phys. 24, 4047–4063. doi:10.5194/acp-24-4047-2024
Liu, Y., Sun, D., Hu, X., Liu, S., Cao, K., Chai, M., et al. (2020). Development of visible and short-wave infrared hyperspectral imager onboard GF-5 satellite. Geo-spatial Inf. Sci. 24, 333–344. doi:10.11834/jrs.20209196
Lowry, D., Fisher, R., France, J. L., Coleman, M., Lanoisellé, M., Zazzeri, G., et al. (2020). Environmental baseline monitoring for shale gas development in the UK: identification and geochemical characterisation of local source emissions of methane to atmosphere. Sci. Total Environ. 708, 134600. doi:10.1016/j.scitotenv.2019.134600
Meyer, A. G., Lindenmaier, R., Heerah, S., Benedict, K. B., Kort, E. A., Peischl, J., et al. (2022). Using multiscale ethane/methane observations to attribute coal mine vent emissions in the san juan basin from 2013 to 2021. J. Geophys. Res. Atmos. 127, e2022JD037092. doi:10.1029/2022jd037092
Naus, S., Maasakkers, J. D., Gautam, R., Omara, M., Stikker, R., Veenstra, A. K., et al. (2023). Assessing the relative importance of satellite-detected methane superemitters in quantifying total emissions for oil and gas production areas in Algeria. Environ. Sci. Technol. 57, 19545–19556. doi:10.1021/acs.est.3c04746
Omara, M., Gautam, R., O'Brien, M., Himmelberger, A., Franco, A., Meisenhelder, K., et al. (2023). Developing a spatially explicit global oil and gas infrastructure database for characterizing methane emission sources at high resolution. Earth Syst. Sci. Data Discuss., 1–35. doi:10.5194/essd-15-3761-2023
Parker, R. J., Webb, A., Boesch, H., Somkuti, P., Barrio Guillo, R., Di Noia, A., et al. (2020). A decade of gosat proxy satellite ch4 observations. Earth Syst. Sci. Data Discuss. 2020, 3383–3412. doi:10.5194/essd-12-3383-2020
Pei, Z., Han, G., Mao, H., Chen, C., Shi, T., Yang, K., et al. (2023). Improving quantification of methane point source emissions from imaging spectroscopy. Remote Sens. Environ. 295, 113652. doi:10.1016/j.rse.2023.113652
Pei, Z. P., Han, G., Ma, X., Shi, T. Q., and Gong, W. (2022). A method for estimating the background column concentration of co2 using the Lagrangian approach. Ieee Trans. Geoscience Remote Sens. 60, 1–12. doi:10.1109/tgrs.2022.3176134
Qiao, C., Luo, J., Sheng, Y., Shen, Z., Zhu, Z., and Ming, D. (2012). An adaptive water extraction method from remote sensing image based on ndwi. J. Indian Soc. Remote Sens. 40, 421–433. doi:10.1007/s12524-011-0162-7
Qiu, R., Han, G., Li, X., Xiao, J., Liu, J., Wang, S., et al. (2024). Contrasting responses of relationship between solar-induced fluorescence and gross primary production to drought across aridity gradients. Remote Sens. Environ. 302, 113984. doi:10.1016/j.rse.2023.113984
Sherwin, E. D., Rutherford, J. S., Zhang, Z., Chen, Y., Wetherley, E. B., Yakovlev, P. V., et al. (2024). Us oil and gas system emissions from nearly one million aerial site measurements. Nature 627, 328–334. doi:10.1038/s41586-024-07117-5
Shi, T., Han, G., Ma, X., Mao, H., Chen, C., Han, Z., et al. (2023b). Quantifying factory-scale co2/ch4 emission based on mobile measurements and emission-partition model: cases in China. Environ. Res. Lett. 18, 034028. doi:10.1088/1748-9326/acbce7
Shi, T., Han, G., Ma, X., Pei, Z., Chen, W., Liu, J., et al. (2023a). Quantifying strong point sources emissions of co2 using spaceborne lidar: method development and potential analysis. Energy Convers. Manag. 292, 117346. doi:10.1016/j.enconman.2023.117346
Shi, T., Han, Z., Han, G., Ma, X., Chen, H., Andersen, T., et al. (2022). Retrieving ch 4-emission rates from coal mine ventilation shafts using uav-based aircore observations and the genetic algorithm–interior point penalty function (ga-ippf) model. Atmos. Chem. Phys. 22, 13881–13896. doi:10.5194/acp-22-13881-2022
Shi, T. Q., Han, G., Ma, X., Gong, W., Chen, W. B. A., Liu, J. Q., et al. (2021). Quantifying co2 uptakes over oceans using lidar: a tentative experiment in bohai bay. Geophys. Res. Lett. 48. doi:10.1029/2020gl091160
Shi, T. Q., Han, G., Ma, X., Zhang, M., Pei, Z. P., Xu, H., et al. (2020). An inversion method for estimating strong point carbon dioxide emissions using a differential absorption lidar. J. Clean. Prod. 271, 122434. doi:10.1016/j.jclepro.2020.122434
Stocker, A. D. (1990). Multi-dimensional signal processing for electro-optical target detection, signal and data processing of small targets. Proc. SPIE 1305. Abstract retrieved from Signal and Data Processing of Small Targets 1990, (1 October 1990). doi:10.1117/12.2321763
Tang, H. Z., Xiao, C. C., Shang, K., Wu, T. X., and Li, Q. (2023). Radiometric calibration of gf5-02 advanced hyperspectral imager based on radcalnet baotou site. Remote Sens. 15, 2233. doi:10.3390/rs15092233
Wang, J. C., Wang, Y., and Sun, L. (2021). Cloud detection in gaofen-5 visible and shortwave infrared hyperspectral imagery. Acta Opt. Sin. 41, 8. doi:10.3788/AOS202141.0928003
Wang, W., Li, B., and Chen, B. (2025a). Improved surface NO2 Retrieval: Double-layer machine learning model construction and spatio-temporal characterization analysis in China (2018–2023). J. Environ. Manage. 384, 125439. doi:10.1016/j.jenvman.2025.125439
Wang, W., Wang, N., and Chen, B. (2025b). Retrieving hourly aerosol optical depth for geostationary satellite FY-4B/AGRI by surface-related dynamic spectral reflectance ratio method. Adv. Space Res. 75 (3), 2484–2505. doi:10.1016/j.asr.2024.10.057
Wang, Y., Yuan, Q., Li, T., Yang, Y., Zhou, S., and Zhang, L. (2023). Seamless mapping of long-term (2010–2020) daily global xco 2 and xch 4 from the greenhouse gases observing satellite (gosat), orbiting carbon observatory 2 (oco-2), and cams global greenhouse gas reanalysis (cams-egg4) with a spatiotemporally self-supervised fusion method. Earth Syst. Sci. Data 15, 3597–3622. doi:10.5194/essd-15-3597-2023
Williams, J. P., Omara, M., Himmelberger, A., Zavala-Araiza, D., MacKay, K., Benmergui, J., et al. (2024). Small emission sources disproportionately account for a large majority of total methane emissions from the us oil and gas sector. EGUsphere 2024, 1–31. doi:10.5194/egusphere-2024-1402
Xu, M., Han, G., Pei, Z., Yu, H., Li, S., and Gong, W. (2024). Advanced method for compiling a high-resolution gridded anthropogenic co2 emission inventory at a regional scale. Geo-spatial Inf. Sci., 1–14. doi:10.1080/10095020.2024.2425182
Yang, J., Gan, R., Luo, B., Wang, A., Shi, S., and Du, L. (2024). An improved method for individual tree segmentation in complex urban scenes based on using multispectral LiDAR by deep learning. IEEE J. Sel. Top. Appl. Earth Observations Remote Sens. 17, 6561–6576. doi:10.1109/jstars.2024.3373395
Yi, J., Huang, Y., Pei, Z., and Han, G. (2024). Urban area observing system (uaos) simulation experiment using dq-1 total column concentration observations. EGUsphere 2024, 1–40. doi:10.5194/egusphere-2024-2495
Yu, J. V., Hmiel, B., Lyon, D. R., Warren, J., Cusworth, D. H., Duren, R. M., et al. (2022). Methane emissions from natural gas gathering pipelines in the permian basin. Environ. Sci. Technol. Lett. 9, 969–974. doi:10.1021/acs.estlett.2c00380
Zhang, H., Han, G., Ma, X., Chen, W., Zhang, X., Liu, J., et al. (2023). Robust algorithm for precise x co2 retrieval using single observation of ipda lidar. Opt. Express 31, 11846–11863. doi:10.1364/oe.482629
Zhang, H. W., Ma, X., Han, G., Xu, H., Shi, T. Q., Zhong, W. Q., et al. (2021). Study on collaborative emission reduction in green-house and pollutant gas due to covid-19 lockdown in China. Remote Sens. 13, 3492. doi:10.3390/rs13173492
Zhang, J., Han, G., Mao, H., Pei, Z., Ma, X., Jia, W., et al. (2022). The spatial and temporal distribution patterns of xch4 in China: new observations from tropomi. Atmosphere 13, 177. doi:10.3390/atmos13020177
Keywords: space-ground integration, matched filter, in-situ measurement, CH4 emission, satellite
Citation: He H, Sun D, Zhao J, Yuan X, Li H, Liu F and Wang W (2025) Space-ground integration system of methane emission monitoring and quantification: cases in Dongying, China. Front. Earth Sci. 13:1577961. doi: 10.3389/feart.2025.1577961
Received: 17 February 2025; Accepted: 21 May 2025;
Published: 09 June 2025.
Edited by:
Nizar Bel Hadj Ali, École Nationale d'Ingénieurs de Gabès, TunisiaReviewed by:
Shenguang Fu, The Pennsylvania State University (PSU), United StatesTianqi Shi, UMR8212 Laboratoire des Sciences du Climat et de l'Environnement (LSCE), France
Copyright © 2025 He, Sun, Zhao, Yuan, Li, Liu and Wang. This is an open-access article distributed under the terms of the Creative Commons Attribution License (CC BY). The use, distribution or reproduction in other forums is permitted, provided the original author(s) and the copyright owner(s) are credited and that the original publication in this journal is cited, in accordance with accepted academic practice. No use, distribution or reproduction is permitted which does not comply with these terms.
*Correspondence: Dong Sun, c3VuZG9uZy5zbHl0QFNJTk9QRUMuY29t; Wei Wang, d2FuZ3dlaWNuQGNzdS5lZHUuY24=