 Katarzyna Łukawska-Matuszewska1*
 Maciej Dwornik2
- 1Faculty of Oceanography and Geography, University of Gdańsk, Gdynia, Poland
- 2Department of Geoinformatics and Applied Computer Science, Faculty of Geology, Geophysics and Environmental Protection, AGH University of Krakow, Krakow, Poland
Being a measure of acid-neutralizing capacity, alkalinity determines carbon dioxide (CO2) uptake from the atmosphere and the pH of seawater. However, the alkalinity budget in the Baltic Sea is still poorly understood. According to recent modeling studies, anaerobic processes in sediments are an important internal source of alkalinity in the Baltic Sea. Nevertheless, determining the role of sediments in alkalinity enhancement is difficult due to the high variability of environmental conditions and, consequently, biogeochemical processes. Here, we describe the geochemistry of different types of anoxic sediments from the Gulf of Gdańsk: methanic, methanic with freshwater seepage, and methane-free, emphasizing dissolved inorganic carbon, methane, and sulfate. We estimate the benthic flux of carbonate alkalinity (JCA) and the sulfate reduction rate (SRR) due to the dissimilatory sulfate reduction (DSR) and anaerobic methane oxidation with sulfate (SO42−-AOM), the main alkalinity-producing processes. We show that the role of anaerobic sediments as a source of alkalinity can vary significantly, depending on the benthic conditions. The concentration and the release of carbonate alkalinity (CA) from sediments depend on the SRR, type of the process producing CA (DSR and SO42−-AOM), and the depth of sulfate–methane transition (SMT) in the sediment. The estimated SRR is ranging from 0.1 to 26 nmol cm−3 d−1. The range of JCA obtained in the present study varies from 1037 to 2084 μmol m−2 d−1. Assuming the complete oxidation of sulfide released from the sediment to the bottom water, the net flux of CA (J*CA) in the study area is 943–2064 μmol m−2 d−1, with the highest values for sediment dominated with SO42−-AOM with fresh groundwater seepage, shallow SMT, and high SRR in the subsurface sediment layer. Our results may be useful for further studies to determine the role of sediments as an internal source of alkalinity to help close the alkalinity budget in the Baltic Sea.
1 Introduction
Alkalinity provides a measure of acid-neutralizing capacity of seawater. This in turn determines carbon dioxide (CO2) uptake from the atmosphere and pH of seawater (Caldeira and Berner, 1999). As atmospheric pCO2 increases, CO2 uptake by surface ocean waters increases, mitigating the increase in atmospheric CO2 concentration and the greenhouse effect (Le Quéré et al., 2015; Friedlingstein et al., 2020). At the same time, this leads to changes in seawater chemistry that involve a decrease in pH and carbonate (CO32−) concentration, a process known as ocean acidification (Orr et al., 2005; Doney et al., 2009). Therefore, the knowledge of the spatial and temporal variability of alkalinity is crucial for understanding the global carbon (C) cycle and predicting environmental changes under the impact of increasing atmospheric pCO2 due to the anthropogenic emission.
Total alkalinity (TA) of seawater is defined as the excess of bases (proton acceptors) over acids (proton donors) in solution (Dickson, 1981) and can be expressed as follows:
TA is dominated by bicarbonate and carbonate, which represent carbonate alkalinity (CA):
In the surface water of the open ocean, TA changes in parallel with salinity, reflecting evaporation and precipitation patterns (Millero et al., 1998; Jiang et al., 2014), whereas in coastal areas and estuaries, TA is largely influenced by riverine input, calcification, anaerobic processes (i.e., denitrification and the reduction of manganese, iron, and sulfate), pyrite burial, and silicate weathering in anoxic marine sediments (Wolf-Gladrow et al., 2007; Wallmann et al., 2008; Hu and Cai, 2011; Gustafsson et al., 2014; Łukawska-Matuszewska and Graca, 2018; Gustafsson et al., 2019). Additionally, due to much shallower depth of the water column than that in the open ocean and easier exchange of substances between the benthic and pelagic zones, the diagenetic processes in the sediments may have a significant impact on the acid–base system in the shelf seas (Liu et al., 2012; Griffiths et al., 2017; Szymczycha et al., 2023).
Many different processes in marine sediments during early diagenesis contribute to the production or consumption of TA in pore waters. Although most anaerobic processes increase TA, aerobic processes generally have the opposite effect (Berner et al., 1970; Krumins et al., 2013; Chatterjee et al., 2011). In anoxic marine sediments, the most significant process for TA generation is probably dissimilatory sulfate (SO42−) reduction (DSR) (Equation 3; CH2O – simplified organic matter) during organic matter (OM) mineralization (Krumins et al., 2013; Rassmann et al., 2016):
Even though the production of alkalinity during DSR per 1 mol of OM is lower than that in the case of the reduction of Fe and Mn (Rassmann et al., 2016), as shown in Equations 4, 5,
it should be remembered that this process dominates the anaerobic mineralization of OM in coastal and continental margin sediments (Jørgensen and Kasten, 2006), accounting for up to 70% of all OM mineralization (Thamdrup and Canfield, 1996). When the concentration of OM in the sediment is higher than the availability of oxidants for its mineralization, methanogenesis takes place (Froelich et al., 1979). Methanogenesis itself does not change TA, but following the anaerobic oxidation of methane (AOM), significant amounts of HCO3− are produced (Ritger et al., 1987). It has been demonstrated that under anaerobic conditions, methane (CH4) is microbially oxidized with nitrate (In’t et al., 2018), Mn, and Fe (Beal et al., 2009; Sturm et al., 2019):
However, due to the high concentration of SO42− in seawater, it is probably the most important oxidant in AOM (Boetius et al., 2000; Egger et al., 2018):
The anaerobic oxidation of CH4 with SO42− (SO42−-AOM), mediated by anaerobic methanotrophic archaea (ANME) in syntrophic consortia with sulfur-reducing bacteria (SRB) (Boetius et al., 2000), takes place within the sulfate–methane transition (SMT) zone. In this sediment horizon, the downward flux of SO42– encounters an upward flux of CH4, and their concentrations are low (Beulig et al., 2019). The process strongly affects the alkalinity of pore waters, as it produces large amounts of HCO3−, as well as HS−, also a component of TA (Equation 1).
The Baltic Sea is an example of a shallow shelf sea, with a large riverine inflow and limited water exchange with the ocean; therefore, the internal source associated with the production and release of TA from anaerobic sediments is likely an important part of its budget. This is indicated by the modeling studies of Gustafsson (2013) and Gustafsson et al. (2014), which demonstrated that the load from the external sources (rivers and the North Sea) does not explain the high alkalinity in the Baltic water. Most of the internal sources of TA are believed to be related to denitrification, Fe reduction, and pyrite burial, till erosion on the seabed and other unresolved sedimentary processes (Gustafsson et al., 2014; Gustafsson et al., 2019; Wallmann et al., 2022). However, the role of sediments as an internal source of alkalinity remains poorly understood, and until now, the TA budget in the Baltic Sea is not closed.
The estimation of the role of sediments as a source of alkalinity to the water column is a challenging task due to the high variability of environmental (benthic) conditions within the Baltic Sea. Here, we describe the geochemistry of anaerobic sediments from the Gulf of Gdańsk (southern Baltic Sea), with particular emphasis on dissolved inorganic carbon (DIC), CH4, and SO42−. We estimate the benthic flux of CA and the sulfate reduction rate (SRR) in sediments. To elucidate the impact of benthic conditions, in our study, we include different types of anoxic sediments: methanic, methanic with freshwater seepage, and methane-free.
2 Materials and methods
2.1 Sediment and pore water sampling
Samples were collected in July 2023 during cruise onboard RV Oceanograf (vessel of the University of Gdańsk) at three research stations located in the Gdańsk Basin (Figure 1). The water depth of the stations ranged from 52 to 103 m (Table 1). At stations MET1-MP and MET2, methane was present in the examined sediment layer. Station MET1-MP is an active deepwater pockmark (Brodecka-Goluch et al., 2022), and MET2 is an area of shallow gas regular accumulation (Jaśniewicz et al., 2019; Brodecka-Goluch et al., 2022). Station ZGG represents the seabed without gas accumulation in the sediment and without a specific structure on the seafloor (Table 1).
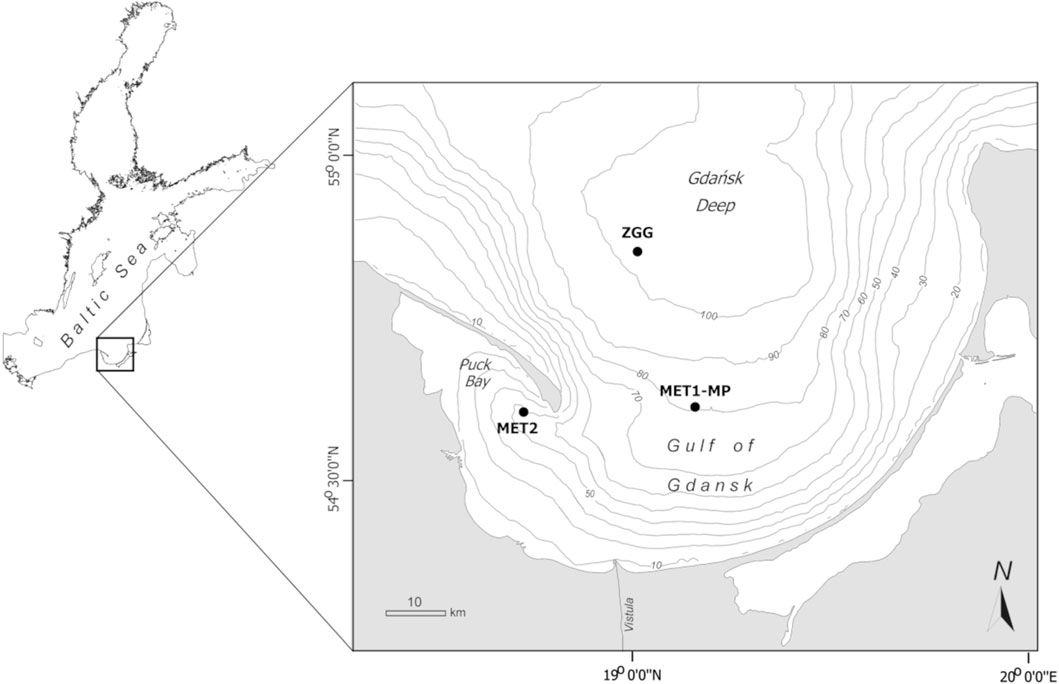
Figure 1. Map of the study area with the location of the sampling stations.
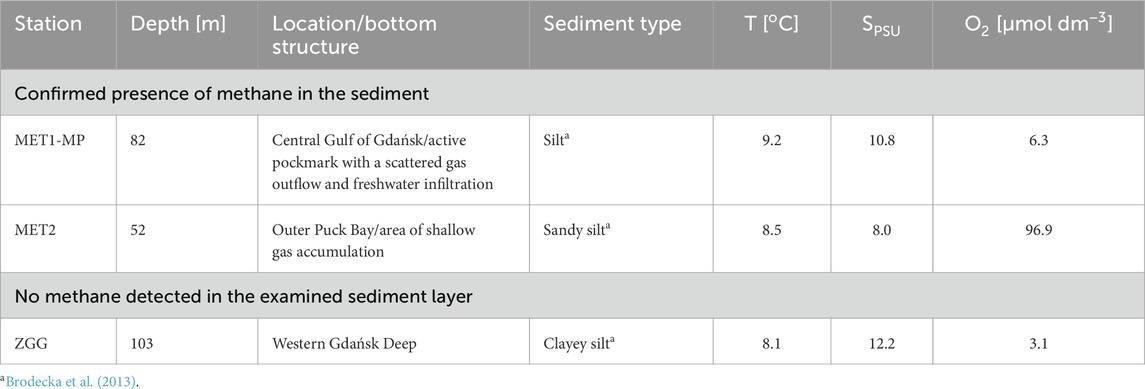
Table 1. Overview of sampling stations with information about the type of station, depth, and sediment type, as well as temperature (T), salinity (SPSU), and concentration of oxygen (O2) in near-bottom water during sampling.
Sediment cores were collected using a Rumohr Lot gravity corer, with 7.5 cm diameter and 150 cm long liners. Sampling was always preceded by hydroacoustic measurements using EK80 split-beam echosounders (Simrad) to reproduce the exact sampling position. Three sediment cores were taken from each station, with lengths ranging from 90 to 110 cm. One core was used for pore water analysis, another for CH4 analysis, and the third core for water content (WC), organic matter (estimated as loss on ignition, LOI), and organic carbon (CORG) analyses. Pore waters were retrieved without contact with air, from intact and tightly sealed sediment cores, using Rhizon® samplers. The samplers were inserted through holes drilled in the liners at 5 cm intervals. The first sampler was placed a few centimeters above the sediment (0.5–2.0 cm, depending on the station) to sample water collected with the sediment cores. Temperature (T), practical salinity (SPSU), and dissolved oxygen concentration (O2) in water ca. 5 cm above the sediment were measured using a portable multiparameter meter (WTW MultiLine® 3630 IDS) with a conductivity sensor (TetraCon® 925) and an oxygen probe (FDO® 925). pH was determined spectrophotometrically using m-cresol purple as an indicator dye (Hammer et al., 2014). The precision (RSD) of pH measurements in the analyzed samples was ≤0.009%. Near-bottom water for further analysis was collected using a syringe with a hose.
2.2 Geochemical parameters
The following parameters were analyzed in water samples: TA, pH, concentration of DIC, SO42-, chloride (Cl−), hydrogen sulfide (H2S), iron (Fe2+), and manganese (Mn2+). Measurements of TA, pH, and H2S were performed immediately after sampling in the onboard laboratory. Samples for SO42-, Fe2+, and Mn2+ were acidified with HNO3, and DIC samples were poisoned with HgCl2 and stored in sealed, almost completely filled tubes (<1% free space) at 4oC until analysis at the laboratory on land.
Total alkalinity was determined by potentiometric titration with 0.01 M HCl using an automatic titrator (SM-Titrino 702, Metrohm). TA was determined from titration data using the Gran approach (10–12 points between pH 4.5 and 3.5 were taken for the plot). pH changes during titration were measured using a pH/ATC combination electrode. The accuracy of the pH determination was 0.002 units. The concentration of HCl used in TA titration was checked against a fresh standard sodium carbonate solution prepared from certified high-purity Na2CO3 (Sigma-Aldrich) according to Dickson et al. (2007). Na2CO3 was dried at 280°C for >2 h and cooled in a desiccator. The Na2CO3 standard solution was prepared in 0.2 mol dm−3 sodium chloride to adjust the total ionic strength to a value similar to Baltic water. The accuracy of TA determination obtained by titration in 2 mmol kg−1 Na2CO3 was ≤3 μmol kg−1. The precision of TA determination in 2 mmol kg−1 Na2CO3 expressed as RSD was ≤0.2%. The RSD of TA measurements in the analyzed samples was ≤0.3%.
Concentrations of DIC were measured in duplicates using a TOC analyzer VarioTOC Cube (Elementar GmbH) equipped with a nondispersive infrared (NDIR) detector. Samples were acidified with 1% H3PO4 inside the apparatus, and DIC was purged in the sparger and measured using the detector. The accuracy (percent recovery from reference material) of DIC determinations was 98%. The precision (RSD) of DIC determinations was ≤1%.
Concentrations of SO42− and Cl− were determined using high-performance ion chromatography (Metrohm 850 Professional IC). Concentration of H2S was measured spectrophotometrically using a Hach-Lange DR6000 spectrophotometer with the methylene blue method (Cline, 1969). Concentrations of Fe2+ and Mn2+ were measured using an inductively excited plasma optical emission (ICP-OES) spectrometer (PerkinElmer Optima 8300). The precisions (RSD) of analysis of SO42−, H2S, Fe2+, and Mn2+ were 3%, 3%, 2%, and 2%, respectively, and the limits of quantification (LOQs) were 0.03 mmol dm−3, 1.5 μmol dm−3, 1.0 μmol dm−3, and 1.0 μmol dm−3, respectively.
Samples of sediment for analysis of CH4 were collected within 30 min after sediment core retrieval, through the holes previously made on the sides of core liners, using 3-mL syringes with the Luer-lock removed and transferred into 20-mL vials, according to the procedure described by Jørgensen et al. (2001). The CH4 concentration was analyzed using the standard headspace technique on a gas chromatograph (Perkin Elmer) equipped with a flame ionization detector (FID) and an HP-5 column (30 m, 0.32 mm, and 0.25 µm), with helium as the carrier gas. The detection limit (LOD) was 0.2 μmol dm−3. The results of methane determinations were corrected for sediment porosity. Sediment porosity at each station was calculated based on its water content, according to the equation presented in Section 2.3.
Sediment cores for water, organic matter, and organic carbon content in the sediment were sectioned into 5-cm layers directly after retrieval, using a spatula and a PVC ring. Samples were placed into plastic zipper bags and immediately frozen at −21°C. WC was determined by drying samples to constant weight at 105°C. Organic matter content was determined as LOI at 450°C. The CORG content in the sediment was measured using a CHNS autoanalyzer (Perkin Elmer 2400), according to the method by Parsons et al. (1985). Prior to analysis, samples were acidified with 1 M HCl to remove inorganic carbon (Hedges and Stern, 1984).
2.3 Concentration and benthic flux of carbonate alkalinity
CA is equal to [HCO3−]+2[CO32-] (Equation 2), and the benthic flux of CA (JCA) is equal to the sum of the fluxes of bicarbonate (JHCO3−) and carbonate (JCO32−), as shown in Equation 10:
The concentrations of HCO3− and CO32- were calculated from the DIC and pH in samples using mass-conservation equations and the equilibrium relationships between various species, according to Dickson et al. (2007) (all relevant equations are given in Supplementary Table S1). The dissociation constants of carbonic acid in seawater, that is, pK1 = 5.9 and pK2 = 9.1, were corrected for salinity and temperature, according to Millero (2010).
The flux of JHCO3- and JCO32- at the sediment–water interface was estimated based on measured porewater profiles. The concentration gradients were calculated as the first derivative of the function describing profiles of ions, including the near-bottom water concentration. The measured values were fitted as closely as possible by a curve, as shown in Equation 11:
where C(z) stands for the molar concentration in pore water at depth z [cm] and Cmax stands for the maximum concentration in the profile. The functions were fitted to the data, and the function parameters (a and b) were calculated using MathWorks MATLAB 2020b and 2024b. Estimations were made using the nonlinear square method. Goodness of fit (R2) of empirically derived models was ≥0.96 for HCO3− and ≥0.84 for CO32-. Results of fitting the function to the data are presented in Figure 2. The analytically calculated first derivative from fitted functions for z = 0 was used as a concentration gradient at the sediment–water interface. This method has been commonly applied in other studies (e.g., Urban et al., 1997; Srithongouthai et al., 2003; Denis and Grenz, 2003). The application of nonlinear function allows calculating the flux in a close proximity to the diffusion boundary layer, significantly reducing errors due to coarse depth resolution in pore water concentration profiles and enabling more accurate flux estimates (Sayles et al., 1996; Zabel et al., 2000).
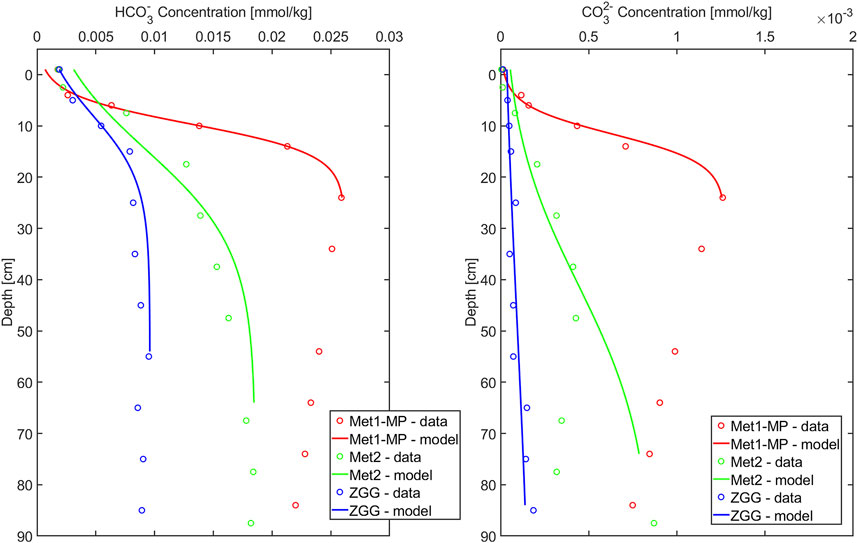
Figure 2. Concentration of bicarbonate and carbonate in pore waters of sampling stations and the best-fitting concentration profile calculated according to Equation 11.
The fluxes (J) at the sediment–water interface were calculated using MathWorks MATLAB 2020b and 2024b according to equations implemented in RADIv1 (Sulpis et al., 2022) and consisted of a diffusive and an advective component. The component associated with bioirrigation was omitted in calculations as no macrofauna was present at any of the sampling stations. The fluxes were estimated using Equation 12:
where J is the flux [mol m−2 a−1]; φ is the sediment porosity; δC/δz is the concentration gradient at the sediment–water interface; DS is the molecular diffusion coefficient in sediment [m2 a−1] expressed as DS = DSW/Ɵ2, where Ɵ is the tortuosity and DSW is the molecular diffusion coefficient in seawater [m2 a−1];
Porosity was calculated from Equation 13 (Engvall, 1978):
where WC denotes the water content of sediment [%] and d is the bulk density of sediment (2.5 g cm−3). Changes in porosity with depth were parametrized as represented in Equation 14 (Boudreau, 1996):
where
Tortuosity (Ɵ) was defined using Equation 15 (Boudreau, 1997):
The pore water burial velocity [m a−1] at depth
where
The coefficients, constants, and data used in calculating bicarbonate and carbonate benthic fluxes are summarized in Table 2.

Table 2. Parameters and variables used in the calculation of the benthic flux of carbonate alkalinity.
2.4 Sulfate reduction rate calculation
The SRR was calculated from the concentration profile of SO42- in pore water based on Berner’s diagenetic equation (1980). No macrofauna that could affect SO42- concentrations in pore water through bioturbation and bioirrigation were present at any of the stations, so this term of Berner’s (1980) equation was omitted. Assuming a steady state and transport within sediment only by molecular diffusion, the equation was simplified to Equation 17:
where SRR is the net rate of sulfate reduction [nmol cm−3 d−1]. The seawater diffusion coefficient (10.7 · 10−6 cm2 s−1) with correction for temperature (Li and Gregory, 1974) and tortuosity was used to calculate the SO42- flux between sediment layers.
3 Results
3.1 Sediment parameters
Profiles of WC, porosity, LOI, and CORG in sediments from three research stations are presented in Supplementary Figure S1. At all the stations studied, WC ranged from 57.3% to 97.6%, porosity was 0.78–0.98, LOI was 5.4%–20.2%, and the CORG content was 3.7%–8.4%. For all parameters, there was a decrease with increasing sediment depth. The lowest WC, porosity, LOI, and CORG were characteristic of sediments at station MET2, which is the shallowest and where sandy silt occurs. The highest values of WC, LOI, and CORG, as well as porosity in the surface layer, were recorded in the silt sediment in the MET1-MP pockmark.
3.2 Geochemistry of pore water
As shown in Figures 3, 4, the chemical composition of pore water differed markedly between sampling stations. DIC concentration was the highest at station MET1-MP (deepwater pockmark), where it ranged from 1.85 to 27.52 mmol kg−1. At station MET2, located within the area of shallow gas accumulation, DIC concentration ranged from 2.08 to 19.40 mmol kg−1. The lowest values (2.01–10.01 mmol kg−1) and the smallest variation in DIC concentration were recorded at the non-methanic sediment at station ZGG in the western part of the Gdańsk Deep. At all stations, DIC concentrations increased with sediment depth. The pH in pore water of all sampling sites ranged from 7.20 to 7.89.
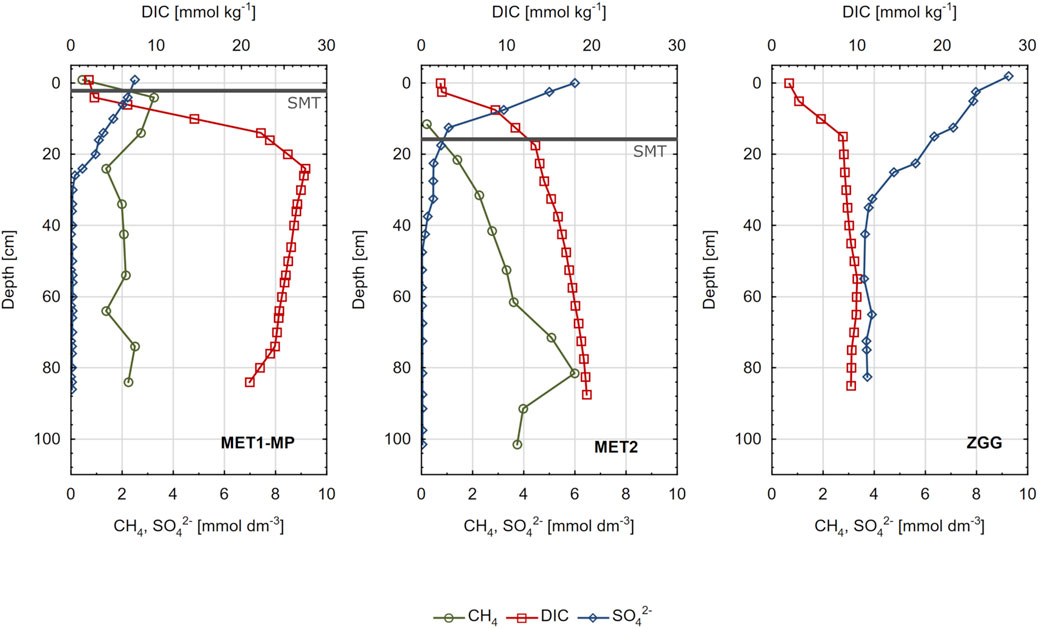
Figure 3. Concentrations of methane (CH4), dissolved inorganic carbon (DIC), and sulphate (SO42-) in pore waters of sediments from three research stations: MET1-MP, MET2, and ZGG.
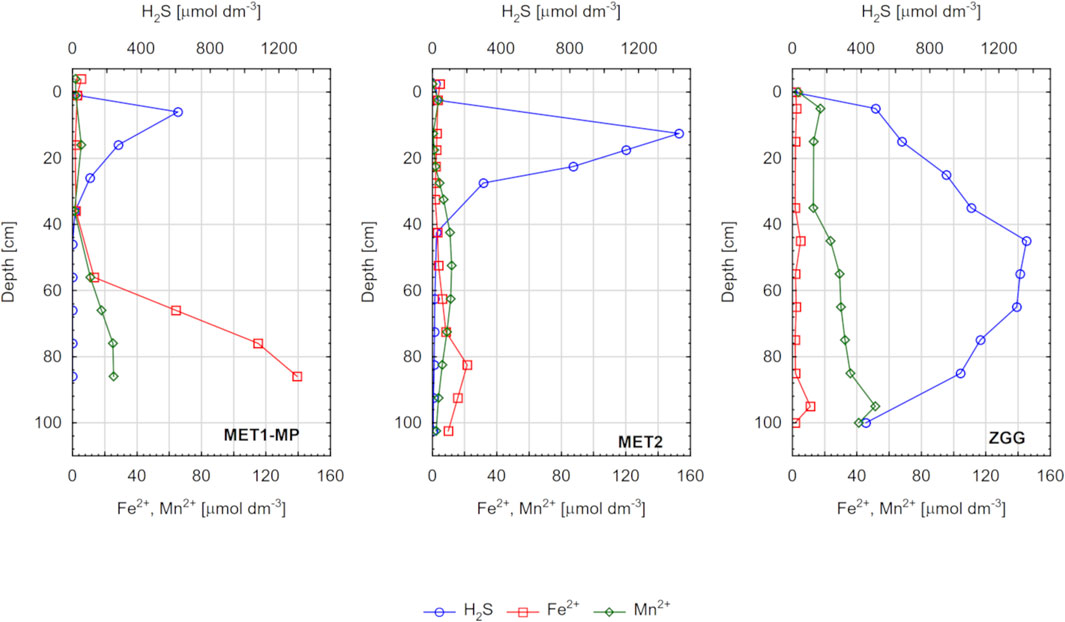
Figure 4. Concentration of hydrogen sulfide (H2S), iron (Fe2+), and manganese (Mn2+) in pore waters of sediments from three research stations: MET1-MP, MET2, and ZGG.
The concentration of CH4 in the examined sediments varied over a wide range (0.41–5.99 mmol dm−3), with an average concentration at station MET1-MP being lower (2.00 ± 0.79 mmol dm−3) than that at station MET2 (3.25 ± 1.65 mmol dm−3). For MET1-MP, the concentration of CH4 increased abruptly in the surface sediment layer to a maximum value at a depth of 5 cm (Figure 3). Deeper in the sediment, the concentration decreased slightly and then stabilized at approximately 2 mmol dm−3. At station MET2, there was a gradual increase in CH4 concentration, reaching a maximum value at 80 cm below the sea floor (bsf).
Concentration of SO42− varied from values <LOQ to 9.3 mmol dm−3 (Figure 3). In the case of station MET1-MP, SO42− was present only to a depth of 20 cm bsf. In this layer, its concentration decreased rapidly and remained <LOQ at deeper layers. At the MET2 station, SO42− was present down to a depth of 40 cm bsf, and the decrease in concentration with depth occurred less abruptly than it did in MET1-MP pore waters. The highest SO42− concentrations were recorded at station ZGG. In the upper 40 cm of the sediment, SO42− concentration decreased from 9.3 to 3.8 mmol dm−3. Deeper in the sediment, the concentration was approximately constant and did not decrease below 3.7 mmol dm−3.
Chloride concentrations in the pore waters of all the sampling stations varied from 165 mmol dm−3 to 70 mmol dm−3. In the deep-water pockmark MET1-MP, there was a marked decrease in concentration with depth (from 135 mmol dm−3 to 70 mmol dm−3), whereas at MET2 and ZGG, concentrations throughout the sediment profile were relatively constant (95–105 mmol dm−3 at MET2 and 149–165 mmol dm−3 at ZGG; Supplementary Figure S2).
In the case of H2S, the highest concentrations in pore waters were found at station ZGG, where it was present throughout the sediment profile, and its concentration reached 1433 μmol dm−3 (Figure 4). At stations MET1-MP and MET2, H2S was present only in a particular layer of sediment (up to approximately 30–40 cm bsf), where sulfate reduction took place (Figure 3). In deeper layers, concentration of H2S was <LOQ.
Concentration of Fe2+ in most cases was below 10 μmol dm−3. Higher values were measured ca. 80 cm bsf in MET2 and ca. 55 cm bsf in MET1-MP (in this case, Fe2+ concentration reached 140 μmol dm−3, the highest measured value). The highest concentration of Mn2+ (4–51 μmol dm−3) was found on ZGG. For the other stations, the concentration increased in the deep sediment layers but did not exceed 26 μmol dm−3.
3.3 Carbonate alkalinity and its benthic flux
CA in pore waters of all stations varied in the range of 1.76–27.25 mmol kg−1. CA was always smaller than TA (Figure 5), which varied from 1.89 to 28.39 mmol kg−1. Depending on the station and depth bsf, the difference between TA and CA was 0.09–2.09 mmol kg−1. The largest differences between TA and CA occurred at station ZGG, and the smallest at MET2. At all stations, there was an increase in CA (and TA) in pore water with increasing depth, and the shape of the profiles was very similar to that of DIC in pore water (Figure 3).
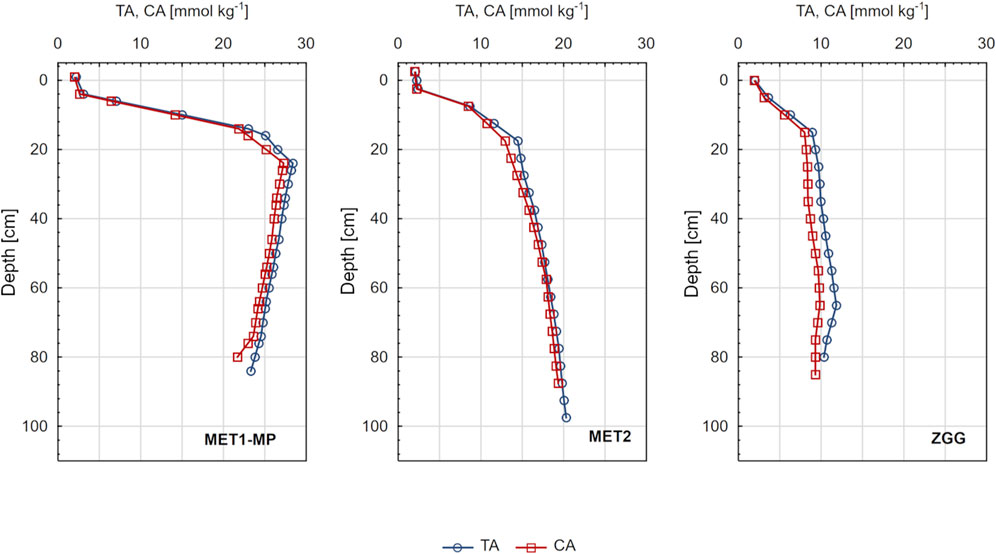
Figure 5. Total alkalinity (TA) and carbonate alkalinity (CA) in pore waters of sediments from three research stations: MET1-MP, MET2, and ZGG.
The average benthic flux of CA obtained in the present study was 1540 ± 419 μmol m−2 d−1. Values of JCA are presented in Table 3. The highest JCA of 2037 ± 47 μmol m−2 d−1 was obtained for pockmark MET1-MP. JCA estimated for station MET2 was 1507 ± 80 μmol m−2 d−1. The lowest JCA of 1078 ± 40 μmol m−2 d−1 was obtained for the non-methanic station ZGG. The dominant component of JCA at all stations was JHCO3-, accounting for 96.6%–99.4% of JCA.
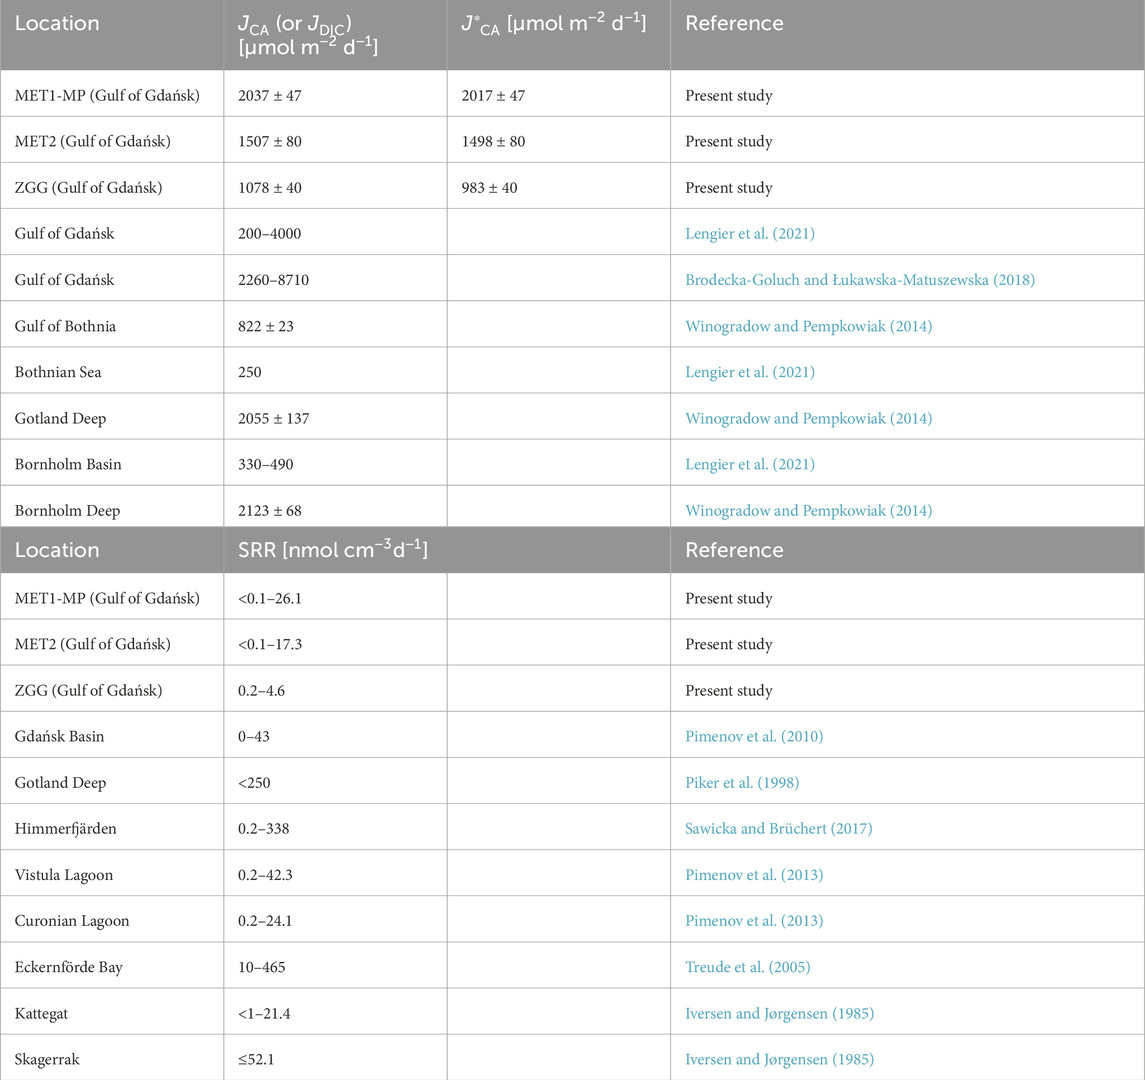
Table 3. Benthic flux of carbonate alkalinity (JCA) and net benthic flux of carbonate alkalinity (J*CA), as well as sulfate reduction rates (SRRs) at three sampling stations examined in the present study (MET1-MP, MET2, and ZGG) and in other areas of the Baltic Sea (in the case of data from the literature, the flux of dissolved inorganic carbon (JDIC) is presented instead of JCA).
3.4 Sulfate reduction rate
The highest SRR values were recorded in the surface layer of the MET1-MP pockmark — the maximum was narrow, and the highest rate (26.1 nmol cm−3 d−1) was observed at a depth of 2–4 cm bsf (Figure 6). Deeper in the sediment, the SRR decreased rapidly and below 25 cm was <0.5 nmol cm−3 d−1. Station MET2 showed two SRR maxima — one at a depth of 17 cm, with a maximum value of 17.3 nmol cm−3 d−1, and a smaller maximum at approximately 3 cm bsf, with a maximum value of 3 nmol cm−3 d−1. At the ZGG station, the SRR value decreased exponentially with sediment depth, from 4.6 nmol cm−3 d−1 near the surface to 0.2 nmol cm−3 d−1 deep in the sediment.
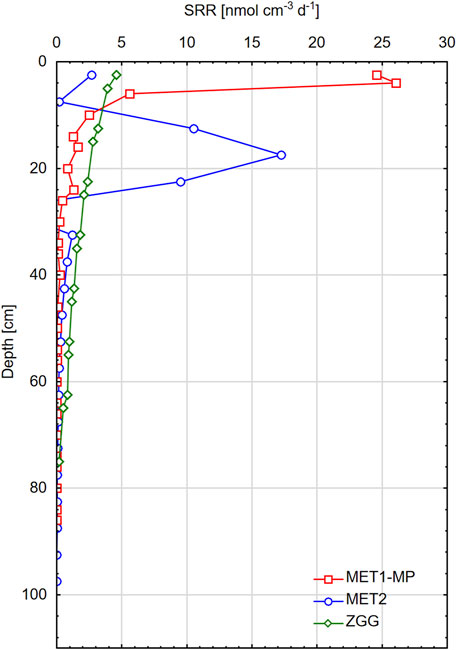
Figure 6. Sulfate reduction rates (SRRs) estimated from the sulfate concentration profiles at three research stations: MET1-MP, MET2, and ZGG.
4 Discussion
4.1 Geochemical variations between research stations
Based on the analysis of parameters in sediments and pore waters, the research stations can be characterized as three systems with significantly different geochemical conditions. Accordingly, station ZGG located within the Gdańsk Deep represents sediment that is fine grained and OM rich (Supplementary Figure S1), yet methane free. The bottom water in the area is usually hypoxic or anoxic, which was also the case during sampling (Table 1). Owing to the very high concentrations of H2S in the pore water and the lack of CH4 (Figure 3), it can be assumed that the predominant pathway of mineralization of OM in the sediment and source of CA in pore water of this station is DSR (Equation 3). Based on the Mn2+ profile (Figure 4), it can be concluded that the source of CA in the pore water of the ZGG station is also microbial Mn(IV) reduction related to OM mineralization (Equation 5); however, concentrations of Mn2+ are two orders of magnitude lower than those of H2S, indicating the dominant role of DSR. It is also noteworthy that at the ZGG station, the share of CA in TA was the smallest among all sampling stations (Figure 5). The difference between TA and CA was as high as 2 mmol kg−1, indicating a significant contribution of non-carbonate inorganic bases (NCIBs) to TA. The presence of high concentrations of other components (mainly H2S, ammonia, and phosphate) that form separate acid–base systems capable of accepting and donating protons is typical of anaerobic sediments and makes the TA in pore waters usually higher than it would be expected from the concentration of DIC (Berner et al., 1970; Hu et al., 2010; Lukawska-Matuszewska et al., 2018).
The other two stations, MET1-MP and MET2, represent anoxic sediment containing CH4. Therefore, it can be assumed that at both stations, the variability of CA in pore water will be influenced by microbial processes associated with the oxidation of this gas (Equations 6–9). Nevertheless, if we analyze the variability of geochemical parameters, it is possible to identify differences between the stations, potentially relevant to the concentration and benthic flux of CA. Starting from the deep-water pockmark MET1-MP, it should be pointed out that SO42− concentrations are low compared to those in the other stations (Figure 3). Pockmark MET1-MP is an area of upward infiltration of fresh groundwater (Brodecka et al., 2013; Brodecka-Goluch et al., 2022; Kurowski et al., 2024) and its possible outflow from the seafloor (Szymczycha et al., 2018; Ehlert von Ahn et al., 2024). Freshwater seepage also occurred during the sampling for the present work, as illustrated by the decrease in Cl− concentration with depth (Supplementary Figure S2). The seeping freshwater dilutes pore water and lowers concentration of SO42−, reducing their availability for decomposition of OM accumulating in the pockmark in significant amounts (Supplementary Figure S1). The depletion of SO42−, together with the high rate of OM accumulation, promotes shallow methanogenesis in sediments, as confirmed by isotopic studies conducted by Ehler von Ahn et al. (2024) at the nearby station, M1. As a consequence, relatively high concentrations of CH4 are observed in the pockmark MET1-MP in the upper sediment layer, and SMT is close (ca. 3 cm bsf) to the sediment surface (Figure 3).
In most marine settings, CH4 diffusing from the methane production zone is efficiently oxidized (Equation 9) by microorganisms that catalyze the SO42−-AOM (e.g., Reeburgh, 1976; Borowski et al., 1999). This makes the SMT an effective barrier against CH4 release from the bottom (e.g., Treude et al., 2003). However, very high sedimentation rates (Egger et al., 2016), insufficient availability of SO42−, and physical processes involving ebullition and gas bubble migration (Martens and Klump, 1980; Kipphut and Martens, 1982; Treude et al., 2005) can cause CH4 leakage through SMT. Alternatively, microbial oxidation of CH4 in the sediment can occur with the involvement of other oxidants, such as nitrate (Equation 6), Fe(III) (Equation 8), and Mn(IV) (Equation 7) (Raghoebarsing et al., 2006; Beal et al., 2009). In our work, we did not study the concentration of inorganic forms of nitrogen, so we cannot conclude about the former process. However, given the profiles of Fe2+ and Mn2+ (Figure 4), it is plausible that CH4 is oxidized with Fe(III) and Mn(IV) compounds. This is mainly supported by a sharp increase in Fe2+ concentration below 50 cm in the sediment, indicative of AOM with Fe(III) (Fe-AOM). Fe2+ accumulates in the pore water because there is no H2S (Figure 3) with which it could precipitate in the form of sulfides. This makes sediments of pockmark with an active fresh groundwater seepage different from the typical marine sediments, where Fe sulfide (mainly pyrite) formation results in the complete removal of Fe2+ from pore water. In typical marine settings, the limiting factor for pyrite formation is the availability of OM and/or Fe(III) (Raiswell and Berner, 1985; Sternbeck and Sohlenius, 1997). Concentration of SO42− is usually high, and the rate of SO42− reduction is high enough to provide sufficient H2S for the process (Berner, 1970). However, in pockmarks, pyrite formation may be limited by the availability of SO42− for the reduction (Boesen and Postma, 1988), especially when groundwater infiltration reduces its concentration. In such a situation, iron sulfide formation is restricted with the low availability of H2S, and Fe2+ accumulates in pore waters. Similarly, Fe2+ enrichment of pore water has been observed in other marine sediments with active Fe-AOM (D’Hondt et al., 2004; Riedinger et al., 2014), as well as in previous studies of deepwater pockmarks in the Gulf of Gdańsk (Kurowski et al., 2024). On the other hand, in the upper layer, to approximately 30 cm bsf, SO42−-AOM occurs, resulting in an increase in H2S concentration in this particular sediment layer.
Station MET2 is located in an area of shallow gas accumulation, with no specific structure on the bottom (Table 1) and no evident signals of groundwater infiltration (Supplementary Figure S2). At station MET2, CH4 concentration decreases linearly toward the sediment surface to <LOD values at approximately 10 cm bsf. CH4 oxidation occurs mainly through the SO42−-AOM pathway (Equation 9), as evidenced by a decrease in CH4 concentration with a concomitant decrease in SO42− and a sharp increase in H2S concentration, which reaches 1400 μmol dm−3 at a depth of 16 cm bsf. AOM involving Fe(III) and Mn(IV) is probably far less important, as supported by the minor increase in Fe2+ and Mn2+ concentrations in the deep sediment layers (Figure 3). Compared to the MET1-MP pockmark, the availability of SO42− for various microbial processes in the sediment at MET2 station is higher — SO42− is present here down to a depth of approximately 40 cm and in much higher concentrations than at MET1-MP. Consequently, the SMT is deeper below the sediment surface (approximately 16 cm bsf) than at MET1-MP (Figure 3).
4.2 Comparison of the benthic flux of CA with existing data
The range of JCA obtained in the present study (1037–2084 µmol m−2 d−1) agrees well with the results of previous studies from the Baltic Sea (Table 3). For example, Winogradow and Pempkowiak (2014) studied DIC (approximately equivalent to CA) fluxes in different areas of the Baltic Sea, obtaining values of 822 ± 23 μmol m−2 d−1 in the Gulf of Bothnia, 2123 ± 68 μmol m−2 d−1 in the Bornholm Deep, and 2055 ± 137 μmol m−2 d−1 in the Gotland Deep. Lengier et al. (2021) reported a benthic DIC flux of 2160 μmol m−2 d−1 in the Gdańsk Basin. Fluxes obtained for the Bornholm Basin and Bothnian Sea were lower: 330–490 μmol m−2 d−1 and 250 μmol m−2 d−1, respectively. In turn, the values reported by Brodecka-Goluch and Łukawska-Matuszewska (2018) are higher than the JCA calculated in the present work, ranging from 2260 to 8710 μmol m−2 d−1.
4.3 Factors affecting the benthic flux of CA
Based on the analysis of geochemical variations between research stations, two processes were identified that potentially affect JCA: DSR and SO42−-AOM. At this point, it is worth mentioning that alkalinity production associated with the sulfate reduction during DSR and AOM is partially reversible. JCA can partially be diminished by the oxidation of H2S, the main by-product of bacterial sulfate reduction, at or near the water–sediment interface (Krumins et al., 2013). Oxidation of H2S releases H+ and leads to the consumption of alkalinity. To assess the potential effect of H2S oxidation on JCA, we calculated the flux of HS− (JHS-), the main ionic form of H2S, across the sediment–water interface. JHS- represents the amount of H2S that can be oxidized when released into the overlying water and corresponds to the fraction of CA that will be consumed. The JHS- value was calculated analogously to JHCO3- and JCO32- (Section 2.3). The parameters and variables used in the calculation of JHS- are presented in Supplementary Table S1. The resulting JHS- is at least an order of magnitude smaller than JCA: 20 μmol m−2 d−1 at station MET1-MP, 9 μmol m−2 d−1 at station MET2, and 95 μmol m−2 d−1 at station ZGG. This suggests that JCA can be diminished by approximately 1% in the case of stations MET1-MP and MET2 and approximately 9% in the case of station ZGG as a result of H2S oxidation. Assuming the complete oxidation of H2S released from the sediment to the bottom water, the net benthic flux of CA (J*CA) from the sediment in the study area is 943–2064 μmol m−2 d−1 (Table 3).
Both DSR and SO42−-AOM involve SO42− reduction accompanied by the release of DIC (Equations 3, 9); however, which process dominates the sediment and at what depth it occurs strongly depend on the local environmental conditions. The high input of OM to the seafloor in the study area (sedimentation rate is 1.4–1.7 mm year−1; Szmytkiewicz and Zalewska, 2014; Szymczak-Żyła et al., 2017) indicates that O2, NO3−, Mn(IV), and Fe(III) used by microorganisms for decomposition of OM (Froelich et al., 1979) are quickly consumed, and the sulfate reduction zone begins just below the sediment surface (e.g., Kurowski et al., 2024 and the present study). Due to the lower salinity than that in oceanic waters, the availability of SO42− in the Baltic water is limited, resulting in a shallower methane production zone in the sediment (e.g., Brodecka et al., 2013; Kurowski et al., 2024). In the case of pockmarks, SO42− availability can be further reduced by infiltration of fresh groundwater (Idczak et al., 2020; Brodecka-Goluch et al., 2022; Ehlert von Ahn et al., 2024, and the present study). In addition, pockmarks that take the form of depressions in the bottom serve as sedimentation traps for sinking OM; thus, the methane production zone moves even closer to the sediment surface. In the case of the MET1-MP pockmark, where J*CA is estimated to be the largest, SO42− are mainly consumed in the SO42−-AOM, and the SMT is located just below the sediment surface.
As the production and benthic flux of CA are affected not only by the type of process in which it is generated but also by its rate, we attempted to estimate the SRR in the sediment of the investigated stations. Given that SO42− in the sediment is consumed by both DSR and SO42−-AOM, the SRRs estimated from the SO42− concentration profile represent the net rate being the sum of the rates of these two processes (SRR = RDSR + RSO42−AOM). A comparison of calculated rates with literature data shows that they are similar to rates previously determined at various locations within the Baltic Sea; however, they fall in the range of lower values (Table 3). The profile-based SRRs represent net SO42− consumption in sediments and tend to be lower than gross rates estimated from radiotracer incubations presented in other studies (Iversen and Jørgensen, 1985; Jørgensen and Kasten, 2006).
Both SRR and SRR depth trends vary significantly between stations (Figure 6). The ZGG station has a markedly lower SRR, which decreases exponentially with sediment depth, reflecting the oxidation of available OM by SRB (Berner, 1964; Jørgensen, 1978). In the case of this methane-free sediment, SO42− is exclusively consumed on DSR; thus, SRR = RDSR. At this particular station, J*CA is the smallest (twice as small as that at the MET1-MP station), likely due to the lower SRR and the reoxidation of H2S, which further reduces the flux.
The maximum SRR (Figure 6) as well as J*CA (Table 3) obtained for methanic sediments from stations MET1-MP and MET2 are significantly higher than those at ZGG. Moreover, the SRRs at MET1-MP and MET2 vary irregularly with depth, and distinct maxima are present in the profiles. The occurrence of maximum SRRs in specific sediment layers of these stations can be attributed to different processes fed by the SO42− flux. In the case of the MET2 station, the geochemical stratification of the sediment column is apparent. Both DSR and SO42−-AOM occur in the sediment; therefore, SRR reflects the sum of RDSR and RSO42−AOM. In the upper sediment layer, SO42− is consumed mainly during the oxidation of OM. The first maximum of SRR is connected to the use of SO42− in this process. Deeper in the sediment, SO42− is consumed for the oxidation of CH4, and SRRs are much higher with a maximum ca. 16–17 cm bsf. Therefore, it can be assumed that AOM is more important for the production of CA in the pore water at this station. Nevertheless, J*CA is significantly lower than that at MET1-MP.
Examining the geochemical parameters in the pockmark MET1-MP (Figures 3, 4) allows us to conclude that in the upper 26 cm of sediment at this station, SO42− is consumed on AOM, and therefore, the SRR reflects RSO42−AOM. Linear changes in SO42− concentration with depth indicate that sulfate is consumed almost entirely by CH4 and that sulfate reduction dominates only close to the SMT (Niewöhner et al., 1998; Jørgensen and Kasten, 2006; Sivan et al., 2007). The situation is similar in the MET1-MP pockmark, where the distinct and narrow maximum of SRR occurs in the SMT area. The shallow SMT, combined with the high SRR, makes J*CA at least 25% larger than that in the case of the other two stations.
In summary, analysis of the geochemical parameters in anaerobic sediments with different characteristics (methanic, methanic with fresh groundwater seepage, and without methane) showed that the concentration and release of CA from sediments depend on the type (DSR and AOM) and the rate of the process producing it. Another factor affecting J*CA is the depth of SMT in the sediment. The highest J*CA was obtained for AOM-dominated sediment with fresh groundwater seepage and shallow SMT. The lowest J*CA occurred for non-methanic sediment, where CA was produced mainly in DSR. Our results may be useful for further modeling studies aimed at determining the role of sediments as an internal source of alkalinity to help close the alkalinity budget in the Baltic Sea and predicting the direction of environmental changes under stressors related to eutrophication and climate change.
An important future direction is to explore how, with the increasing eutrophication and elevated temperatures negatively affecting the oxygenation of seawater, the role of sediments as an internal source of alkalinity will change. In addition, with the expected increase in precipitation and river runoff (especially in the northern part) associated with the climate change in the Baltic Sea region (HELCOM/Baltic Earth, 2021), will there be a freshening and reduction in sulfate concentration in water, resulting in increased CH4 production and shallower SMT in the sediment, and how this will affect the release of CA from the seabed?
Data availability statement
The original contributions presented in the study are included in the article/Supplementary Material; further inquiries can be directed to the corresponding author.
Author contributions
KL-M: funding acquisition, formal analysis, writing – review and editing, visualization, writing – original draft, data curation, conceptualization, investigation, and project administration. MD: validation, methodology, writing – review and editing, software, formal analysis, and writing – original draft.
Funding
The author(s) declare that financial support was received for the research and/or publication of this article. The study was funded by the National Science Centre, Poland (grant number 2022/45/B/ST10/00395). The study was partly funded by the AGH University of Krakow in the scope of the statutory works No. 16.16.140.315/06.
Acknowledgments
The authors would like to thank the captains and the crew of r/v Oceanograf.
Conflict of interest
The authors declare that the research was conducted in the absence of any commercial or financial relationships that could be construed as a potential conflict of interest.
Generative AI statement
The author(s) declare that no Generative AI was used in the creation of this manuscript.
Publisher’s note
All claims expressed in this article are solely those of the authors and do not necessarily represent those of their affiliated organizations, or those of the publisher, the editors and the reviewers. Any product that may be evaluated in this article, or claim that may be made by its manufacturer, is not guaranteed or endorsed by the publisher.
Supplementary material
The Supplementary Material for this article can be found online at: https://www.frontiersin.org/articles/10.3389/feart.2025.1593031/full#supplementary-material
References
Beal, E. J., House, C. H., and Orphan, V. J. (2009). Manganese- and iron dependent marine methane oxidation. Science 325, 184–187. doi:10.1126/science.1169984
Berner, R. A. (1964). An idealized model of dissolved sulfate distribution in recent sediments. Geochim. Cosmochim. Acta 28, 1497–1503. doi:10.1016/0016-7037(64)90164-4
Berner, R. A., Scott, M. R., and Thomlinson, C. (1970). Carbonate alkalinity in the pore water of anoxic marine sediments. Limnol. Oceanogr. 15, 544–549. doi:10.4319/lo.1970.15.4.0544
Beulig, F., Røy, H., McGlynn, S. E., and Jørgensen, B. B. (2019). Cryptic CH4 cycling in the sulfate–methane transition of marine sediments apparently mediated by ANME-1 archaea. ISME J. 13, 250–262. doi:10.1038/s41396-018-0273-z
Boesen, C., and Postma, D. (1988). Pyrite formation in anoxic environments of the Baltic. Am. J. Sci. 288, 575–603. doi:10.2475/001c.60457
Boetius, A., Ravenschlag, K., Schubert, C. J., Rickert, D., Widdel, F., Gieseke, A., et al. (2000). A marine microbial consortium apparently mediating anaerobic oxidation of methane. Nature 407, 623–626. doi:10.1038/35036572
Borowski, W. S., Paull, C. K., and Ussler III., W. (1999). Global and local variations of interstitial sulfate gradients in deep-water, continental margin sediments: sensitivity to underlying methane and gas hydrates. Mar. Geol. 159, 131–154. doi:10.1016/s0025-3227(99)00004-3
Boudreau, B. P. (1996). A method-of-lines code for carbon and nutrient diagenesis in aquatic sediments. Comput. Geosci. 22, 479–496. doi:10.1016/0098-3004(95)00115-8
Boudreau, B. P. (1997). The diffusive tortuosity of fine-grained unlithified sediments. Geochim. Cosmochim. Acta 60, 3139–3142. doi:10.1016/0016-7037(96)00158-5
Brodecka, A., Majewski, P., Bolałek, J., and Klusek, Z. (2013). Geochemical and acoustic evidence for the occurrence of methane in sediments of the Polish sector of the southern Baltic Sea. Oceanologia 55, 951–978. doi:10.5697/oc.55-4.951
Brodecka-Goluch, A., and Łukawska-Matuszewska, K. (2018). Pore water dissolved organic and inorganic carbon in relation to methane occurrence in sediments of the Gdańsk basin (southern Baltic Sea). Cont. Shelf Res. 168, 11–20. doi:10.1016/j.csr.2018.08.008
Brodecka-Goluch, A., Łukawska-Matuszewska, K., Kotarba, M. J., Borkowski, A., Idczak, J., and Bolałek, J. (2022). Biogeochemistry of three different shallow gas systems in continental shelf sediments of the South-Eastern Baltic Sea (Gulf of Gdańsk): carbon cycling, origin of methane and microbial community composition. Chem. Geol. 597, 120799. doi:10.1016/j.chemgeo.2022.120799
Caldeira, K., and Berner, R. (1999). Seawater pH and atmospheric carbon dioxide. Science 286 (5447), 2043. doi:10.1126/science.286.5447.2043a
Chatterjee, S., Dickens, G. R., Bhatnagar, G., Chapman, W. G., Dugan, B., Snyder, G. T., et al. (2011). Pore water sulfate, alkalinity, and carbon isotope profiles in shallow sediment above marine gas hydrate systems: a numerical modeling perspective. J. Geophys. Res. 116, B09103. doi:10.1029/2011jb008290
Cline, J. D. (1969). Spectrophotometric determination of hydrogen sulfide in natural waters. Limnol. Oceanogr. 14, 454–458. doi:10.4319/lo.1969.14.3.0454
Denis, L., and Grenz, C. (2003). Spatial variability in oxygen and nutrient fluxes at the sediment–water interface on the continental shelf in the Gulf of Lions (NW Mediterranean). Oceanol. Acta 26, 373–389. doi:10.1016/s0399-1784(03)00017-3
D’Hondt, S., Jørgensen, B. B., Miller, D. J., Batzke, A., Blake, R., Cragg, B. A., et al. (2004). Distributions of microbial activities in deep subseafloor sediments. Science. 306, 2216–2221. doi:10.1126/science.1101155
Dickson, A. G. (1981). An exact definition of total alkalinity and a procedure for the estimation of alkalinity and total inorganic carbon from titration data. Deep Sea Res. I Oceanogr. Res. Pap. 28, 609–623. doi:10.1016/0198-0149(81)90121-7
A. G. Dickson, C. L. Sabine, and J. R. Christian (2007). “Guide to best practices for ocean CO2 measurements,” (Sidney, Canada: PICES Special Publication), 3, 191.North pacific marine science organization
Doney, S. C., Fabry, V. J., Feely, R. A., and Kleypas, J. A. (2009). Ocean acidification: the other CO2 problem. Ann. Rev. Mar. Sci. 1, 169–192. doi:10.1146/annurev.marine.010908.163834
Egger, M., Lenstra, W., Jong, D., Meysman, F. J. R., Sapart, C. J., van der Veen, C., et al. (2016). Rapid sediment accumulation results in high methane effluxes from coastal sediments. PLoS ONE 11 (8), e0161609. doi:10.1371/journal.pone.0161609
Egger, M., Riedinger, N., Mogollón, J. M., and Jørgensen, B. B. (2018). Global diffusive fluxes of methane in marine sediments. Nat. Geosci. 11, 421–425. doi:10.1038/s41561-018-0122-8
Ehlert von Ahn, C. M., Dellwig, O., Szymczycha, B., Kotwicki, L., Rooze, J., Endler, R., et al. (2024). Submarine groundwater discharge into a semi-enclosed coastal bay of the southern Baltic Sea: a multi-method approach. Oceanologia 66, 111–138. doi:10.1016/j.oceano.2024.01.001
Engvall, A. G. (1978). The fate of nitrogen in early diagenesis of Baltic sediments (Sweden: Dept. of Geology). Ph.D. Thesis, University of Stockholm.
Friedlingstein, P., O'Sullivan, M., Jones, M. W., Andrew, R. M., Hauck, J., Olsen, A., et al. (2020). Global carbon budget 2020. Earth Syst. Sci. Data 12 (4), 3269–3340. doi:10.5194/essd-12-3269-2020
Froelich, P., Klinkhammer, G., Bender, M., Luedtke, N., Heath, G. R., Cullen, D., et al. (1979). Early oxidation of organic matter in pelagic sediments of the eastern equatorial Atlantic: suboxic diagenesis. Cosmochim. Cosmochim. Acta 43, 1075–1090. doi:10.1016/0016-7037(79)90095-4
Griffiths, J. R., Kadin, M., Nascimento, F. J. A., Tamelander, T., Törnroos, A., Bonaglia, S., et al. (2017). The importance of benthic-pelagic coupling for marine ecosystem functioning in a changing world. Glob. Chang. Biol. 23, 2179–2196. doi:10.1111/gcb.13642
Gustafsson, E. (2013). “Modelling the marine CO2 system in BALTSEM,” in BNI Technical report No. 9. Stockholm: Baltic Nest Institute, Stockholm University, 29.
Gustafsson, E., Hagens, M., Sun, X., Reed, D. C., Humborg, C., Slomp, C. P., et al. (2019). Sedimentary alkalinity generation and long-term alkalinity development in the Baltic Sea. Biogeosciences 16, 437–456. doi:10.5194/bg-16-437-2019
Gustafsson, E., Wällstedt, T., Humborg, Ch., Mörth, C.-M., and Gustafsson, B. G. (2014). External total alkalinity loads versus internal generation: the influence of nonriverine alkalinity sources in the Baltic Sea. Glob. Biogeochem. Cycles 28, 1358–1370. doi:10.1002/2014GB004888
Hammer, K., Schneider, B., Kuliński, K., and Schulz-Bull, D. E. (2014). Precision and accuracy of spectrophotometric pH measurements at environmental conditions in the Baltic Sea. Est. Coast. Shelf Sci. 146, 24–32. doi:10.1016/j.ecss.2014.05.003
Hedges, I., and Stern, J. (1984). Carbon and nitrogen determinations of carbonate containing solids. Limnol. Oceanogr. 29, 657–663. doi:10.4319/lo.1984.29.3.0657
HELCOM/Baltic Earth (2021). Climate change in the Baltic Sea. 2021 fact sheet. Balt. Sea Environ. Proc. n°180.
Hu, X., and Cai, W.-J. (2011). An assessment of ocean margin anaerobic processes on oceanic alkalinity budget. Global Biogeochemical Cycles 25, GB3003. doi:10.1029/2010GB003859
Hu, X., Cai, W.-J., Wang, Y., Luo, S., and Guo, X. (2010). Pore-water geochemistry of two contrasting brine-charged seep sites in the northern Gulf of Mexico continental slope. Mar. Chem. 118, 99–107. doi:10.1016/j.marchem.2009.11.006
Idczak, J., Brodecka-Goluch, A., Łukawska-Matuszewska, K., Graca, B., Gorska, N., Klusek, Z., et al. (2020). A geophysical, geochemical and microbiological study of a newly discovered pockmark with active gas seepage and submarine groundwater discharge (MET1-BH, central Gulf of Gdańsk, southern Baltic Sea). Sci. Total Environ. 742, 140306. doi:10.1016/j.scitotenv.2020.140306
In't, Z. M. H., de Jong, A. E., Slomp, C. P., and Jetten, M. S. (2018). The hunt for the most-wanted chemolithoautotrophic spookmicrobes. FEMS Microbiol. Ecol. 94 (6), fiy064. doi:10.1093/femsec/fiy064
Iversen, N., and Jørgensen, B. B. (1985). Anaerobic methane oxidation rates at the sulfate-methane transition in marine sediments from Kattegat and Skagerrak (Denmark). Limnol. Oceanogr. 30, 944–955. doi:10.4319/lo.1985.30.5.0944
Jaśniewicz, D., Klusek, Z., Brodecka-Goluch, A., and Bolałek, J. (2019). Acoustic investigations of shallow gas in the southern Baltic Sea (Polish exclusive Economic Zone): a review. Geo-Mar. Lett. 39, 1–17. doi:10.1007/s00367-018-0555-5
Jiang, Z., Tyrrell, T., Hydes, D. J., Dai, M., and Hartman, S. E. (2014). Variability of alkalinity and the alkalinity-salinity relationship in the tropical and subtropical surface ocean. Glob. Biogeochem. Cycles 28, 729–742. doi:10.1002/2013GB004678
Jørgensen, B. B. (1978). A comparison of methods for the quantification of bacterial sulfate reduction in coastal marine sediments. Geomicrobiol. J. 1 (1), 11–27. doi:10.1080/01490457809377721
Jørgensen, B. B., and Kasten, S. (2006). “Sulfur cycling and methane oxidation,” in Marine geochemistry. Editors H. D. Schulz, and M. Zabel (Berlin, Heidelberg: Springer). doi:10.1007/3-540-32144-6_8
Jørgensen, B. B., Weber, A., and Zopfi, J. (2001). Sulfate reduction and anaerobic oxidation in Black Sea sediments. Deep-Sea Res. Part I 48, 2097–2120. doi:10.1016/S0967-0637(01)00007-3
Kipphut, G. W., and Martens, C. S. (1982). Biogeochemical cycling in an organic-rich coastal marine basin—3. Dissolved gas transport in methane-saturated sediments. Geochimica Cosmochimica Acta 46, 2049–2060. doi:10.1016/0016-7037(82)90184-3
Krumins, V., Gehlen, M., Arndt, S., Van Cappellen, P., and Regnier, P. (2013). Dissolved inorganic carbon and alkalinity fluxes from coastal marine sediments: model estimates for different shelf environments and sensitivity to global change. Biogeosciences 10, 371–398. doi:10.5194/bg-10-371-2013
Kurowski, S., Łukawska-Matuszewska, K., Čović, A., Jozić, D., and Brodecka-Goluch, A. (2024). Effects of pockmark activity on iron cycling and mineral composition in continental shelf sediments (southern Baltic Sea). Biogeochemistry 167, 135–154. doi:10.1007/s10533-024-01127-1
Lengier, M., Szymczycha, B., Brodecka-Goluch, A., Kłostowska, Ż., and Kuliński, K. (2021). Benthic diffusive fluxes of organic and inorganic carbon, ammonium and phosphates from deep water sediments of the Baltic Sea. Oceanologia 63, 370–384. doi:10.1016/j.oceano.2021.04.002
Le Quéré, C., Moriarty, R., Andrew, R. M., Canadell, J. G., Sitch, S., Korsbakken, J. I., et al. (2015). Global carbon budget 2015. Earth Syst. Sci. Data 7, 349–396. doi:10.5194/essd-7-349-2015
Li, Y.-H., and Gregory, S. (1974). Diffusion of ions in sea water and in deep-sea sediments. Geochim. Cosmochim. Acta. 38, 703–714. doi:10.1016/0016-7037(74)90145-8
Liu, Q., Dai, M., Chen, W., Huh, C. A., Wang, G., Li, Q., et al. (2012). How significant is submarine groundwater discharge and its associated dissolved inorganic carbon in a river-dominated shelf system? Biogeosciences 9 (5), 1777–1795. doi:10.5194/bg-9-1777-2012
Łukawska-Matuszewska, K., and Graca, B. (2018). Pore water alkalinity below the permanent halocline in the Gdańsk Deep (Baltic Sea) - concentration variability and benthic fluxes. Mar. Chem. 204, 49–61. doi:10.1016/j.marchem.2018.05.011
Lukawska-Matuszewska, K., Grzybowski, W., Szewczun, A., and Tarasiewicz, P. (2018). Constituents of organic alkalinity in pore water of marine sediments. Mar. Chem. 200, 22–32. doi:10.1016/j.marchem.2018.01.012
Martens, C. S., and Klump, J. V. (1980). Biogeochemical cycling in an organic-rich coastal marine basin—I. Methane sediment-water exchange processes. Geochim. Cosmochim. Acta 44, 471–490. doi:10.1016/0016-7037(80)90045-9
Millero, F. J. (2010). Carbonate constants for estuarine waters. Mar. Freshw. Res 61, 139–142. doi:10.1071/mf09254
Millero, F. J., Lee, K., and Roche, M. (1998). Distribution of alkalinity in the surface waters of the major oceans. Mar. Chem. 60, 111–130. doi:10.1016/S0304-4203(97)00084-4
Niewöhner, C., Hensen, C., Kasten, S., Zabel, M., and Schulz, H. D. (1998). Deep sulfate reduction completely mediated by anaerobic methane oxidation in sediments of the upwelling area off Namibia. Geochim. Cosmochim. Acta 62, 455–464. doi:10.1016/s0016-7037(98)00055-6
Orr, J. C., Fabry, V. J., Aumont, O., Bopp, L., Doney, S. C., Feely, R. A., et al. (2005). Anthropogenic ocean acidification over the twenty-first century and its impact on calcifying organisms. Nature 437, 681–686. doi:10.1038/nature04095
Parsons, T. R., Maaita, Y., and Lalli, C. M. (1985). A manual of chemical and biological methods for seawater analysis. Oxford: Pergamon Press, 201.
Piker, L., Schmaljohann, R., and Imhoff, J. F. (1998). Dissimilatory sulfate reduction and methane production in Gotland Deep sediments (Baltic Sea) during a transition period from oxic to anoxic bottom water (1993-1996). Aquat. Microb. Ecol. 14, 183–193. doi:10.3354/ame014183
Pimenov, N. V., Ul’yanova, M. O., Kanapatskii, T. A., Mitskevich, I. N., Rusanov, I. I., Sigalevich, P. A., et al. (2013). Sulfate reduction, methanogenesis, and methane oxidation in the upper sediments of the Vistula and Curonian Lagoons, Baltic Sea. Microbiology 82, 224–233. doi:10.1134/s0026261713020136
Pimenov, N. V., Ulyanova, M. O., Kanapatsky, T. A., Veslopolova, E. F., Sigalevich, P. A., and Sivkov, V. V. (2010). Microbially mediated methane and sulfur cycling in pockmark sediments of the Gdansk Basin, Baltic Sea. Geo-Mar Lett. 30, 439–448. doi:10.1007/s00367-010-0200-4
Raghoebarsing, A., Pol, A., van de Pas-Schoonen, K., Smolders, A. J. P., Ettwig, K. F., Rijpstra, W. I. C., et al. (2006). A microbial consortium couples anaerobic methane oxidation to denitrification. Nature 440, 918–921. doi:10.1038/nature04617
Raiswell, R., and Berner, R. A. (1985). Pyrite formation in euxinic and semi-euxinic sediments. Am. J. Sci. 285, 710–724. doi:10.2475/ajs.285.8.710
Rassmann, J., Lansard, B., Pozzato, L., and Rabouille, C. H. (2016). Carbonate chemistry in sediment porewaters of the Rhône River deltadriven by early diagenesis (northwestern Mediterranean). Biogeosciences 13, 5379–5394. doi:10.5194/bg-13-5379-2016
Reeburgh, W. S. (1976). Methane consumption in Cariaco trench waters and sediments. Earth Planet. Sci. Lett. 28 (3), 337–344. doi:10.1016/0012-821x(76)90195-3
Riedinger, N., Formolo, M. J., Lyons, T. W., Henkel, S., Beck, A., and Kasten, S. (2014). An inorganic geochemical argument for coupled anaerobic oxidation of methane and iron reduction in marine sediments. Geobiology 12, 172–181. doi:10.1111/gbi.12077
Ritger, S., Carson, B., and Suess, E. (1987). Methane-derived authigenic carbonates formed by subduction-induced pore–water expulsion along the Oregon/Washington margin. Geol. Soc. Amer. Bull. 98, 147–156. doi:10.1130/0016-7606(1987)98<147:macfbs>2.0.co;2
Sawicka, J. E., and Brüchert, V. (2017). Annual variability and regulation of methane and sulfate fluxes in Baltic Sea estuarine sediments. Biogeosciences 14, 325–339. doi:10.5194/bg-14-325-2017
Sayles, F. L., Deuser, W. G., Goudreau, J. E., Dickinson, W. H., Jickells, T. D., and King, P. (1996). The benthic cycle of biogenic opal at the Bermuda Atlantic Time Series site. Deep Sea Res. Part I Oceanogr. Res. Pap. 43 (4), 383–409. doi:10.1016/0967-0637(96)00027-1
Sivan, O., Schrag, D. P., and Murray, R. W. (2007). Rates of methanogenesis and methanotrophy in deep-sea sediments. Geobiology 5, 141–151. doi:10.1111/j.1472-4669.2007.00098.x
Srithongouthai, S., Sonoyama, Y., Tada, K., and Montani, S. (2003). The influence of environmental variability on silicate exchange rates between sediment and water in a shallow-water coastal ecosystem, the Seto Inland Sea, Japan. Mar. Pollut. Bull. 47, 10–17. doi:10.1016/s0025-326x(02)00406-x
Sternbeck, J., and Sohlenius, G. (1997). Authigenic sulfide and carbonate mineral formation in Holocene sediments of the Baltic Sea. Chem. Geol. 135, 55–73. doi:10.1016/s0009-2541(96)00104-0
Sturm, A., Fowle, D. A., Jones, C., Leslie, K., Nomosatryo, S., Henny, C., et al. (2019). Rates and pathways of CH4 oxidation in ferruginous Lake Matano, Indonesia. Geobiology 17, 294–307. doi:10.1111/gbi.12325
Sulpis, O., Humphreys, M. P., Wilhelmus, M. M., Carroll, D., Berelson, W. M., Menemenlis, D., et al. (2022). RADIv1: a non-steady-state early diagenetic model for ocean sediments in Julia and MATLAB/GNU Octave. Geosci. Model Dev. 15, 2105–2131. doi:10.5194/gmd-15-2105-2022
Szmytkiewicz, A., and Zalewska, T. (2014). Sediment deposition and accumulation rates determined by sediment trap and 210Pb isotope methods in the Outer Puck Bay (Baltic Sea). Oceanologia 56, 85–106. doi:10.5697/oc.56-1.085
Szymczak-Żyła, M., Krajewska, M., Winogradow, A., Zaborska, A., Breedveld, G. D., and Kowalewska, G. (2017). Tracking trends in eutrophication based on pigments in recent coastal sediments. Oceanologia 59 (1), 1–17. doi:10.1016/j.oceano.2016.08.003
Szymczycha, B., Böttcher, M. E., Diak, M., Koziorowska-Makuch, K., Kuliński, K., Makuch, P., et al. (2023). The benthic-pelagic coupling affects the surface water carbonate system above groundwater-charged coastal sediments. Front. Mar. Sci. 10, 1218245. doi:10.3389/fmars.2023.1218245
Szymczycha, B., Kłostowska, Ż., Kuliński, K., Winogradow, A., Jakacki, J., Klusek, Z., et al. (2018). Deep submarine groundwater discharge indicated by pore water chloride anomalies in the Gulf of Gdańsk, southern Baltic Sea. E3S Web Conf. 54, 00035. doi:10.1051/e3sconf/20185400035
Thamdrup, B., and Canfield, D. E. (1996). Pathways of carbon oxidation in continental margin sediments off central Chile. Limnol. Oceanogr. 41, 1629–1650. doi:10.4319/lo.1996.41.8.1629
Treude, T., Boetius, A., Knittel, K., Wallmann, K., and Jorgensen, B. B. (2003). Anaerobic oxidation of methane above gas hydrates at hydrate ridge, NE pacific ocean. Mar. Ecol. Prog. Ser. 264, 1–14. doi:10.3354/meps264001
Treude, T., Krüger, M., Boetius, A., and Jørgensen, B. B. (2005). Environmental control on anaerobic oxidation of methane in the gassy sediments of Eckernförde Bay (German Baltic). Limnol. Oceanogr. 50 (6), 1771–1786. doi:10.4319/lo.2005.50.6.1771
Urban, N. R., Dinkel, C., and Wehril, B. (1997). Solute transfer across the sediment surface of a eutrophic lake: I. Porewater profiles from dialysis sampler. Aquat. Sci. 59, 1–25. doi:10.1007/BF02522546
Wallmann, K., Aloisi, G., Haeckel, M., Tishchenko, P., Pavlova, G., Greinert, J., et al. (2008). Silicate weathering in anoxic marine sediments. Geochim. Cosmochim. Acta 72, 2895–2918. doi:10.1016/j.gca.2008.03.026
Wallmann, K., Diesing, M., Scholz, F., Rehder, G., Dale, A. W., Fuhr, M., et al. (2022). Erosion of carbonate-bearing sedimentary rocks may close the alkalinity budget of the Baltic Sea and support atmospheric CO2 uptake in coastal seas. Front. Mar. Sci. 9, 968069. doi:10.3389/fmars.2022.968069
Winogradow, A., and Pempkowiak, J. (2014). Organic carbon burial rates in the Baltic Sea sediments. Estuar. Coast. Shelf Sci. 138, 27–36. doi:10.1016/j.ecss.2013.12.001
Wolf-Gladrow, D. A., Zeebe, R. E., Klaas, Ch., Körtzinger, A., and Dickson, A. (2007). Total alkalinity: the explicit conservative expression and its application to biogeochemical processes. Mar. Chem. 106, 287–300. doi:10.1016/j.marchem.2007.01.006
Keywords: alkalinity, anoxic diagenesis, microbial activity, anaerobic methane oxidation, sulfate reduction, marine sediment
Citation: Łukawska-Matuszewska K and Dwornik M (2025) Early diagenesis in anoxic sediments of the Gulf of Gdańsk (southern Baltic Sea): Implications for porewater chemistry and benthic flux of carbonate alkalinity. Front. Earth Sci. 13:1593031. doi: 10.3389/feart.2025.1593031
Received: 13 March 2025; Accepted: 30 April 2025;
Published: 05 June 2025.
Edited by:
Karol Kulinski, Institute of Oceanology (PAS), PolandReviewed by:
Erik Gustafsson, Stockholm University, SwedenBernd Schneider, Leibniz Institute for Baltic Sea Research (LG), Germany
Copyright © 2025 Łukawska-Matuszewska and Dwornik. This is an open-access article distributed under the terms of the Creative Commons Attribution License (CC BY). The use, distribution or reproduction in other forums is permitted, provided the original author(s) and the copyright owner(s) are credited and that the original publication in this journal is cited, in accordance with accepted academic practice. No use, distribution or reproduction is permitted which does not comply with these terms.
*Correspondence: Katarzyna Łukawska-Matuszewska, a2F0YXJ6eW5hLmx1a2F3c2thLW1hdHVzemV3c2thQHVnLmVkdS5wbA==