Abstract
The hardening small strain (HSS) model can accurately capture the stress-related characteristics of soil during the small strain stage. This model has been widely used in calculating deformations for tunnels and excavations in sand and clay strata. However, research on the appropriate parameter values for silt remains insufficient. In this research, a series of laboratory tests were conducted to determine the parameters for the HSS model for strata typical of Zhengzhou. Subsequently, a three-dimensional finite-element model was established based on the newly constructed Zhengzhou Metro Line eight shield overpass the existing Line two to simulate the case of shield tunnel construction closely passing over an existing tunnel. To verify the applicability and accuracy of the HSS model, the simulation results were compared with actual measurement data. Based on the numerical simulation, a further analysis was conducted on surface settlement, stratified settlement of the strata, and the deformation of the existing tunnel during the construction. The results obtained using the HSS model were compared with the measured values, showing good agreement. This indicates that the HSS model is capable of effectively predicting deformation. The simulation results indicate that during the construction process, the strata first experienced settlement and then uplift. When the shield tail reached the monitoring section, the settlement of each stratum reached its maximum value. As the shield tail passed through the monitoring section, each stratum experienced a noticeable uplift. Additionally, the existing tunnel was primarily uplifted after the shield tail passed beyond it. Notably, the uplifting range and amount were greater at the tunnel’s vault compared to the arch bottom. These findings provide a valuable reference for related shield passage projects in the Zhengzhou area and demonstrate the value of the HSS model parameters.
1 Introduction
With the increasing development of urban underground space and the need for public transportation, the geological conditions faced by underground engineering are becoming increasingly complex. The construction of subway systems is also evolving to meet these challenges, with a growing number of metro shield tunnel crossings being built. In the construction of shield tunnels closely crossing existing tunnels, it is crucial to consider the impact of construction activities on the adjacent existing tunnel. Research has shown that (Yang, 2010) the deformation control of existing metro lines in shield tunnel crossing construction includes settlement control, settlement rate control, uneven settlement control, structural tilt control, and structural torsion control. This indicates that the requirements for deformation control of the existing tunnel structure are highly stringent. Many researchers, such as Cole and Burland (Cole and Burland, 1972), Burland and Hancock (Burland et al., 1983), Mair (Mair, 1993), and Izumi et al. (Izumi et al., 1997), have analyzed extensive engineering data and concluded that the soil around structures is in a small strain state under load,with a typical strain range of –. Atkinson and Sallfors (Arkinsos and Sallfors, 1991) categorized small strain into three ranges: very small strain (less than ), small strain ( ∼), and conventional strain (greater than ), as shown in Supplementary Figure S1. Therefore, it is essential to use a constitutive model that considers the soil’s small strain stiffness properties when analyzing shield tunnel crossing engineering problems with strict deformation control requirements.
For underground engineering in the small strain range, the shear modulus of soil is often greater than that of a soil body under conventional strain and sharply decreases with an increase in strain, exhibiting obvious characteristics such as nonlinearities (Wang et al., 2007; Wang et al., 2011). Therefore, when using constitutive models that do not consider the small strain stiffness properties of soil in a complex urban environment, such as the Mohr–Coulomb model (Zhang, 2012), the Duncan–Chang model (Duncan and Chang, 1970), the Drucker–Prager model (Drucker and Prager, 1952), the modified Cam clay model (Roscoe and Burland, 1968), and the hardening soil (HS) model (Schanz et al., 2019), numerical analysis results are often inconsistent with actual engineering. Some of the key limitations of common past modeling approaches are shown in Table 1. First proposed by Benz, the hardening small strain (HSS) model is based on the HS model, incorporating the modified Hardin–Drnevich shear modulus relationship (Hardin and Drnevich, 1972) and considering the small strain behavior of soil. Compared to the HS model, the HSS model (Benz, 2007; Benz et al., 2009) accounts for soil properties such as shear hardening and compressive hardening under small strains, making it more suitable for analyzing shield tunnel crossing construction and its impact on the surrounding environment, as well as deformation analysis of soil in complex and sensitive environments. The HSS model has been verified by a large number of engineering practices in foundation pit projects (Brinkgreve, 2005; Schweiger et al., 2008; Chu et al., 2010). Although the HSS model exhibits high simulation accuracy, a theoretical basis for its model parameters is lacking. The HSS model has been widely applied in deformation calculations for tunnels and excavations in sand and clay strata. However, silt exhibits unique physical and mechanical properties, characterized by fine particles and a large range of variation in void ratio, which complicates the process of determining appropriate parameter values for the HSS model. Consequently, research on HSS model parameters for silt is relatively limited at present. Additionally, the Yellow River basin in Zhengzhou has a wide distribution of alluvial strata, including silt, silty clay, and other strata, with unique engineering properties such as easy deformation due to moisture absorption and instability when in contact with water. Due to the special engineering characteristics of the strata in Zhengzhou (Liu and Xiao, 2010; Li et al., 2021; Du et al., 2023), the values of HSS model parameters in these typical strata are significantly different from those in other regions, making it difficult to apply results from both domestic and foreign research. Conducting experimental studies on the HSS model parameters of typical silt strata in Zhengzhou is essential for future engineering endeavors.
TABLE 1
| Constitutive model | Model characteristics | Key limitations |
|---|---|---|
| Mohr–Coulomb Model | Assumes a linear relationship between the shear stress experienced by the soil and its deformation | Fails to account for the time-dependence and nonlinearity of soil behavior |
| Modified Cam Clay Model | An improvement over the Mohr–Coulomb model, it incorporates the nonlinear stress–strain behavior of soil | Ineffectively simulates the strain-softening characteristics of clayey soils |
| Hardening Soil Model | Fully considers the dilatancy and hardening characteristics of soil during deformation | Fails to represent the small-strain properties of soil |
Overview of past constitutive models for soil behavior and their limitations.
Currently, there have been many studies on deformation calculations in shield tunnel crossing engineering. Ding et al. (Ding and Yang, 2009) used on-site measured data to analyze the deformation characteristics of a tunnel when Shanghai Metro Line eight passed over existing Line 2. Their findings suggested that the shield tunnel crossing mainly induced uplift deformation in the existing tunnel, with the uplift presenting a quadratic parabolic shape. Moreover, the deformation in the tunnel during the second crossing exhibited a superposition effect. This study offers a reference for deformation studies related to shield tunneling passing over existing tunnels. Soloman et al. (Soliman et al., 1993) conducted finite-element modeling analysis on a double-line tunnel in Germany, focusing on the superposition effect of a double-line tunnel passing under an existing tunnel. Cooper et al. (Cooper et al., 2002), based on monitoring data collected during the construction of two new tunnels passing under existing tunnels at London Heathrow Airport in the UK, provided settlement curves of the existing tunnels at key construction stages. Using the Maliuzhou Traffic Tunnel as a case study, Li et al. (Li et al., 2018) combined numerical simulation with on-site tests and utilized the Mohr–Coulomb model to analyze the additional internal forces and deformation patterns in the existing tunnel caused by the construction of a new tunnel. Their results demonstrated that the deformation of the tunnel haunch on the side closer to the excavated tunnel was more significantly affected by the tunnel excavation than the other side. Moreover, for shallow-buried, large-diameter tunnels, the maximum surface settlement occurs directly above the tunnel vault. However, the study did not fill the gap concerning the impact of shield tunneling overpassing on the deformation of the existing tunnel’s haunch. In their study on the parallel underpass construction of the newly built Hefei Metro Line 5 beneath existing Line 1, Huang et al. (Huang et al., 2020) employed the Mohr–Coulomb model to simulate the dynamic construction process and analyzed changes in settlement and lining internal forces in the existing tunnel caused by shield tunnel construction. Their results showed that significant settlement occurred at the tunnel haunch of the existing tunnel during the parallel underpass process, with larger settlements on both sides of the tunnel haunch. However, the study lacks attention to the vault and the arch bottom. Zeng et al. (Zeng et al., 2023) constructed a series of numerical simulations based on the engineering geological data of the subway Line 18 and Line five tunnels to investigate the adverse effects of the underpass construction on the existing tunnel structure. The study focused on the maximum values of horizontal displacements in the X and Y directions and vertical displacement in the Z direction of the existing tunnel during the construction process, but lacked an analysis of the overall deformation characteristics during construction. Li et al. (Li et al., 2025) employed theoretical calculations, numerical simulations, and on-site measurements to examine the vertical displacement and additional stress changes in the existing tunnel caused by the underpass project between Dongfang Road Station and Suoyuwan Station on Dalian Metro Line 4. The results indicate that the vertical deformation of the existing tunnel is primarily influenced by the vertical settlement of the vault, with the vertical deformation at the vault being less than that at the arch bottom. The study addressed the gap in research regarding the deformation characteristics of the tunnel vault and arch bottom during shield underpass construction, which should also be explored in shield overpass construction. He et al. (He et al., 2023) established a three-dimensional numerical model using the Burger-Creep Visco-Plastic (CVISC) model and combined it with field measurement data to investigate the impact of the pipe-jacking tunneling of the newly built Ningbo Metro Line four on the deformation of the existing Line 3. The research results revealed four stages of deformation in the existing tunnel caused by the jacking process and validated the effectiveness of the CVISC model through comparative analysis. Liu et al. (2025) adopted a theoretical approach to derive the ground movements caused by the construction of a shield tunnel overlapping an existing tunnel from above, utilizing Mirror theory and Mindlin solution. The response of the existing tunnel was subsequently obtained based on the Euler-Bernoulli-Pasternak model. Result shows that the existing tunnel experiences uplift deformation due to the overlapped shield tunneling and when the turning radius of the newly constructed tunnel is less than 30 times the tunnel diameter, the deformation of the existing tunnel becomes significant. The study is limited to shield tunneling overpass projects that overlap with existing tunnels and does not cover cases of shield tunneling overpassing existing tunnels at large angles. Based on the Beijing Daxing International Airport Line, Zhang et al. (2023) combined field measurements with numerical simulations to investigate the deformation and mechanical behavior of an existing tunnel for the construction of a newly built large-span tunnel overpassing an existing tunnel at an extremely short distance. The results indicate that significant deformation occurs in the existing tunnel at the centerline of the newly constructed tunnel, accompanied by torsional deformation. The maximum torsional deformation occurs on both sides of the excavation center, with opposite directions of twist. While many scholars have examined the influence patterns of shield tunnel crossing construction, the focus has primarily been on the underpass of existing tunnels by shield tunneling. In finite-element simulations, models such as the Mohr–Coulomb model are commonly used, with the application of the HSS model being relatively rare. This is mainly because the HSS model involves a greater number of parameters when characterizing the properties of soil, and the process of determining these parameters is more complex, typically requiring extensive experimental data and sophisticated computational procedures.
This study first obtains the parameters for the HSS model of typical silt strata in Zhengzhou through a series of laboratory tests. Based on this, this study summarizes the correlations with the soil mechanical parameters and derives an empirical method for determining the parameter values of the HSS model for silt strata. Then, using the HSS model, a three-dimensional finite-element model is established based on an actual project of the close overpassing of the existing Line two by the shield tunnel between Dongfeng Road Station and Zaozhuang Station in Phase I of Zhengzhou Metro Line eight to simulate the construction of shallow-buried shield tunnels in Zhengzhou’s strata. To verify the rationality of the HSS model in numerical simulations of shield tunnels, the simulation results are compared and analyzed with the actual measured data. Based on this, the deformation patterns of the strata and the existing tunnel are analyzed, providing a reference for the subsequent analysis of deformation effects caused by shield tunneling construction.
2 HSS model and experimental studies on model parameters
2.1 Parameters of the HSS model
The HSS model has a total of 13 parameters (Benz et al., 2009), which can be divided into three categories: strength-related parameters, stiffness-related parameters, and small-strain parameters. There are four strength-related parameters, namely, the effective cohesion , the effective internal friction angle , the dilatancy angle , and the failure ratio . There are seven stiffness-related parameters, namely, the reference stress , the reference tangent modulus , the reference secant modulus , the loading–unloading modulus , the initial static lateral pressure coefficient , the loading–unloading Poisson’s ratio , and the power exponent of stiffness–stress level correlation . There are two small-strain parameters, namely, the initial dynamic shear modulus and the shear strain corresponding to the initial dynamic shear modulus at 70% strain .
Laboratory tests can be used to determine these parameters. can be obtained from the standard consolidation test, , , , and can be obtained from the triaxial consolidated drained test, can be obtained from the triaxial consolidated drained loading–unloading test, can be obtained from the triaxial consolidated test, and and can be obtained from the resonant column test. Empirical values (Wang et al., 2018) can be used for parameters , , , .
2.2 Experimental soil samples
2.2.1 Soil sampling strata
The soil specimens used in the study were undisturbed soil samples taken from the strata at the construction site where the shield tunnel of Line eight in Zhengzhou crossed over the existing Line 2, as well as from the surrounding excavation sites. The sampling depths were 3.6–3.8 m, 8.6–8.8 m, 12.4–12.6 m, and 15.4–15.6 m, corresponding to four typical strata (silty clay①, silt②, silty clay③, and sand④). The distribution of these typical strata at the site is shown in Supplementary Figure S2. The basic physical characteristics of each stratum are presented in Table 2.
TABLE 2
| Stratum | Water content | Unit weight / | Plasticity index |
|---|---|---|---|
| Silty clay① | 10.35 | 17.66 | 12.04 |
| Silt② | 11.27 | 19.82 | 6.64 |
| Silty clay③ | 14.49 | 18.15 | 14.10 |
| Sand④ | 15.20 | 19.62 | 无 |
Basic physical characteristics of soil samples.
2.2.2 Sampling methods
The thin-walled sampler drilling sampling method was used in this study to obtain undisturbed soil specimens. Using specialized soil sampling equipment, drilling and sampling were conducted in typical strata in accordance with the “Technical Code for Geological Exploration and Sampling in Building Engineering” (JGJT 87-2012) (China, 2011). The undisturbed soil specimens were classified as Grade II. To maintain the physical and chemical properties of the undisturbed soil specimens, each sample was immediately placed into a protective sleeve after being drilled out. Next, the sample was sealed to prevent moisture evaporation from affecting the water content of the sample. The preservation method used for the undisturbed soil specimens was wax sealing. During transportation, the specimens were wrapped in anti-vibration bubble wrap to minimize any potential impact on their structural integrity. The undisturbed soil specimens were stored in a constant-temperature and humidity curing chamber.
2.3 Experimental study on HSS model parameters
The experimental methods employed to determine the parameters for the HSS model primarily included the standard consolidation test, triaxial consolidated drained test, consolidation test, triaxial loading–unloading test, and resonant column test, among others.
2.3.1 Standard consolidation test
Conducting standard consolidation tests on soil specimens from different strata can provide the reference tangent modulus for the HSS model .
The standard consolidation test was conducted using the WG series high-pressure consolidation apparatus. Cylindrical soil specimens with a diameter of 61.8 mm and a height of 20 mm were used. The loading sequence was 12.5 kPa, 25 kPa, 50 kPa, 100 kPa, 200 kPa, 300 kPa, 400 kPa, 800 kPa, and 1,600 kPa, with each loading stage lasting for 24 h.
After collecting the one-dimensional consolidation test data, further processing is carried out to plot the relationship between the axial strain (horizontal axis) and the consolidation pressure (vertical axis). A quadratic polynomial is used to fit this data, resulting in a fitted curve. By differentiating this curve, the derivative value corresponding to a consolidation pressure of 100 kPa is determined, which represents the reference tangent modulus of the soil under standard consolidation test conditions. The results are shown in Figure 1.
FIGURE 1

Relationship curves between consolidation pressure and axial strain.
2.3.2 Triaxial consolidated drained test
Triaxial consolidated drained tests can be conducted on soil specimens from different strata to obtain the effective cohesion , effective internal friction angle , failure ratio , and reference secant modulus for the HSS model.
Triaxial consolidated drained tests were performed using a GDS stress-path triaxial testing system. Cylindrical soil specimens with a diameter of 38 mm and height of 76 mm were prepared. Before installation, the undisturbed soil specimens underwent vacuum saturation using a vacuum pump and were held in a vacuum chamber for 12 h. After specimen installation, back-pressure saturation was achieved by applying a confining pressure of 110 kPa and a back pressure of 110 kPa, followed by B-value verification to ensure saturation completeness. Consolidation was conducted under confining pressures of 100 kPa, 200 kPa, and 300 kPa, with a stabilization duration of 36 h for each stage. During the drained shearing phase, an advanced loading test module was employed with a shear rate of 0.0084 mm/min. To ensure sufficient deformation of the soil sample during the testing process, the test was terminated when the specimen reached 16% axial strain .
By processing the test data, Mohr’s circles were plotted for the silty clay (Layer ③) and sand (Layer ④) under different confining pressures, as shown in Figure 2. The analysis of these Mohr’s circles can be used to determine the effective cohesion and the effective internal friction angle .
FIGURE 2

Stress Mohr circles of representative strata in Zhengzhou under different confining pressures: (A) Silty clay ③; (B) Sand ④.
Since the secant modulus under a confining pressure equal to the reference stress is defined as the reference secant modulus, the reference confining pressure is chosen to be equal to the reference stress , which is 100 kPa. The stress–strain relationship curves for typical strata of Zhengzhou at a reference confining pressure of 100 kPa are shown in Figure 3. The peak deviatoric stress at soil specimen failure is considered as the failure deviatoric stress . The slope of the straight line connecting the origin to the 1/2 point on the curve, as shown in the figure, is determined to be the reference secant modulus .
FIGURE 3

Stress–strain curves of representative Zhengzhou soil strata under a confining pressure of 100 kPa: (A) Silty clay ③; (B) Sand ④.
In the HS model (Pramthawee et al., 2011), the relationship between the deviatoric stress q and the axial strain in triaxial tests satisfies Equation 1.
Equation 2 can be derived by transforming Equation 1.
Equations 1, 2 represent the assumed relationships under ideal conditions. In practice, when transforming the relationship into relationship , deviations from the theoretical model are inevitable, particularly at the onset and near the point of failure, where these deviations are more significant. To minimize the influence of human error, data points at 70% and 95% are selected for fitting, resulting in the relationship curve illustrated in Figure 4. The slope of this straight line is , and represents the failure ratio.
FIGURE 4

Relationship curves between and for representative Zhengzhou soil strata.
2.3.3 Triaxial loading–unloading test
Conducting triaxial loading–unloading tests on different strata can help obtain the reference loading–unloading modulus for the HSS model.
The equipment, specimen installation, saturation, B-value testing, and consolidation process in this test are the same as those used in the triaxial consolidated drained test. For the loading–unloading stage, an advanced loading module is used. The modulus obtained from the tests varies with the applied confining pressure. To obtain the reference loading–unloading modulus , the applied confining pressure is set equal to the reference stress , which is 100 kPa. Based on the results of the triaxial consolidated drained test on samples extracted from the same stratum, the expected failure deviatoric stress of the specimen is predicted. To simulate the initial stress state that soil may experience in practical engineering applications and to enable the specimen to achieve a stable stress-strain state at a relatively low stress level The specimen is first loaded to 40% of the predicted failure deviatoric stress and then axially unloaded. Because reloading the specimen to 60% of the predicted failure deviatoric stress is sufficient to form a hysteresis loop with a shape and data quality that meet the requirements for modulus calculation, the specimen is reloaded to 60% of the predicted failure deviatoric stress (Wang et al., 2023) after unloading is complete to ensure the efficiency of the test. This marks the end of the loading and unloading process.
The test data were obtained, and a relationship curve between deviatoric stress and axial deformation was plotted, as shown in Figure 5. During the initial loading stage, the curve steadily rises, with stress increasing as strain increases. Once the stress reaches 40% of the predicted failure value, unloading begins, at which point the axial strain continues to increase slowly. Subsequently, both stress and strain begin to decrease. Upon reloading, the stress–strain curve becomes very steep. Once it reaches the predicted level, the loading curve rises slowly and follows the same trend as the previous unloading until the end of the test. Throughout this process, hysteresis loops can be observed in the curves of all strata. These hysteresis loops indicate that the soil exhibits significant energy dissipation and non-linear behavior under cyclic loading. Specifically, the area enclosed by the hysteresis loops represents the energy dissipated during the unloading and loading cycles. a larger area of the hysteresis loop suggests higher energy dissipation and more pronounced plastic deformation, while a smaller area indicates more elastic behavior. By connecting the upper and lower endpoints of the hysteresis loop with a straight line, the slope of this line represents the reference loading–unloading modulus.
FIGURE 5

Triaxial loading–unloading test results for representative Zhengzhou soil strata: (A) Silty clay ③; (B) Sand ④.
2.3.4 consolidation test
Conducting consolidation tests on different strata can help obtain the initial lateral pressure coefficient for the HSS model.
The equipment, sample installation, back-pressure saturation, and B-value testing process in the consolidation test are the same as those used in the triaxial consolidated drained test. In the consolidation stage, the consolidation module in the CDS Lab Operating System is selected. To accurately simulate the loading conditions encountered in practical engineering, ensure the uniform distribution of pore pressure throughout the testing process, and mitigate the potential interference from the soil’s instantaneous response on the test outcomes, the pressure loading rate set at 0.1 kPa/min. Additionally, the shear strain rate corresponding to 0.1 kPa/min is within the range of 0.1%/min-0.5%/min as stipulated by the “Standard for Geotechnical Testing Method” (GB/T 50,123-2019) (Institute, 2019). To ensure that the soil specimen has sufficient time to fully consolidate under the applied load and thereby guarantee the accuracy of the test results, the test duration was set to 16 h.
The results of the triaxial consolidation tests on the typical strata of silty clay①, silt②, silty clay③, and sand④ in the Zhengzhou area are shown in Figure 6. It is evident that, except for sand, the difference in the coefficient between the other typical strata specimens is not significant. The coefficient of sand is the highest at 0.58, whereas those of silty clay①, silt②, and silty clay③ are 0.51, 0.53, and 0.51, respectively. For sand, the interaction between particles is predominantly governed by frictional forces, with minimal cohesion, and it typically exhibits a relatively low value. However, the experimental results in this study reveal a relatively higher value for sand. This deviation is attributed to the fact that the sand used in the experiment was sampled from a deeper sedimentary layer, where it experienced a higher vertical effective stress. This stress caused the sand particles to be rearranged during the long - term sedimentation process, resulting in a more compact structure. Consequently, the measured value in the experiment was higher than expected.
FIGURE 6

consolidation test results of typical strata in Zhengzhou: (A) Silty clay ①; (B) Silt ②; (C) Silty clay ③; (D) Sand ④.
2.3.5 Resonant column test
Conducting resonant column tests on different strata can help obtain the small-strain parameters of the HSS model, including the initial dynamic shear modulus and the shear strain corresponding to the initial dynamic shear modulus at 70% strain .
The resonant column test was conducted using a GDS resonant column apparatus with cylindrical soil samples that had a diameter of 50 mm and a height of 100 mm. Consolidation was performed at a reference confining pressure of 100 kPa. The test voltages selected were 0.01 V, 0.02 V, 0.04 V, 0.08 V, 0.016 V, 0.032 V, 0.064 V, 0.128 V, and 0.256 V. Torsional excitation was applied in the order of these voltages.
According to the analysis by Hardin et al. (Hardin and Drnevich, 1972), The relationship between shear strain and dynamic shear stress obtained from the resonant column test can be expressed as follows:
The dynamic shear modulus G can be defined as
From Equations 3, 4, 5 can be obtained.
The initial dynamic shear modulus is the dynamic shear modulus when the shear strain approaches 0. At this point, the dynamic shear modulus reaches its maximum value. The initial dynamic shear modulus at a reference confining pressure of 100 kPa is the required small-strain parameter . The other small-strain parameter is the shear strain corresponding to 70% of the initial dynamic shear modulus. Figure 7 shows the attenuation curves of the dynamic shear modulus for silty clay and sand strata under a reference confining pressure of 100 kPa. By analyzing the shear modulus attenuation curves of different typical strata, the small-strain parameters can be determined. The test results of these parameters are shown Figure 7.
FIGURE 7

Resonance column test results for representative Zhengzhou soil strata: (A) Silty clay ③; (B) Sand ④.
3 Establishment of finite-element model
3.1 Engineering background
Zhengzhou Metro Line eight is a subway line currently under construction in Zhengzhou City. The construction method chosen is the shield tunneling method. The shield machine advances continuously within the tunnel, allowing excavation, muck removal, and lining installation to be performed concurrently, thereby achieving a higher construction efficiency. Additionally, the shield tunneling method exerts minimal impact on the surrounding environment during tunneling, making it suitable for urban tunnel excavation. The application of key method during urban shield tunneling construction can mitigate the impact on surface activities. For example, by selecting the type, material, and pressure of grouting, appropriate grouting control techniques (Li and Chen, 2012) can effectively reduce the impact of construction on the ground surface. Additionally, neural networks (Hu et al., 2021) that predict the final settlement based on settlement data from various stages can provide a reference for deformation control during construction. The shield tunnel that connects Dongfeng Road Station to Zaozhuang Station passes over the existing Line two in Phase I of the project. The minimum cover thickness for this overpassing shield tunnel is 4.1 m. The strata include typical silt, fine sand, and silty clay from the Yellow River alluvial deposits in the Zhengzhou area. The specific distribution of soil strata is shown in Supplementary Figure S3A. At the crossing point, the distance between the left and right lines of Line eight is 16.2 m, with a minimum cover thickness of 4.73 m and a minimum clear crossing distance of 1.45 m. The detailed crossing diagram is shown in Supplementary Figure S3B.
In this section, the finite-element software PLAXIS 3D is used to establish a three-dimensional finite-element model for simulating the construction of the shield tunnel passing over Line two between Dongfeng Road Station and Zaozhuang Station in Phase I of Zhengzhou Metro Line 8.
3.2 Model assumptions
To enhance computational efficiency and focus on key aspects of the study, appropriate simplifications were made considering the complex construction conditions. Specifically, the following assumptions were made for the model to be established:
(1) The soil constitutive model follows the HSS model. The model surface is assumed to be flat, and each soil layer is regarded as a continuous, horizontal, and isotropic material.
(2) The lining of shield segments was modeled on a per-ring basis, with the material behavior described by a linear elastic constitutive model.
(3) The initial stress of the model is only attributed to the self-weight of the soil. According to the actual geological conditions, the groundwater level is set at 5 m below ground, which is level with the vault of the newly constructed tunnel. The focus of this study is on the deformation of strata and existing tunnel caused by construction activities. During this process, the consolidation effect of the soil is relatively minor compared to the impact of construction. Therefore, to enhance computational efficiency, the consolidation effect of the soil is not considered.
(4) In actual construction, two shield machines are used to excavate in the same direction in a staggered sequence. However, for this model, excavation is assumed to start with the left line, followed by the right line.
(5) The model assumes that the lining segments are immediately installed following soil excavation.
(6) The slope and curvature of the tunnel are not considered, and the tunnel path is assumed to be a straight horizontal line.
3.3 Model size and boundary conditions
The model includes the left and right lines of Line eight within the range of rings 680–743, as well as the existing left and right lines of Line 2. After the shield tunnel construction reaches ring 743, the shield machine is received at Dongfeng Road Station. To mitigate the uplift of the existing tunnel and strata, and to reduce the impact of Line eight on the existing tunnel, vertical MJS jet grouting piles were used to reinforce the soil in the interlayer between the new and existing tunnels. Additionally, uplift piles and a reinforced concrete slab were used to create an anti-floatation plate for stabilization. Moreover, three-axis mixing piles were implemented for reinforcement at the receiving end. The dimensions of the model are as follows: 84 m (x-direction) × 86 m (y-direction) × 33.28 m (z-direction), where the x-direction represents the tunnel excavation direction and the z-direction is the vertical direction. The Line eight tunnel is buried at a depth of 5 m, with an outer lining diameter of 6.2 m, an inner diameter of 5.5 m, a lining thickness of 0.35 m, and a lining ring width of 1.5 m. The existing Line two tunnel has a left line buried at a depth of 12.64 m and a right line buried at a depth of 12.82 m, with an outer lining diameter of 6 m, an inner diameter of 5.4 m, and a lining thickness of 0.3 m. The numerical model is shown in Supplementary Figure S4.
In terms of the boundary conditions of the model, the existing tunnel and reinforcement are generated in the step before simulating shield tunneling, followed by geo-stress balance. Tectonic stresses are not taken into account, and the initial stress field includes only the self-weight stresses from the soil and reinforcement (). Under the effect of the self-weight, displacements are reset to zero (displacements are sufficiently small). The shield tunnel construction then progresses. Normal constraints are imposed at the front, back, left, and right boundaries. The lower boundary is constrained in the z-direction, while the upper boundary is not constrained, acting as a free boundary. Although only the self-weight stress of the soil is considered, the condition is reflected through these boundary conditions, as the horizontal displacements at the sides and the vertical displacement at the bottom are all restrained. Under the effect of the soil’s self-weight, the lateral pressure and vertical pressure satisfy the k0 relationship.
3.4 Selection of computational parameters
3.4.1 Strata parameters
The soil layers included in the model consist of miscellaneous fill, ②31 clayey silt, ②21 silty clay, ②33 clayey silt, ②22 silty clay, ②41 silty sand, ②51 fine sand, ③37 clayey silt, and ③51 fine sand. Undisturbed soil specimens collected from the strata at the construction site, where the Line eight shield tunnel passes over the existing Line two in the Zhengzhou area, were tested using the methods introduced in Section 2. The parameters of the HSS model for these soil samples are shown in Table 3.
TABLE 3
| Strata | Natural unit weight | Saturated unit weight | Shear strength indices | Secant modulus | Tangent modulus | Resilient modulus | Initial shear modulus | Shear strain | |
|---|---|---|---|---|---|---|---|---|---|
| (kN/m3) | (kN/m3) | (kPa) | (°) | (kPa) | (kPa) | (kPa) | (kPa) | (10−4) | |
| Miscellaneous fill | 17 | 20 | 15 | 15 | 5,000 | 5,000 | 15,000 | 25,000 | 1 |
| ②31 Clayey silt | 18.9 | 19.66 | 12.8 | 23 | 6,500 | 6,500 | 19,500 | 32,500 | 2 |
| ②21 Silty clay | 18.5 | 18.93 | 21.5 | 15 | 4,900 | 4,900 | 14,700 | 24,500 | 4 |
| ②33 Clayey silt | 19.6 | 19.91 | 16 | 25 | 9,000 | 9,000 | 18,000 | 45,000 | 2.1 |
| ②22 Silty clay | 18.2 | 18.27 | 19 | 12 | 4,500 | 4,500 | 13,500 | 22,500 | 2 |
| ②41 Silty sand | 19 | 20 | 3 | 28 | 20,000 | 20,000 | 60,000 | 100,000 | 2.2 |
| ②51 Fine sand | 19 | 20 | 1 | 32 | 25,000 | 25,000 | 75,000 | 125,000 | 2.2 |
| ③37 Clayey silt | 18.5 | 19.89 | 16.5 | 24 | 10,000 | 10,000 | 30,000 | 50,000 | 1.9 |
| ③51 Fine sand | 19 | 20 | 1 | 32 | 25,000 | 25,000 | 75,000 | 125,000 | 2.2 |
Strata parameters.
3.4.2 Structural parameters
The lining segments of both the new tunnel and the existing tunnel are cast with C50 concrete. When performing calculations, the effect of segment joints and assembly on overall stiffness is considered, with a reduction factor of 90% being applied. The main body of the reinforced concrete slab, as well as the main and secondary beams, are cast with C30 concrete. The slab is modeled using solid elements, while the main and secondary beams are modeled using beam elements in PLAXIS 3D. The uplift piles are cast with C35 concrete and are modeled using embedded pile elements in PLAXIS 3D. The physical properties of the structural materials used in the model are listed in Table 4.
TABLE 4
| Material | Unit weight (kN/m3) | Elastic modulus (MPa) | Poisson’s ratio |
|---|---|---|---|
| Lining Segment | 25 | 31,050 | 0.23 |
| Shield | 247 | 200,000 | 0.3 |
| MJS Reinforcement | 22 | 144 | 0.35 |
| Receiving End Reinforcement | 22 | 144 | 0.35 |
| Concrete Slab | 24.5 | 30,000 | 0.15 |
| Beam | 24.5 | 30,000 | None |
| Uplift Pile | 24.5 | 31,500 | None |
Physical parameters of structures.
3.4.3 Element types and number of elements
According to the meshing functions in PLAXIS 3D, the solid elements are 10-node tetrahedral elements, beam elements are 3-node line elements that are compatible with the 3-node edges of the solid elements, and plate elements are 6-node elements. To simulate the interaction between soil and structures, a 12-node element is used for the interface. The embedded pile element can be regarded as a combination of beam elements and embedded interface elements. The model consists of 321,965 mesh elements and 479,186 nodes.
3.4.4 Shield tunneling construction parameters
In engineering, the grouting pressure is approximately 240–280 kPa. In the model, the grouting pressure at the tunnel axis depth is taken as 260 kPa. Considering the specific weight of the grout, an incremental pressure of 20 kPa/m is applied along the depth. The model simulates ground loss caused by construction activities, such as the contraction of the shield machine and the lining segments, with a ground loss rate set at 0.2%. The model simulates the jack pressure by applying a uniformly distributed load in the direction opposite to that of excavation on the lining segments behind the shield tail. For Line 8, the left line is set at 1844 kPa, and the right line is set at 1,266 kPa.
3.5 Construction simulation
The key construction steps involved in the numerical simulation are as follows:
(1) Initial geo-stress balance;
(2) Simultaneous activation of the existing Line 2, the reinforced soil at the ends, the cover slab, and the uplift piles;
(3) Resetting of the displacements, excavation of the left line of the new Line 8, progressive excavation of the soil, activation of the shield shell and construction loads, and activation of the lining segments until the excavation is complete;
(4) Excavation of the right line of the new Line 8, progressive excavation of the soil, activation of the shield shell and construction loads, and activation of the lining segments until the excavation is complete.
(5) To simplify the calculation process, displacements are reset after activating Line two and the reinforcement structures in the simulation, without considering the impacts of the previous construction of Line two and the reinforcement measures on the original strata and the structures themselves.
4 Comparison and analysis of numerical simulation results
A comparative analysis is conducted between the numerical simulation results and measured data to validate the model’s accuracy. Based on this validation, the deformation patterns of the strata and existing tunnels are summarized, providing a foundation for subsequent analysis of the effects of shield tunnel overpassing construction on existing tunnel deformation in Zhengzhou.
4.1 Verification of HSS model
First, the accuracy of the model is verified by comparing the simulated results of surface settlement and the stratified settlement of strata with the measured values.
4.1.1 Verification of surface settlement
By selecting the plane in the y-direction at the intersection of Line 8’s left line axis and Line 2’s left line axis as the monitoring section, Figure 8A illustrates a comparison between the simulated and measured values of this section. The surface at the monitoring section exhibits a bimodal uplift, with the peaks located directly above the axes of the two newly constructed tunnels. The maximum uplift on the surface is observed directly above the axis of the right line of Line 8, with a value of 7.038 mm. Additionally, the uplift above the axis of the left line of Line eight is 5.794 mm. The trend presented by the simulated values and the measured values is generally consistent.
FIGURE 8

The contrast between simulated values and measured values: (A) Simulated and measured values of the monitoring section. (B) Simulated and measured values of the final surface settlement above the intersection of the axis of Line 8’s left tunnel and Line 2’s left tunnel.
4.1.2 Verification of stratified settlement of strata
By selecting the plane in the y-direction at the intersection of Line 8’s left line axis and Line 2’s left line axis as the monitoring section, Figure 8B illustrates the relationship curve between the final vertical deformation and the depth within the strata from the surface to −4 m above Line 8’s axis at the monitoring section, as well as the measured values at the corresponding locations. The figure reveals that the maximum simulated uplift value is 44.11 mm, occurring at the strata at a depth of −4 m, while the minimum uplift value is 5.61 mm, observed at the surface. Above −1.5 m, the uplift among the strata is almost uniform, while below −1.5 m, the uplift increases with depth and follows a generally linear trend. The overall pattern of strata deformation is largely consistent with the measured values.
Based on the comparative analysis above, it can be seen that the simulated values obtained from the finite-element model calculations using the HSS model show a relatively small difference when compared to the actual measured values. The deformation patterns of surface settlement and stratified settlement of the strata obtained through the model are largely consistent with the measured values. These findings suggest that the application of the HSS model in the construction of close-distance overpassing shield tunnels demonstrates both rationality and accuracy.
4.2 Surface settlement characteristics
The Y-direction plane at the intersection of Line 8’s left line axis and Line 2’s left line axis is selected as the monitoring section. Figure 9 shows the curves displaying the simulated and measured surface vertical displacements at the monitoring section as the shield construction progresses. As shown in the figure, before the cutter head approaches within 10 m of the monitoring section, the simulated surface exhibits almost no settlement. However, once the cutter head advances to within 10 m of the section, settlement begins to occur. Both the magnitude and rate of settlement progressively increase as the cutter head moves closer. The maximum settlement of 4.11 mm is observed when the shield tail passes beneath the monitoring point. Subsequently, ground uplift is initiated, with the uplift rate gradually decreasing as the shield advances, ultimately reaching a final uplift magnitude of 3.80 mm. The simulation results demonstrate a general consistency with the measured data in terms of overall trends.
FIGURE 9
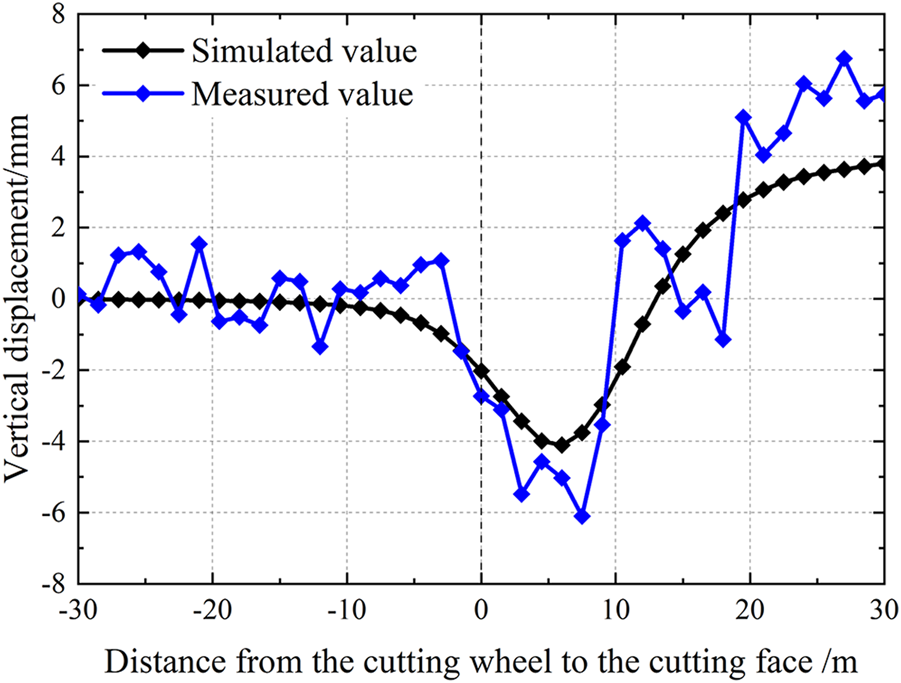
Simulated and measured values of the settlement changes at the measurement points above the axis of Line 8.
4.3 Characteristics of stratified settlement of strata
The Y-direction plane at the intersection of Line 8’s left line axis and Line 2’s left line axis is designated as the monitoring section. Figure 10 presents the final vertical deformation nephograms of the strata after the breakthrough of both the left and right tunnels of Line 8. As illustrated in the figure, the strata show predominant vertical deformation above the newly constructed tunnels, with deformation magnitudes increasing towards the tunnel vault. This phenomenon is primarily attributed to excessive grouting pressure.
FIGURE 10

Nephograms of vertical deformation of the strata: (A) Breakthrough of Line 8’s left line; (B) Breakthrough of Line 8’s right line.
Figure 11 illustrates the simulated values of strata deformations above the Line 8’s left line axis in the monitoring section and the measured values at the corresponding positions. The figure reveals that as the cutting wheel advances to 7.5 m in front of the section, the strata at various depths begin to experience settlement. Notably, the settlements of the surface and the stratum at −1 m are almost identical, while deeper strata below −2 m, the greater the depth, the higher the settlement rate. As the shield cutter head passes through the monitoring section at a distance of 6 m, the strata at various depths reach their maximum settlement values. Specifically, the maximum settlement values for the strata from the surface to a depth of −4 m are 4.11 mm, 4.18 mm, 5.73 mm, 6.83 mm, and 8.25 mm. After the shield tail passes through the monitoring section, the strata at various depths exhibit significant heave. It is observed that the amounts of heave of the surface and the stratum at a −1 m depth are almost identical. For strata below −2 m, the greater the depth, the larger the heave amount and the higher the heave rate. Moreover, after the shield tail passes through the monitoring section, the strata at various depths continue to exhibit heave at a slow rate.
FIGURE 11

Simulated and measured values of surface settlement changes at various depths above the tunnel axis: (A) Simulated values; (B) Measured values.
The initial settlement of the strata is primarily due to the stress release caused by excavation and unloading during shield tunneling. Specifically, the excavation by the shield tunneling removes the soil within the tunnel zone, leading to the release of the stresses originally acting on it. This results in a redistribution of stresses in the overlying strata, a reduction in effective stress, and subsequent compressive deformation of the soil, which manifests as strata settlement. The greater the depth, the more significant the impact of shield tunneling, and consequently, the higher the settlement rate. The significant heave of the strata at various depths after the shield tail passes through the monitoring section can be attributed to excessive grouting pressure. Under the action of grouting pressure, the effective stress within the soil decreases while the pore water pressure increases, resulting in soil heave. The presence of a concrete slab isolates the strata both above and below −1.5 m, resulting in almost identical changes in the strata above the slab. Additionally, the high rigidity of the slab itself effectively reduces the deformation of the strata above the slab. The overall trend of the simulated values generally matches the measured values. However, the heave rate of the strata in the simulation is significantly higher than the measured values. The primary reason for this discrepancy is that in the model, shield advancement is treated as an intermittent process, with grouting pressure being instantaneously applied to the surrounding strata. In reality, however, grouting at the shield tail is a continuous process, leading to progressive heave of the strata throughout the construction.
4.4 Deformation characteristics of existing tunnels
To facilitate the study of the deformation of the existing tunnel during shield tunneling, the construction of Line 8, which passes over the existing tunnel, is divided into 14 different construction conditions. Table 5 illustrates the correspondence between the actual project and the simulated construction conditions. The vertical deformation nephograms of the existing tunnel for the representative construction conditions are shown in Figure 12.
TABLE 5
| Actual number of shield thrust rings | Corresponding model | |
|---|---|---|
| Analysis step | Construction condition | |
| 721th ring of the left line of Line 8 | Step 23 | Condition 1 |
| 726th ring of the left line of Line 8 | Step 28 | Condition 2 |
| 731th ring of the left line of Line 8 | Step 33 | Condition 3 |
| 736th ring of the left line of Line 8 | Step 38 | Condition 4 |
| 741th ring of the left line of Line 8 | Step 43 | Condition 5 |
| Breakthrough of the left line of Line 8 | Step 55 | Condition 6 |
| 718th ring of the right line of Line 8 | Step 74 | Condition 7 |
| 723rd ring of the right line of Line 8 | Step 79 | Condition 8 |
| 728th ring of the right line of Line 8 | Step 84 | Condition 9 |
| 733rd ring of the right line of Line 8 | Step 89 | Condition 10 |
| 738th ring of the right line of Line 8 | Step 94 | Condition 11 |
| Breakthrough of the right line of Line 8 | Step 109 | Condition 12 |
Comparison of actual shield tunneling time and construction conditions.
FIGURE 12

Vertical deformation nephograms of the existing tunnel under representative constructing conditions: (A) Condition 1; (B) Condition 3; (C) Condition 6; (D) Condition 7; (E) Condition 9; (F) Condition 12.
As shown in the nephograms, vertical deformation in the existing tunnel only occurs once the shield tail passes above it. Prior to the shield tail passing, the existing tunnel remains largely unaffected. As the shield machine advances, the peak vertical deformation of the existing tunnel shifts continuously in the direction of the shield tunneling, leading to the maximum deformation occurring on the side of the existing tunnel vault that is biased towards the direction of shield construction. Upon completion of the left line of Line 8, the existing tunnel located directly below the axis of the newly constructed tunnel experiences the greatest uplift. Following the completion of the right line of Line 8, the existing tunnels within the range of the axes of both tunnels of Line eight exhibit significant uplift due to the combined effects of double-line construction.
In construction condition 6, the maximum vertical deformations of the left and right lines of Line two are 2.005 mm and 1.860 mm, respectively. In construction condition 12, the maximum vertical deformations of the left and right lines of Line two are 2.616 mm and 2.417 mm, respectively. Overall, the vertical deformation of the left line of Line two is slightly greater than that of the right line. This is because the right line of Line two is closer to the shield tunneling reception end with end reinforcement measures, and the thickness of the interlayer soil above the right line is slightly greater than that above the left line.
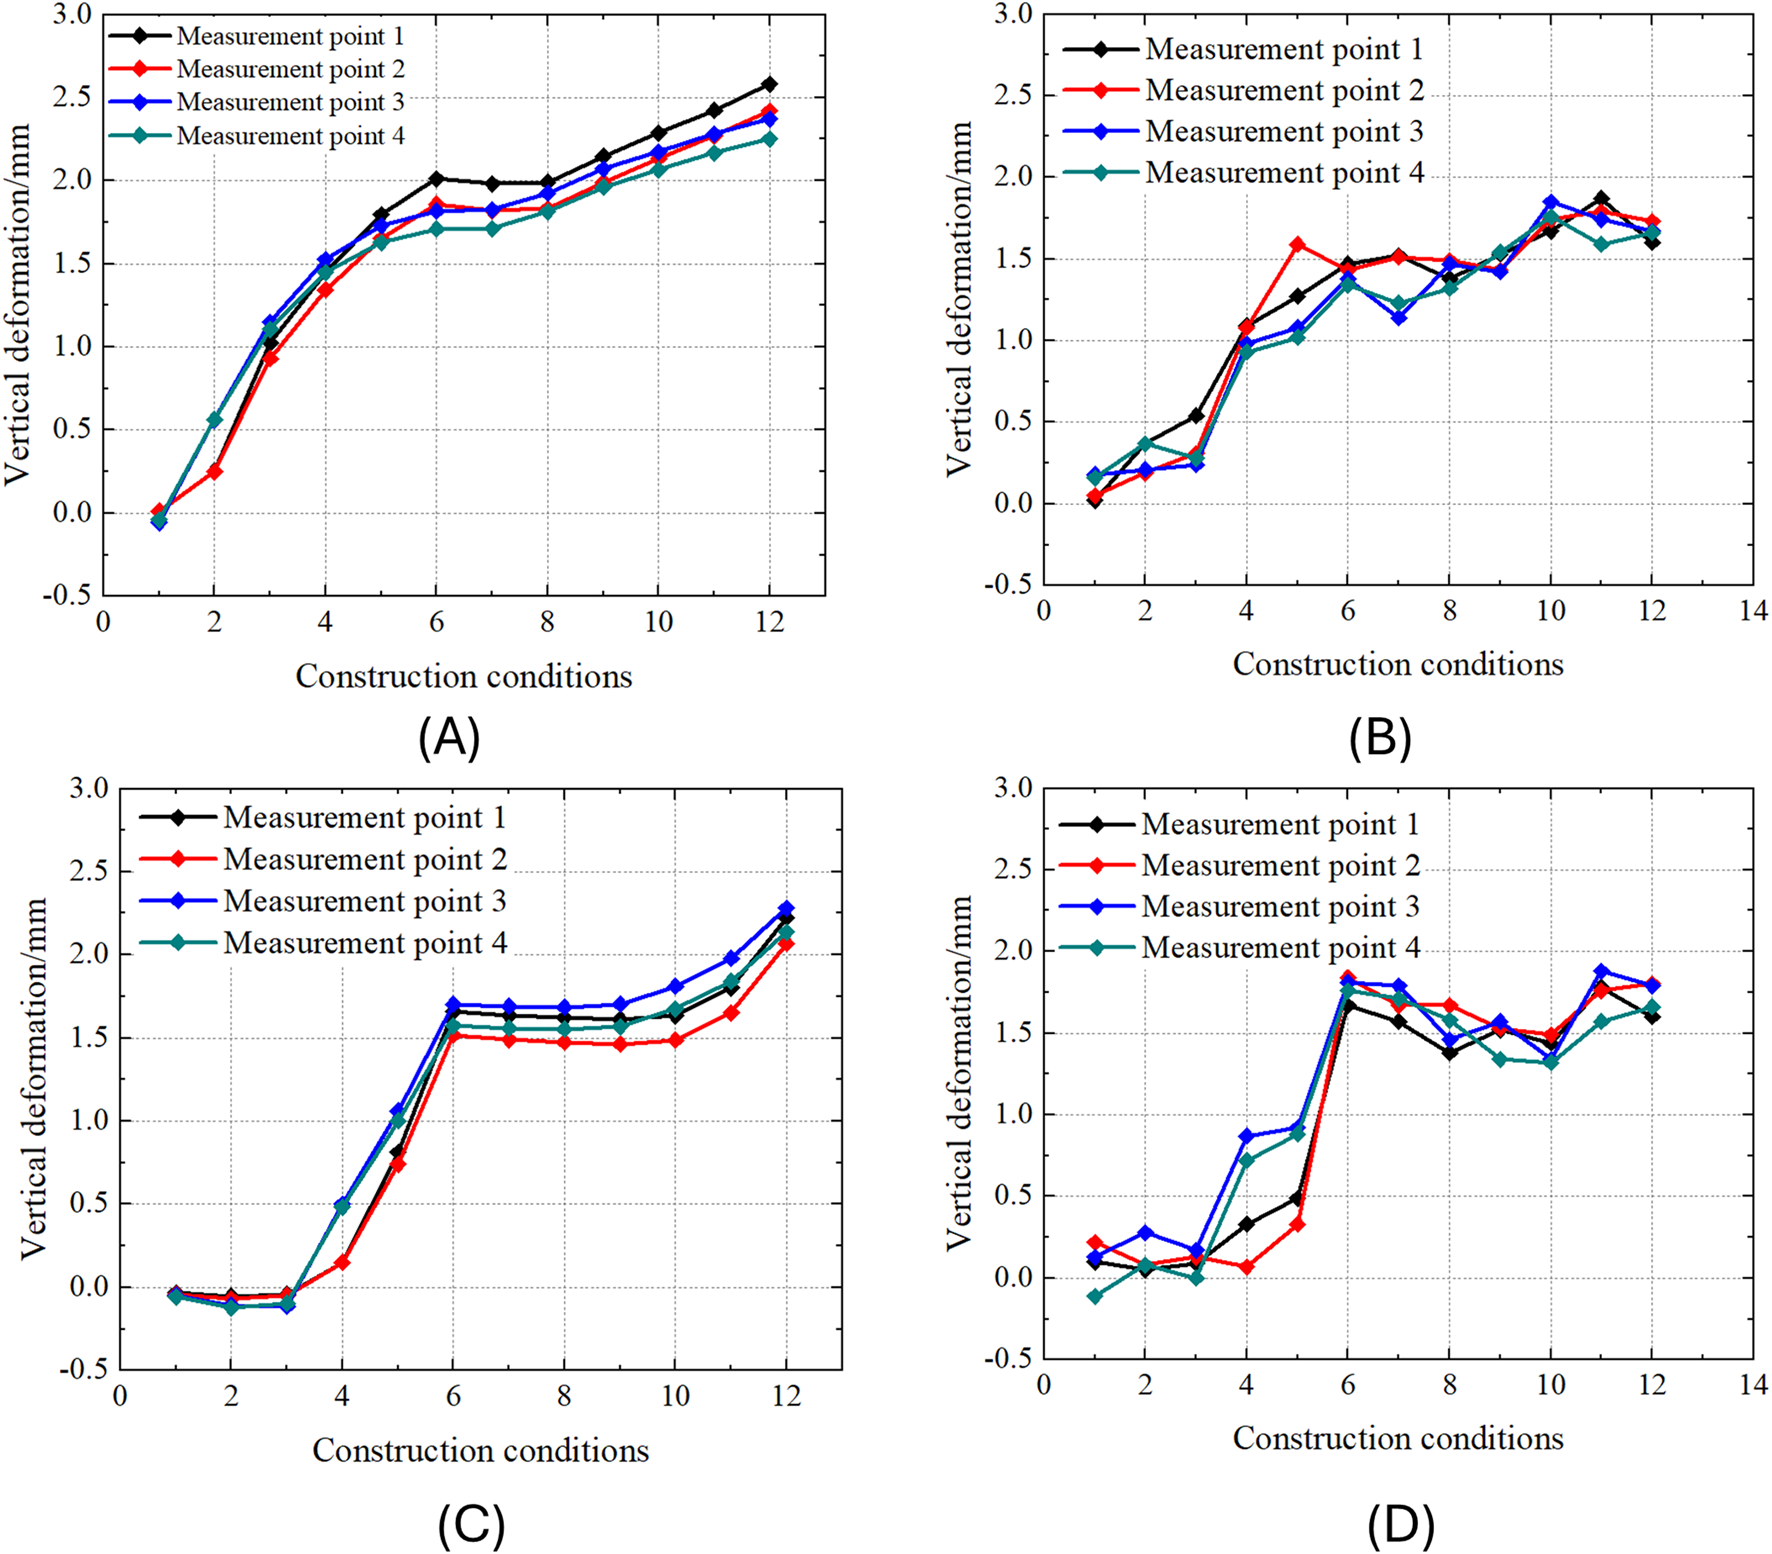
In the finite-element model, monitoring points corresponding to the automated monitoring locations at the construction site were selected. Points along the same straight line in the direction of the Line two tunnel were grouped together, resulting in a total of four groups. The simulated and measured values for the left line of Line two under construction conditions 6 and 12 are shown in Figure 13.
FIGURE 13

Simulation values and measured values of vertical deformation for the left line of Line 2: (A) Simulated values for condition six of the left line of Line 2; (B) Measured values for condition six of the left line of Line 2; (C) Simulated values for condition 12 of the left line of Line 2; (D) Measured values for condition 12 of the left line of Line 2.
As shown in the figure, after the breakthrough of the left line of Line 8, the left line of Line two exhibits a single-peak uplift, with the peak uplift directly below the profile of the left line of Line 8. The simulation results indicate that the maximum uplift occurs at monitoring Section 11, with a value of 1.918 mm. Following the breakthrough of the right line of Line 8, due to the combined effect of the double-line construction, the left line of Line two undergoes a single-peak uplift again. The peak uplift is located directly below the centerline between the axes of the twin tunnels of Line 8. The simulation results indicate that the maximum uplift occurs at monitoring Section 9, with a value of 2.675 mm.
The comparison between the simulation results and the actual measurements reveals that their trends are quite similar. Whether it is the single-line or double-line construction of Line eight passing above, the measured uplift range is slightly smaller than the simulated value. This discrepancy can be attributed to two main factors. On the one hand, numerical simulations are unable to fully replicate the scenarios encountered during actual construction. On the other hand, the actual tunnel exhibits lower stiffness only at the lining joints. However, in the simulation, the existing tunnel segments are initially treated as a monolithic structure, followed by a reduction in stiffness. This approach leads to an overestimation of the uplift range.
Figure 14 shows the simulated and measured values of deformation at monitoring Section 11 on the left and right lines of Line 2 as the construction conditions change. The figure illustrates that the existing tunnel mainly begins to uplift after the shield tail passes over it. Additionally, the construction of the right line of Line eight also causes further uplift in the existing tunnel. Comparing the trends of the simulated and measured values reveals a generally similar pattern. This indicates that the model is both rational and accurate.
FIGURE 14
Simulation values and measured values of the changes in Monitoring Section 11 of Line 2: (A) Simulated values for Section 11 of the left line of Line 2; (B) Measured values for Section 11 of the left line of Line 2; (C) Simulated values for Section 11 of the right line of Line 2; (D) Measured values for Section 11 of the right line of Line 2.
Figure 15 shows the deformation values of the vault and arch bottom of Line two under construction conditions six and 12. As shown in the figure, under the influence of the construction of Line 8, the uplift amount and range of the vault of the existing Line two are both higher compared to those of the arch bottom. Moreover, the uplift deformation of the vault tends to resemble a trapezoidal shape. Specifically, the uplift amount of the existing tunnel’s vault within the axis range of the newly constructed twin tunnels are approximately equal and relatively large, subjecting the corresponding lining to a higher risk of damage. During the shield tunneling process, the originally balanced stress field of the soil is disrupted, leading to deformation and stress redistribution in the soil mass, which in turn induces deformation of the existing tunnel lining. Therefore, in shield tunneling construction where two parallel lines pass above it is necessary to pay attention to reinforcing the vault of the existing tunnel within the axis range of the parallel lines. Appropriate reinforcement methods, such as the use of geogrids (Faleih et al., 2024), can effectively mitigate the risk of structural damage and ensure the stability of the existing tunnel under such deformation profiles.
FIGURE 15

Deformation diagram of the vault and arch bottom of Line 2: (A) Condition six of the left line of Line 2; (B) Condition 12 of the left line of Line 2; (C) Condition six of the right line of Line 2; (D) Condition 12 of the right line of Line 2.
5 Conclusion
In this study, the strata typical of the Zhengzhou area were selected as the focus of research. A series of laboratory tests were conducted to determine the parameters of the HSS model for these typical strata. The study specifically investigated the construction of the Zhengzhou Metro Line eight overpass over the existing Line 2. The applicability of the HSS model was verified through a comparison of finite-element numerical simulations and on-site monitoring results. The deformation effects of shield tunneling on the strata and existing tunnels were investigated, and the following conclusions were drawn:
(1) Laboratory tests on typical strata of Zhengzhou included standard consolidation tests to obtain the reference tangent modulus , triaxial consolidated drained tests under different confining pressures to determine the effective cohesion , effective internal friction angle , and reference secant modulus, triaxial loading–unloading tests to obtain the loading–unloading modulus , consolidation tests to determine the initial static lateral pressure coefficient , and resonant column tests to obtain the small-strain parameters and . These were used to establish the HSS model parameters for typical strata of Zhengzhou.
(2) Finite-element modeling and simulation calculations were performed using the parameters obtained from the soil specimens at the location where Line eight overpasses the existing Line 2. The simulation results for the settlement characteristics of the strata and the deformation characteristics in the existing tunnel were consistent with the measured data, demonstrating the rationality and accuracy of the finite-element model. Therefore, this model can be used to guide actual engineering projects and conduct parametric studies.
(3) During shield tunneling, the strata first experience settlement followed by uplift. The maximum settlement occurs when the shield tail reaches the monitoring section. After the shield tail passes the monitoring section, the strata exhibit a significant uplift. Moreover, as the depth increases, the impact of shield tunneling becomes more pronounced, resulting in greater magnitudes of both settlement and uplift.
(4) Shield tunneling in overpass construction induces uplift in existing tunnels, which predominantly occurs after the shield tail passes beyond the existing tunnels. Following the completion of both tunnel lines, a significant uplift occurs in the existing tunnel within the axis range of the newly constructed twin tunnels. The heave range and amount are greater in the vault compared to the arch bottom. Moreover, the final deformation of the vault resembles a trapezoidal shape. Therefore, it is necessary to pay attention to reinforcing the vault of the existing tunnel during construction.
This study provides a scientific basis for the construction of the Zhengzhou Metro Line eight overpass the existing Line two and verifies the applicability and accuracy of the HSS model in actual engineering projects, offering important references for similar tunnel construction projects.
Statements
Data availability statement
The raw data supporting the conclusions of this article will be made available by the authors, without undue reservation.
Author contributions
JP: Conceptualization, Writing – original draft. YX: Project administration, Writing – review and editing. JZ: Visualization, Writing – original draft. ZD: Data curation, Writing – original draft. YZ: Methodology, Writing – original draft.
Funding
The author(s) declare that financial support was received for the research and/or publication of this article. The study is financially supported by the National Natural Science Foundation of China (Grant Nos. U22A20598 and 51908513), Key Research & Development and Promotion Project of Henan Province (Grant No. 242102321025 and 241111322500).
Conflict of interest
Authors JP and YX were employed by Zhengzhou Metro Group Co., Ltd. Author YZ was employed by Shanghai Urban Construction Municipal Engineering (Group) Co., Ltd.
The remaining authors declare that the research was conducted in the absence of any commercial or financial relationships that could be construed as a potential conflict of interest.
Generative AI statement
The author(s) declare that no Generative AI was used in the creation of this manuscript.
Publisher’s note
All claims expressed in this article are solely those of the authors and do not necessarily represent those of their affiliated organizations, or those of the publisher, the editors and the reviewers. Any product that may be evaluated in this article, or claim that may be made by its manufacturer, is not guaranteed or endorsed by the publisher.
Supplementary material
The Supplementary Material for this article can be found online at: https://www.frontiersin.org/articles/10.3389/feart.2025.1598049/full#supplementary-material
SUPPLEMENTARY FIGURE S1Strain–stiffness characteristics of soil within different strain ranges.
SUPPLEMENTARY FIGURE S2Typical strata distribution at the soil sampling site.
SUPPLEMENTARY FIGURE S3Soil strata distribution of shield tunneling overpassing section.
SUPPLEMENTARY FIGURE S4Schematic diagram of shield tunneling with shallow cover overpassing the existing Line 2.
SUPPLEMENTARY FIGURE S5Finite-element model.
References
1
ArkinsosJ.SallforsG. (1991). Experimental determination of soil properties. Proc. 10th ECSMFE3, 915–956.
2
BenzT. (2007). Small-strain stiffness of soils and its numerical consequences. Stuttgart, Germany: Univ. Stuttgart, Inst. f. Geotechnik Stuttgart.
3
BenzT.VermeerP.SchwabR. (2009). A small‐strain overlay model. Int. J. Numer. Anal. methods geomechanics33, 25–44. 10.1002/nag.701
4
BrinkgreveR. B. (2005). Selection of soil models and parameters for geotechnical engineering application. Soil Const. models Eval. Sel. calibration, 69–98. 10.1061/40771(169)4
5
BurlandJ.HancockR.MayJ. (1983). A case history of a foundation problem on soft chalk. Geotechnique33, 385–395. 10.1680/geot.1983.33.4.385
6
ChinaM. O. H. a.U.-R. D. O. T. P. S. R. O. (2011). Technical specification for engineering geological prospecting and sampling of constructions. Beijing: China Architecture and Building Press.
7
ChuF.LiY.LiangF.LiY. (2010). Numerical analysis of deformation of deep excavation adjacent to metro considering small-strain stiffness of soil. Chin. J. Rock Mech. Eng.29, 3184–3192.
8
ColeK.BurlandJ. B. (1972). “Observation of retaining wall movements associated with a large excavation,” in Fifth eur conf on soil proc/sp/.
9
CooperM.ChapmanD.RogersC.ChanA. (2002). Movements in the piccadilly line tunnels due to the Heathrow express construction. Géotechnique52, 243–257. 10.1680/geot.2002.52.4.243
10
DingC.YangX. (2009). Influence analysis on shield tunnel up-crossing nearby built tunnel. Constr. Technol.38, 48–50.
11
DruckerD. C.PragerW. (1952). Soil mechanics and plastic analysis or limit design. Q. Appl. Math.10, 157–165. 10.1090/qam/48291
12
DuZ.ZhangZ.WangL.ZhangJ.LiY. (2023). Effect of moisture content on the permanent strain of Yellow River alluvial silt under long-term cyclic loading. Sustainability15, 13155. 10.3390/su151713155
13
DuncanJ. M.ChangC.-Y. (1970). Nonlinear analysis of stress and strain in soils. J. soil Mech. Found. Div.96, 1629–1653. 10.1061/jsfeaq.0001458
14
FaleihZ. H.Al-GharbawiA. S.BaqirH. H. (2024). The behavior of the tunnel reinforced with geogrid in soft soil under the effect of axial load. Civ. Eng. J.10, 2471–2484. 10.28991/cej-2024-010-08-04
15
HardinB. O.DrnevichV. P. (1972). Shear modulus and damping in soils: design equations and curves. J. Soil Mech. Found. Div.98, 667–692. 10.1061/jsfeaq.0001760
16
HeH.WangS.ShenW.ZhangW. (2023). The influence of pipe-jacking tunneling on deformation of existing tunnels in soft soils and the effectiveness of protection measures. Transp. Geotech.42, 101061. 10.1016/j.trgeo.2023.101061
17
HuM.ZhangB.LuM. (2021). “Application of BP neural network in prediction of ground settlement in shield tunneling,” in 2021 IEEE/ACIS 19th international Conference on Computer and information science (ICIS): ieee, 29–35.
18
HuangZ.ZhangC.FuH.DengH.MaS.FuJ. (2020). Numerical study on the disturbance effect of short‐distance parallel shield tunnelling undercrossing existing tunnels. Adv. Civ. Eng.2020, 8810658. 10.1155/2020/8810658
19
InstituteH. a.W. R. P. a.D. G. I. N. H. R. (2019). Standard for geotechnical testing method. Beijing, China: Ministry of Housing and Urban-Rural Development of the People's Republic of China; State Administration for Market Regulation.
20
IzumiK.OgiharaM.KameyaH. (1997). Displacements of bridge foundations on sedimentary soft rock: a case study on small-strain stiffness. Géotechnique47, 619–632. 10.1680/geot.1997.47.3.619
21
LiJ.FangX.YangY. (2025). Analysis of the impact of the new two-lane shield tunnel underpass on the existing tunnels. Appl. Sci.15, 2642. 10.3390/app15052642
22
LiM.LiY.IslamM. R. (2021). Effects of water content and interface roughness on the shear strength of silt–cement mortar interface. Soils Found.61, 1615–1629. 10.1016/j.sandf.2021.08.011
23
LiX.ChenX. (2012). Using grouting of shield tunneling to reduce settlements of overlying tunnels: case study in shenzhen metro construction. J. Constr. Eng. Manag.138, 574–584. 10.1061/(asce)co.1943-7862.0000455
24
LiZ.LiuD.WangM.XiaoS.YuanJ. (2018). “Influence of short distance super-large diameter shield tunneling on existing tunnels in sea areas,” in IOP conference series: earth and environmental science (Bristol,IOP Publishing). 012008.
25
LiuJ.XiaoJ. (2010). Experimental study on the stability of railroad silt subgrade with increasing train speed. J. Geotechnical Geoenvironmental Eng.136, 833–841. 10.1061/(asce)gt.1943-5606.0000282
26
LiuY.LeiH.ShiL.ZhengG.WangM. (2025). Deformation analysis of ground and existing tunnel induced by overlapped curved shield tunneling. J. Rock Mech. Geotechnical Eng.17, 795–809. 10.1016/j.jrmge.2024.05.050
27
MairR. (1993). “Developments in geotechnical engineering research: application to tunnels and deep excavations,” in Proc. Instn. Civ. Engrs. Civ. Engng, 27–41.
28
PramthaweeP.JongpradistP.KongkitkulW. (2011). Evaluation of hardening soil model on numerical simulation of behaviors of high rockfill dams. Songklanakarin J. Sci. and Technol.33.
29
RoscoeK. H.BurlandJ. B. (1968). On the generalized stress-strain behaviour of wet clay.
30
SchanzT.VermeerP. A.BonnierP. G. (2019). “The hardening soil model: formulation and verification,” in Beyond 2000 in computational geotechnics (Abingdon: Routledge), 281–296.
31
SchweigerH.ScharingerF.LüfteneggerR. (2008). “3D finite element analysis of a deep excavation and comparison with in situ measurements,” in Geotechnical aspects of underground construction in soft ground (Boca Raton, FL: CRC Press), 209–216.
32
SolimanE.DuddeckH.AhrensH. (1993). Two-and three-dimensional analysis of closely spaced double-tube tunnels. Tunn. Undergr. Space Technol.8, 13–18. 10.1016/0886-7798(93)90130-n
33
WangH.XuM.SongE. (2011). A small strain constitutive model based on hardening soil model. Rock Soil Mech.32, 39–43. 10.16285/j.rsm.2011.01.027
34
WangT.DengT.DengY.YuX.ZouP.DengZ. (2023). Numerical simulation of deep excavation considering strain-dependent behavior of soil: a case study of Tangluo Street Station of Nanjing Metro. Int. J. Civ. Eng.21, 541–550. 10.1007/s40999-022-00755-8
35
WangY.KongL.WangY.LiX. (2018). “Analysis of influence of shield tunneling on overlying underground pipelines based on HSS model,” in IOP conference series: materials science and engineering (Bristol: IOP Publishing).012017
36
WangZ.WangH.QiK. (2007). Summary and evaluation of experimental investigation on small strain of soil. ROCK SOIL MECHANICS-WUHAN-28, 1518. 10.16285/j.rsm.2007.07.044
37
YangG. (2010). Study on the permissible value and technique for deformation controlling of underground construction crossing existing metro line. (dissertation). Beijing Jiaotong University.
38
ZengL.ZhangD.LianC.ZhangJ.YinH. (2023). Study on the influence of an under-crossing parallel double-line shield tunnel on the existing tunnel structure. Mathematics11, 3125. 10.3390/math11143125
39
ZhangX. (2012). Behavior of narrow-deep excavation in soft clay ground. (dissertation). Zhejiang University.
40
ZhangY.TaoL.LiuJ.ZhaoX.GuoF.TanL.et al (2023). Construction techniques and mechanical behavior of newly-built large-span tunnel ultra-short distance up-crossing the existing shield tunnel with oblique angle. Tunn. Undergr. Space Technol.138, 105162. 10.1016/j.tust.2023.105162
Summary
Keywords
HSS model, tunnel engineering, surface settlement, existing tunnel, shield overpassing, numerical calculation
Citation
Pi J, Xu Y, Zhang J, Du Z and Zeng Y (2025) Experimental determination of HSS model parameters for typical Zhengzhou strata and their application in shield tunnel construction. Front. Earth Sci. 13:1598049. doi: 10.3389/feart.2025.1598049
Received
22 March 2025
Accepted
05 June 2025
Published
02 July 2025
Volume
13 - 2025
Edited by
Mohammed Y. Fattah, University of Technology, Iraq
Reviewed by
Mohammed Hamood, University of Technology, Iraq
Ahmed Al-Gharbawi, University of Technology, Iraq
Updates
Copyright
© 2025 Pi, Xu, Zhang, Du and Zeng.
This is an open-access article distributed under the terms of the Creative Commons Attribution License (CC BY). The use, distribution or reproduction in other forums is permitted, provided the original author(s) and the copyright owner(s) are credited and that the original publication in this journal is cited, in accordance with accepted academic practice. No use, distribution or reproduction is permitted which does not comply with these terms.
*Correspondence: Jingyao Zhang, 2398716498@qq.com
Disclaimer
All claims expressed in this article are solely those of the authors and do not necessarily represent those of their affiliated organizations, or those of the publisher, the editors and the reviewers. Any product that may be evaluated in this article or claim that may be made by its manufacturer is not guaranteed or endorsed by the publisher.