- 1Jiangsu Earthquake Electromagnetic Research Center, Jiangsu Earthquake Agency, Nanjing, China
- 2Department of Geophysical Network, China Earthquake Network Center, Beijing, China
- 3College of Earth Exploration Science and Technology, Jilin University, Changchun, China
- 4Beijing HiMag Technology Co., Ltd., Beijing, China
Magnetic data boundary detection is a key technology in potential field data processing, providing an effective basis for the division of geological units and fault structures. It holds significant importance in geological structure analysis and mineral exploration. Deep learning methods, which can automatically capture complex magnetic anomaly features, have been widely applied in boundary detection. However, convolution-based neural networks are limited by the local receptive field of the convolution paradigm, making it difficult to effectively establish long-range dependencies. This poses a challenge for high-precision magnetic data boundary detection. Additionally, traditional loss functions fail to guide the network in effectively extracting boundary information, limiting the accuracy of boundary detection. To address these issues, this paper proposes a magnetic data boundary detection method based on a self-attention mechanism. This method fully leverages the self-attention mechanism in Transformers to effectively extract global features, allowing the model to focus on key regions within the input data, thereby enhancing its ability to recognize complex boundaries. Meanwhile, an edge-enhanced loss function is introduced to further strengthen the model’s ability to extract boundary information. Synthetic experiments demonstrate that the proposed method achieves higher prediction accuracy and more precise boundary localization. Furthermore, validation using magnetic anomaly observation data from the Yushishan area in Gansu, China, confirms the reliability of the boundary detection results.
1 Introduction
Magnetic surveys have long been integral to mineral exploration, geological mapping, and engineering, valued for their straightforward measurement and interpretative processes, making them indispensable in geophysical applications. Delineating the horizontal boundaries of anomalous bodies is a prevalent problem in potential field interpretation. Over the past century, researchers have proposed various potential field boundary detection methods, primarily relying on the calculation of horizontal and vertical derivatives of the anomaly field and their combinations. Among the widely applied approaches are directional derivatives, total horizontal gradient (THG), analytic signal and its derived filters, as well as tilt angle (TILT) methods (Cordell and Grauch, 1985; Miller and Singh, 1994). Directional derivatives highlight regions of abrupt potential field changes, indicating shallow structural boundaries; THG, the magnitude of the horizontal gradient, also focuses on identifying gradient maxima (Nabighian, 1972; Nabighian, 1974; Nabighian, 1984; Rumelhart et al., 1986; Commer, 2011; Fedi and Florio, 2001). However, when the source is deeply buried and the signal attenuates, these methods often result in blurred or difficult-to-identify boundaries. To address this, the TILT method, defined as the ratio of the vertical derivative to the total horizontal derivative, was introduced as a balanced filter. It has been shown to produce distinct boundary responses over near-vertical contacts after reduction to the pole. The analytic signal method has also been extended to both 2D and 3D potential field interpretations, with its core principle based on the Hilbert transform relationship between horizontal and vertical derivatives. In recent years, several improvement strategies have been proposed, including the integration of multi-source geophysical data and the introduction of more efficient boundary extraction algorithms, aimed at enhancing the accuracy and stability of structural identification (Salem and Al-Dosari, 2022; Essa et al., 2022; Salem et al., 2008; Essa and Diab, 2024). Nonetheless, these traditional boundary detection methods mainly depend on partial derivative operations, making them susceptible to noise and potentially leading to false anomalies. Moreover, for complex and deep-seated geological bodies, these methods still exhibit significant localization errors. Therefore, a more effective approach is needed to overcome these challenges.
Deep learning (DL), as an emerging technology, has been widely applied across various fields (Zhang et al., 2022; Li et al., 2022; Tejaswini et al., 2024; Liu et al., 2024; Shen et al., 2025a; He et al., 2025; Shen et al., 2025b), including geophysics. Wang et al. (2020) utilized a convolutional neural network (CNN) to interpret gravity data by treating contour maps as unknown images to identify gravity anomaly sources, achieving promising results. Huang et al. (2021) employed a U-Net neural network for 3D gravity sparse inversion, transforming gravity inversion into an imbalanced segmentation problem and obtaining reliable results. Naprstek and Smith (2022) applied CNNs to interpret linear structures in aeromagnetic survey data, enabling depth estimation of edge positions, though this method is limited to linear feature anomalies. Zhang and Yu (2022) proposed a potential field boundary detection method based on DL and an improved U-Net, capable of identifying both linear and prismatic geological boundaries. Zhou et al. (2024) used a UNet++ network for magnetic anomaly boundary detection, achieving more effective feature extraction through dense skip connections. Although these CNN-based networks have yielded good predictive performance, their reliance on convolutional operations with a limited receptive field means they can only capture local information in the anomaly data while neglecting global context and long-range dependencies. In magnetic data boundary detection, the magnetic fields generated by magnetized bodies at different depths and spatial distributions exhibit multi-scale superposition characteristics. If the long-range magnetic perturbations of local anomaly sources are not sufficiently represented, it becomes difficult to model the global correlations in the magnetic field data, leading to boundary shifts or blurring. Furthermore, traditional loss functions fail to guide the network to focus on the boundary features of underground magnetic anomalies, limiting its performance in magnetic data boundary detection and resulting in inaccurate boundary predictions.
The Transformer (TF), with its powerful global modeling capabilities, has expanded from the field of computer vision to geophysical applications. Jiang et al. (2023) developed a feature extraction framework centered on TF, preserving the temporal characteristics of the original signal while using cross-channel attention mechanisms to model the first-arrival waveform correlations of adjacent detectors, significantly improving spatial consistency in first-arrival picking. In data reconstruction, Gao et al. (2024) designed a TF architecture incorporating residual learning, leveraging multi-head self-attention to separate noise from valid signal components, achieving simultaneous seismic trace interpolation and random noise suppression. In inversion problems, Zhu et al. (2025) innovatively introduced TF into seismic impedance inversion, using its global context modeling capability to reveal the macroscopic distribution of underground medium parameters, effectively enhancing inversion stability in complex structural regions. While TF methods have been widely adopted in seismic applications, their use in magnetic data boundary detection remains unexplored.
To address these challenges, this paper proposes a magnetic data boundary detection method based on a self-attention mechanism. By fully leveraging self-attention, the proposed method captures global information and establishes long-range dependencies by considering the relationships among all elements in the magnetic anomaly sequence. This allows the network to reweight features across the entire dataset, focusing on key anomalous regions. Simultaneously, the model takes advantage of convolutional operations for local feature extraction, effectively modeling the detailed boundary information of underground sources. Additionally, an edge-enhanced loss function is introduced to further strengthen boundary feature extraction, enabling the network to learn both boundary and deep structural features in a targeted manner, ultimately producing more accurate boundary predictions.
Comparative results with classical deep learning and traditional methods demonstrate that the proposed approach, through the combination of self-attention mechanisms and edge-enhanced loss, significantly reduces boundary detection errors and improves resolution. Finally, the proposed method was successfully applied to the magnetic anomaly observation data from the Yushishan area in Gansu, China, achieving effective boundary predictions.
2 Methodology
2.1 Boundary detection problem
For computational convenience, assume that remanent magnetization does not exist and that all magnetization is purely vertical. In this case, the magnetic forward modeling problem can be expressed as Equation 1 (Green, 1996):
here,
here,
Unlike the aforementioned methods, DL methods adopt a supervised learning strategy, training neural networks with large amounts of
where
2.2 Network architecture
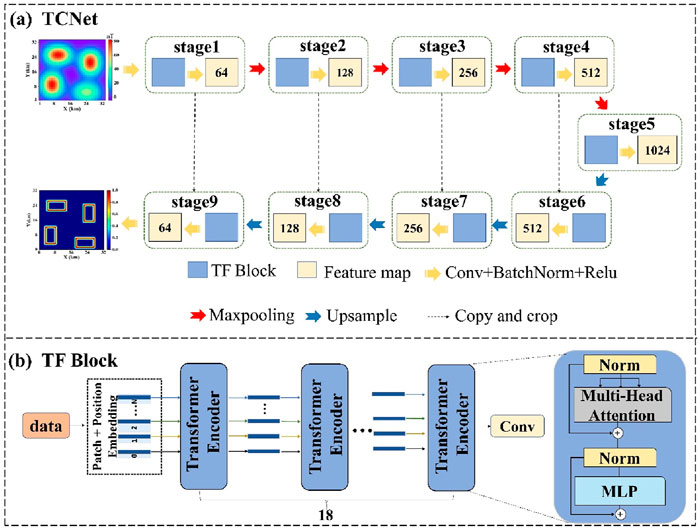
The network architecture proposed in this paper (TCNet) is shown in Figure 1a. Assuming the magnetic anomaly data
here i represents the index of each magnetic anomaly point in the t-th token, and d refers to the dimension of the
here, all the q, k, and v form the matrices Q, K, and V, respectively. All the
here,
here,
here,
The cascaded design of self-attention and convolution in TCNet enables the model to leverage the Transformer for modeling the complex non-local interactions between source bodies, allowing the network to focus on the most relevant magnetic anomaly areas, thereby improving boundary identification accuracy when processing large-scale geological structures. At the same time, the convolutional layers facilitate local detail extraction, enabling the network to better reconstruct subtle boundaries when handling locally complex structures.
2.3 Loss function
During the network training process, the parameters are continuously updated through backpropagation to solve the optimization problem shown in Equation 9.
where L represents the loss function, N is the number of samples in the training set, and
As can be seen from the above equation, the MSE tends to smooth the prediction results to reduce the overall loss, which may lead to inaccurate boundary reconstruction by the model. To address this issue, this paper introduces an edge-enhancing loss function that explicitly constrains the differences between the predicted values of boundary pixels and their neighboring background pixels, thereby improving the model’s sensitivity to boundary structures and enhancing the clarity of the network’s boundary predictions. formula is as Equation 11:
here,
α is the weighting coefficient, which needs to be determined through multiple experiments. For the optimal selection of α, this paper empirically tested nine values (0.01, 0.02, 0.03, 0.04, 0.05, 0.06, 0.08, 0.1, and 0.3) by training the network with each α. After extensive experimentation, it was found that the network’s boundary prediction results were best when α = 0.03.
2.4 Dataset creation and network training
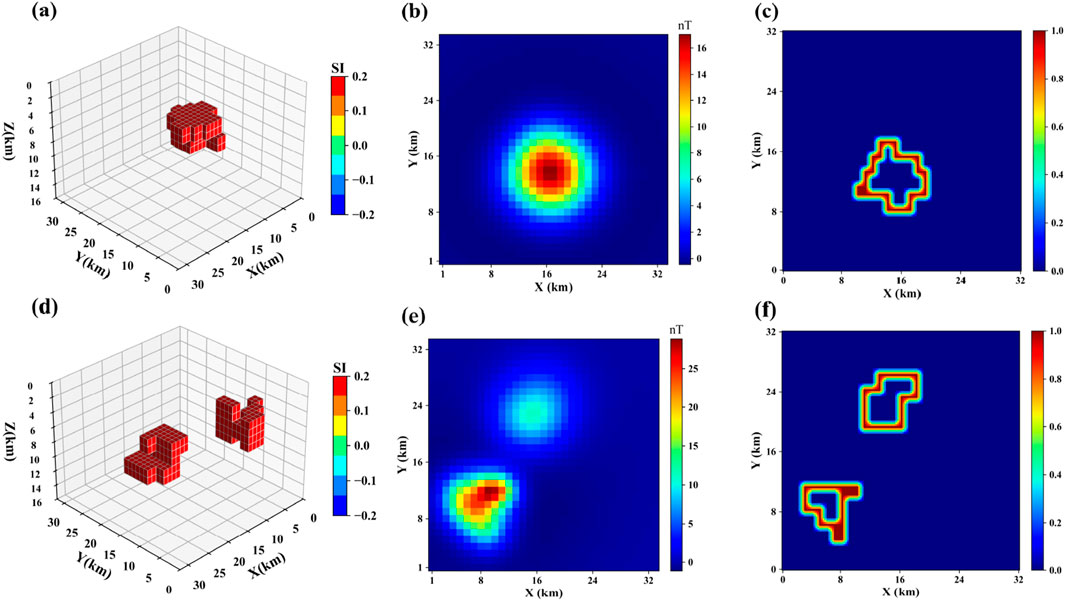
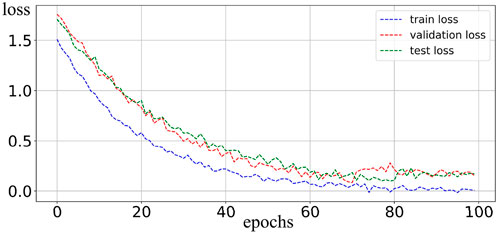
In this paper, the underground space is divided into 32 × 32 × 16 cubes, with each cube sized 1.00 × 1.00 × 1.00 km. A heterogeneous dataset containing 30,000 samples is constructed using a random walk method and forward modeling, as shown in Figure 2. The model’s magnetization is set to 0.2 SI, and the background field is set to 0. The random walk method first divides the 3D space into a four-quadrant symmetrical structure. Starting points are randomly selected in each quadrant, and their movement is controlled to take s steps (where s∈[40,70]) in a random direction, dynamically generating irregular 3D geological models. This results in a highly random dataset that can approximate any underground source, forming the basis for training a well-optimized network. All models are set with a uniform magnetization of 0.2 SI and background field interference is eliminated. A regular dataset, which does not exist in the 2,000 training sets, is created as the test set and input into the network at a ratio of 14:1:1. During the network training phase, mini-batch gradient descent (batchsize = 32) combined with the Adam optimizer is used. The initial learning rate is set 2 × 10⁻⁴, with a dynamic decay mechanism implemented using a step decay strategy, where the learning rate is multiplied by 0.8 every 15 epochs. To prevent overfitting, a Dropout regularization layer with a probability of 0.2 is introduced, and the parameter space convergence is achieved after 100 training epochs. The loss function during the network training process is shown in Figure 3. The PC is configured with a 1 × 3.90 GHz Intel Xeon W-2245 processor, a 1 × 8 GB NVIDIA Quadro RTX 4000 GPU, and 192 GB of memory. The complete training of the network takes approximately 70 min.
3 Synthetic examples
3.1 Evaluation metrics
Considering that this study focuses on deep learning-based underground anomaly boundary detection, the Intersection over Union (IOU) metric is used to more intuitively measure the overall accuracy of boundary region localization. As shown as Equation 13:
The intersection ratio helps us intuitively assess the quality of the boundary prediction results. Additionally, to further assess the pixel-wise differences between the model’s predicted maps and the ground truth label maps, this paper introduces Mean Squared Error (MSE) as an auxiliary evaluation metric. Its calculation formula is as Equation 14:
This paper compares the boundary detection results of the proposed method, Swin-Transformer, U-net, THG, and TILT, which are presented in the following sections.
3.2 Test model 1
Model 1 consists of four horizontal prismatic bodies with a magnetization of 0.2 SI, all buried at a depth of 5 km. As shown in Figure 4a, the resulting magnetic anomaly is shown in Figure 4b, and its boundary in the horizontal projection plane is displayed in Figure 4c. Figures 4d–h show the boundary detection results for each method. It can be observed that the boundaries predicted by the deep learning methods are more focused and better reflect the true boundary positions compared to traditional methods. Moreover, the proposed method performs better than the Swin-Transformer and U-Net method, with boundaries that are clearer and more closely aligned with the true model boundaries. The IOU values and MSE errors are shown in Table 1.
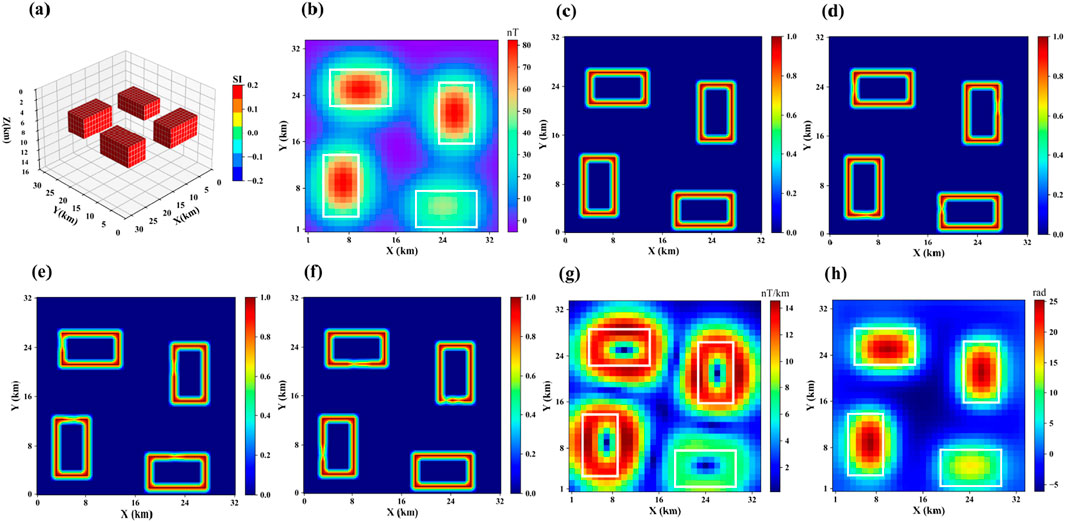
Figure 4. (a) represents Model 1, (b) shows the corresponding magnetic anomaly, (c) is the boundary of (a,d) is the boundary detection results of the proposed method, (e) is the boundary detection results of Swin-Transformer, (f) is the boundary detection results of U-Net, (g) is the boundary detection results of THG, (h) is the boundary detection results of TILT.
3.3 Test model 2
Model 2 consists of two step-like models of the same size and depth, but with different horizontal positions, as shown in Figure 5a. The magnetic anomaly it produces is shown in Figure 5b. Its projection in the horizontal plane is shown in Figure 5c. Figures 6d–h show the boundary detection results for three methods. From the results, it can be seen that traditional methods still fail to intuitively display the boundary positions of the anomalous bodies. The Swin-Transformer method performs well in extracting the overall shape of stepped anomaly boundaries, particularly excelling in maintaining boundary continuity. However, since its feature extraction process focuses more on global structure modeling and lacks a mechanism for enhancing local fine-grained edge features, some boundary regions exhibit a certain degree of blurriness. The U-Net method accurately locates the boundary of the step-like anomalous bodies at shallow depths, but for deeper regions, the boundary detection results show discontinuity and false anomalies. The proposed method provides more continuous and clearer boundary detection results, with higher identification accuracy.
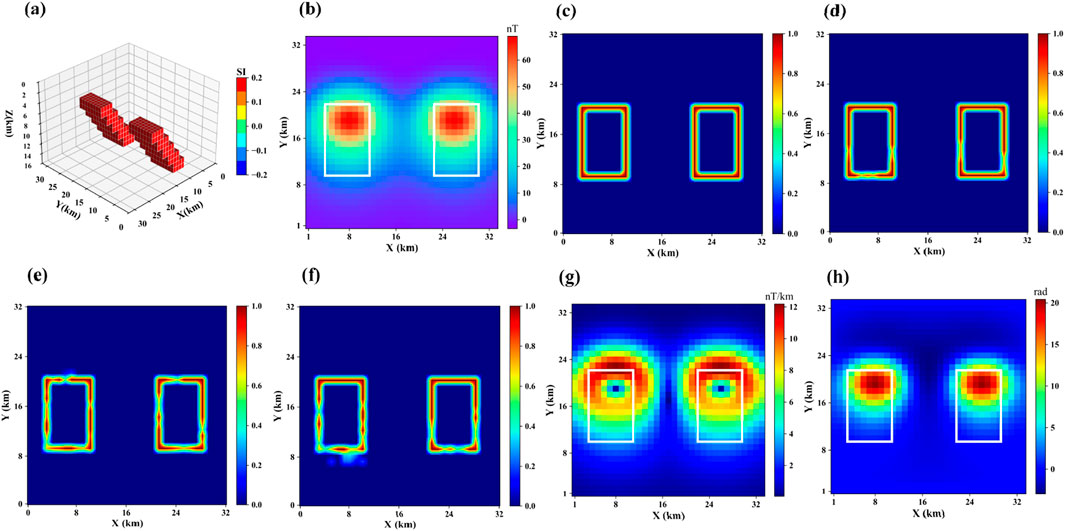
Figure 5. (a) represents Model 2, (b) shows the corresponding magnetic anomaly, (c) is the boundary of (a,d) is the boundary detection results of the proposed method, (e) is the boundary detection results of Swin-Transformer, (f) is the boundary detection results of U-Net, (g) is the boundary detection results of THG, (h) is the boundary detection results of TILT.
3.4 Test model 3
Model 3 consists of two prisms of different sizes and depths but with the same horizontal center position, as shown in Figure 6a. The magnetic anomaly it produces is shown in Figure 6b. Its projection in the horizontal plane is shown in Figure 6c. Figures 5d–h show the boundary detection results for three methods. From the figures, it is clear that traditional boundary detection methods still diverge and cannot accurately locate the specific boundary positions. In this model, the Swin-Transformer demonstrates strong capability in modeling the overall shape of large-scale anomaly boundaries, with good boundary continuity. However, it shows signs of boundary blurring in small-scale anomaly regions, indicating a limited ability to capture features in local, small areas. The U-Net boundary detection results are clearer, with better performance in detecting the edges of shallow anomalous bodies, but the detection results for deeper anomalous bodies are worse. The possible reason is that the network extracts less global information and fails to effectively model the complex relationships between large-area anomalies. The proposed method achieves the best detection accuracy, especially in accurately characterizing the horizontal boundaries of large, deep anomalies.
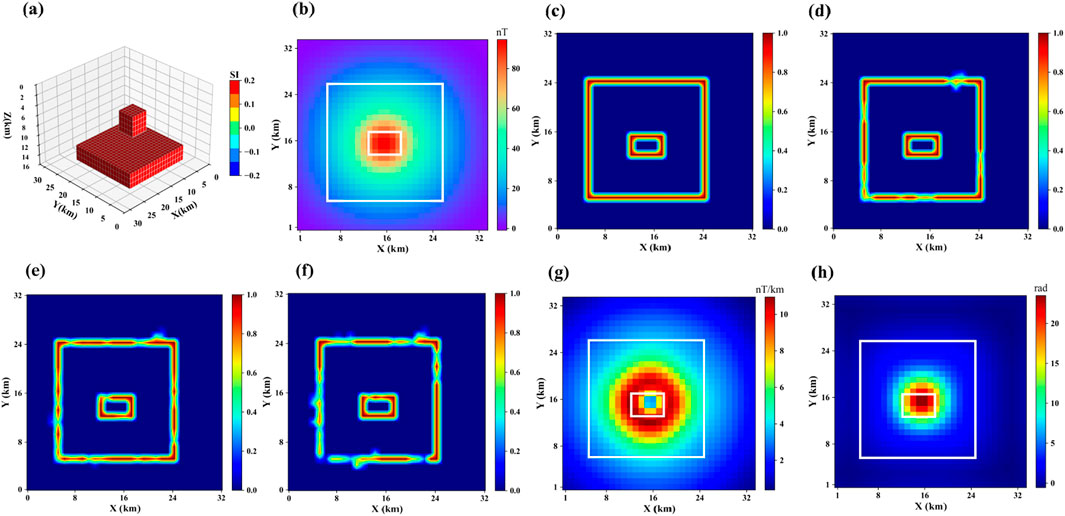
Figure 6. (a) represents Model 3, (b) shows the corresponding magnetic anomaly, (c) is the boundary of (a,d) is the boundary detection results of the proposed method, (e) is the boundary detection results of Swin-Transformer, (f) is the boundary detection results of U-Net, (g) is the boundary detection results of THG, (h) is the boundary detection results of TILT.
3.5 Noise robustness test
To evaluate the robustness of the proposed method, 5% Gaussian white noise was added to the test model, with a signal-to-noise ratio (SNR) of approximately 22 dB. To better illustrate the impact of noise on traditional methods, we also compared with the Theat method. Figure 7 shows the magnetic anomaly and boundary detection results of the test model with added random noise. From the figure, it can be seen that the boundary detection results of the proposed method still match the true boundaries well and maintain high accuracy, indicating strong noise resistance. In contrast, the boundary detection results of traditional methods are more blurred, demonstrating their sensitivity to noise.
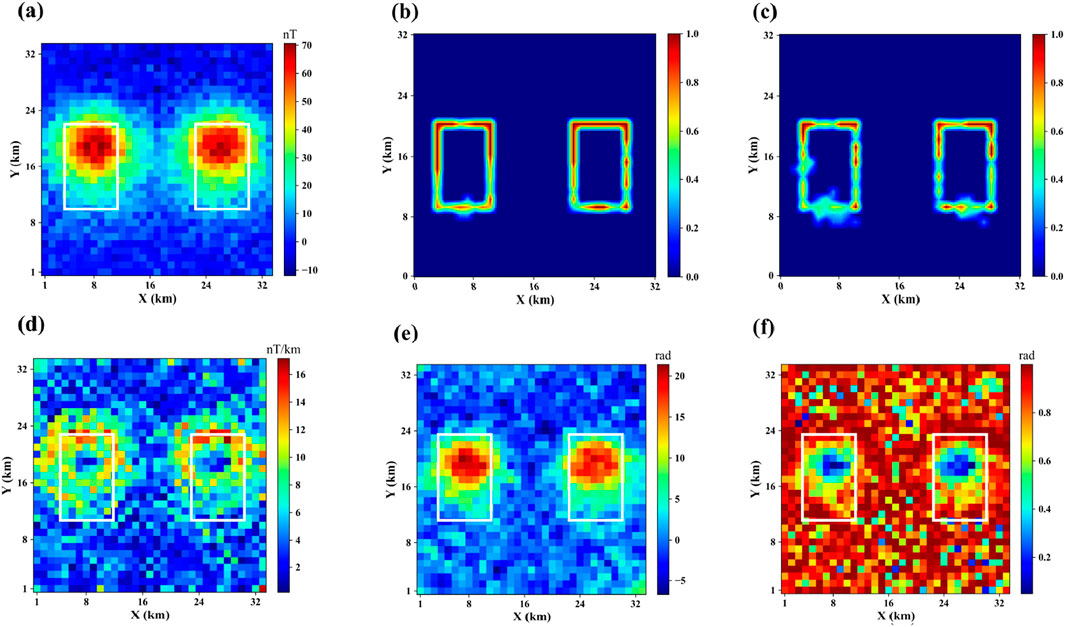
Figure 7. Boundary Detection Results after Adding 5% Noise. (a) Magnetic anomalies after adding noise. (b–f) are the boundary detection results using the method proposed in this paper, UNet, THG, TILT, and Theta, respectively.
3.6 Ablation experiment
To further demonstrate the role of each component of the proposed method, we performed boundary identification on the above models using TCNet constrained by L_MSE and the composite loss function L_total proposed in this paper, and evaluated the results using IOU. The results are shown in Table 2. It can be seen that L_total achieves higher boundary detection accuracy on all three models, indicating that it can guide the network to more effectively extract the boundary features of underground anomalies, thereby improving the boundary detection accuracy.
4 Application to field data
4.1 Geological environment of the study area
The Yushishan area is located in the northwestern part of China, in Akesai County, Gansu Province. It is situated at the confluence of the Altyn Mountains fault, the Qilian orogenic belt, and the Quanjie block, on the northern edge of the Qaidam Basin (Yu et al., 2015; Liu et al., 2007; Zhang et al., 2015; Wu et al., 2001; Xu et al., 2006), as shown in Figure 8. This region is an important structural window for understanding the tectonic evolution of northeastern Tibet and southern Tibet (Wang et al., 2018; Jiang et al., 2020). The area has undergone multi-stage tectonic, magmatic, and metamorphic processes, forming unique rock assemblages and metallogenic systems (Jiang et al., 2022). Tectonically, Yushishan is located in the western part of the Central Qilian block, with the Altyn northern block to the north, the Quanjie block to the south, the Hongliugou-Lapazhen mixed rock belt to the west, and the Central-Southern Qilian arc-basin system to the east (Yu et al., 2012; Jia et al., 2016; Yang et al., 2014). It preserves a complex geological record from the breakup of the Rodinia supercontinent in the late Neoproterozoic to the subduction and collision of the Paleo-Tethys Ocean in the Early Paleozoic (Xu et al., 1999). The left-lateral Altyn Fault, as a major transverse structure, dominates the regional tectonic pattern, facilitates the displacement of crustal blocks, and promotes the ascent of deep magmas/fluids, significantly affecting the mineralization channels (Wu et al., 2001).
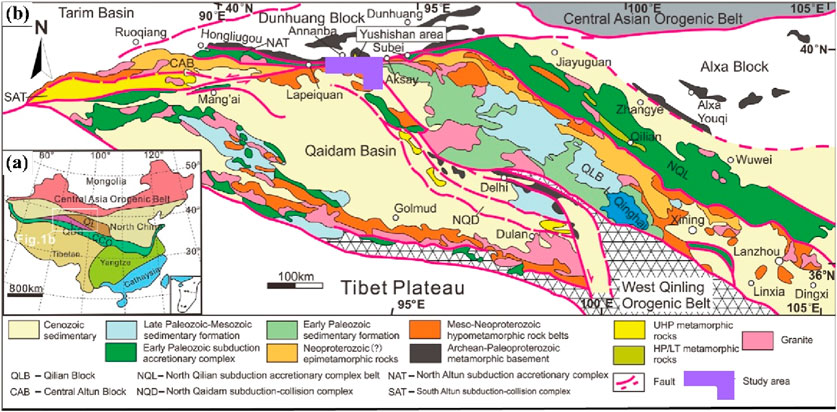
Figure 8. (a) Tectonic framework of China. (b) Geological map of the Qilian Block (The purple box is the research area, revise from Yu et al., 2015).
The regional basement is composed of the Paleoproterozoic Daken Daban Formation (Pt1D), primarily consisting of amphibolite facies metamorphic rocks, including gneiss, amphibolite, and marble. The overlying strata, previously attributed to the Mesoproterozoic Aoyougou Formation (Cha), have now been redefined as the Neoproterozoic Yushishan Formation (Pt3ys), based on zircon U-Pb ages ranging from 790 to 843 Ma (Yang et al., 2012; Liu et al., 2022). This revision resolves a long-standing stratigraphic dispute and clarifies that the Yushishan Formation is composed of interlayered light rocks, marble, and amphibolite, with distinct layered features. It contrasts sharply with the shallow marine clastic-volcanic sedimentary sequence of the regional Duoruoer Formation (Zhou et al., 2022).
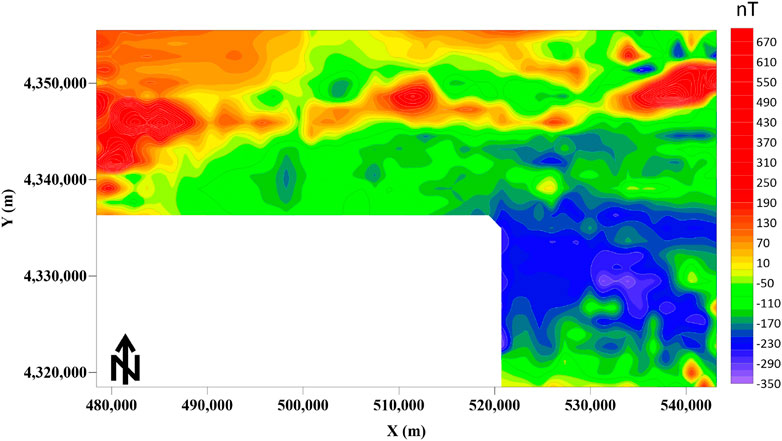
4.2 Boundary detection results analysis for the study area
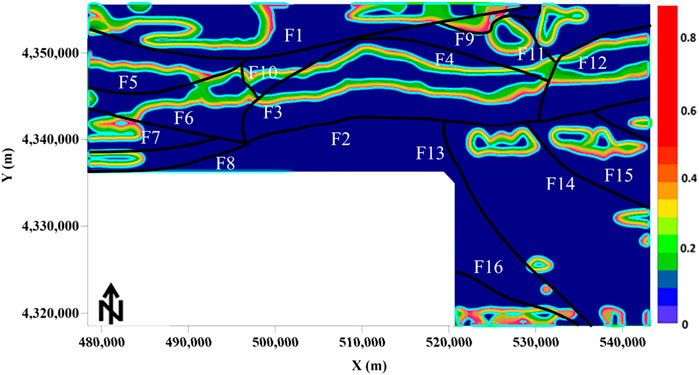
The total area of the study region is 1,590 square kilometers. The survey was conducted at a 1:50,000 scale following standard measurement procedures. The magnetic anomaly data is shown in Figure 9. To meet the input requirements of the network, the data dimensions were transformed to 32 × 32 using mean padding and interpolation. The processed data were then fed into the network trained on the dataset established in Section 2.4. After prediction, the output was cropped to match the size of the study area, as shown in Figure 10a. Figure 10b presents the boundary prediction results using TILT. It can be seen that the boundaries obtained using the proposed method are clearer than those produced by traditional methods and can reflect boundary details of some complex geological structures. The method clearly divides the study area into three regions (Regions I, II, and III, shown in Figure 10a). Region I corresponds to a narrow high-magnetic anomaly zone, displaying an elongated, bead-like or strip-like distribution with good continuity. The two boundary faults in this region correlate well with the known east-west major faults (F1 and F2 in Figure 11). Region II corresponds to the northern RTP anomaly. The western section shows a moderate high-magnetic anomaly, attributed to weakly magnetic Quaternary sediments and the limestone/marble of the Annanba Formation in the western Jixi region. The stable high-value anomaly here may originate from the strata in the Jixi region. The eastern section presents a narrow high-magnetic belt trending northeast, with discontinuous bead-like anomalies along the rock contact zone. The exposure of the Annanba Formation in the Jixi region and the intrusion of diorite/monocrystalline granite from the Permian suggest that these anomalies are related to the intrusion. Region III is located in the southern part of the study area, showing large-scale negative anomalies containing two anomaly groups. The high-value anomalies are speculated to originate from intrusions within the Paleoproterozoic Daken Daban Formation. Furthermore, the proposed method successfully identified two major faults (F1 and F2) and multiple minor faults (F3–F20 in Figure 11), showing strong spatial consistency. To further validate the effectiveness of the proposed method in boundary identification under real geological conditions, the IOU metric introduced in Section 3.1 was used to perform spatial overlap analysis between the model’s predictions and existing geological structure data (sourced from the 1:50,000 geological map and Yu et al., 2015). The results show an IOU of 0.85, indicating that the proposed method demonstrates good spatial alignment with known geological boundary locations. Combining the geological data, high-magnetic anomalies and their gradient areas, as well as faults and host rock alterations (potassic, sodic, and sericitic), provide a basis for delineating potential ore targets.
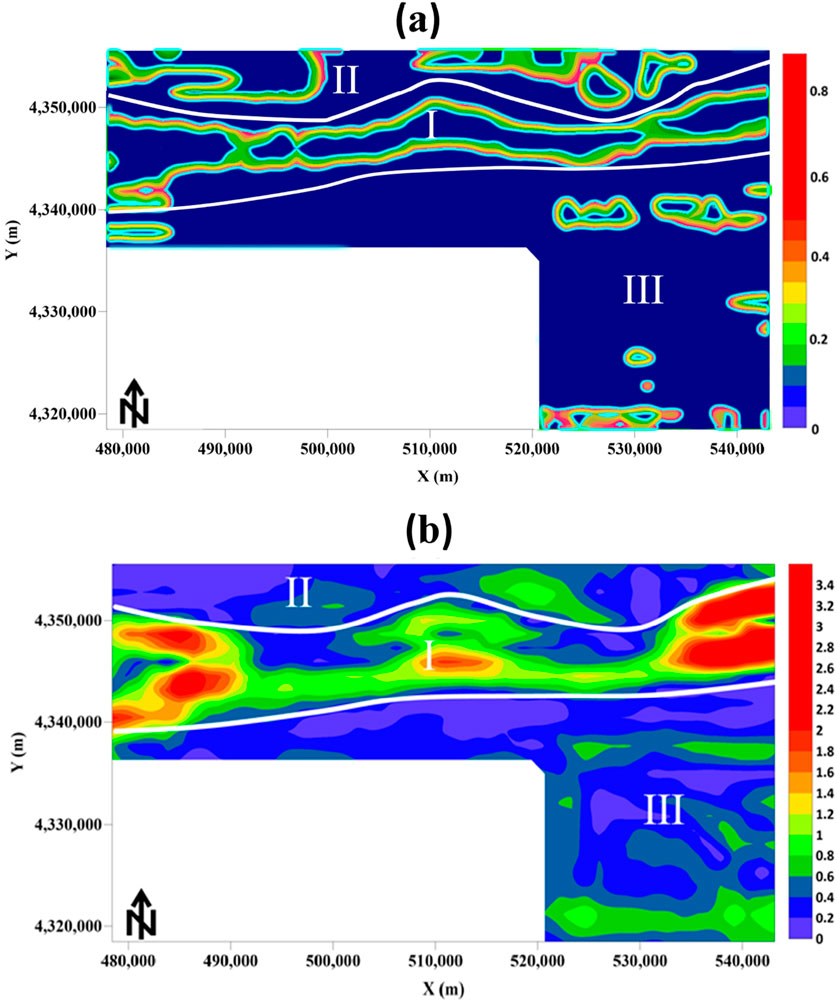
Figure 10. (a) Boundary result map obtained using the method proposed in this paper. (b) Boundary result map obtained using the TILT method.
5 Conclusion
In this study, we propose an innovative self-attention-based network architecture for magnetic data boundary detection. The network introduces the self-attention mechanism to better model the complex global relationships between underground sources, while also fully leveraging the convolutional layers’ ability to extract local information to better identify local boundary features, thereby improving the resolution of the boundary detection results. Additionally, an edge-enhanced loss function is introduced in the loss function to enhance boundary information, forming a composite loss function that couples boundary contrast information and anomaly deviation constraints. This guides the network to more effectively extract boundary information and deep features, generating boundary results that are more consistent with the real situation. During the testing phase, the proposed method was verified to have stable noise robustness, and comparisons were made with the most commonly used deep learning methods and traditional methods. The results show that the proposed method has the highest boundary intersection ratio, particularly in handling complex large-area and deep geological structures, demonstrating higher resolution and better boundary fitting. Finally, the method was applied to boundary detection of real data from the Yushishan area, successfully identifying two major faults and multiple minor faults, providing a basis for delineating potential ore target areas.
Data availability statement
The original contributions presented in the study are included in the article/supplementary material, further inquiries can be directed to the corresponding author.
Author contributions
JH: Writing – original draft. WL: Data curation, Writing – original draft. YJ: Writing – original draft, Investigation. LG: Writing – review and editing. XZ: Formal Analysis, Writing – original draft. JJ: Writing – original draft, Formal Analysis. ZL: Funding acquisition, Writing – original draft. DB: Resources, Writing – original draft.
Funding
The author(s) declare that financial support was received for the research and/or publication of this article. The Spark Program of Earthquake Technology of CEA (Nos. XH24018C, XH23016YB, XH24052B).
Acknowledgments
I would like to thank the reviewers for their professional suggestions and constructive comments.
Conflict of interest
Author ZL was employed by Beijing HiMag Technology Co., Ltd.
The remaining authors declare that the research was conducted in the absence of any commercial or financial relationships that could be construed as a potential conflict of interest.
Generative AI statement
The author(s) declare that no Generative AI was used in the creation of this manuscript.
Publisher’s note
All claims expressed in this article are solely those of the authors and do not necessarily represent those of their affiliated organizations, or those of the publisher, the editors and the reviewers. Any product that may be evaluated in this article, or claim that may be made by its manufacturer, is not guaranteed or endorsed by the publisher.
References
Commer, M. (2011). Threedimensional gravity modelling and focusing inversion using rectangular meshes. Geophys. Prospect. 59 (5), 966–979. doi:10.1111/j.1365-2478.2011.00969.x
Cordell, L., and Grauch, V. J. S. (1985). Mapping basement magnetization zones from aeromagnetic data in the San Juan Basin, New Mexico[M]//The utility of regional gravity and magnetic anomaly maps. Tulsa, Oklahoma, United States: Society of Exploration Geophysicists, 181–197.
Essa, K. S., and Diab, Z. E. (2024). Exploring Fault plane geometry through metaheuristic bat algorithm (MBA) analysis of potential field data: environmental and engineering applications. Rock Mech. Rock Eng. 58, 1039–1070. doi:10.1007/s00603-024-04198-6
Essa, K. S., Munschy, M., Youssef, M. A. S., and Khalaf, E. E. D. A. H. (2022). Aeromagnetic and radiometric data interpretation to delineate the structural elements and probable precambrian mineralization zones: a case study, Egypt. Min. Metallurgy and Explor. 39 (6), 2461–2475. doi:10.1007/s42461-022-00675-0
Essa, K. S., Youssef, M. A. S., and Khalaf, E. E. D. A. H. (2022). Aeromagnetic and radiometric data interpretation to delineate the structural elements and probable precambrian mineralization zones: a case study, Egypt. Min. Metallurgy and Explor. 39 (6), 2461–2475. doi:10.1007/s42461-022-00675-0
Fedi, M., and Florio, G. (2001). Detection of potential fields source boundaries by enhanced horizontal derivative method. Geophys. Prospect. 49 (1), 40–58. doi:10.1046/j.1365-2478.2001.00235.x
Gao, L., Shen, H., and Fan, M. (2024). Swin Transformer for simultaneous denoising and interpolation of seismic data. Comput. Geosciences, 105510. doi:10.1016/j.cageo.2023.105510
Green, R. (1996). Potential theory in gravity and magnetic applications. J. Appl. Geophys. 36 (2–3), 155–156. doi:10.1016/s0926-9851(96)00039-0
He, Z., Liu, J., Wang, Q., Shen, X., and Jiang, L. (2025). A novel anomaly detection method for magnetic flux leakage signals via a feature-based unsupervised detection network. Comput. Industry 164, 104190. doi:10.1016/j.compind.2024.104190
Huang, R., Liu, S., Qi, R., and Zhang, Y. (2021). Deep learning 3D sparse inversion of gravity data. J. Geophys. Res. Solid Earth 126 (11). doi:10.1029/2021jb022476
Jia, Z. L., Dou, X. Y., Wang, J. R., Zhang, D., and Hou, R. N. (2016). Protolith reconstruction of leptynite in Yushishan area, South Qilian, Gansu. Gansu Geol. 25 (2), 9–14.
Jiang, P., Deng, F., and Xing, Y. (2023). A microseismic first break picking method based on Swin Transformer feature extraction Progress in Geophysics, 1132–1142.
Jiang, S. Y., Liu, T., Zhang, H. X., Cao, S. Y., Zheng, R. H., Li, T. G., Yu, J. P., and Wu, Y. B. (2022). A new type of rare metal deposit: the Yushishan leptynite type Nb-Ta deposit in eastern Altyn, Gansu Province, NW China. Acta Geologica Sinica (English Edition) 95 (5), 1471–1483.
Jiang, S. Y., Su, H. M., Xiong, Y. Q., Liu, T., Zhu, K. Y., and Zhang, L. (2020). Spatial-temporal distribution, geological characteristics and ore-formation controlling factors of major types of rare metal mineral deposits in China. Acta Geol. Sin. Engl. Ed. 94 (6), 1757–1773. doi:10.1111/1755-6724.14595
Li, G., Liu, S., Jian, X., Zhu, D., Fu, L., Chen, T., et al. (2022). Identifying the lineament structure cooperatively using the airborne gravimetric, magnetic, and remote sensing data: a case study from the pobei area, NW China. IEEE Trans. Geosci. Remote Sens. 60, 1–17. doi:10.1109/TGRS.2022.3213806
Liu, T., Jiang, S. Y., Zheng, R. H., and Chen, W. (2022). Titanite U-Pb dating and geochemical constraints on the Paleozoic magmatic-metamorphic events and Nb-Ta mineralization in the Yushishan deposit, South Qilian, NW China. Lithos 412-13, 106612. doi:10.1016/j.lithos.2022.106612
Liu, J., Wen, Z., Shen, X., Zuo, F., Jiang, L., and Zhang, H. (2024). Online pipeline weld defect detection for magnetic flux leakage inspection system via lightweight rotated network. IEEE Trans. Industrial Electron. 72 (7), 7573–7584. doi:10.1109/TIE.2024.3503635
Liu, Y. J., Franz, N., Ge, X. H., Johann, G., Yuan, S. H., Li, W. M., et al. (2007). Geochronology of the Altyn fault zone and rising of the Altyn mountains. Chinese. J. Geol. 42 (1), 134–146.
Miller, H. G., and Singh, V. (1994). Potential field tilt—a new concept for location of potential field sources. J. Appl. Geophys. 32 (2-3), 213–217. doi:10.1016/0926-9851(94)90022-1
Nabighian, M. N. (1972). The analytic signal of two-dimensional magnetic bodies with polygonal cross-section: its properties and use for automated anomaly interpretation. Geophysics 37 (3), 507–517. doi:10.1190/1.1440276
Nabighian, M. N. (1974). Additional comments on the analytic signal of two-dimensional magnetic bodies with polygonal cross-section. Geophysics 39 (1), 85–92. doi:10.1190/1.1440416
Nabighian, M. N. (1984). Toward a three-dimensional automatic interpretation of potential field data via generalized Hilbert transforms: fundamental relations. Geophysics 49 (6), 780–786. doi:10.1190/1.1441706
Naprstek, T., and Smith, R. S. (2022). Convolutional neural networks applied to the interpretation of lineaments in aeromagnetic data. Geophysics 87 (1), JM1–JM13. doi:10.1190/geo2020-0779.1
Rumelhart, D. E., Hinton, G. E., and Williams, R. J. (1986). Learning rep resentations by back-propagating errors. Nature 323 (6088), 533–536. doi:10.1038/323533a0
Salem, A., Williams, S., Fairhead, D., Smith, R., and Ravat, D. (2008). Interpretation of magnetic data using tilt-angle derivatives. Geophysics 73 (1), L1–L10. doi:10.1190/1.2799992
Salem, A., and Al-Dosari, A. (2022). Hybrid differential inclusion involving two multi-valuedoperators with nonlocal multi-valued integral condition[J]. Fractal and Fractional. 6 (2), 109. doi:10.3390/fractalfract6020109
Shen, X., Li, L., Ma, Y., Xu, S., Liu, J., Yang, Z., et al. (2025a). VLCIM: a vision-language cyclic interaction model for industrial defect detection. IEEE Trans. Instrum. Meas., 1. doi:10.1109/TIM.2025.3583364
Shen, X., Liu, J., Ren, Y., Jiang, L., Wang, L., Zhao, He, et al. (2025b). A task-oriented physical collaborative network for pipeline defect diagnosis in a magnetic flux leakage detection system. Comput. Industry 169, 104290. doi:10.1016/j.compind.2025.104290
Tejaswini, V., Sathya Babu, K., and Sahoo, B. (2024). Depression detection from social media text analysis using natural language processing techniques and hybrid deep learning model. ACM Trans. Asian Low-Resource Lang. Inf. Process. 23 (1), 1–20. doi:10.1145/3569580
Wang, J., Li, X. Q., Liang, M. H., Wang, Y. X., Zhang, B. B., and Pan, B. T. (2018). Age and geochemistry of aksay ophiolite in east altun mountains. Geol. Bull. China 37 (4), 559–569.
Wang, Y., Liu, L., and Xu, H. (2020). The identification of gravity anomaly body based on the convolutional neural network. Geophys. Geochem. Explor. 44 (2), 394–400.
Wu, J., Li, J. L., Lan, C. L., and Yu, L. J. (2001). New knowledges on Hongliugou ophiolite along Altun fault, NW China. Chin. J. Geol. 36 (3), 342–349.
Xu, Z. Q., Yang, J. S., Zhang, J. X., Jiang, M., Li, H. B., and Cui, J. W. (1999). A comparison between the tectonic units on the two sides of the Altun sinistral strike-slip fault and the mechanism of lithospheric shearing. Acta Geol. Sin. 73 (3), 193–205.
Xu, Z. Q., Yang, J. S., Li, H. B., and Yao, J. X. (2006). The Early Palaeozoic terrene framework and the formation of the high-pressure (HP) and ultra-high pressure (UHP) metamorphic belts at the Central Orogenic Belt (COB). Acta Geol. 2006. Sin. 80 (12), 1793–1806.
Yang, Z. C., Xiao, P. X., Gao, X. F., Kang, L., Xie, C. R., Yu, J. P., et al. (2014). LA-ICP-MS dating of the aegirine-augite syenite of Yushishan Nb-Ta deposit in Eastern Altun and its constraints on the metallogenetic age. Northwest. Geol. 47 (4), 187–197.
Yang, Z. J., Ma, H. D., Wang, Z. X., and Xiao, W. F. (2012). SHRIMP U-Pb zircon dating of gabbro from the Binggou ophiolite m´elange in the northern Altyn, and geological implication. Acta Petrol. Sin. 28 (7), 2269.
Yu, J. P., Zhang, X. H., Zhao, J. G., Li, T. G., Dong, G. Q., Ye, D. J., et al. (2012). Prospecting discovery and significance of Yushishan Nb-Ta rare metal deposit in Altyn mountain. Gansu Province Mineral Deposits 31 (s1), 391–392.
Yu, J. P., Wu, Y. B., Liang, M. H., Xiao, P. X., and Dou, X. Y. (2015). New progress of the Southern Altyn Tagh geological mapping and guide the prospecting support: according to 1:50000 Mobeier and other five regional geological maps in Gansu Province. Geol. Surv. China 2 (2), 40–47.
Yu, S., and Ma, J. (2021). Deep learning for geophysics: current and future trends. Rev. Geophys. 59 (3), 1–36. doi:10.1029/2021rg000742
Zhang, J. X., Yu, S. Y., Li, Y. S., Yu, X. X., Lin, Y. H., and Mao, X. H. (2015). Subduction, accretion and closure of Proto-Tethyan Ocean: Early Paleozoic accretion/collision orogeny in the Altun-Qilian-North Qaidam orogenic system. Acta Petrol 31 (12), 3531–3554.
Zhang, L., Shen, J., and Zhu, B. (2022). A review of the research and application of deep learning-based computer vision in structural damage detection. Earthq. Eng. Eng. Vib. 21 (1), 1–21. doi:10.1007/s11803-022-2074-7
Zhang, Z. H., and Yu, Y. (2022). Deep learning for potential field edge detection. Chin. J. Geophys. 65 (5), 1785–1801. doi:10.6038/cjg2022H0403
Zhou, S., Yao, X. A., Zeng, X. C., Dong, S., and Yu, Z. (2024). Magnetic data edge detection method with depth information based on UNet++. IEEE Transactions on Geoscience and Remote Sensing. 62, 1–13. doi:10.1109/TGRS.2024.3490660
Zhou, D. K., Cao, S. Y., Liu, J. H., Li, X. W., Dong, Y. L., Neubauer, F., et al. (2022). Carbonation and serpentinization of diopsidite in the Altun Mountains, NW China. Sci. Rep. 12, 21361.
Keywords: magnetic surveys, boundary detection, self-attention mechanism, transformer, edge-enhanced loss
Citation: Haihua J, Li W, Jie Y, Gaochuan L, Zhong X, Jian J, Le Z and Bo D (2025) A high-precision edge detection technique for magnetic anomaly signals based on a self-attention mechanism. Front. Earth Sci. 13:1600631. doi: 10.3389/feart.2025.1600631
Received: 26 March 2025; Accepted: 01 July 2025;
Published: 17 July 2025.
Edited by:
Manoj Khandelwal, Federation University Australia, AustraliaReviewed by:
Kunpeng Ge, East China University of Technology, ChinaXiangkai Shen, Beihang University, China
Copyright © 2025 Haihua, Li, Jie, Gaochuan, Zhong, Jian, Le and Bo. This is an open-access article distributed under the terms of the Creative Commons Attribution License (CC BY). The use, distribution or reproduction in other forums is permitted, provided the original author(s) and the copyright owner(s) are credited and that the original publication in this journal is cited, in accordance with accepted academic practice. No use, distribution or reproduction is permitted which does not comply with these terms.
*Correspondence: Liu Gaochuan, Z2NsaXVAc2Vpcy5hYy5jbg==
 Ju Haihua
 Wang Li1
 Jiao Jian