 Abdelbaset S. El-Sorogy1Khaled Al-Kahtany1
 Mohamed S. Shokr2*
 Talal Alharbi1Jose Emilio Meroño de Larriva3
- 1Geology and Geophysics Department, College of Science, King Saud University, Riyadh, Saudi Arabia
- 2Soil and Water Department, Faculty of Agriculture, Tanta University, Tanta, Egypt
- 3Department of Graphic Engineering and Geomatics, University of Cordoba, Cordoba, Spain
Introduction: Heavy metals (HMs) contamination of soil is gaining a lot of attention globally because of its apparent toxicity and potential risks to local populations. Therefore, the first stage of high-efficiency pollutant degradation and sustainable utilization is the evaluation of soil heavy metal distribution, sources, and environmental dangers. However, details regarding the sources of heavy metals and the degree of contamination in specific soils in the Al Qassim region of Saudi Arabia are lacking.
Method: Thus, the present study assessed the environmental risk of Arsenic (As), Cobalt (Co), Chromium (Cr), Copper (Cu), Iron (Fe), Nickel (Ni), Lead (Pb),Vanadium (V), and Zinc (Zn) in the central portion of the Al Qassim region, Saudi Arabia using a range of contamination indices and multivariate approaches. Thirty-two surface soil samples were gathered for analysis. The Normalized Difference Vegetation Index (NDVI), and land use land cover (LULC) maps were computed using a sentinel 2 image of the research area from Google Earth Engine (GEE).
Results and discussion: The potential ecological risk index (PERI) and the modified degree of contamination (mCd) averages were 26.6 and 0.6, respectively, hence all soil samples were deemed low-contaminated. According to the multivariate analysis, these HMs primarily originate from natural rocks except for Zn which may originate from an anthropogenic source but is still in a safe concentration. Because the research region is include a lot of cultivation activates, as indicated by the NDVI status and LULC map, The results of the spatial distribution maps of pollutants and their concentrations can be used by decision-makers to guide future HMs concentration monitoring in the study area, to avoid any potential future soil contamination as well as to improve human health, worldwide food security, and the accomplishment of the Sustainable Development Goals (SDGs).
1 Introduction
Heavy metal (HM) contamination of soil is one of the most urgent environmental issues in the world (Bilal et al., 2024; Aloud et al., 2022; Boumaza et al., 2023; Kahal et al., 2025). Elements having large atomic weights and relatively high densities are referred to as HMs (Kabata-Pendias, 2000; Alloway, 2012). Because HMs are not biodegradable, they can remain in the environment for a long time after being released, which can have a negative impact on plants, soils, and people (Wu et al., 2010; Rahman et al., 2019). Growing concerns about the safety of agricultural products have contributed significantly to the public’s attention towards soil heavy metal pollution, a global environmental issue (Hu et al., 2017). Five million soil pollution locations occur all over the world, covering 500 million hectares of land, where the soils have been poisoned by different heavy metals or metalloids. It is estimated that heavy metal poisoning of soil has an annual global economic impact of over $10 billion (He et al., 2019). Ten worldwide soil threats were identified in the FAO’s Intergovernmental Technical Panel on Soils’ Status of the World’s Soil Resources report, which placed the provision at risk for important soil ecosystem services (Fao, 2015). One of the most concerning risks to the health and functionality of soil was found to be soil contamination. The Global Symposium on Soil Pollution (GSOP18) was held in 2018 by the FAO’s Global Soil Partnership. Trace element pollution is a major issue in Southeast Asia, and it has gotten worse due to the region’s growing number of chemical industries and generally lax environmental regulations. In Bangladesh, tanneries and brick kiln industries are sources of soil pollution by trace elements and pose a threat to both the environment and human health (UNEP, 2021). In general, trace element pollution is more severe in southeast China than in northwest China. This is because of India’s extremely rapid economic growth through industrial, agricultural, and mining activities, which were thought to be the primary potential driver (Ding, 2019). The soils across over 92% of Egypt’s Nile Delta were seriously contaminated, which could have negative effects on the ecosystem and human health (Abuzaid et al., 2023).
Metals: Co maintains the symbiotic N2 fixation and ethylene production in legumes (Daulta et al., 2023), whereas Cu, Zu, and Ni are essential for controlling the activity of several enzymes (Chen et al., 2022). Other metals (Cd, Cr, and Pb) are extremely poisonous and have no beneficial functions (Nowicka and Research, 2022; Abuzaid et al., 2023). Through oxidative stress, competition with necessary cations, and inhibition of enzyme activity, an excess of HMs puts the soil biota under abiotic stress (Nowicka and Research, 2022). This ultimately results in a decrease in crop yield and quality as the plant life cycle is negatively impacted from seed germination to the maturity stage (Yang et al., 2022). Hyperaccumulators, which include many food, feed, and forage crops, are able to absorb excess HMs and move them to their aerial sections and are highly resistant to metal stress (Chen et al., 2022). Consequently, there are serious health hazards when metals that have accumulated in soils are concentrated in animal and human organs through the food chain (Abuzaid et al., 2019)]. The quality of groundwater may be lowered by the HMs’ potential to seep into aquifers (Abbas et al., 2020; Abuzaid et al., 2021b).
Human health is directly impacted by agricultural soil, which is essential for maintaining food safety (Agyeman et al., 2021; Alarifi et al., 2023). Industrial activity has significantly increased over the past 5 years (El-Sorogy et al., 2024). Both natural and man-made factors commonly affect the presence of heavy metals (HMs) in soils and crops. Natural processes like rock weathering and volcanic activity can cause agricultural soils to contain significant amounts of heavy metals (HMs). The main causes of HMs are human activities, including land changes involving sewage sludge, livestock manure, wastewater irrigation, and the application of fertilizers and insecticides (Alharbi et al., 2024). The soils of the Kingdom of Saudi Arabia (KSA) are deficient in organic matter, moisture, and nutrients. Despite this, KSA has had successful and rapid agricultural development since the 1980s. One of the most productive agricultural zones in the Kingdom of Saudi Arabia is thought to be Al-Wabel et al. (2017). This area’s soils are heavily farmed to increase food production for the expanding population, and fast urbanization (Al-Wabel et al., 2017). As a result, large volumes of liquid and solid waste have been produced, which has caused HMs to spread throughout several environmental compartments.
The Normalized Difference Vegetation Index (NDVI), which gauges the greenness of vegetation about its vigour and extent (Luo et al., 2015; Rhee et al., 2017), is based on the differential absorption of the red and near-infrared spectral bands (Rouse et al., 1974; Tucker, 1977). NDVI is strongly correlated with soil health, geomorphology, CO2 levels, nitrogen deposition, and climatic constraints (Abuzaid et al., 2022; Chen et al., 2022).
Assessing the spatial distribution of heavy metals in soil and the factors that influence them can be a dependable way to track and assess soil pollution and determine the overall environmental quality of soil (Sun et al., 2010). To create an appropriate remediation plan and lessen adverse effects, a precise evaluation of soil pollution based on HMs is essential (Yang et al., 2021).
Spatial data can be studied and the location of the unsampled data can be anticipated using a technique known as geostatistical analysis (Hammam et al., 2020). There are numerous geostatistical analysis methods, such as Kriging and or inverse distance weight (IDW). Numerous techniques, such as the index methodology, quotient method, fuzzy comprehensive assessment, geoaccumulation index, potential ecological risk index, and pollutant load index, are used to evaluate soil ecological risk (Abuzaid et al., 2020; Khan et al., 2021; Shokr et al., 2022). Principle components analysis (PCA) was the most frequently employed multivariate statistical analysis method (Hou et al., 2017).
PCA is a method for reducing the dimensions of data that aims to clarify a limited number of independents that account for the majority of the variance in the data (Borůvka et al., 2005). The percentage of heavy metals that cause soil contamination as well as a number of other sources of soil pollution, such as industrial and agricultural activity in addition natural resources, have also been identified using PCA (Yang et al., 2017; Yang et al., 2020). Certain elements frequently contribute more to pollution than others (Jolliffe, 2005). Consequently, this problem can be resolved by principal component analysis (PCA), which models the regressions between the various variables by reducing a large number of variables to a small number of complete principle components (Jones, 2019; Abdel-Fattah et al., 2021). Hierarchical clustering analysis (HCA) and PCA were successful in classifying soil and water quality into different groups (Hammam et al., 2022; Jalhoum et al., 2024). There is insufficient information available about the origins of heavy metals and the level of contamination in particular soils in the Saudi Arabian Al Qassim region. Thus,the objective of the current study is to map the spatial distribution of heavy metals in the study area, define the contamination levels using multivariate analysis (PCA, and HCA), and determine the potential soil contamination with chosen heavy metals (As, Co, Cr, Cu, Fe, Ni, Pb, V, and Zn). The following research questions are the main focus of this study: 1 From what source do the bulk of the heavy metals in the central part of Saudi Arabia’s Al Qassim region originate? 2 Is there a gradient in the amount of heavy metal pollution in the soil? 3 What leads to the concentration of metals in the soil? (4) Is it possible to reduce or eliminate the severity of pollution? The spatial distribution of these metals in the study area can be used to assess the mobility of the contaminants and determine their origins, which will help with future management. In addition to increasing public knowledge of the risks of environmental contamination, the data acquired from this study may help environmental organisations improve their programs and policies to ensure food safety and quality.
2 Materials and methods
2.1 Study area
The research area is located between latitudes 26°0′0″ and 26°9′0″ N and longitudes 43°34′0″ and 43°41′30″ E in the middle part of Al Qassim region, Saudi Arabia with an area of 52.40 km2 (Figure 1). The study area experiences typical arid weather, with hot summer, cold, little rain in winter, as well as low humidity (around 20%). Summer temperature typically varies between 36 °C and 41 °C, while winter temperature averages 11 °C. Rainfall in the region averages 100 mm annually (Al-Wabel et al., 2017). Agriculture has long been the backbone of the local economy in the study area. Although the area is most known for its dates, melons, wheat, and citrus fruits are also significant crops. More fruits and vegetables can now be grown in modern greenhouses. Important livestock that are essential to the economy and culture are camels and sheep (Kaminski et al., 2019). The Standard Oil Company of California discovered petroleum in 1935, which sparked geological exploration in the Al Qassim region. Powers et al. (1966) included formations from this region in Geology of the Arabian Peninsula: Sedimentary Geology of Saudi Arabia. The Paleozoic layers are characterized by a somewhat slanted layer cake, with rock units getting younger and younger as one moves northeast (Kaminski et al., 2019). In the research area, the Saq, Khuff, Jilh, Minjur and Dhruma, Biyadh, Wasia, Aruma, and Umm Radhuma aquifers are the primary Upper Jurassic and Lower Cretaceous aquifers. Lithologically, drilled wells in the area encounter sandstone, limestone, clay, shale, siltstone, and gypsum stones (Nazzal et al., 2016). The steps of the integration process between inputs and outputs throughout the current study are depicted in Figure 2.
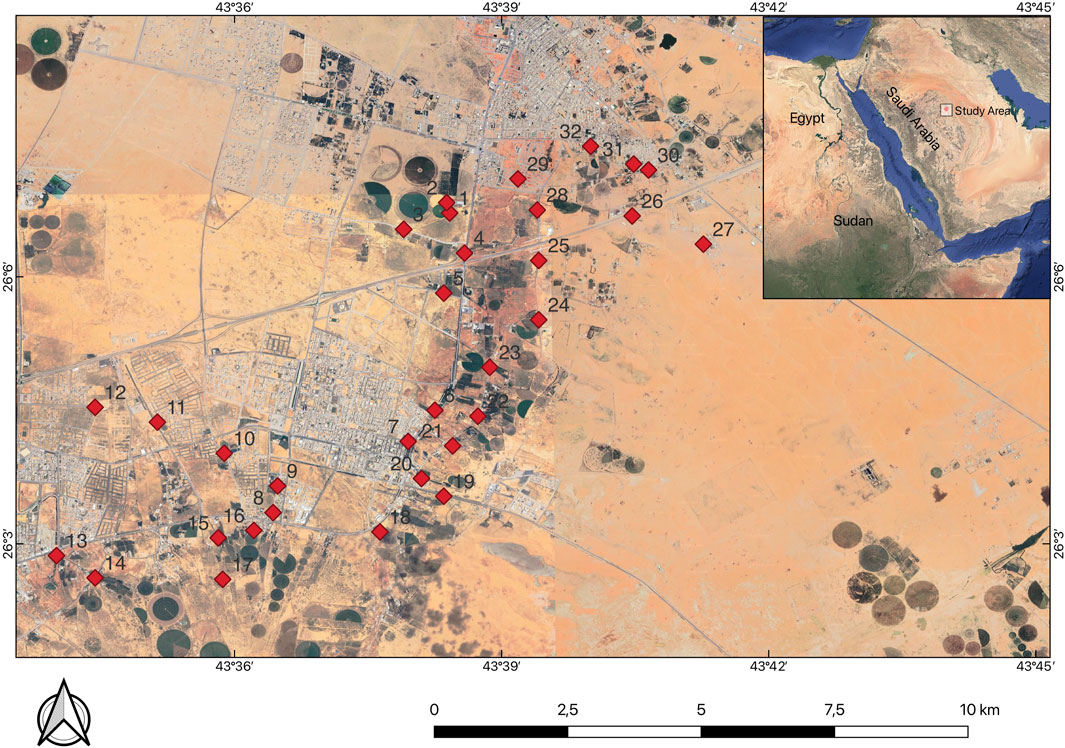
Figure 1. Location and spatial distribution of soil samples in the study.
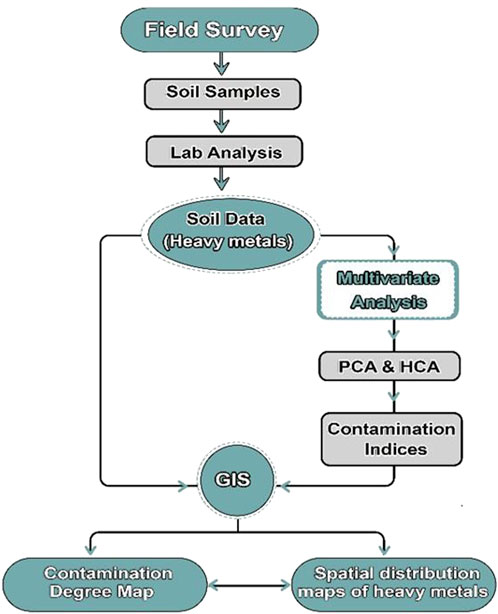
Figure 2. Integration process between inputs and outputs throughout the current study.
2.2 Soil survey and laboratory analysis
In 2024, 32 surface soil samples were randomly selected from the study area to determine the level of heavy metal contamination in the soil (Figure 1) and guarantee that the samples gathered encompass a broad spectrum of potential soil conditions within the site’s geographic region. The samples were collected at a depth of less than 10 cm using a firm plastic hand trowel to avoid contamination, and at each site, a representative sample was made by combining four subsamples into a composite sample that was then sealed in plastic bags and stored in an icebox. The samples were collected from surface layers as soils in desert or arid areas are typically alkaline (Day et al., 1993) and it was well known that the mobility of heavy metals is decreasing as the pH rises (Sintorini et al., 2021). The samples were then sieved through a 2 mm mesh, and large rocks and organic material were removed from the samples in the laboratory. After allowing them to air-dry, they were ground with a non-metallic mortar and pestle to guarantee a consistent particle size (Alharbi and El-Sorogy, 2022), and As, Co, Cr, Cu, Fe, Ni, Pb, V, and Zn were analyzed using inductively coupled plasma atomic emission spectrometry (ICP-AES) (the Thermo Fisher iCAP 6500 and the PerkinElmer Optima series) at the ALS Geochemistry Laboratory in Jeddah, Saudi Arabia. Due to the excellent atomizing conditions provided by the high temperatures, the ICP-AES can be used with a variety of elements. It is possible to detect all metals, semimetals, and even some nonmetals, such as iodine, phosphorus, and sulphur (Lajunen and Perämäki, 2004).
Each sample weighed 0.50 g, and was then incubated with HNO3-HCl aqua regia for 45 min in a graphite heating block. The resulting solution was then cooled and diluted to 12.5 mL using deionized water, mixed, and analyzed. The linearity, limits of quantification (LOQs), and limits of detection (LODs of the ICP-AES method were assessed (0.99; Supplementary Table S1; Alzahrani et al., 2024),and one composite samples from four samples were examined twice to ensure the analysis was accurate. A Certified Reference Material (CRM) was analyzed in order to assess the precision and accuracy of the analytical techniques utilized for the multi-element assessment of soil samples including two certified reference materials from Western Australia (CRM11:EMOG17 and CRM2:GBM321-8) to guarantee data precision before release and a reagent blank to measure the background (Supplementary Table S2). Recoveries with a range of 95.23%–100% provide a reliable indication of the accuracy of the used methodology (Nazzal et al., 2016; Chandrasiri et al., 2019).
2.3 Statistical analysis
The statistical analysis of the investigated heavy metals was performed using SPSS version 25 (El Behairy et al., 2022). To demonstrate linear correlations between the variables under study, the Pearson correlation coefficient was employed. The Kaiser–Meyer–Olkin (KMO) method was used to evaluate the samples’ appropriateness for PCA. If the KMO values were higher than 0.5, the data were suitable for PCA (Said et al., 2020). The Bartlett test was used to further validate the data fitness for PCA, and the findings showed that p < 0.05 (Jolliffe et al., 2016). Principal component analysis (PCA) was used to separate the dataset into PC variables to remove multicollinearity between the original variables. Hierarchical cluster analysis (HCA) was used to cluster heavy metal data to examine their origins, sources, and behavior. This approach helped to clarify the connections between the different heavy metals (Abdel-Fattah et al., 2020; Abuzaid et al., 2020).
2.4 Land surface and interpolation technique
The Digital Elevation Model (DEM), which has a spatial resolution of 30 m, was developed by the NASA Shuttle Radar Topographic Mission (SRTM) (https://earthexplorer.usgs.gov, accessed on 1 October 2024) and was employed to derive the research area’s elevation and slope. To estimate attribute values of HMs at unsampled sites using data acquired at sample sites, the Inverse Distance Weighting (IDW) interpolation approach is utilized in ArcGIS software10.8. The data points are given a distance weight using the IDW technique so that the influence of one point in relation to the other decreases as one gets farther away from the new location (Hu, 1995). The IDW interpolation results are most reliable when the power parameter values range from 0.5 to 3 (Inc, 2020), with 2 being the most frequently employed value (Gotway et al., 1996; Gong et al., 2014). Hence, the value of p was established at 2 and search radius was variable with 12 neighbouring samples. The uneven distribution of soil samples led to its selection for this investigation. This distribution was the outcome of issues that arose during sample collecting on the site, such as access issues in some regions and the existence of private farms that made regular or dense sampling difficult.
2.5 Normalized difference vegetation index (NDVI)
The NDVI, a high spatial resolution assessment of vegetation density and health, is computed in Google Earth Engine (GEE) using Sentinel-2 data obtained in October 2024. Sentinel-2 is a multispectral satellite sensor that is perfect for NDVI investigation (Abdelsamie et al., 2022). This dimensionless index is shown in Equation 1 and can be used to differentiate between various agricultural characteristics in a field, such as plant height and productivity (Tucker, 1977; Leon et al., 2003). It also indicates the density and presence of vegetation (Demattê et al., 2017).
where: NIR = Near infrared band, and R = red band.
2.6 Identification of land use/land cover (LULC) of the study area
One of the most important uses of remote sensing is the identification and recognition of various types of land cover and land use. Crop classification methods using machine learning have been developing in recent years. A cloud-based platform called Google Earth Engine gives users the ability to employ a variety of sophisticated classification techniques to analyze various satellite datasets (Neetu and Ray, 2019; Clemente et al., 2020; Xue et al., 2023). Crops were categorized using the Random Forest (RF) method with Sentinel-2 (10 m) high-resolution optical data from October 2024 [48 (Akbari et al., 2020; Tariq and Shu, 2020). Seventy percent of the 1,000 ground truth data points used to assess the model’s accuracy were set aside for model calibration, which allowed features and parameters to be adjusted. The calibration−validation split increases the model’s credibility by guaranteeing that it can reliably generalize its results outside of the calibration dataset. The remaining thirty percent was set aside for model validation. This tool helps identify crop patterns more reliably and accurately for agricultural planning, management, and observation (Hendawy et al., 2024).
2.7 Determination of the study area’s soil contamination
2.7.1 Single indices
The contamination factor (CF), enrichment factor (EF), and index of geo-accumulation (Igeo) are examples of single indices, which are indicators used to compute only one metal contamination (Wu et al., 2015; Weissmannová et al., 2017).
2.7.1.1 Enrichment factor (EF)
An Enrichment Factor (EF) calculation for metal concentrations above uncontaminated background levels is a standard method to determine the extent to which HMs are influencing the sediment (naturally and anthropogenically) (Ho et al., 2010). In relation to a reference sample, such as Fe, Al, or Zn, the EF normalizes the measured HMs content (Lizarraga Mendiola et al., 2008). The comparisons in this study were done using the background concentrations of iron in the earth’s crust as a reference element, assuming that anthropogenic activity has no effect on the iron composition of the crust (Wedepohl, 1995). Fe is more practical for calculating EF, as iron shares a more comparable geochemical nature with many metals in both oxic and anoxic environments (Rubio et al., 2000) and has been widely used in arid areas (Abuzaid et al., 2021a; Alarifi et al., 2022; Alzahrani et al., 2023; Kahal et al., 2025).
The Fe is used to determine the relative degree of metal contamination. Using the following Formula 2, one may determine the EF of an HM in soil:
The (M/Fe) crust is the ratio of metal to iron concentrations in a background, where M is the metal concentration; the (M/Fe) sample is the ratio of metal and iron concentrations in a sample. EF values less than two indicate that the metal originates solely from natural processes or mineral materials, but EF values greater than two suggest that the sources are more likely to be man-made (Ergin et al., 1991; Angelidis and Aloupi, 1997; Liaghati et al., 2004). Additionally, iron has been used in this investigation as a cautious tracer to differentiate between natural and man-made components. The background value is the average value of the Earth’s upper crust as reported by (Wedepohl, 1995). Supplementary Table S3 showed the classes of EF.
2.7.1.2 Geoaccumulation index (Igeo)
A quantitative metric for assessing the level of heavy metal contamination in soil and sediment is the Igeo (Müller, 1979; Kim et al., 2018). This is how it is calculated (Equation 3): The Igeo evaluation criteria are categorized in Supplementary Table S4
where Bi (mg kg−1) is the background value of heavy metal I in the earth crust as determined by (Wedepohl, 1995), and Ci (mg kg−1) is the concentration of heavy metal I in the soil samples in the research area.2.6.1.3. Contamination Factor (CF).
The CF index, which is calculated by dividing the target heavy metal concentration (C metal mg kg−1) by the soil background (C background mg kg−1), is used to assess the degree of contamination (Equation 4). This index was computed using (Equation 4; Harikumar and Jisha, 2010). The CF evaluation criteria are categorized in Supplementary Table S5
2.7.2 Integrated indices
Indicators that compute several metal contamination levels based on single indices are called integrated indices (Kahal et al., 2025). Each type of integrated index, such as the potential ecological risk index (PERI) and the modified degree of contamination (mCd), may be made up of the individual indices.
2.7.2.1 Potential ecological risk index (PERI)
The potential ecological risk index (PERI) was calculated in the current study as total of the six HMs (Zn, Cr, Cu, Ni, Pb, and As) to objectively evaluate the possible risks associated with heavy metal pollution of soil. Equations 5, 6, which were developed by Hakanson (1980), were used to calculate it:
where
2.7.2.2 Modified degree of contamination (mCd)
A modified degree of contamination (mCd) index can also be obtained from the CF values. The ratio known as the mCd is calculated by dividing the total contamination factor of each metal by the number of heavy metals under study. Abrahim et al. (2008) created the modified degree of contamination (mCd), which was helpful in determining the occupied contamination of several elements in each soil sample. The mCd in Supplementary Table S7 is described by the classes. Equation 7 can be used to calculate mCd.
where: n is number of HMs.
3 Results and discussion
3.1 Topographic features vegetation, and heavy metal concentrations
The land surface elevation varies between around 635 and 681 m above sea level (m.asl), according to the Digital Elevation Model (DEM) research (Figure 3a). The most significant factor influencing erosion is the slope of the soil’s surface (Aggag and Alharbi, 2022; Alharbi and El-Sorogy, 2022). The soil depth falls as the slope increases and rises with decreasing slope rate. (Ennaji et al., 2018). Slope information was obtained using GIS tools and the Digital Elevation Model. There were steep (30%–60%) and flat (0%–0.2%) slopes in the study (Lee, 2014; Silalahi et al., 2019; Figure 3b). By adversely influencing soil characteristics, the slope indirectly limits agricultural output (Aggag and Alharbi, 2022).
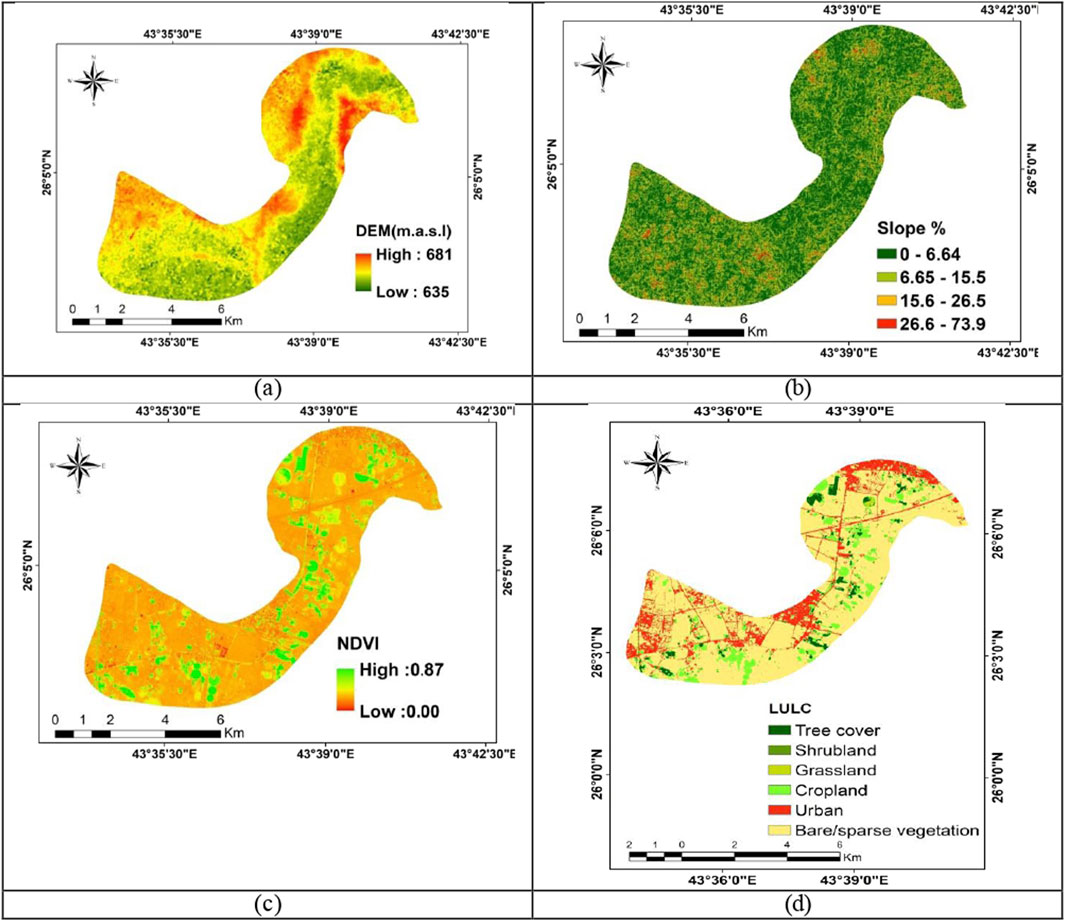
Figure 3. Topographic features (a) digital elevation model (DEM), (b) slope %, (c) NDVI, (d) LULC of the study area.
The NDVI values ranged from 0.00 to 0.87 (Figure 3c). The high values of NDVI in the study area are due to food security, rural development, agricultural productivity, and sustainable resource management were Saudi Arabia’s top strategic concerns. The expansion has been spread out geographically, and the Agricultural Development Fund has been essential in encouraging the prudent use of resources, the use of technology, and the facilitation of investment (Shomrany, 2024). Figure 3d illustrates the land use in the study area. They identified six categories: urban areas, bare soils, grasses, bushes, trees, and field crops. The corresponding areas are 1.76, 0.3, 0.08, 5.24, 8, and 37 km2. The overall accuracy was 87% and the Kappa was about 0.7.
Table 1 provides a statistical overview of the overall concentrations of heavy metals and metalloids (As, Co, Cr, Cu, Fe, Ni, Pb, V, and Zn) in surface soil samples from the study area. In all sites, the average value for As was 3.19 mg·kg−1, with ranges of 2–5 mg·kg−1, while the value for Co was 3.16 mg·kg−1, with ranges of 2–6 mg·kg−1. The values for Cr and Cu were 16.75 mg·kg−1 with ranges of 10–31 mg·kg−1 and 24 mg·kg−1 with ranges of 4–24 mg·kg−1, respectively. The average value for Pb was 5.72 mg·kg−1, with a range of 4–14 mg·kg−1, whereas the values for Fe and Ni were 8775 mg·kg−1 with ranges between 5800 and 143000 mg·kg−1 and 14.53 mg·kg−1 with ranges between 8 and 28 mg·kg−1, respectively. The average value for V was 20.47 mg·kg−1, with a range of 12–31 mg·kg−1. Finally, the Zn concentration ranges from 17–84 mg kg−1 with an average of 40.81 mg•kg−1. As, Co and Pb value distributions in the study area show a high degree of similarity (STD < 2), however all remaining HMs in the study area show a large degree of variation (Table 1; Ali and Moghanm, 2013).
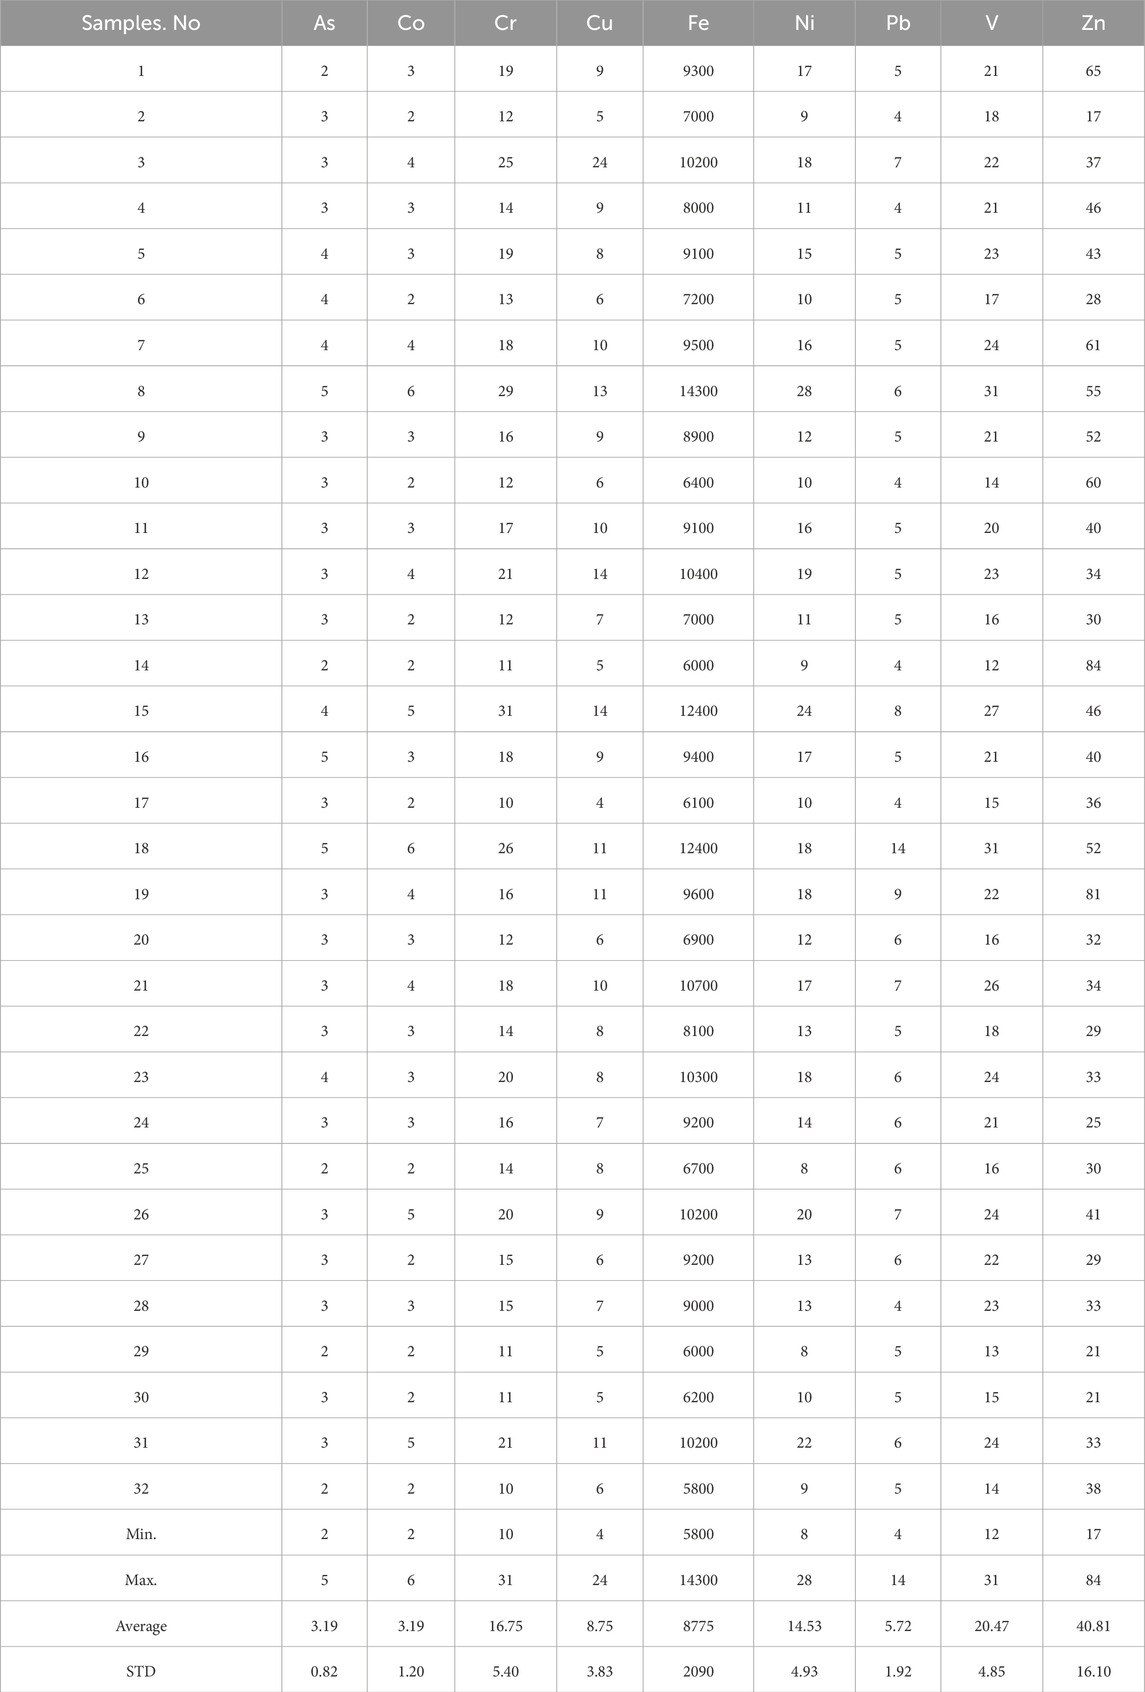
Table 1. Concentration of heavy metals in different sites.
Fe, Ni, and Zn are only a few of the HMs that are necessary for basic nutritional functions and require small amounts (González et al., 2021; Neal and Guilarte, 2013; Abbaspour et al., 2014) state that an overabundance of these HMs might cause serious health issues such as diabetes, neurological and renal illnesses, and cardiovascular diseases. Since these samples were taken from farms in mountainous areas, the south of the research area had the greatest amounts of all HMs due to these areas are near to the cultivated lands (Figures 4a–i). This study’s reliance on the IDW approach for HM data interpolation is one of its methodological limitations. This method may affect the precision of the spatial forecasts for heavy metal concentrations, even though it was required because of the irregular distribution of sampling sites brought on by field access limitations. However, the accuracy evaluation of the model revealed that the Root Mean Square Error (RMSE) ranged from 0.74 to 20.1 and the Mean Error for element distribution ranged from 0.03 to 0.1. Those values showed that While some elements, like As, showed high interpolation accuracy (RMSE = 0.74), others, like zinc, showed more fluctuation in prediction accuracy which might be due to their larger spatial heterogeneity.
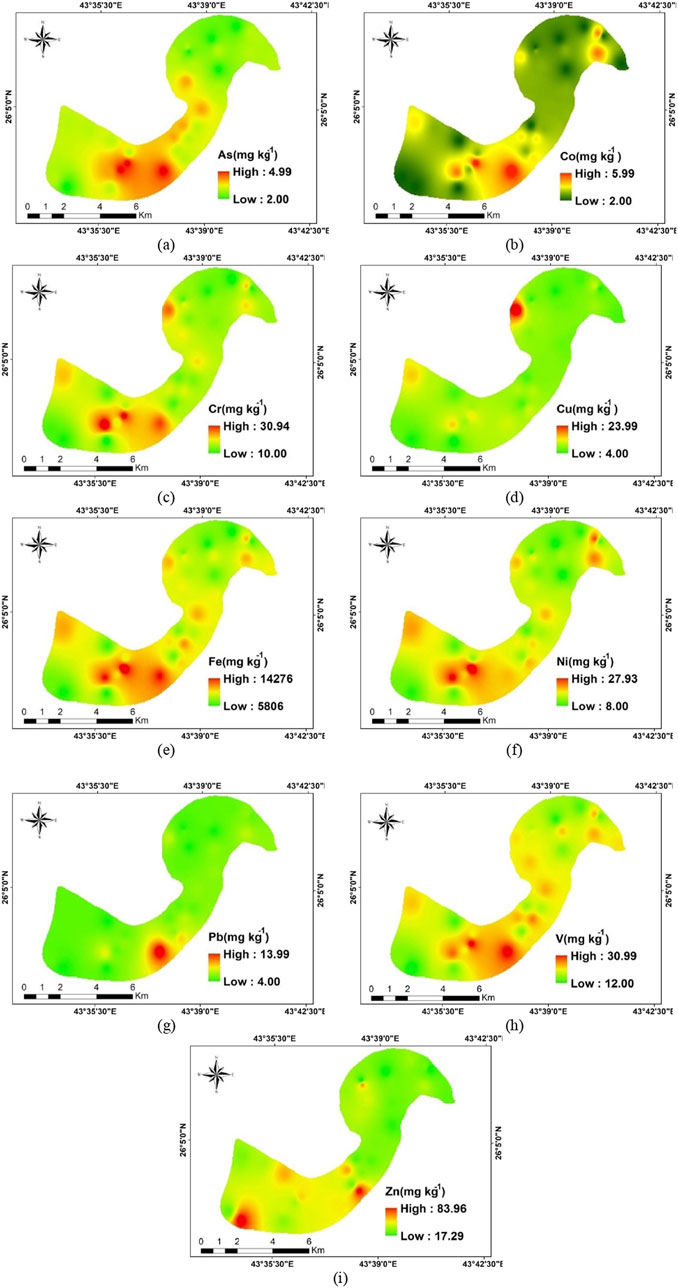
Figure 4. Interpolation maps of different HMs within the study area. (a) As (mg kg−1), (b) Co (mg kg−1), (c) Cr (mg kg−1), (d) Cu (mg kg−1), (e) Fe (mg kg−1), (f) Ni (mg kg−1), (g) Pb (mg kg−1), (h) V (mg kg−1), and (i) Zn (mg kg−1).
3.2 Comparision between current study and other HMs concentrations
Compared to other Saudi Arabian regions, the current results showed higher levels of As, Co, Cr, Cu, Fe, Ni, Pb, V, and Zn (Table 2). In addition to the element content of the bedrock or other deposits from which the materials originated, the abundance of individual elements in soils and other surficial materials is also influenced by biological and climatic factors, as well as by agricultural and industrial processes that have acted on the materials over time (Al-Bagawi et al., 2021). It is crucial to compare the HMs concentrations in your study with those in other places (Table 2) because in comparison to suggested and regional values, it assists in determining whether the amounts of HMs in our research area are within a normal or acceptable range. The average As value exceeded all concentrations shown in the Table 2, with the exception of those from northwest of the Al-Baha (Alzahrani et al., 2024), Average natural concentration of heavy metals in rocks (Bradl, 2005), and recommended concentrations by Department of Environmental Affairs (2013). On the other hand, the average values of the Co, Cr, Fe, Pb, V, and Zn content were less than those listed in Table 2. While The average concentration of Ni were the same of those from Al-Ahsa, Eastern Saudi Arabia (Alharbi and El-Sorogy, 2022).
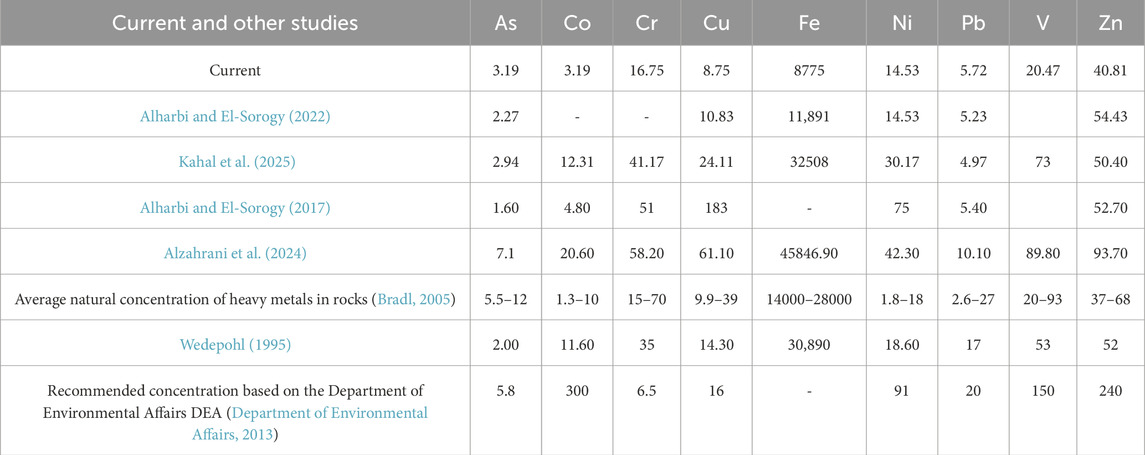
Table 2. Comparison between recommended standard values, other related concentrations, and the current study.
The region’s agricultural activity must be taken into consideration, even though our analysis shows that the heavy metal concentrations in the study area are now low, indicating a favourable environmental state. Agriculture, despite its economic significance, may present long-term problems for soil quality, especially when it comes to the buildup of heavy metals from sources like pesticides, fertilisers, and irrigation water. Consequently, it is crucial to regularly monitor and evaluate the levels of HMs in the soils of the study area. Achieving sustainable growth in the area requires maintaining these low levels. Assuring healthy soil for the production of safe and plentiful food is one of the Sustainable Development Goals (SDGs) of the UN, particularly SDG 2: Zero Hunger (Lile et al., 2023; Einar et al., 2025).
3.3 Pearson correlations between HMs
In general, complex interactions describe the metals found in soils (Nazzal et al., 2016). The findings of a Pearson’s correlation coefficient matrix for the metals in the examined soil samples are shown in Table 3. Analyzing the matrix exposes details on the carrier substances and chemical associations of metals in the study area, as well as proof that some variables are related. All of the HMs under analysis showed positive correlations, with the exception of Zn. This suggests that the levels and sources of contamination in the research region are almost same (Nazzal et al., 2016). Primarily from natural sources as a result of the soil’s weathering of clay minerals) hydrous aluminum silicates (El-Sorogy et al., 2020; Alharbi and El-Sorogy, 2022). As an alternative, Zn displayed negligible and weak relationships with the other HMs, suggesting that their sources were distinct (Alharbi and El-Sorogy, 2017). NDVI values are negatively correlated with the majority of heavy while a moderate correlation was noted between NDVI values and Zn (0.348). This implies that the current vegetation cover in the area is not directly or visibly impacted by the presence or lower quantities of certain HMs, or that their impacts may be minor and need for further investigation or different measurement techniques. On the other hand, a moderate association with NDVI would suggest that Zn comes from anthropogenic (human-related) sources.
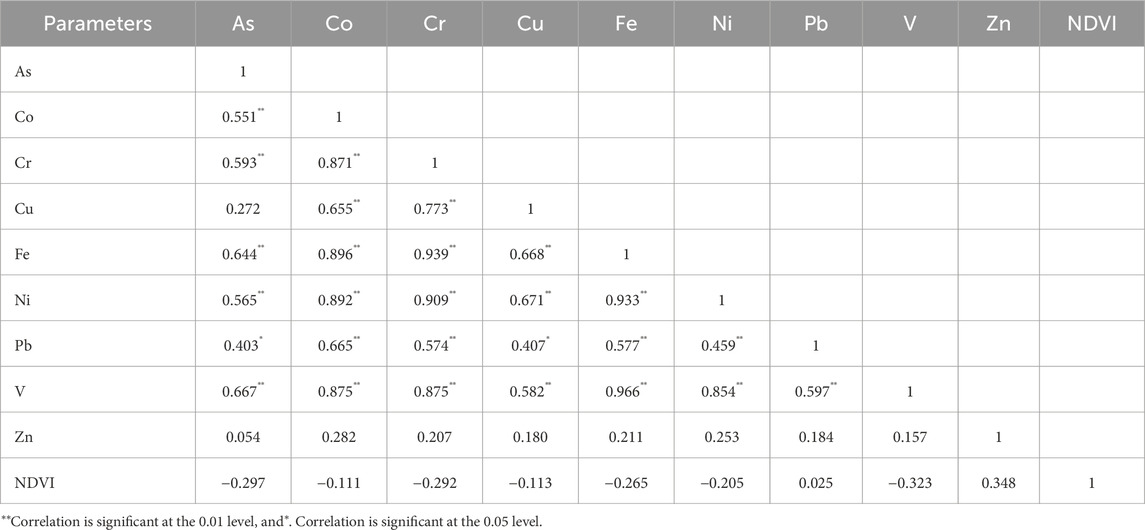
Table 3. HMs’ correlation.
3.4 Principle components analysis (PCA)
The primary causes of data variability were identified using principle components analysis (PCA), which was based on the association between different HMs. Small p-Values (p < 0.05) of the significance level suggest that a PCA would be helpful with this data, which is further confirmed by the Bartlett’s sphericity and KMO tests (Table 4; Hutcheson, 1999). The Bartlett’s sphericity test results are shown in the table. The p-Value that was observed is less than 0.001. A PCA would be helpful for this data because the KMO values were higher than 0.80 (Huck et al., 2004; Tabachnick et al., 2013). Major HMs were sorted using principal component analysis (PCs) to identify those that can help prioritize urgent management. From the examined soil data, two principal components were identified, which accounted for 77.89% of the variation (Table 5). The majority of the variance in the data is explained by the first component (PC1), which accounts for 66.83%.dataset and contains the elements with high variable coefficients (As, Co, Cr, Cu, Fe, Ni, Pb, and V).
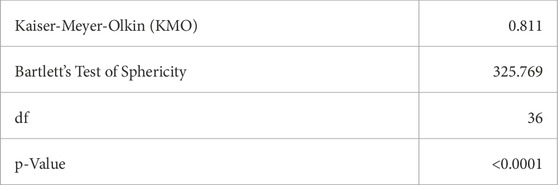
Table 4. KMO and Bartlett’s test.
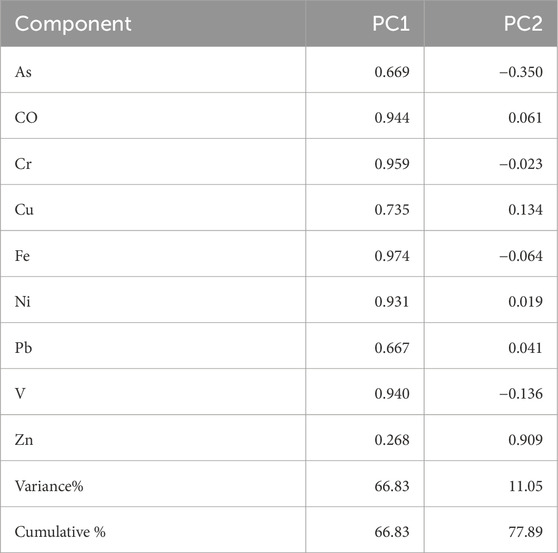
Table 5. PC analysis of studied HMs.
The correlation matrix of the geogenic source for the HMs under investigation is supported by the first PC (PC1), which shows loadings for all HMs except for Zn. The studied HMs, such as arsenopyrite (FeAsS), haematite (Fe2O3), and magnetite (Fe3O4), are among the numerous significant metallic minerals found in the sedimentary rocks of central Saudi Arabia (Reimann et al., 2000; Al-Ateeq et al., 2014; Liu et al., 2021; Alarifi et al., 2022; Table 5). The second component (PC2) has notable positive loadings for Zn and accounts for 11.05% of the total variation.
Pointing to human activities, which may be connected to various fertilizers and agricultural chemicals (Weissmannová et al., 2017; Alharbi et al., 2019).
3.5 Cluster analysis
This technique enables us to distinguish between HMs that has higher disparities between them and similar values (Oldoni et al., 2019). Plotting the ideal number of zones versus the number of clusters is done as illustrated in Figure 5. As seen in Figure 5, two distinct clusters were ultimately found in this investigation. These two groups were taken out of the information gathered through PCA. The findings indicated that cluster 2 (C2) had greater HM concentrations than cluster 1 (C2), (Table 6). The results obtained indicated that there were significant differences between the two clusters regarding As, Co, Cr, Fe, Pb, and V. However, Cu, Ni, and Zn total concentration did not show significant differences between the two clusters. As such, C1 exhibits higher levels of soil contamination indices than C2.
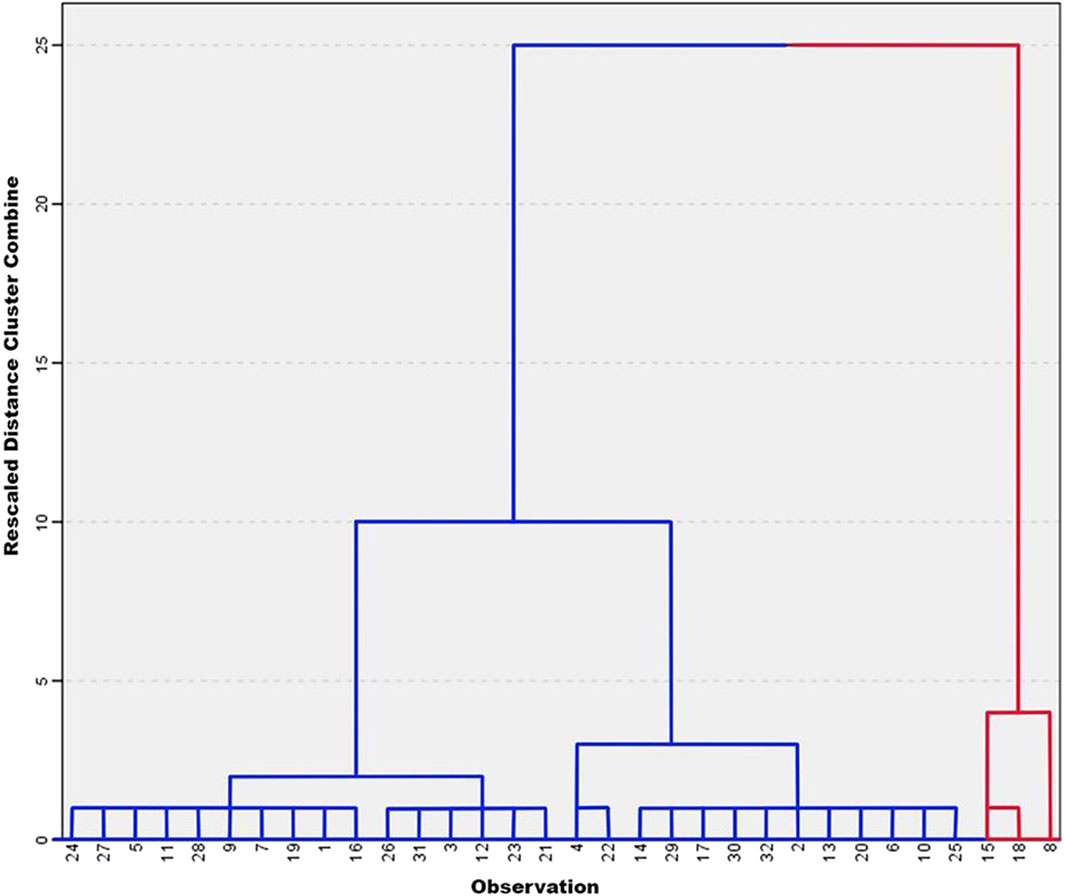
Figure 5. HCA dendogram of observations within the study area.
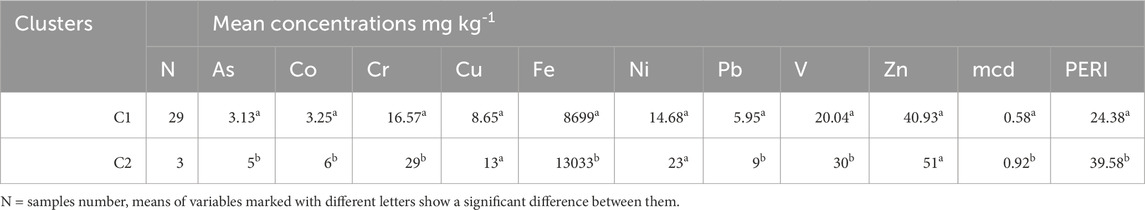
Table 6. Concentrations of HMS under different clusters.
3.6 The contamination status of the study area
Igeo claimed that the soil samples were uncontaminated because they contained less than 1. These findings are in the same line of (Nazzal et al., 2016). Table 7 and Figure 6 show the CF index values of As, which ranged from 1 to 1.5, suggesting that all samples are moderately contaminated. The research area’s CF data showed moderate contamination with Co, Cr, and Fe. Of the soil samples, 3.12% had moderate Cu contamination, while the remaining samples had low Cu contamination (Figure 6). Approximately 15% of the samples were determined to be moderately contaminated by the CF of Ni, whereas approximately 85% were found to be below the low contaminated class. The CF index values of V, which varied from 0.23 to 0.58 in the Table 7 and Figure 6, indicate that all of the samples were low polluted. The study region soil was classified as having a moderate Zn pollution in 21.87% of the 32 composite samples, and low Zn contamination in 78.13% of them (Figure 6). These findings are consistent with those of Al-Wabel et al. (2017). The As’s EF values ranged from 3.22 to 8.58, with an average of 5.71 (Table 8), with 71.88% of samples exposing a significant risk class and 28.12% of samples classified as low risk (Figure 6). V and Pb were low enrichment in 100% of soil samples, but Co, Cr, Cu, Ni, Pb, and Zn were low enrichment in 40.92%, 93.75%, 43.75%, 3.12%, 75.01%, and 18.75% of soil samples, respectively (Table 8; Figure 7). The percentage of soil samples with moderate enrichment was 6.25% for Cr, 56.25% for Cu, 96.87% for Ni, 3.12% for Pb, and 71.88% for Zn (Figure 7). Natural origins for Co and Pb were found in 59.37% and 21.87% of soil samples, respectively. Since the average of PERI, and mCd were 26.6, and 0.6 respectively, all soil samples were considered low polluted (Table 9; Figure 8), the highest values were found in the south of the study area. Showed that the weathering of Jurassic to Quaternary sediments in the research area served as the main natural source of these HMs (El-Sorogy et al., 2017; Farouk et al., 2018). Aside from Zn highlighting human activity that could be linked to different types of fertilizers and agricultural chemicals. Since the main causes of land degradation are inappropriate land use practices, such as inefficient land resource allocation, unbalanced land use, and unsustainable land management strategies, land use models can be combined to simulate future soil pollution and predict the trend of soil pollution in the study area (Liu et al., 2016; Liu et al., 2020; Jafino et al., 2021; Chen et al., 2025). The study’s conclusions on a largely healthy site can be used as a critical starting point for upcoming regional environmental quality evaluations, impacting the creation of policies that focus on conservation and prevention rather than just remediation. Create initiatives for sustained community participation in site health monitoring and management. This promotes a feeling of pride and guarantees the long-term preservation of the region’s natural environment.
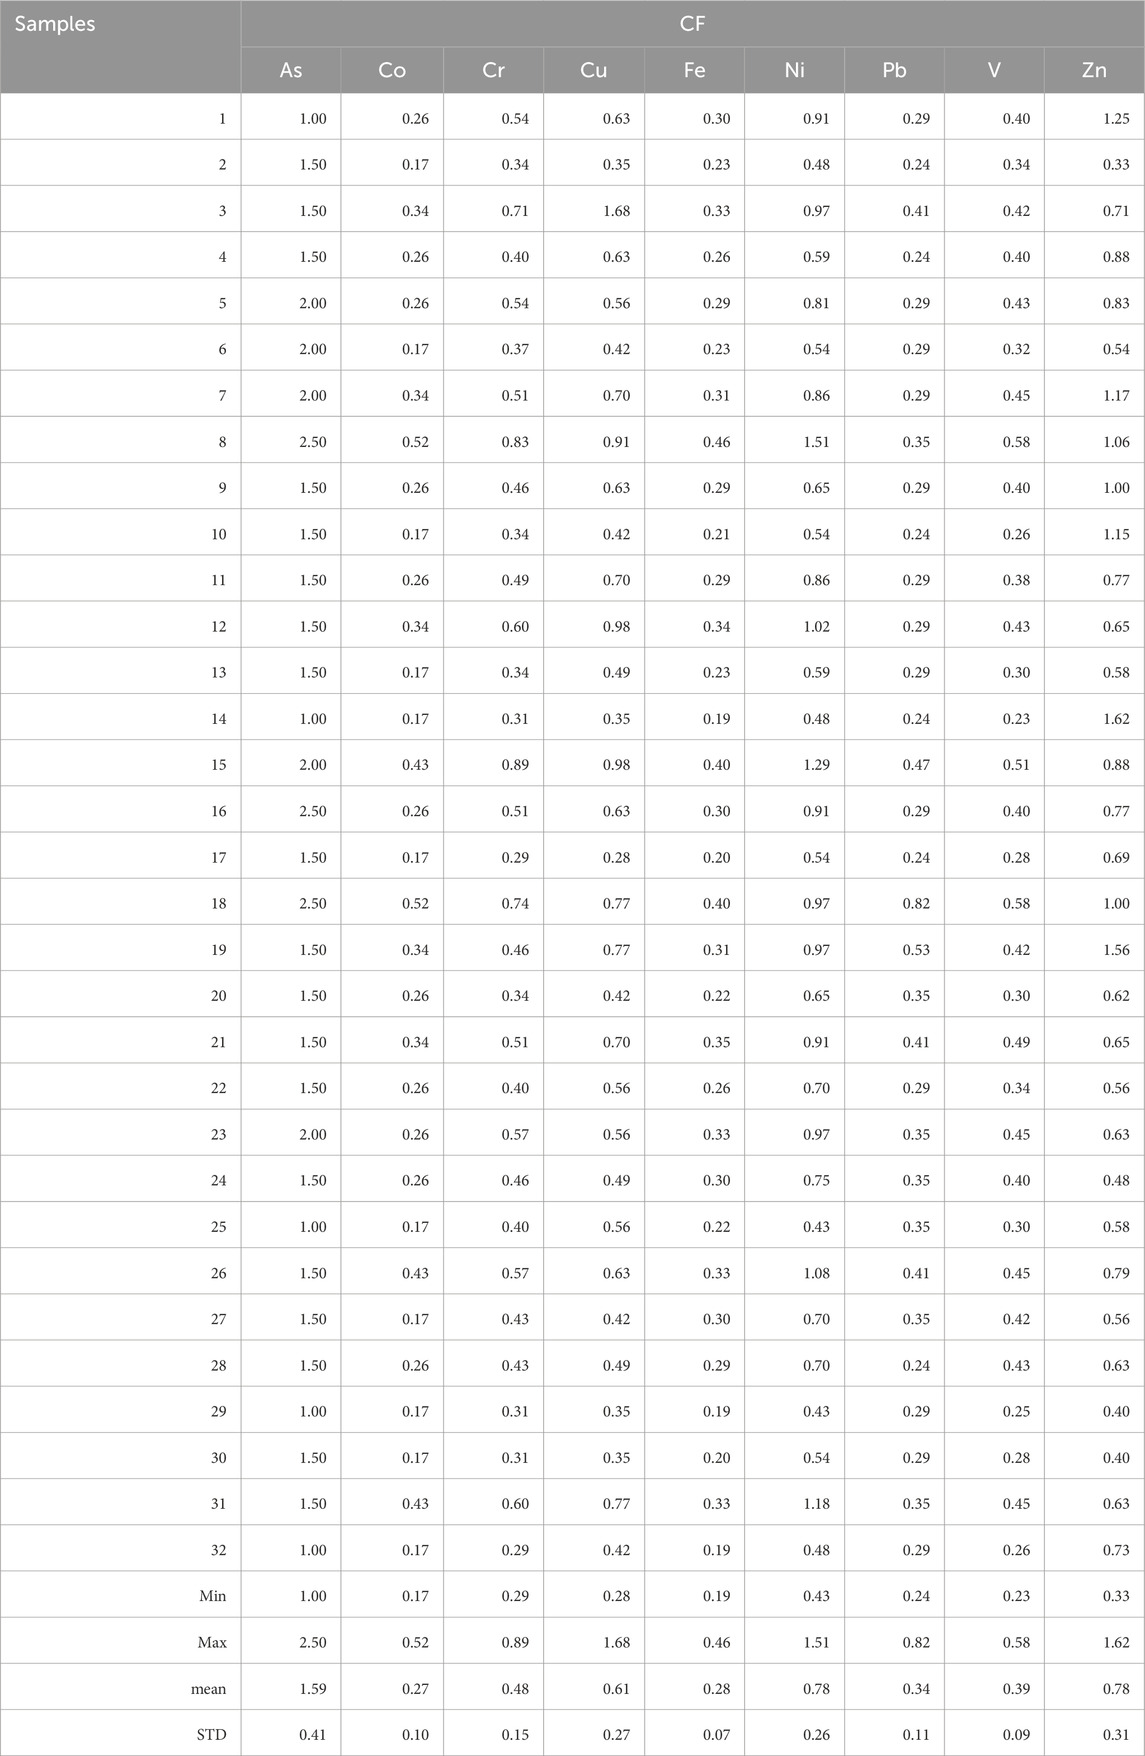
Table 7. The CF values of different soil samples.
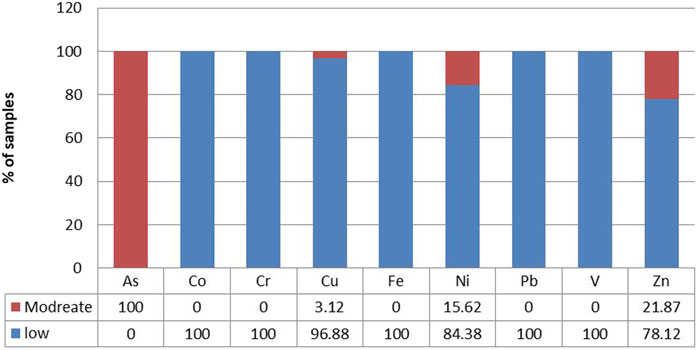
Figure 6. Percentages of CF degrees in the study area.
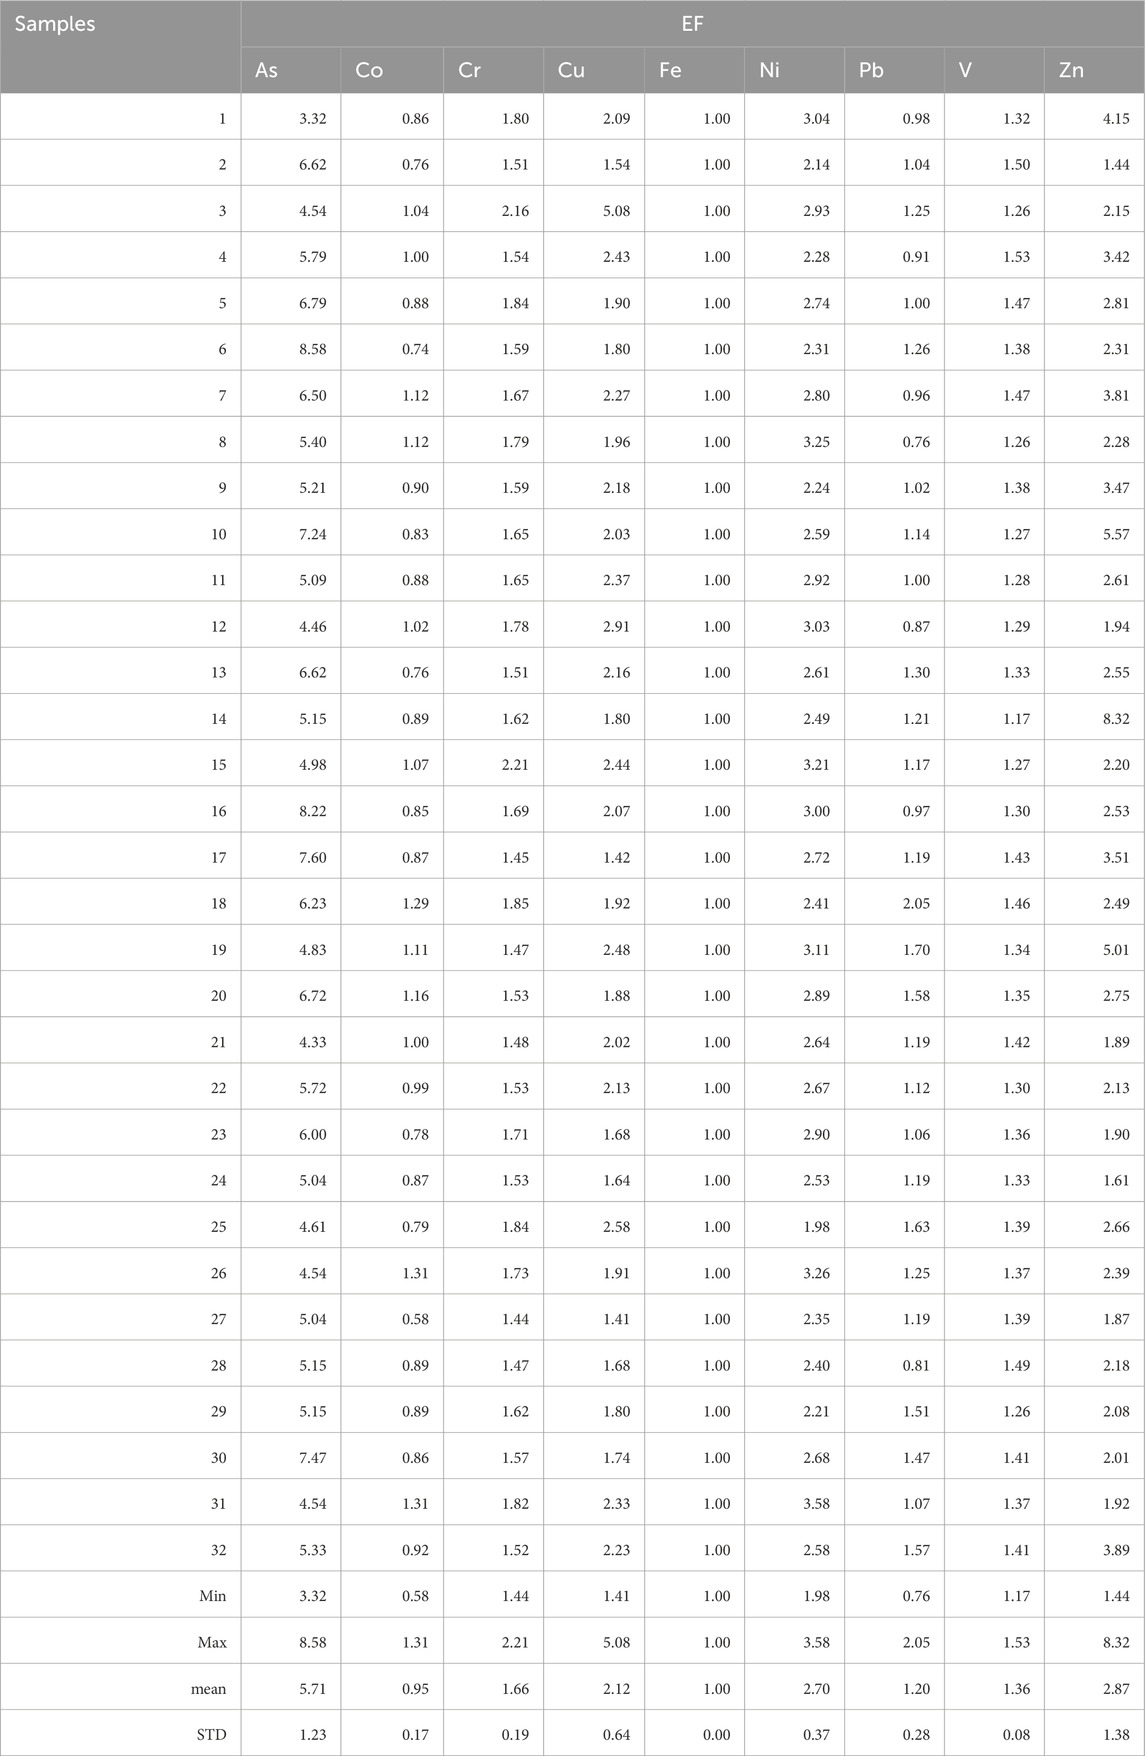
Table 8. The EF values of different soil samples.
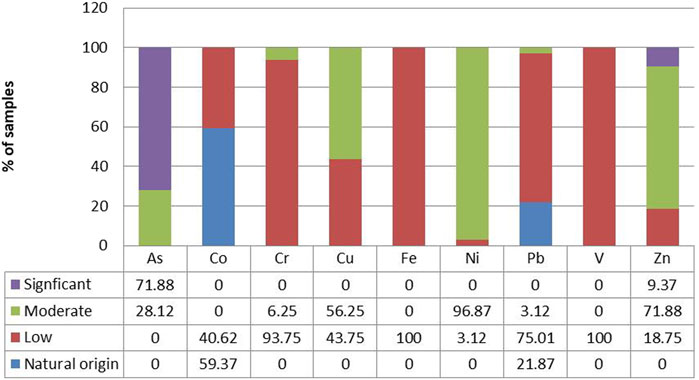
Figure 7. Percentages of EF degrees in the study area.
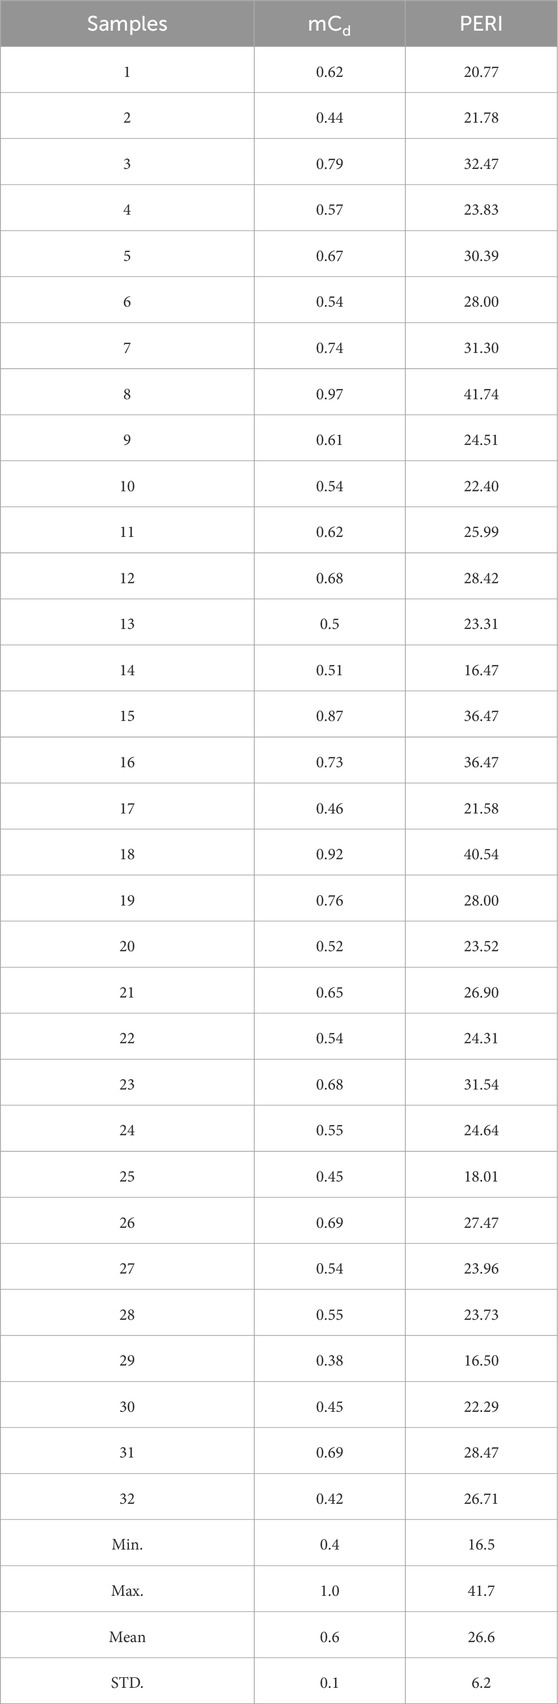
Table 9. The mCd and PERI values of different soil samples.
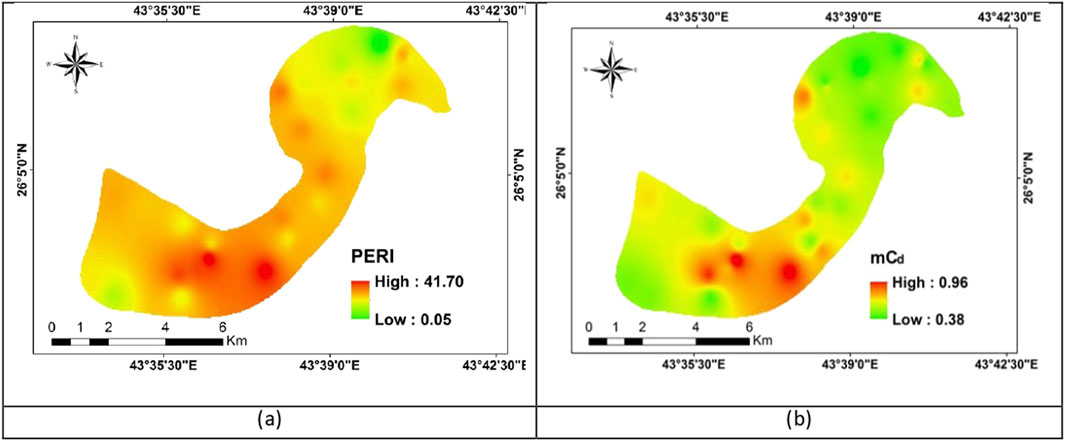
Figure 8. Spatial distribution of (a) PERI and (b) mCd of HMs in the investigated area.
4 Theoretical and practical implications
This study provides a solid theoretical framework for upcoming comparisons with locations that may be polluted, allowing researchers to better comprehend environmental changes and the long-term effects of possible contaminants. Our findings have significant practical ramifications, providing planners and policymakers with useful information for sustainable development, land management, and environmental preservation. Verifying that there are no pollutants in the study area’s soil offers a substantial environmental and financial benefit. These findings can be applied to long-term Environmental Monitoring to guarantee the ongoing lack of contamination in the soil, the study suggests routine monitoring. This makes it possible to take preventative action before problems worsen and helps in the early detection of any changes.
5 Conclusion
The assessment of heavy metal soil pollution in the middle region of the Al Qassim region, which is regarded as one of the most significant barriers to sustainable development and food security, is highlighted in the current study. All soil samples were considered to be low contaminated because the averages for the modified degree of contamination (mCd) and the potential ecological risk index (PERI) were 0.6 and 26.6, respectively. The study region was divided into two zones based on the atypical results of PCA and HCA integration, each of which had a different heavy metal content and pattern. The multivariate analysis indicates that natural rocks are the primary source of these HMs except for Zn which may have an anthropogenic origin (such as fertilization) but is still present in an acceptable amount. The results indicated that the high NDVI values in some places of the research region were caused by Saudi Arabia’s main strategic goals, which were food security, rural development, agricultural productivity, and sustainable resource management. Monitoring HMs pollution is essential to prevent any potential future soil contamination because the research region is included cultivation activities, as shown by the NDVI status and LULC map. Future HMs concentration monitoring in the research region can be guided by the findings of the spatial distribution maps of pollutants and their concentrations. Monitoring HMs pollution is essential to preventing future soil contamination, enhancing human health, ensuring global food security, and achieving the Sustainable Development Goals (SDGs). One methodological constraint of this work is its dependence on the IDW methodology for interpolating HM data. Although this approach was necessary due to the uneven distribution of sampling sites caused by field access constraints, it may have an impact on the accuracy of the geographic projections for heavy metal concentrations. To improve the spatial interpretation of soil contamination, it is advised to increase the sampling size. In addition to achieve greater geostatistical precision and effective metal mapping in comparable regions, it is recommended to construct appropriate sampling distances.
Data availability statement
The original contributions presented in the study are included in the article/Supplementary Material, further inquiries can be directed to the corresponding author.
Author contributions
AE-S: Funding acquisition, Project administration, Supervision, Writing – original draft, Writing – review and editing. KA-K: Funding acquisition, Project administration, Resources, Supervision, Writing – original draft, Writing – review and editing. MS: Conceptualization, Formal Analysis, Investigation, Methodology, Software, Validation, Visualization, Writing – original draft, Writing – review and editing. TA: Funding acquisition, Resources, Supervision, Writing – original draft, Writing – review and editing. Jd: Formal Analysis, Funding acquisition, Investigation, Methodology, Software, Visualization, Writing – original draft, Writing – review and editing.
Funding
The author(s) declare that financial support was received for the research and/or publication of this article. The research was financially supported by the Ongoing Research Funding program, (ORF-2025-1044), King Saud University, Riyadh, Saudi Arabia.
Acknowledgments
The authors extend their appreciation to Ongoing Research Funding program, (ORF-2025-1044), King Saud University, Riyadh, Saudi Arabia.
Conflict of interest
The authors declare that the research was conducted in the absence of any commercial or financial relationships that could be construed as a potential conflict of interest.
Generative AI statement
The author(s) declare that no Generative AI was used in the creation of this manuscript.
Any alternative text (alt text) provided alongside figures in this article has been generated by Frontiers with the support of artificial intelligence and reasonable efforts have been made to ensure accuracy, including review by the authors wherever possible. If you identify any issues, please contact us.
Publisher’s note
All claims expressed in this article are solely those of the authors and do not necessarily represent those of their affiliated organizations, or those of the publisher, the editors and the reviewers. Any product that may be evaluated in this article, or claim that may be made by its manufacturer, is not guaranteed or endorsed by the publisher.
Supplementary material
The Supplementary Material for this article can be found online at: https://www.frontiersin.org/articles/10.3389/feart.2025.1605796/full#supplementary-material
References
Abbas, H., Abuzaid, A. S., Jahin, H., and Kasem, D. (2020). Assessing the quality of untraditional water sources for irrigation purposes in Al-Qalubiya governorate, Egypt. Egypt. J. Soil Sci. 60 (2), 0–166. doi:10.21608/ejss.2020.24569.1343
Abbaspour, N., Hurrell, R., and Kelishadi, R. (2014). Review on iron and its importance for human health. J. Res. Med. Sci. 19 (2), 164–174. Available online at: https://pmc.ncbi.nlm.nih.gov/articles/PMC3999603/
Abdel-Fattah, M. K., Abd-Elmabod, S. K., Aldosari, A. A., Elrys, A. S., and Mohamed, E. S. J. W. (2020). Multivariate analysis for assessing irrigation water quality: a case study of the bahr mouise canal, eastern nile Delta. East. Nile Delta 12 (9), 2537. doi:10.3390/w12092537
Abdel-Fattah, M. K., Mohamed, E. S., Wagdi, E. M., Shahin, S. A., Aldosari, A. A., Lasaponara, R., et al. (2021). Quantitative evaluation of soil quality using principal component analysis: the case study of El-Fayoum depression Egypt. Sustainability 13 (4), 1824. doi:10.3390/su13041824
Abdelsamie, E. A., Abdellatif, M. A., Hassan, F. O., El Baroudy, A. A., Mohamed, E. S., Kucher, D. E., et al. (2022). Integration of RUSLE model, remote sensing and GIS techniques for assessing soil erosion hazards in arid zones. arXiv 13 (1), 35. doi:10.3390/agriculture13010035
Abrahim, G., and Parker, R. (2008). Assessment of heavy metal enrichment factors and the degree of contamination in marine sediments from tamaki Estuary, Auckland, New Zealand. Environ. Monit. Assess. 136 (1), 227–238. doi:10.1007/s10661-007-9678-2
Abuzaid, A. S., Bassouny, M. A., Jahin, H. S., and Abdelhafez, A. A. (2019). Stabilization of lead and copper in a contaminated typic torripsament soil using humic substances. Clean. Soil Air Water 47 (5), 1800309. doi:10.1002/clen.201800309
Abuzaid, A. S., and Bassouny, M. A. (2020). Total and DTPA-Extractable forms of potentially toxic metals in soils of rice fields, north nile Delta of Egypt. Environ. Technol. Innov. 18, 100717. doi:10.1016/j.eti.2020.100717
Abuzaid, A. S., Abdellatif, A. D., and Fadl, M. E. (2021a). Modeling soil quality in Dakahlia governorate, Egypt using GIS techniques. Egypt using GIS Tech. 24 (2), 255–264. doi:10.1016/j.ejrs.2020.01.003
Abuzaid, A. S., and Jahin, H. S. (2021b). Implications of irrigation water quality on shallow groundwater in the nile Delta of Egypt: a human health risk prospective. Environ. Technol. Innov. 22, 101383. doi:10.1016/j.eti.2021.101383
Abuzaid, A. S., Abdel-Salam, M. A., Ahmad, A. F., Fathy, H. A., Fadl, M. E., and Scopa, A. (2022). Effect of marginal-quality irrigation on accumulation of some heavy metals (Mn, Pb, and zn) in TypicTorripsamment soils and food crops. Sustainability 14 (3), 1067. doi:10.3390/su14031067
Abuzaid, A. S., Jahin, H. S., Shokr, M. S., El Baroudy, A. A., Mohamed, E. S., Rebouh, N. Y., et al. (2023). A novel regional-scale assessment of soil metal pollution in arid agroecosystems. Agron. (Basel). 13 (1), 161. doi:10.3390/agronomy13010161
Aggag, A. M., and Alharbi, A. (2022). Spatial analysis of soil properties and site-specific management zone delineation for the south hail region, Saudi Arabia. Sustainability 14 (23), 16209. doi:10.3390/su142316209
Agyeman, P. C., John, K., Kebonye, N. M., Borůvka, L., Vašát, R., Drábek, O., et al. (2021). Human health risk exposure and ecological risk assessment of potentially toxic element pollution in agricultural soils in the district of frydek mistek, Czech Republic: a sample location approach. Environ. Sci. Eur. 33, 137–25. doi:10.1186/s12302-021-00577-w
Akbari, E., Darvishi Boloorani, A., Neysani Samany, N., Hamzeh, S., Soufizadeh, S., and Pignatti, S. (2020). Crop mapping using random forest and particle swarm optimization based on multi-temporal Sentinel-2. Remote Sens. (Basel). 12 (9), 1449. doi:10.3390/rs12091449
Al-Ateeq, M., Ahmed, A., Alhobaib, A., and Al-Saleh, A. (2014). Geochemistry and genesis of base metal-rich Mn–Fe mineralization in volcaniclastic sediments, asfar thwelil area, Saudi Arabia. Arab. J. Sci. Eng. 39, 361–378. doi:10.1007/s13369-013-0870-0
Al-Bagawi, A., Mansour, D., and Aljabri, S. (2021). Contaminations assessment of some trace metals in agricultural soil and irrigation water analysis at hail region Saudi Arabia. J. Optoelectron. Biomed. M. 13, 127–136. doi:10.15251/jobm.2021.133.127
Al-Wabel, M. I., Sallam, A.E.-A. S., Usman, A. R., Ahmad, M., El-Naggar, A. H., El-Saeid, M. H., et al. (2017). Trace metal levels, sources, and ecological risk assessment in a densely agricultural area from Saudi Arabia. Environ. Monit. Assess. 189, 252–21. doi:10.1007/s10661-017-5919-1
Alarifi, S. S., El-Sorogy, A. S., Al-Kahtany, K., and Alotaibi, M. (2022). Contamination and environmental risk assessment of potentially toxic elements in soils of palm farms in northwest Riyadh, Saudi Arabia. Sustainability 14 (22), 15402. doi:10.3390/su142215402
Alarifi, S. S., El-Sorogy, A. S., Al-Kahtany, K., and Hazaea, S. A. (2023). Contamination and health risk assessment of potentially toxic elements in Al-Ammariah agricultural soil, Saudi Arabia. arXiv 35 (7), 102826. doi:10.1016/j.jksus.2023.102826
Alharbi, T., and El-Sorogy, A. (2017). Assessment of metal contamination in coastal sediments of Al-Khobar area, arabian gulf, Saudi Arabia. J. Afr. Earth Sci. 129, 458–468. doi:10.1016/j.jafrearsci.2017.02.007
Alharbi, T., and El-Sorogy, A. S. J. S. (2022). Risk assessment of potentially toxic elements in agricultural soils of Al-Ahsa oasis, Saudi Arabia. Sustainability 15 (1), 659. doi:10.3390/su15010659
Alharbi, T., and El-Sorogy, A. (2019). Assessment of seawater pollution of the Al-Khafji coastal area, arabian gulf, Saudi Arabia. Environ. Monit. Assess. 191 (6), 383. doi:10.1007/s10661-019-7505-1
Alharbi, T., El-Sorogy, A. S., and Al-Kahtany, K. (2024). Contamination and health risk assessment of potentially toxic elements in agricultural soil of the Al-Ahsa oasis, Saudi Arabia using health indices and GIS. Arab. J. Chem. 17 (3), 105592. doi:10.1016/j.arabjc.2023.105592
Ali, R., and Moghanm, F. (2013). Variation of soil properties over the landforms around idku Lake, Egypt. J Egypt. J. Remote Sens. Space Sci. 16 (1), 91–101. doi:10.1016/j.ejrs.2013.04.001
Alloway, B. J. (2012). Heavy metals in soils: trace metals and metalloids in soils and their bioavailability. Springer Science and Business Media.
Aloud, S. S., Alotaibi, K. D., Almutairi, K. F., and Albarakah, F. N. (2022). Assessment of heavy metals accumulation in soil and native plants in an industrial environment, Saudi Arabia. Sustainability 14 (10), 5993. doi:10.3390/su14105993
Alzahrani, Y., Alshehri, F., El-Sorogy, A. S., and Alzahrani, H. (2023). Environmental assessment of heavy metals in soils around Al-Janabeen dam, southwest Saudi Arabia. arXiv 35 (2), 102503. doi:10.1016/j.jksus.2022.102503
Alzahrani, H., El-Sorogy, A. S., Okok, A., and Shokr, M. S. (2024). GIS-And multivariate-based approaches for assessing potential environmental hazards in some areas of Southwestern Saudi Arabia. Toxics 12 (8), 569. doi:10.3390/toxics12080569
Angelidis, M., and Aloupi, M. (1997). Assessment of metal contamination in shallow coastal sediments around mytilene Greece. Int. J. Environ. Anal. Chem. 68 (2), 281–293. doi:10.1080/03067319708030495
Bilal, B., Rabah, K., Chekushina, T., Nouara, B., Khouloud, S., Farid, M., et al. (2024). Geochemical distribution and environmental assessment of potentially toxic elements in farmland soils, sediments, and tailings from phosphate industrial area (NE Algeria). J. Hazard. Mater. 465, 133110. doi:10.1016/j.jhazmat.2023.133110
Borůvka, L., Vacek, O., and Jehlička, J. J. G. (2005). Principal component analysis as a tool to indicate the origin of potentially toxic elements in soils. Geoderma 128 (3-4), 289–300. doi:10.1016/j.geoderma.2005.04.010
Boumaza, B., Chekushina, T. V., Kechiched, R., Benabdeslam, N., Brahmi, L., Kucher, D. E., et al. (2023). Environmental geochemistry of potentially toxic metals in phosphate rocks, products, and their wastes in the Algerian phosphate mining area (tébessa, NE Algeria). Tébessa, NE Algeria 13 (7), 853. doi:10.3390/min13070853
Bradl, H. (2005). “Sources and origins of heavy metals,” in Interface science and technology (Elsevier), 1–27.
Chai, L., Li, H., Yang, Z., Min, X., Liao, Q., Liu, Y., et al. (2017). Heavy metals and metalloids in the surface sediments of the xiangjiang river, Hunan, China: distribution, contamination, and ecological risk assessment. Environ. Sci. Pollut. Res. 24, 874–885. doi:10.1007/s11356-016-7872-x
Chandrasiri, G., Mubarak, M., Mahatantila, K., and Mahanama, K. (2019). Single laboratory validation of determination of 13 trace elements in rice by ICP-MS with an overview of challenges encountered. Am. J. Anal. Chem. 10 (9), 367–376. doi:10.4236/ajac.2019.109025
Chen, L., Beiyuan, J., Hu, W., Zhang, Z., Duan, C., Cui, Q., et al. (2022). Phytoremediation of potentially toxic elements (PTEs) contaminated soils using alfalfa (Medicago sativa L.): a comprehensive review. A Compr. Rev. 293, 133577. doi:10.1016/j.chemosphere.2022.133577
Chen, Y., Zhang, F., and Lin, J. (2025). Projecting future land use evolution and its effect on spatiotemporal patterns of habitat quality in China. Appl. Sci. (Basel). 15 (3), 1042. doi:10.3390/app15031042
Clemente, J., Fontanelli, G., Ovando, G., Roa, Y., Lapini, A., and Santi, E. (2020). “Google Earth engine: application of algorithms for remote sensing of crops in tuscany (italy),” in 2020 IEEE Latin American GRSS and ISPRS remote sensing conference (LAGIRS): IEEE, 195–200.
Daulta, R., Prakash, M., and Goyal, S. (2023). Metal content in soils of northern India and crop response: a review. Int. J. Environ. Sci. Technol. (Tehran). 20 (4), 4521–4548. doi:10.1007/s13762-022-03953-y
Demattê, J. A., Sayão, V. M., Rizzo, R., and Fongaro, C. T. (2017). Soil class and attribute dynamics and their relationship with natural vegetation based on satellite remote sensing. Geoderma 302, 39–51
Department of Environmental Affairs (2013). National norms and standards for the remediation of contaminated land and soil quality in the Republic of South Africa. Pretoria, South Africa: Department of Environmental Affairs (DEA).
Ding, Y. (2019). Heavy metal pollution and transboundary issues in ASEAN countries. Water Policy 21 (5), 1096–1106. doi:10.2166/wp.2019.003
Einar, K., Ibrahim, M., Abdelsamie, E., and Shokr, M. (2025). Modeling land degradation in drylands of the nile Delta using remote sensing and GIS. Egypt. J. Soil Sci. 65 (2), 0–836. doi:10.21608/ejss.2025.360359.1999
El Behairy, R. A., El Baroudy, A. A., Ibrahim, M. M., Mohamed, E. S., Rebouh, N. Y., and Shokr, M. S. (2022). Combination of GIS and multivariate analysis to assess the soil heavy metal contamination in some arid zones. Agron. (Basel). 12 (11), 2871. doi:10.3390/agronomy12112871
El-Sorogy, A. S., Gameil, M., Youssef, M., and Al-Kahtany, K. M. (2017). Stratigraphy and macrofauna of the Lower Jurassic (toarcian) marrat formation, central Saudi Arabia. J. Afr. Earth Sci. 134, 476–492. doi:10.1016/j.jafrearsci.2017.07.001
El-Sorogy, A. S., Youssef, M., Al-Kahtany, K., and Saleh, M. M. (2020). Distribution, source, contamination, and ecological risk status of heavy metals in the red sea-gulf of Aqaba coastal sediments, Saudi Arabia. Mar. Pollut. Bull. 158, 111411. doi:10.1016/j.marpolbul.2020.111411
El-Sorogy, A. S., Al-kahtany, K., Alharbi, T., and Alarifi, S. S. (2024). Distribution patterns, health hazards, and multivariate assessment of contamination sources of As, Pb Ni, Zn, and Fe in agricultural soils. arXiv 36 (11), 103489. doi:10.1016/j.jksus.2024.103489
Ennaji, W., Barakat, A., El Baghdadi, M., Oumenskou, H., Aadraoui, M., Karroum, L. A., et al. (2018). GIS-Based multi-criteria land suitability analysis for sustainable agriculture in the northeast area of tadla plain (morocco). J. Earth Syst. Sci. 127, 79–14. doi:10.1007/s12040-018-0980-x
Ergin, M., Saydam, C., Baştürk, Ö., Erdem, E., and Yörük, R. (1991). Heavy metal concentrations in surface sediments from the two coastal inlets (golden horn Estuary and Izmit Bay) of the northeastern Sea of Marmara. arXiv 91 (3), 269–285.
Farouk, S., Al-Kahtany, K., El-Sorogy, A., and Abd El-Motaal, E. (2018). High-frequency cycles and sequence stratigraphy of the Lower Jurassic marrat formation, central Saudi Arabia. Mar. Pet. Geol. 98, 369–383. doi:10.1016/j.marpetgeo.2018.08.030
Gao, B., Chi, L., Mahbub, R., Bian, X., Tu, P., Ru, H., et al. (2017). Multi-omics reveals that lead exposure disturbs gut microbiome development, key metabolites, and metabolic pathways. Chem. Res. Toxicol. 30 (4), 996–1005. doi:10.1021/acs.chemrestox.6b00401
Gong, G., Mattevada, S., and O’Bryant, S. E. (2014). Comparison of the accuracy of kriging and IDW interpolations in estimating groundwater arsenic concentrations in Texas. Environ. Res. 130, 59–69. doi:10.1016/j.envres.2013.12.005
González, R., Durante, C., Arcagni, M., Juncos, R., Seco Pon, J., Crespo, E., et al. (2021). Effects of pollution in aquatic food chains, 61–89.
Gotway, C. A., Ferguson, R. B., Hergert, G. W., and Peterson, T. A. (1996). Comparison of kriging and inverse-distance methods for mapping soil parameters. Soil Sci. Soc. Am. J. 60 (4), 1237–1247. doi:10.2136/sssaj1996.03615995006000040040x
Guan, Y., Shao, C., and Ju, M. (2014). Heavy metal contamination assessment and partition for industrial and mining gathering areas. Int. J. Environ. Res. Public Health 11 (7), 7286–7303. doi:10.3390/ijerph110707286
Guan, Q., Wang, F., Xu, C., Pan, N., Lin, J., Zhao, R., et al. (2018). Source apportionment of heavy metals in agricultural soil based on PMF: a case study in hexi corridor, northwest China. Chemosphere 193, 189–197. doi:10.1016/j.chemosphere.2017.10.151
Hakanson, L. (1980). An ecological risk index for aquatic pollution control. A sedimentological approach. Water Res. 14 (8), 975–1001. doi:10.1016/0043-1354(80)90143-8
Hammam, A., and Mohamed, E. (2020). Mapping soil salinity in the east nile Delta using several methodological approaches of salinity assessment. arXiv 23 (2), 125–131. doi:10.1016/j.ejrs.2018.11.002
Hammam, A. A., Mohamed, W. S., Sayed, S.E.-E., Kucher, D. E., and Mohamed, E. S. J. (2022). Assessment of soil contamination using gis and multi-variate analysis: a case study in El-Minia governorate, Egypt. Agron. (Basel). 12 (5), 1197. doi:10.3390/agronomy12051197
Harikumar, P., and Jisha, T. (2010). Distribution pattern of trace metal pollutants in the sediments of an urban wetland in the southwest Coast of India.
He, J., Yang, Y., Christakos, G., Liu, Y., and Yang, X. (2019). Assessment of soil heavy metal pollution using stochastic site indicators. Geoderma 337, 359–367. doi:10.1016/j.geoderma.2018.09.038
Hendawy, E., Belal, A.-A. A., Rebouh, N. Y., Shokr, M. S., Mohamed, E. S., Sheta, A. E. A. S., et al. (2024). Assessing surface water quality using risk indicators, geographic information system modeling techniques, and multi-statistical methods in arid regions to maintain the sustainability of water resources. Agron. (Basel). 14 (12), 2834. doi:10.3390/agronomy14122834
Ho, H. H., Swennen, R., and Van Damme, A. (2010). Distribution and contamination status of heavy metals in estuarine sediments near Cau Ong harbor. Ha Long Bay: Vietnam Geology Belgica 13 (1-2), 37–47
Hou, D., O'Connor, D., Nathanail, P., Tian, L., and Ma, Y. (2017). Integrated GIS and multivariate statistical analysis for regional scale assessment of heavy metal soil contamination: a critical review. arXiv 231, 1188–1200.
Hu, J. (1995). “Methods of generating surfaces in environmental GIS applications,” in 1995 ESRI user conference proceedings.
Hu, B., Chen, S., Hu, J., Xia, F., Xu, J., Li, Y., et al. (2017). Application of portable XRF and VNIR sensors for rapid assessment of soil heavy metal pollution. PLoS ONE 12 (2), e0172438. doi:10.1371/journal.pone.0172438
Hutcheson, G. (1999). The multivariate social scientist: introductory statistics using generalized linear models. Thousand Oaks, CA: Sage Publications. doi:10.4135/9780857028075
Jafino, B. A., Kwakkel, J. H., Klijn, F., Dung, N. V., van Delden, H., Haasnoot, M., et al. (2021). Accounting for multisectoral dynamics in supporting equitable adaptation planning: a case study on the rice agriculture in the Vietnam mekong Delta. Earth's. Future 9 (5), e2020EF001939. doi:10.1029/2020ef001939
Jalhoum, M. E., Abdellatif, M. A., Mohamed, E. S., Kucher, D. E., and Shokr, M. (2024). Multivariate analysis and GIS approaches for modeling and mapping soil quality and land suitability in arid zones. Heliyon 10 (5), e27577. doi:10.1016/j.heliyon.2024.e27577
Jiang, X., Lu, W., Zhao, H., Yang, Q., and Yang, Z. (2014). Potential ecological risk assessment and prediction of soil heavy-metal pollution around coal gangue dump. Nat. Hazards Earth Syst. Sci. 14 (6), 1599–1610. doi:10.5194/nhess-14-1599-2014
Jolliffe, I. T., and Cadima, J. (2016). Principal component analysis: a review and recent developments. Phil. Trans. R. Soc. A 374 (2065), 20150202. doi:10.1098/rsta.2015.0202
Jones, L., Bakr, N., Muñoz-Rojas, M., Pereira, P., Zhang, Z., Cerdà, A., et al. (2019). Assessment of soil suitability for improvement of soil factors and agricultural management. Sustainability 11 (iss. 6), 1588. doi:10.3390/su11061588
Kahal, A. Y., El-Sorogy, A. S., Meroño de Larriva, J. E., and Shokr, M. S. (2025). Mapping soil contamination in arid regions: a GIS and multivariate analysis approach. arXiv 15 (2), 124.
Kaminski, M. A., Garrison, T. F., and Yoder, C. E. (2019). The Paleozoic formations of the Al-Qassim province in Saudi Arabia as potential sites for geotourism. geotour. 58-59, 1. doi:10.7494/geotour.2019.58-59.1
Khan, S., Naushad, M., Lima, E. C., Zhang, S., Shaheen, S. M., and Rinklebe, J. (2021). Global soil pollution by toxic elements: current status and future perspectives on the risk assessment and remediation strategies – a review. A Rev. 417, 126039. doi:10.1016/j.jhazmat.2021.126039
Kim, B. S. M., Angeli, J. L. F., Ferreira, P. A. L., de Mahiques, M. M., and Figueira, R. C. L. (2018). Critical evaluation of different methods to calculate the geoaccumulation index for environmental studies: a new approach for baixada santista–southeastern Brazil. Mar. Pollut. Bull. 127, 548–552. doi:10.1016/j.marpolbul.2017.12.049
Lajunen, L. H., and Perämäki, P. (2004). Spectrochemical analysis by atomic absorption and emission. Finland: University of Oulu.
Leon, C. T., Shaw, D. R., Cox, M. S., Abshire, M. J., Ward, B., Wardlaw, M. C., et al. (2003). Utility of remote sensing in predicting crop and soil characteristics. Precis. Agric. 4, 359–384. doi:10.1023/a:1026387830942
Liaghati, T., Preda, M., and Cox, M. J. E. I. (2004). Heavy metal distribution and controlling factors within coastal plain sediments, bells creek catchment, southeast Queensland, Australia. Bells Creek catchment, southeast Qld. Aust. 29 (7), 935–948. doi:10.1016/s0160-4120(03)00060-6
Lile, R., Ocnean, M., Balan, I. M., and Kiba, D. (2023). Challenges for zero hunger (SDG 2): links with other SDGs. 9-66.
Liu, Y., He, Q., Tan, R., Liu, Y., and Yin, C. (2016). Modeling different urban growth patterns based on the evolution of urban form: a case study from huangpi, central China. Appl. Geogr. 66, 109–118. doi:10.1016/j.apgeog.2015.11.012
Liu, X., Huang, Y., Xu, X., Li, X., Li, X., Ciais, P., et al. (2020). High-spatiotemporal-resolution mapping of global urban change from 1985 to 2015. Nat. Sustain. 3 (7), 564–570. doi:10.1038/s41893-020-0521-x
Liu, W., Spinks, S. C., Glenn, M., MacRae, C., and Pearce, M. A. (2021). How carbonate dissolution facilitates sediment-hosted Zn-Pb mineralization. Geology 49 (11), 1363–1368. doi:10.1130/g49056.1
Lizarraga Mendiola, L., Durán Domínguez, M., and González Sandoval, M. (2008). Environmental assessment of an active tailings pile in the state of Mexico (central Mexico).
Luo, X.-S., Xue, Y., Wang, Y.-L., Cang, L., Xu, B., and Ding, J. (2015). Source identification and apportionment of heavy metals in urban soil profiles. Chemosphere 127, 152–157. doi:10.1016/j.chemosphere.2015.01.048
Lv, J., and Yu, Y. (2018). Source identification and spatial distribution of metals in soils in a typical area of the lower yellow river, eastern China. Environ. Sci. Pollut. Res. 25, 21106–21117. doi:10.1007/s11356-018-2256-z
Nazzal, Y., Howari, F. M., Jafri, M. K., Naeem, M., and Ghrefat, H. (2016). Risk assessment through evaluation of potentially toxic metals in the surface soils of the Qassim area, central Saudi Arabia. Cent. Saudi Arab. 135 (2), 210–216. doi:10.3301/ijg.2015.10
Neal, A. P., and Guilarte, T. R. (2013). Mechanisms of lead and manganese neurotoxicity. Toxicol. Res. (Camb). 2 (2), 99–114. doi:10.1039/c2tx20064c
Neetu, , and Ray, S. (2019). Exploring machine learning classification algorithms for crop classification using sentinel 2 data. 42, 573–578.
Nowicka, B. (2022). Heavy metal–induced stress in eukaryotic Algae—Mechanisms of heavy metal toxicity and tolerance with particular emphasis on oxidative stress in exposed cells and the role of antioxidant response. Environ. Sci. Pollut. Res. 29 (12), 16860–16911. doi:10.1007/s11356-021-18419-w
Oldoni, H., Terra, V. S. S., Timm, L. C., Júnior, C. R., and Monteiro, A. B. (2019). Delineation of management zones in a peach orchard using multivariate and geostatistical analyses. arXiv 191, 1–10.
Powers, R., Ramirez, L. F., Redmond, C., and Elberg, J. , E. (1966). Geology of the arabian peninsula: sedimentary geology of Saudi Arabia. Washington: United States Government Printing Office.
Rahman, Z., and Singh, V. P. (2019). The relative impact of toxic heavy metals (THMs)(arsenic (As), cadmium (Cd), chromium (Cr)(VI), mercury (Hg), and lead (Pb)) on the total environment: an overview. Environ. Monit. Assess. 191, 419–421. doi:10.1007/s10661-019-7528-7
Reimann, C., and Caritat, P. D. (2000). Intrinsic flaws of element enrichment factors (EFs) in environmental geochemistry. Environ. Sci. Technol. 34 (24), 5084–5091. doi:10.1021/es001339o
Rhee, J., Im, J. J. A., and Meteorology, F. (2017). Meteorological drought forecasting for ungauged areas based on machine learning: using long-range climate forecast and remote sensing data. arXiv 237, 105–122.
Rouse, J. W., Haas, R. H., Schell, J. A., and Deering, D. W. (1974). Monitoring vegetation systems in the great plains with ERTS. arXiv 351 (1), 309.
Rubio, B., Nombela, M., and Vilas, F. (2000). Geochemistry of major and trace elements in sediments of the Ria de Vigo (NW Spain): an assessment of metal pollution. Mar. Pollut. Bull. 40 (11), 968–980. doi:10.1016/s0025-326x(00)00039-4
Said, M. E. S., Ali, A. M., Borin, M., Abd-Elmabod, S. K., Aldosari, A. A., Khalil, M. M., et al. (2020). On the use of multivariate analysis and land evaluation for potential agricultural development of the northwestern coast of Egypt. Agron. (Basel). 10 (9), 1318. doi:10.3390/agronomy10091318
Shokr, M. S., Abdellatif, M. A., El Behairy, R. A., Abdelhameed, H. H., El Baroudy, A. A., Mohamed, E. S., et al. (2022). Assessment of potential heavy metal contamination hazards based on GIS and multivariate analysis in some mediterranean zones. Agron. (Basel). 12 (12), 3220. doi:10.3390/agronomy12123220
Shomrany, A. A. (2024). “Integrating GIS and remote sensing data for detecting change,” in Agricultural land during 1985-2024 in Qassim region (Mecca, Saudi Arabia: Umm Al-Qura University).
Silalahi, F. E. S., Arifianti, Y., and Hidayat, F. (2019). Landslide susceptibility assessment using frequency ratio model in bogor, West java, Indonesia. Geosci. Lett. 6 (1), 10. doi:10.1186/s40562-019-0140-4
Sintorini, M., Widyatmoko, H., Sinaga, E., and Aliyah, N. (2021). “Effect of pH on metal mobility in the soil,” in IOP conference series: earth and environmental science, The 5th International Seminar on Sustainable Urban Development, August 5, 2020, Jakarta, Indonesia 737 (IOP Publishing).
Sun, Y., Zhou, Q., Xie, X., and Liu, R. (2010). Spatial, sources and risk assessment of heavy metal contamination of urban soils in typical regions of Shenyang, China. J. Hazard. Mater. 174 (1-3), 455–462. doi:10.1016/j.jhazmat.2009.09.074
Tabachnick, B. G., Fidell, L. S., and Ullman, J. B. (2013). Using multivariate statistics. MA: pearson Boston.
Tariq, A., and Shu, H. (2020). CA-Markov chain analysis of seasonal land surface temperature and land use land cover change using optical multi-temporal satellite data of Faisalabad, Pakistan. Pakistan 12 (20), 3402. doi:10.3390/rs12203402
Tian, K., Huang, B., Xing, Z., and Hu, W. (2017). Geochemical baseline establishment and ecological risk evaluation of heavy metals in greenhouse soils from Dongtai, China. China 72, 510–520. doi:10.1016/j.ecolind.2016.08.037
Tucker, C. J. (1977). Use of near infrared/red radiance ratios for estimating vegetation biomass and physiological status.
UNEP (2021). Global assessment of soil pollution: Summary for policymakers. Food Agric. Organ. U. N. Available online at: https://www.unep.org/resources/report/global-assessment-soil-pollution
Weissmannová, H. D., and Pavlovský, J. (2017). Indices of soil contamination by heavy metals–methodology of calculation for pollution assessment (minireview). Environ. Monit. Assess. 189 (12), 616. doi:10.1007/s10661-017-6340-5
Wu, G., Kang, H., Zhang, X., Shao, H., Chu, L., and Ruan, C. (2010). A critical review on the bio-removal of hazardous heavy metals from contaminated soils: issues, progress, eco-environmental concerns and opportunities. J. Hazard. Mater. 174 (1-3), 1–8. doi:10.1016/j.jhazmat.2009.09.113
Wu, Q., Leung, J. Y., Geng, X., Chen, S., Huang, X., Li, H., et al. (2015). Heavy metal contamination of soil and water in the vicinity of an abandoned e-waste recycling site: implications for dissemination of heavy metals. Sci. Total Environ. 506, 217–225. doi:10.1016/j.scitotenv.2014.10.121
Xue, H., Xu, X., Zhu, Q., Yang, G., Long, H., Li, H., et al. (2023). Object-oriented crop classification using time series sentinel images from google Earth engine. Remote Sens. (Basel). 15 (5), 1353. doi:10.3390/rs15051353
Yang, Y., Christakos, G., Guo, M., Xiao, L., and Huang, W. J. E. P. (2017). Space-time quantitative source apportionment of soil heavy metal concentration increments. Environ. Pollut. 223, 560–566. doi:10.1016/j.envpol.2017.01.058
Yang, Y., Yang, X., He, M., and Christakos, G. (2020). Beyond mere pollution source identification: determination of land covers emitting soil heavy metals by combining PCA/APCS, GeoDetector and GIS analysis. Catena (Amst). 185, 104297. doi:10.1016/j.catena.2019.104297
Yang, H., Wang, F., Yu, J., Huang, K., Zhang, H., and Fu, Z. (2021). An improved weighted index for the assessment of heavy metal pollution in soils in Zhejiang, China. Environ. Res. Energy. 192, 110246. doi:10.1016/j.envres.2020.110246
Keywords: HMS, GIS, Al Qassim region, PCA, cluster, dryland, natural weathering
Citation: El-Sorogy AS, Al-Kahtany K, Shokr MS, Alharbi T and de Larriva JEM (2025) On evaluating the possible hazard of soil contamination in arid regions using statistical analysis and GIS techniques. Front. Earth Sci. 13:1605796. doi: 10.3389/feart.2025.1605796
Received: 04 April 2025; Accepted: 05 August 2025;
Published: 28 August 2025.
Edited by:
Beckley Ikhajiagbe, University of Benin, NigeriaReviewed by:
Luís Quinta-Nova, Polytechnic Institute of Castelo Branco, PortugalMohamed Gad, University of Sadat City, Egypt
Musa Saheed, Admiralty University of Nigeria, Nigeria
Copyright © 2025 El-Sorogy, Al-Kahtany, Shokr, Alharbi and de Larriva. This is an open-access article distributed under the terms of the Creative Commons Attribution License (CC BY). The use, distribution or reproduction in other forums is permitted, provided the original author(s) and the copyright owner(s) are credited and that the original publication in this journal is cited, in accordance with accepted academic practice. No use, distribution or reproduction is permitted which does not comply with these terms.
*Correspondence: Mohamed S. Shokr, bW9oYW1lZF9zaG9rckBhZ3IudGFudGEuZWR1LmVn