 Alix Fournier
 Caleb Fox2
 Steven L. Forman
- 1Department of Geosciences, Baylor University, Waco, TX, United States
- 2Department of Statistics, Baylor University, Waco, TX, United States
Water availability is limited in the northern Chihuahua Desert due to increasing aridity and anthropogenic disturbance. This study investigates the groundwater fluctuations in the shallow water table of the Kermit dune field, West Texas, United States, to assess the aquifer’s response to climate variability and human impact. The Kermit dune field’s aquifer may contribute up to 9% of the regional Pecos Valley Aquifer’s annual recharge. Groundwater levels were monitored in three piezometers between 2021 and 2024 in both shallow central dune areas and at the downflow transition to sand sheet deposits. Statistical analyses, using linear regression, ANOVA, and mixed effects models, revealed that central groundwater (1–3 m deep) responds to precipitation with peak rise at a 3-day lag post-rainfall, while no recharge signal was detected for deeper groundwater (5–7 m deep), likely due to the thicker vadose zone and denser vegetation cover of high water-use plants, up to 80 L/day. Both areas seemed influenced by daylight duration and exhibited consistent daily cycles (5–8 mm), suggestive of evapotranspiration influence. Over the monitoring period, groundwater levels declined by ∼1.2 m on average, likely exacerbated by the formation of a dredge pond associated with mining operations. Additionally, consistently elevated electric conductivity (EC) measured post oil or produced water spill in 2022 indicated potential long-term groundwater contamination. These results highlighted the vulnerability of the shallow unconfined Kermit dunal aquifer to climate changes and anthropogenic disturbance, with implications for regional water sustainability and land surface stability.
1 Introduction
The northern Chihuahua Desert of West Texas is one of the driest regions of North America with acutely limited groundwater resources (Fournier et al., 2024; Jones, 2008; Kandakji et al., 2021; White, 1971). Water availability is severely limited because of rising water demands, increasing summer temperatures (Fournier et al., 2024), up to 50% decrease in precipitation since the 1980s (Arias et al., 2015; Barandiaran et al., 2013; English et al., 2020; Heo et al., 2015; Scanlon et al., 2022), and elevated evapotranspiration rates (Fournier et al., 2024; Open ET, 2025). This water scarcity translates into decreasing water accessibility, quality and levels in reservoirs, rivers and the regional aquifers (Chaudhuri and Ale, 2014; Cheek and Taylor, 2016; Huggins et al., 2022; Nielsen-Gammon et al., 2020). Indeed, the static level of the Ogallala and the Pecos Valley Aquifers in the area have lowered by up to 100 cm/year since the 1950s (Bruun et al., 2016; Haskell et al., 2022; Hassani et al., 2021; Howell, 2021; Langman and Ellis, 2010; Pathak et al., 2022; Yubing et al., 2022). Additionally, an increase in stream intermittency in the past 20 years was observed in the southwest of the U.S. often associated with less precipitation and depletion of groundwater resources (Forman et al., 2023; Zipper et al., 2021). Also since 2000, aridity has dominated the southwest of the United States with mean annual precipitation 8.3% below the 1950–1999 average and temperatures 0.9 °C above average, leading to major reservoirs reaching their lowest point on record in 2021. This megadrought has been the dryest and longest period since at least ca. 800 years, surpassing the megadrought of the late 1500s (Seager et al., 2023; Williams et al., 2022).
In many arid and semi-arid aeolian environments, including dune systems, groundwater levels are subject to long-term (annual and seasonal) and short-term (e.g., daily) fluctuations which can modify flow direction within the aquifer (Gribovszki et al., 2010; Shimojima et al., 2013). Daily groundwater fluctuations may reflect the impact of evapotranspiration and water usage. Specifically, the level of shallow, unlithified, and sand-rich aquifers may decline with evapotranspiration during daytime and, as night temperatures cool, rise with interstitial condensation (Fan et al., 2008; Gribovszki et al., 2010; Wang et al., 2014). For example, groundwater level and flow direction fluctuate seasonally in the Zhangliansheng lake - dune system in Inner Mongolia. Water levels peak in late autumn and are lowest in the summer. In addition, in autumn and early winter, groundwater flows from Lake Gonggedan into surrounding sand dunes, whereas groundwater flow reverses from the dunes into the lake with higher water table elevations in spring and summer (Wang et al., 2020). Also, in the CSIRO Yalanbee Experimental Station at Bakers Hill, Western Australia, the water table elevation rises during the wet winter season and drops in the dry summer. Soil water content undergoes a diurnal trend of decreasing water level from early morning (06:00 h) to late afternoon (16:00–18:00 h), with alternating soil-water evaporation followed by condensation of soil-vapor (Shimojima et al., 2013). Further, in Escalante Valley, Utah, the groundwater level in vegetated areas and areas with shallow water table decreases during the day and rises at night by >1 cm. This daily cycle may be the result of evaporation and plant uptake, with this variation undetectable during freezing weather in the fall but reappearing in the spring (White, 1932).
Dune fields are common features on the Southern High Plains and in the northern Chihuahua Desert and may host substantial groundwater resources. Most previous studies on groundwater in eolian systems focused on coastal dunes and undisturbed systems. Only a few studies considered inland dune fields. To the authors’ knowledge no previous study evaluated the hydrologic responses of dunal aquifers in semi-arid climates to environmental factors and the cumulative impact of anthropogenic disturbance, using continuous high-resolution monitoring. This study focuses on analyzing macro >1 m and micro <0.01 m level fluctuations of the water table in the Kermit dune field, West Texas, United States, where an extensive aquifer has been identified following the installation of proppant mining operations in 2016 (Fournier et al., 2024) (Figure 1). This aquifer may contribute up to 9% of the annual recharge in the regional Pecos Valley Aquifer but it could be compromised by increasing drought conditions and anthropogenic surface disturbance (Fournier et al., 2024). Three monitoring wells were established with piezometers equipped with data loggers measuring the static water level fluctuations between December 2021 and June 2024. These three wells are in distinctly different areas of the Kermit dune field with well KER21-MW2 at the transition between active dunes and sand sheet, and wells KER21-MW1 and KER21-MW3 in the central, active dunes area. The daily and seasonal aquifer fluctuations are evaluated in respect to nearby surface temperature, precipitation, evapotranspiration and daylight time series, and anthropogenic activities. We hypothesize that the Kermit Dunal Aquifer (KDA) responds daily and seasonally to environmental factors under undisturbed conditions and that the development of anthropogenic activity, specifically sand mining, and increasing drought conditions are driving the aquifer’s depletion.
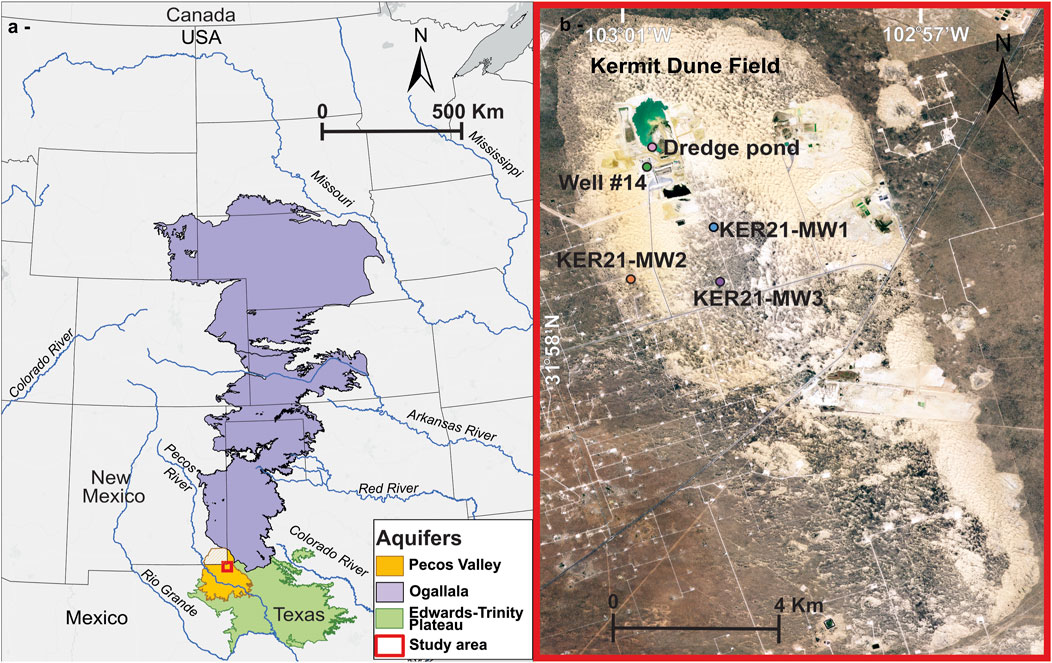
Figure 1. (a) Location of the Kermit dune field in Texas, United States. (b) Location of the monitoring wells, the water well #14 and of the electric conductivity profile in the dredge pond on the Kermit dune field.
2 Hydrologic context of the Kermit dune field
The Kermit dune field receives annually ∼300 mm of precipitation, with a net evapotranspiration of 330 mm/year (Figure 2) (National Oceanic and Atmospheric Administration, 2024; Open ET, 2025). The majority of the precipitation occurs between May and September (64%), corresponding to the North American Monsoon season in the southwest U.S. and to the most active period for low level jets, bringing moisture from the Gulf of California and the Gulf of Mexico (Arias et al., 2015; Barandiaran et al., 2013). The mean annual temperature is 18.7 °C with a 2 °C increase since 1959 (National Oceanic and Atmospheric Administration, 2024; Open ET, 2025). Decreasing precipitation concomitant with high evapotranspiration rates results in annual water deficits, enhanced by unroofing of the water table since 2017 from proppant mining operations. For example, in 2023, precipitation and evapotranspiration were respectively 201 mm and 367 mm, with net water deficit of 166 mm. In contrast, for 2017 there was 432 mm of precipitation and 349 mm of evapotranspiration, resulting in ∼83 mm of water excess.
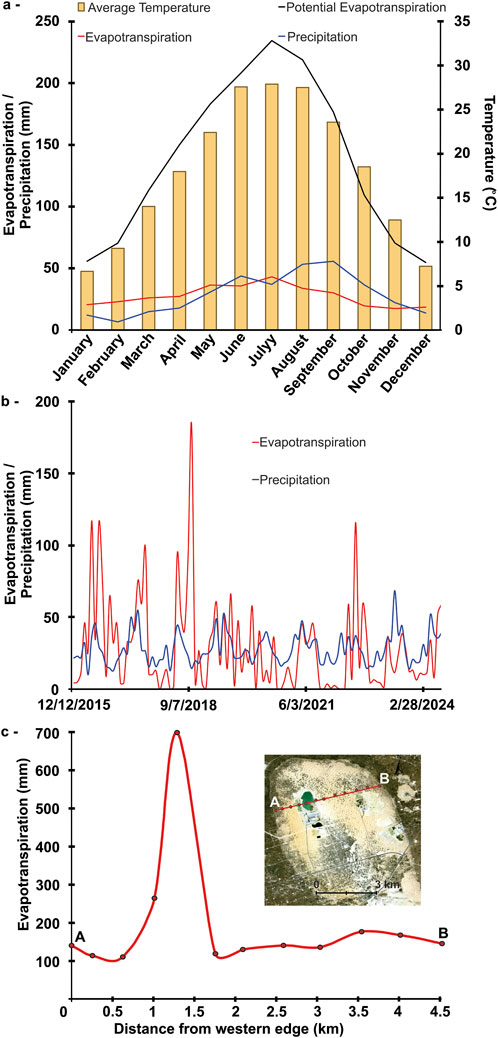
Figure 2. (a) Monthly average of precipitation, temperature (National Oceanic and Atmospheric Administration, 2024), potential evapotranspiration for the town of Midland, TX, United States (TexasET Network, 2025), and modeled evapotranspiration on the Kermit dune field (Fournier et al., 2024; Open ET, 2025); (b) Precipitation and evapotranspiration since the beginning of mining operations on the Kermit dune field in 2016 (Open ET, 2025); (c) Evapotranspiration and evaporation across the Kermit dune field and the dredge pond in October 2024 (Open ET, 2025).
Groundwater replenishment in the Kermit Dunal Aquifer (KDA) comes from precipitation infiltrating on central, bare active dunes, with rates up to 250 mm/h (Figure 3) (Berger, 1992; Fournier et al., 2024). A prior analysis indicates that groundwater flows toward the southwest, parallel to the slope of an underlying Pliocene/Pleistocene red clay aquitard 15–40 m below the surface (Fournier et al., 2024). Discharge for the KDA occurs through evapotranspiration, particularly in areas with a shallow water table, within 3 m of the surface, and inferred flow to the underlying regional Pecos Valley Aquifer. The Kermit dune field may contribute up to 9% of the annual recharge of the regional Pecos Valley Aquifer (Fournier et al., 2024). Another source of water loss since 2016 from the KDA may be from sand mining activities, through pumping and exposure of the water table to evaporation up to 1700 mm/year from a ∼0.5 km2 dredge pond (Mace and Jones, 2023; Open ET, 2025). The total estimated volume of water stored in the Kermit Dunal Aquifer (KDA) is ∼0.1 km3, from 3D modeling of 82 borehole logs through the Kermit dune field (Fournier et al., 2024).
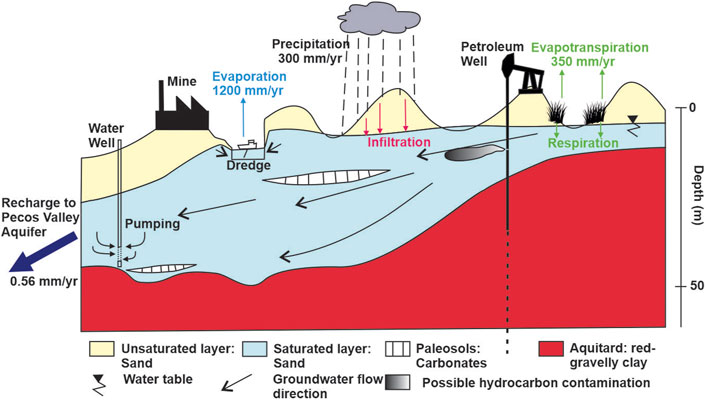
Figure 3. Schematic cross-section of the water inputs and outputs in the Kermit dune field, and processes involved, modified from (Fournier et al., 2024).
3 Methods
3.1 Groundwater monitoring
3.1.1 Piezometers installation
Three piezometers were installed in the Kermit dune field between August and December 2021, using a Geoprobe model 6620DT and three 1.9 cm diameter Geoprobe Prepacked Screen Monitoring Wells with PVC tubing. Wells KER21-MW1, MW2 and MW3 (Figure 1) were drilled to 4 m, 7.6 m, and 5 m depths respectively. Initial water depth was measured with an In Situ E-line at 2.1 m in KER21-MW1, 5.4 m in KER21-MW2 and 1.8 m in KER21-MW3. The piezometers were placed in the wells 2 m below the initial water level. Previously, cores of sediments, KER21-2, 5 and 7 (Fournier et al., 2024), had been taken at the location of the monitoring wells and analyzed for pedogenesis, optically stimulated luminescence dating (OSL) and particle size repartition.
KER21-MW1, located in the central active part of the dune field, was equipped with a telemetric In-Situ Vulink, including built-in barometric correction at ± 1 hPa, connected through a vented cable to a LevelTROLL 400 logger with a pressure range of 11 m or 30 ± 1.5 psi, a resolution of 0.15 psi, and temperature sensor accuracy of 0.1 °C. This logging system was activated on August 20, 2021, but due to low network connectivity and equipment failure, the record ends on May 16, 2022. The two other piezometers, KER21-MW2 and KER21-MW3, were equipped with Van Essen Micro-Divers, paired with one Baro-Diver, all activated on December 16, 2021. The Baro-Diver was secured on the outside of KER21-MW3 as it covers a radius up to 1.6 km. The Micro-Divers have a 10 m ± 3 cm pressure range, a 2 mm resolution, 0.1 °C temperature accuracy, and measure the absolute pressure above the logger, which includes both atmospheric and water columns.
3.1.2 Water table measurements
The depth to water table and coincident barometric pressure measurements were taken every 4 h between August 2021 and May 2022 in Ker21-MW1, and from December 2021 until June 2024 in both KER21-MW2 and MW3 (Supplementary Table S1). The barometric correction is done on Van Essen Office-Diver software using the Baro-Diver record to remove the effect of atmospheric pressure and obtain the corrected height of the water column above the loggers in KER21-MW2 and 3. The depth to water is then calculated by deducting the height of the water column above the logger to the depth of the logger in the well. In KER21-MW1, the barometric correction and calculation of depth-to-water are systematically done by the VuLink.
3.1.3 Electric conductivity
On-site measurements of the depth to water, temperature and electric conductivity were taken using a Solinst Model 107 TLC Meter, with a 5% or 100 µS accuracy for conductivity and ±0.2 °C for temperature, in the three monitoring wells between installation in 2021 and June 2024 (Supplementary Table S2). The Solinst E-line was calibrated before each trip to the Kermit dune field using two standard solutions with known conductivity of 1413 and 5000 µS. The probe was cleaned with de-ionized water between each measurement location. The manufacturer indicates that the temperature sensor does not require calibration. Additionally, electric conductivity and temperature profiles were taken on October 8, 2024, in the monitoring wells, an abandoned water well #14 and in the dredge pond (Figure 1). Each measurement was performed in-situ. The electric conductivity EC was corrected using the linear temperature compensation method for temperature difference from the reference temperature of 25 °C (Equation 1):
Where ΔT = T- 25, the reference temperature of 25 °C subtracted to the groundwater temperature at the time of measurement (Pawlowicz, 2008; Wagner et al., 2006).
3.2 Statistical data processing
3.2.1 Seasonal aquifer fluctuations
The aquifer response to precipitation was analyzed daily for monitoring wells KER21-MW2 and KER21-MW3 between December 2021 and June 2024. The shorter record period of monitoring well KER21-MW1 only included a small amount of precipitation events and the record did not match the monitoring period of the other wells; therefore, it was excluded from the analysis. The statistical analysis was performed in R (Team, 2022) using the tidyverse (Wickham et al., 2019), forecast (Hyndman et al., 2024), feasts (O'Hara-Wild and Wang, 2023), lme4 (Bates et al., 2015), and WRS2 (Mair and Wilcox, 2020) packages. Daily average water levels were calculated from the six measurements taken per day in both monitoring wells and then differenced to consider the daily change in water level. Data recovery led to missing measurements on November 22, 2022, in KER21-MW3, requiring the daily average to be linearly interpolated to satisfy the time series analysis requirement of a complete record. The differenced data appeared adequately stationary and showed a clear autocorrelation in the 1st order autoregression model structure in KER21-MW3, and a less clear but still significant autocorrelation structure in KER21-MW2 (Supplementary Figure S2). Cross-correlation plots were used to detect significant autocorrelation between the depth to water in each well and the exogenous variables, precipitation and evapotranspiration. These plots showed no evident relationship between daily evapotranspiration and the depth to water throughout the entire record; therefore, evapotranspiration was not included in the statistical models. However, a strong cross-correlation was observed between precipitation and change in depth to water for KER21-MW3 with a 3-day lag peak. We modeled the mean depth
The regression model predictors include the previous day’s depth to water Dt-1 and the precipitation Pt-i over the previous 3 days. The intercept
A linear regression model with a lagged autoregressive term was selected for simplicity while providing estimates consistent with other models. The selected model captures the general trend in both wells, while relying on bootstrap methods to provide robust inferences. Generalized least squares (GLS) and ARIMAX models were also considered to estimate the impact of precipitation on the mean change in depth to water. However, both GLS and ARIMAX handle the autocorrelation structure in the error term rather than the mean so the estimated impact of precipitation is not necessarily isolated from the autoregressive nature of the process. Furthermore, in KER21-MW3 the Akaike Information Criterion (AIC) score was much lower for the regression model than for GLS and ARIMAX. For KER21-MW2, neither models showed impact of precipitation on the mean depth to water.
3.2.2 Daily trend analysis
The records of water table fluctuations in monitoring wells KER21-MW2 and KER21-MW3 highlighted a daily micro cycle with variations of ±5–8 mm, above the dataloggers precision of ±2 mm. The first measurement of the day was set as reference that following values were subtracted from. A robust two-way analysis of variance (ANOVA) model for the median depth change by hour of day and season was estimated to detect a daily trend (Mair and Wilcox, 2020). The robust model for the median was selected due to large outliers in the water table change. The hourly variations in water table elevation were not compared to precipitation or evapotranspiration because the available records only contain daily averages.
The impact of temperature and daylight on the daily trend of the depth to water in KER21-MW2 and MW3 were estimated using mixed effects models (Equation 3). Separate models had to be used due to the significant correlation between maximum temperatures and number of daylight minutes. Each model was fitted for the depth to water on day i at hour j, with a random effect included for the date of measurement. The first model included the daily maximum temperature and its interactions with the time of day as a fixed effect. The second model included the number of daylight minutes and its interactions with the time of day as a fixed effect. The resulting estimates highlighted a correlation between each predictor and the change in depth at the given time, but it is not clear what is causing that change. The temperature and daylight variables were both centered and scaled with a mean of 0 and standard deviation of 1 to improve the model estimation. The random effect models for each well is
Xi is the predictor at day
4 Results
4.1 Water table fluctuations and response to precipitation and evapotranspiration
The fluctuations of the water table were measured in three monitoring wells in the Kermit dune field, KER21-MW1, 2 and 3 (Figures 1, 4), between August 2021 and June 2024. Throughout the recording period, the water table is deepest, 5–7 m from the surface, in KER21-MW2 located on the western edge of the dune field, and shallower, 0.7–3 m, in wells KER21-MW1 and KER21-MW3, in central areas of the dune field. Higher water table elevations in the central dunes (∼908 masl, KER21-MW1) compared to southerner central dunes (∼906 masl, KER21-MW3), in turn higher than at the western transition from dune field to sand sheet (∼898 masl, KER21-MW2), confirm the overall southwestward groundwater flow direction previously inferred (Fournier et al., 2024). Due to equipment failure in KER21-MW1 early in the study, the record was not analyzed and there is no result for this piezometer.
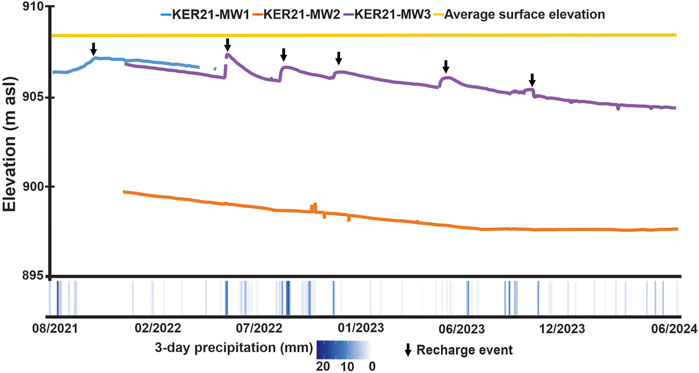
Figure 4. Groundwater elevation in the monitoring wells, KER21-MW1, KER21-MW2 and KER21-MW3, compared to records of precipitation on the Kermit dune field, from Open ET. The black arrows indicate peaks of recharge events.
Throughout the period of record, five distinct episodes of recharge were measured in KER21-MW3, while no recharge episodes are observed for KER21-MW2, confirmed by analyses of the statistical models (Equation 2). Neither well showed a correlation between the daily change in depth to water and associated evapotranspiration (Supplementary Figure S2). The cross-correlation plots (Figure 5) indicate that recharge in KER21-MW3 follows precipitation events, with peak levels after a 3-day lag, while no significant recharge is observed for KER21-MW2. The same regression model (Equation 2) was applied to both wells and yielded residuals with no significant autocorrelation (Supplementary Figure S3). The sudden changes in depth to water seemed more extreme than expected from the assumed normal distribution, showing that the model captures the general trend but the standard error estimates may be biased. A moving block bootstrap was applied to both wells to produce confidence intervals for the parameters mentioned in Section 3.2.1 (Equation 2).
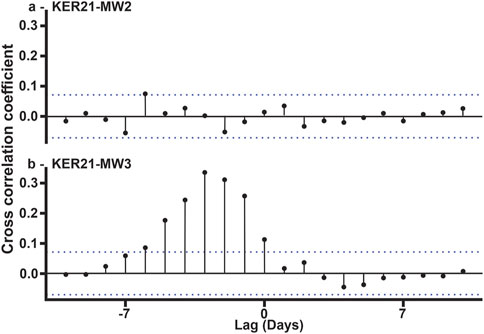
Figure 5. Cross-correlation function for (a) KER21-MW2 and (b) KER21-MW3's monitoring record with precipitation.
The coefficients in the regression model for KER21-MW3 are statistically significant at the 95% confidence level (Table 1). The intercept
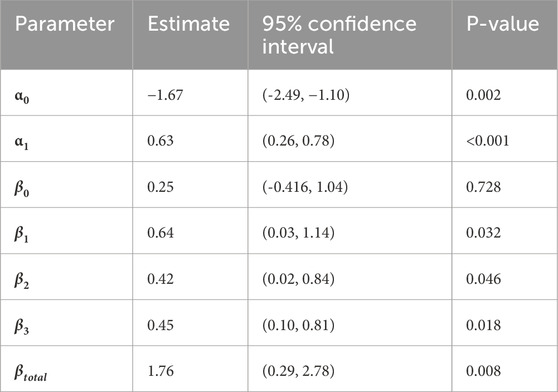
Table 1. Coefficient estimates for the regression model with lagged predictors for the mean change in depth to water of KER21-MW3. The βx coefficients relate to precipitation expressed in mm. The α coefficient describes the water depth relative to the previous day and is unitless.
In contrast, the water table in monitoring well KER21-MW2 appears insensitive to precipitation events, with a monotonic 1.2 m increase in depth to water over the complete record, at a rate of 2 mm/day (Figure 4). The regression model accounts for the autocorrelation in the change of depth to water, but none of the parameter estimates for precipitation influence coefficients
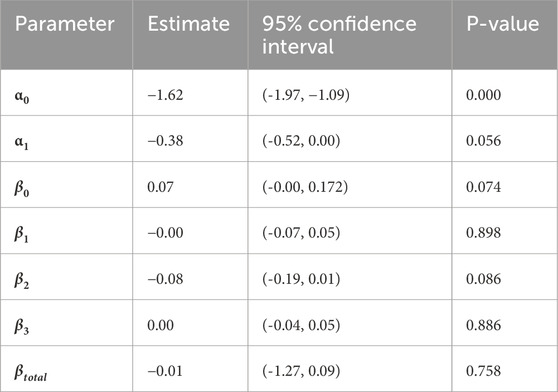
Table 2. Coefficient estimates of the precipitation coefficients for the ARIMA model for the mean change in depth of Ker21-MW2. The βx coefficients relate to precipitation expressed in mm.
4.2 Daily fluctuations of the water table
The depth to water in the monitoring wells was measured every 4 h between 2021 and 2024 to infer a potential daily fluctuation. For this purpose, the first measurement of each day was used as a reference against each of the following measurements (Figure 6). Of note is that some days had a different first time of measurement and had to be excluded from the ANOVA model to fit the data consistency requirement as well as outliers present in the data but not included in the plot. However, this did not significantly impact the result of the analysis. In the two-way ANOVA model, both hour and season were found to be significant with p-values less than 0.001. However, the interaction between hour and season resulted in a p-value of 0.09 which is not significant at the selected 0.05 level, and lead to the conclusion that the depth to water varies daily by ± 5–8 mm and across seasons by up to 40 cm. In KER21-MW3, the water table seems to drop earlier, before 05:00, than in KER21-MW2 where the lowest levels are reached after 09:00. The water table then rises back in KER21-MW3 and is close to the original level by 13:00, while in KER21-MW2, the rise is not observed until 17:00. The seasonal effect also appears greater for KER21-MW3, where the water table is notably lower during mid-day in the spring and summer.
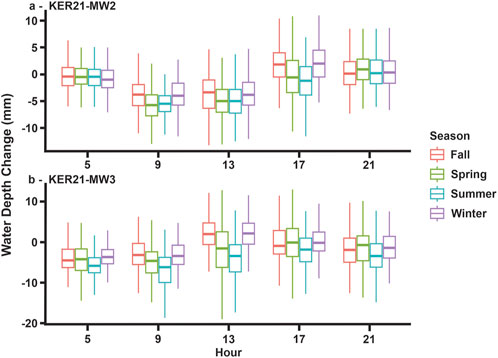
Figure 6. Box plots showing the daily cycle in (a) KER21-MW2 and (b) KER21-MW3.
The water table fluctuations were also compared to records of maximum daily temperature and daylight duration using distinct mixed effects models described in (Equation 3) (Figure 7). The daily maximum temperature was used to correct for strong multicollinearity between the time of day and temperatures. The residuals for the mixed effects models showed similar outliers to the linear regression models so a bootstrap was applied to compute the confidence intervals and p-values. The measurements were resampled per day to compute daily bootstrap estimates and preserve the daily variation within the bootstrap. Daylight seemed to negatively impact the depth to water at 05:00, 09:00 and 13:00 in KER21-MW3 (Tables 3, 4). A similar effect is observed in KER21-MW2 at 09:00, 13:00, and 17:00 (Tables 5, 6), with a 4 h lag compared to MW3. The daylight mixed effect models also showed that for every standard deviation increase in daylight duration, the mid-day increase in depth to water was more severe. Similarly, a significant negative effect of temperature was observed at 09:00 and 13:00 in KER21-MW3, and at 09:00 and 17:00 in KER21-MW2. The daylight duration and maximum daily temperature were highly correlated, so either parameter may explain the severe mid-day decline of the water table.
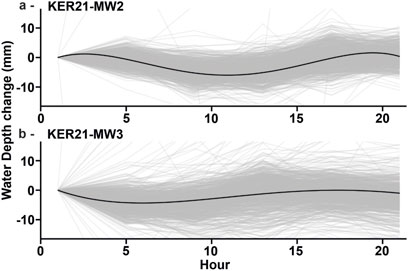
Figure 7. Results of the mixed effects model with daily water level curves for (a) KER21-MW2 and (b) KER21-MW3.
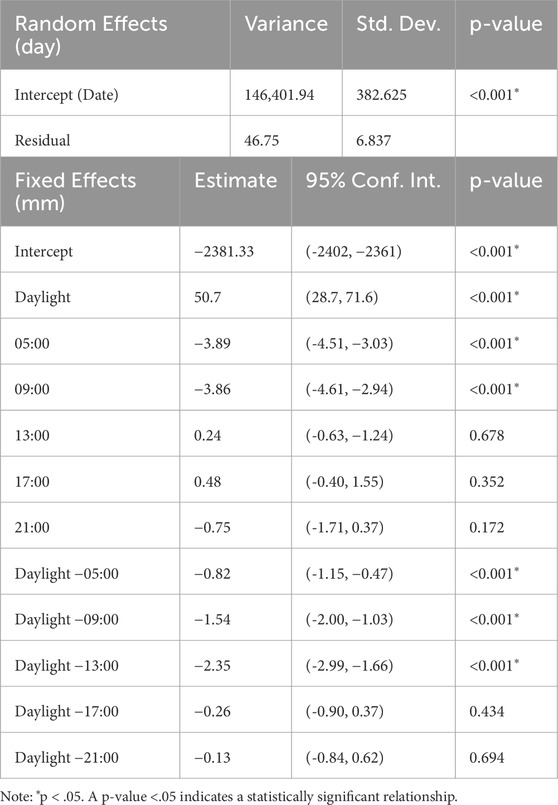
Table 3. Daylight mixed model effect summary for KER21-MW3.
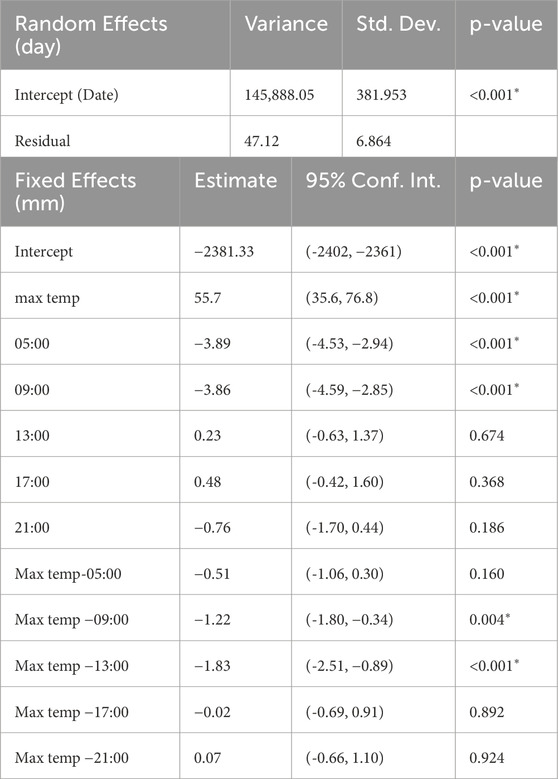
Table 4. Maximum temperature mixed effect model summary for KER21-MW3.
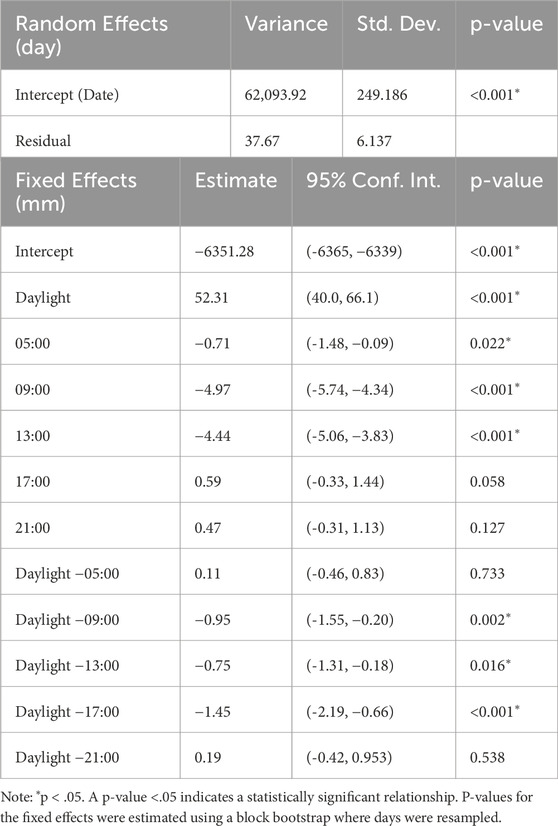
Table 5. Daylight mixed effect model summary for KER21-MW2.
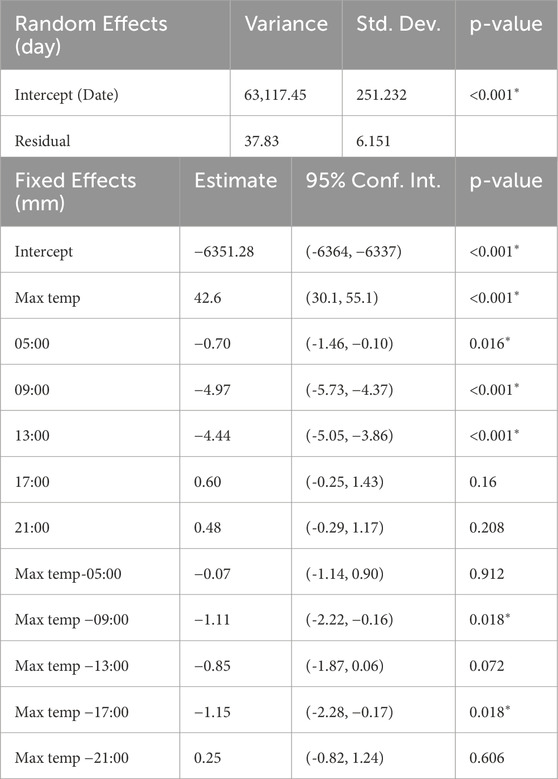
Table 6. Maximum temperature mixed effect model summary for KER21-MW2.
The spatial and hydrogeological context of the monitoring wells could in part explain the difference in daily responses to precipitation, daylight duration and surface temperatures. Both monitoring wells, KER21-MW2 and KER21-MW3, were installed in interdunal areas but in different parts of the Kermit dune field. KER21-MW2 was positioned at the transition zone between active dunes and sand sheet deposits. The water table at this well’s location is found 7 m below the surface in homogeneous sediments containing up to 39% of silt and clay mixed in with sand. The vegetation cover around this well is ∼60% and consists mostly of mesquites, an invasive shrub-like plant that may take up to 80 L/day (Hart, 2004). KER21-MW3 is located 1.5 km southeast of monitoring well 2, in a central area of the Kermit dune field where the water table is only 2.6 m below surficial loose active sand dune deposits. Vegetation cover around this well is lower, ∼20%, and consists of grasses and one sunflower plant. The monitoring wells are not equipped with pumps so they do not interfere with each other, however they could be impacted by the mine’s water wells. There is no available pumping record or schedule for the latter.
4.3 Electric conductivity
The electric conductivity (EC) was measured in each well throughout the period of record, depending on environmental conditions surrounding the wells and available equipment (Figure 8; Table 7; Supplementary Table S4). The average value of EC measured in vertical profiles in 2024 in KER21-MW1, KER21-MW2, well #14 and in the dredge pond, 330 μS/cm, is assumed to be the nominal background EC of the Kermit dunal aquifer. EC values range between 204 and 364 μS/cm in KER21-MW1. Measurements in MW2 and MW3 were initiated after a local pipeline leak, on June 2nd, 2022, near KER21-MW3. No measurements were taken for safety reasons, in this well nor in the nearby KER21-MW1 well until the site was remediated. However, EC was measured in KER21-MW2 the day of the leak and yielded a value of 1690 μS/cm, substantially higher than the assumed background EC of the Kermit dunal aquifer. Following EC measurements in KER21-MW2 between November 2022 and June 2024 range between 73 and 184 μS/cm, lower than the aquifer’s background value, and may indicate that the plume of contaminants that triggered the high electric conductivity was flushed out rapidly after the spill was stopped. The low conductivities in KER21-MW2 post-spill could also indicate the long-term presence of dissolved hydrocarbon. Organic compounds such as crude oil generally have low electric conductivities (<100 nS/cm at 22 °C) and a previous study found that up to 16% of the groundwater dissolved inorganic carbon (DIC) from KER21-MW2 may originate from hydrocarbons (Fournier et al., 2024; Mohammadi and Mohammadi, 2016).
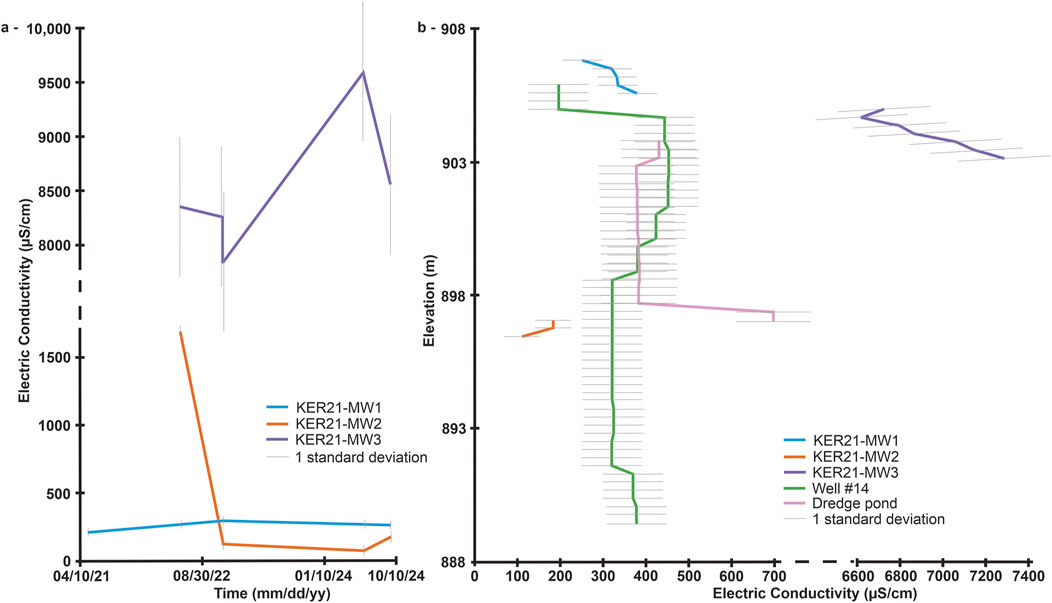
Figure 8. (a) Electric conductivity measured in KER21-MW1, MW2 and MW3 punctually between May 2016 (KER21-MW1 only) and October 2024; (b) Electric conductivity profiles in KER21-MW1, MW2, MW3, and in water well #14 and the dredge pond in October 2024. The grey bars represent the 1 standard deviation in the data at each point.
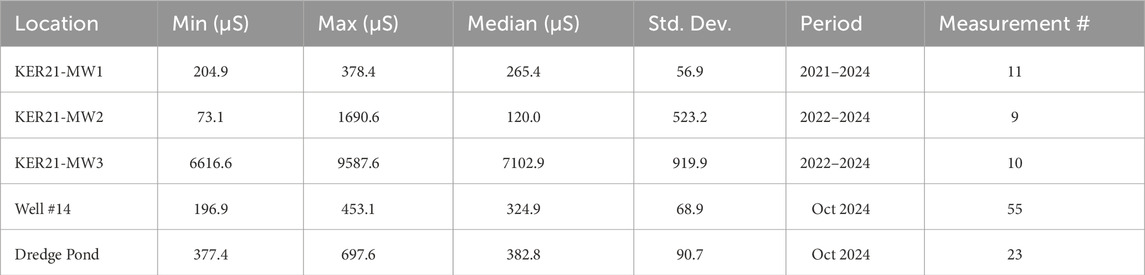
Table 7. Summary of Electric Conductivity measurements for each location in the Kermit dune field.
Conductivity values in KER21-MW3 between November 2022 and June 2024, 8,559 μS/cm on average, have not decreased and may reflect the long-term contamination from hydrocarbons or produced water following the pipeline leak or a remaining conductivity-increasing source. The high values measured in KER21-MW3 and after the spill in KER21-MW2 may come from associated produced water, inorganic compounds (heavy metals, salts, sulfur, nitrogen), mobilization of sediments or from biodegradation of the organic oils increasing the water acidity mixed or induced by the oil spill (Cozzarelli et al., 2021; Lauer et al., 2016). In both KER21-MW2 and MW3, the galvanized steel wires attaching the loggers had to be replaced by fishing lines due to corrosion. Corrosion of steel equipment is a recurring issue associated with produced water (Craig, 1998).
Electric conductivity profiles taken in October 2024 in KER21-MW1 and 3, in well #14 and in the dredge pond show an increase in EC with depth (Figure 9). In well #14, EC also increases ∼2 m from the surface, probably due to the open casing and the location of the well near sand belts and washers, prone to dust emissions. In KER21-MW2, the water table dropped to <1 m from the bottom of the well, therefore measurements were limited and may not be representative of the water profile in that location. The conductivity profiles also highlighted the elevational differences between the wells and the dredge pond. The latter is elevationally lower than well #14, despite well #14s location downflow from the pond, but higher than KER21-MW2, also downflow (Figure 1), which could indicate a locally modified flow path surrounding the dredge pond compared to pre-mining or undisturbed southwestward groundwater flow direction.
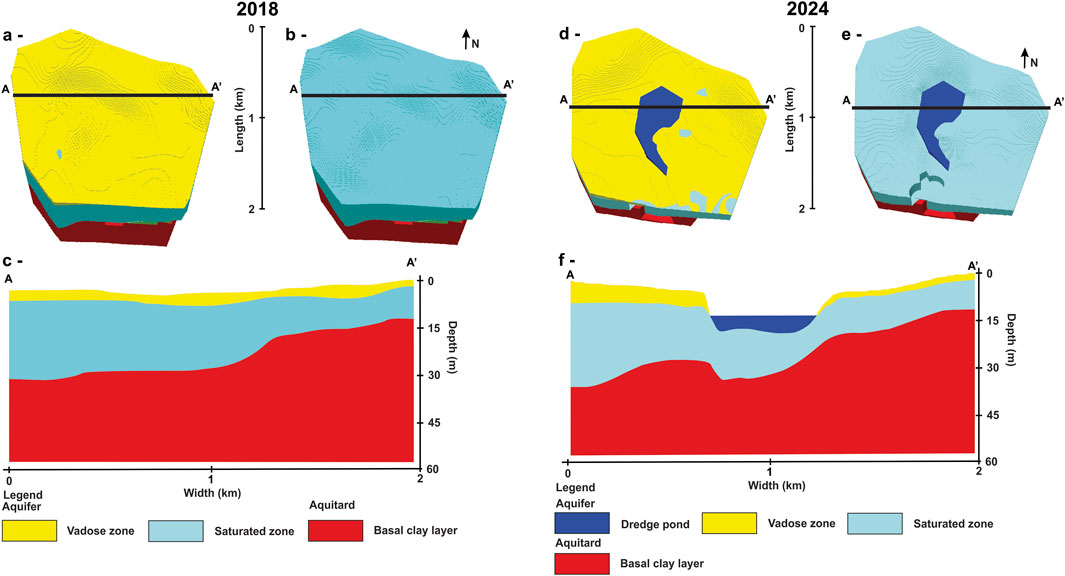
Figure 9. (a–c) 3D model with and without the unsaturated zone, and cross section A-A′ of the Kermit dunal aquifer from 2018 boring data (modified from Fournier et al., 2024); (d–f) 3D model and cross-section of the Kermit dunal aquifer from 2024 water wells, piezometers and dredge pond water level (unpublished data).
5 Discussion
5.1 Natural evolution of the water table in the Kermit dunal aquifer
5.1.1 Recharge
Groundwater recharge in semi-arid areas is especially sensitive to lithology, thickness of the vadose zone, soil hydraulic properties, vegetation cover and climate (Boughanmi et al., 2018; Kollet and Maxwell, 2008; Rossman et al., 2014). Comparing water level variance in the three Kermit monitoring wells with monthly Palmer Drought Severity Index (PDSI) for Winkler County (WestWide Drought Tracker, 2025) indicates that drought variability has a significant effect on groundwater levels in the Kermit dune field with R2 of 0.95, 0.79 and 0.74 (Figure 10). More negative PDSI values (dryer conditions) coincide with a muted and negative change in groundwater levels whereas more positive PDSI values (wetter conditions) occur with larger and positive water table anomalies. Precipitation was found to significantly impact the shallow water table depth for KER21-MW3 in the central active dunes, while no evident relationship was found for the deeper 7 m water table in KER21-MW2 at the transition from dunes to sand sheet deposits. In addition, the depth to water measured in KER21-MW2 increased at a rate of 2 mm/day, which is lower than the rate of decline between recharge events in MW3, 2.7 mm/day, but higher than the overall rate in MW3 of 1.45 mm/day. The differences in declining rates may come from the vadose zone thickness and the sensitivity to recharge events. The water table in KER21-MW3 is closer to the surface so more vulnerable to evapotranspiration but it also gets recharge from precipitation, while in KER21-MW2 the water is deeper and seems to be shielded from recharge.
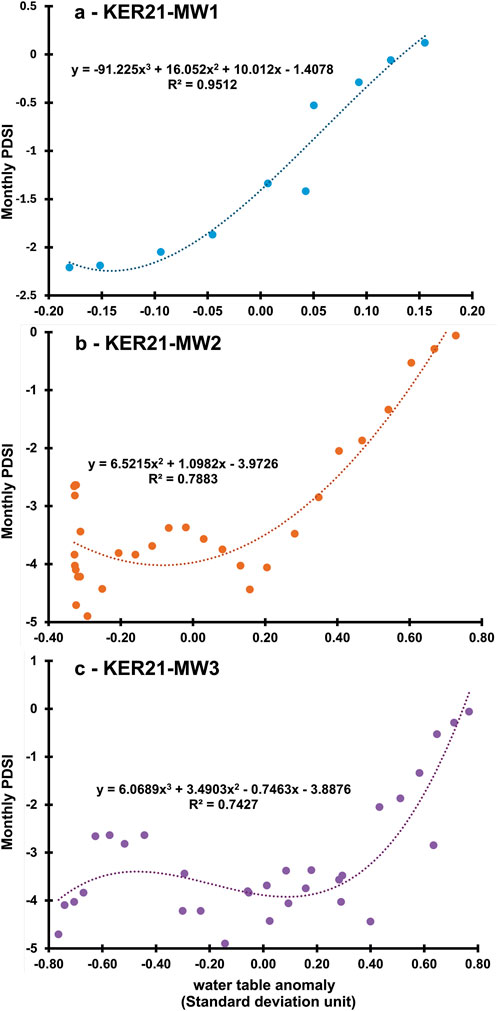
Figure 10. (a–c): Groundwater level variance in all three monitoring wells, KER21-MW1, MW2 and MW3, compared to monthly values of PDSI with trendlines, R2 values and polynomial relationships. For KER21-MW1, the comparison is between August 2021 and May 2022. For KER21-MW2 and MW3, the record covers December 2021 to June 2024. PDSI values were obtained for Winkler County, TX (WestWide Drought Tracker, 2025).
In arid and semi-arid environments, groundwater systems may experience recharge with lag times varying from days to centuries depending on the thickness of the vadose zone, the soil hydraulic properties and lithology (Boughanmi et al., 2018; Huo et al., 2014; Rossman et al., 2014). Some aquifer models indicate that a vadose zone >5 m thick and increasing clay contents from 0% to 20% can result in reduced recharge rates by up to 70% in fine soils (Boughanmi et al., 2018; Huo et al., 2014; Scanlon et al., 2010). Also in those environments, rainfall first compensates for soil moisture deficit and recharge happens during sporadic events with high rainfall intensity but only the water percolating below the root zone may constitute recharge to the aquifer (Boughanmi et al., 2018; De Vries and Simmers, 2002; Huo et al., 2014). The evaporation depth also varies with soil properties from shallow in sands (0.1–0.3 m) to deeper in silty loams (0.6–0.8 m) (Lehmann et al., 2008). The statistical analyses on the piezometric record in KER21-MW2 show no evident relation between the depth to the water table and precipitation or evapotranspiration. The 7 m thick vadose zone in KER21-MW2 may prevent precipitation from reaching the water table or may delay recharge with a lag longer than the recording period. Additionally, a core was taken during the installation of KER21-MW2 and revealed sediments consisting of a mix of sand, 61%–92.5%, and fines <63 μm, 7.5%–39% (Fournier et al., 2024). The nearby plant cover is approximately 60% and is characterized as sandhill shrublands with deep-rooted (up to 12 m) honey mesquites that may have dense lateral root systems concentrated in the upper 1 m (Steinberg, 2001) and are commonly named “water thieves” in rangelands for their high-water consumption, up to 80 L/day (Hart, 2004). The dense root network below the dunes’ surface and the deeper reaching evaporation may explain the lack of recharge in this well. All available soil water including precipitation may be consumed, starving the water table at this site.
In the central active dunes, the water table is shallow, 1.7–3 m deep, and may be more sensitive to precipitation and evapotranspiration than at the western edge of the dunes where the water table is deeper. The record in KER21-MW3 shows that 1 mm of precipitation correlated with a 0.68 mm rise the first day and 1.7 mm rise post 3 days following rainfall. The difference between the amount of precipitation and recorded rise in the piezometer accounts for the volume of sand getting saturated from rainfall and with an estimated 36% porosity, well within the range of sand porosities (Berger, 1992). Indeed, granulometry analysis of a core taken at the location of KER21-MW3 yielded a sediment composition of almost 100% sand over the first 1.5 m that then transitioned to older sediments with 26%–48% fines (Fournier et al., 2024). Following rainfall, the water table drops at a rate of 2.7 mm/day until the next rainfall event. In areas with a high water table, <5 m, recharge may occur post precipitation with ensuing evapotranspiration in semi-arid climates (De Vries and Simmers, 2002). Periodic recharge in the central shallower aquifer can offset the high decline observed between rainfall events and allow for an overall rate of depletion lower than in the deeper section of the aquifer.
5.1.2 Daily variation
Despite the overall water levels declining in the Kermit dune field, small water level fluctuations occur daily in KER21-MW2 and MW3 (Figure 7). Indeed, a micro 5–8 mm water cycle has been documented in the wells with the water table lower in the early morning and higher in the afternoon. In well KER21-MW3 the lowest water levels on average were measured at 05:00 h and the highest at 13:00 h. The cycle in KER21-MW2 is delayed by 4 hours and appears muted compared to KER21-MW3, which may reflect a thicker vadose zone in KER21-MW2. The cycle in both wells is impacted by seasonality, on average the water table is 40 cm higher in the winter compared to the summer and appears muted in periods of shorter daylight duration. During the growing season when daylight lasts longer and temperatures are higher, the daily cycle shows additional lowering of the water table in both KER21-MW2 and MW3. However, the individual impact of daylight duration and temperature on the depth to water in the Kermit dune field was not determined. Both parameters were highly correlated, and other factors such as vegetation cover or vadose zone thickness may also effect the water table’s daily cycle.
The scale of the daily variations may reflect natural processes rather than anthropogenic effects. The latter tends to result in multiple meters of water level variations, while natural daily fluctuations of water table elevation usually show <1 m of amplitude (Gribovszki et al., 2010). Earth tides effects calculated with Tsoft yielded statistically insignificant <0.1 correlation coefficients with the daily cycle (Gribovszki et al., 2010; Van Camp and Vauterin, 2005). Previous studies on shallow water tables reported atmospheric pressure changes may have induced variations of water table heights, with lower atmospheric pressures associated with a rise in the water table (Spane, 2002; Turk, 1975). However, unconfined aquifers are usually assumed to be insensitive to barometric pressure variation and barometric efficiency in sand and sandy sediments is nearly null. Thus, barometric effects on the water table are most likely insignificant in the Kermit dune field (Acworth et al., 2016; Crosbie et al., 2005). Another factor that can cause diurnal variations in water table elevation is evapotranspiration, which induces responses varying by well depth, vegetation cover, soil conditions, climate and seasons. Here, the daily cycle shows lower water table elevations during spring and summer days with longer daylight, which also corresponds to the growing season. Indeed, the effect of an extended growing season may be prominent for KER21-MW2 where vegetation coverage is higher and consist of high water-usage plants like mesquite trees, compared to KER21-MW3. Mesquite trees may take up to 80 L of water per day during the growing season (Hart, 2004).
5.2 Impact of anthropogenic activities on groundwater flow path and chemistry
The Kermit dune field is located on the Central Basin Platform, a high oil and gas producing area of the Permian Basin, with nearly 100,000 production wells, including 200 wells directly in the dunes (Rail Road Commission of, 2025). Approximately 11,000 oil spills were recorded in the Permian Basin between 2009 and 2018 (Scanlon et al., 2022). In the Kermit dune field, oil spills may also be prevalent. A previous study found that up to 16% of the dissolved inorganic carbon (DIC) in groundwater from well KER21-MW2 and from a nearby proppant water well may reflect a hydrocarbon contribution (Fournier et al., 2024). Case in point, an oil or produced water spill observed in 2022 (by AF) near KER21-MW3 in the central active dunes was traced the same day downflow in KER21-MW2 through an outstanding peak in electric conductivity (EC) of 1690 μS/cm. The EC measured in KER21-MW3 near the source of the spill was even higher at ∼8560 μS/cm and persisted through repeat measurements in the following years, possibly indicating a consistent subsurface source of contaminants. Pure hydrocarbons have generally low conductivities. However, produced waters that may contain heavy metals, high concentrations of salt and other inorganic compounds yield elevated conductivity values. Also, biodegration of trapped hydrocarbons in sediments may increase the conductivity of water in the well (Cozzarelli et al., 2021; Lauer et al., 2016). Further chemical analyses is needed to identify the source of the high and constant EC in well KER21-MW3 and vicinity.
Since 2016, three companies have developed four major sand mining operations for oil and gas production in the Kermit dune field (Mace and Jones, 2023). One mine is centered on the thickest (20–50 m) sand sediment sequence in the central western part of the Kermit dune field, which also coincides with the thickest portion of the Kermit dunal aquifer (Fournier et al., 2024). The high volume of water in the dunes, >0.1 km3 (Fournier et al., 2024), necessitated mining operations to transition from open pit to water dredging. In October 2024, the dredge pond covered an area of 0.33 km2 with depths between 3 and 8 m from south to north across the pond (Personal communication with mine operators, 2024). A 3D architectural model of the Kermit dunal aquifer based on boring data from 2017–2018, predating the formation of the dredge pond (Fournier et al., 2024) was compared to a new 2024 3D model reflecting the state of the water table in the vicinity of the dredge pond (Figures 9, 10). In 2024, the water table elevation was lowered by ∼1.2 m compared to 2021. Indeed, there is a significant correlation between the extension of the dredge pond and the depth of the water table measured in the monitoring wells (Figure 11). This correlation is more significant in the shallower KER21-MW3 piezometer than in KER21-MW2, where the relationship is muted when the water table drops below 6 m. The sink effect of the pond on the water table is accentuated by high evaporation rates up to 1200 mm/yr (Open ET, 2025) and 4-fold increase of the surrounding vegetation.
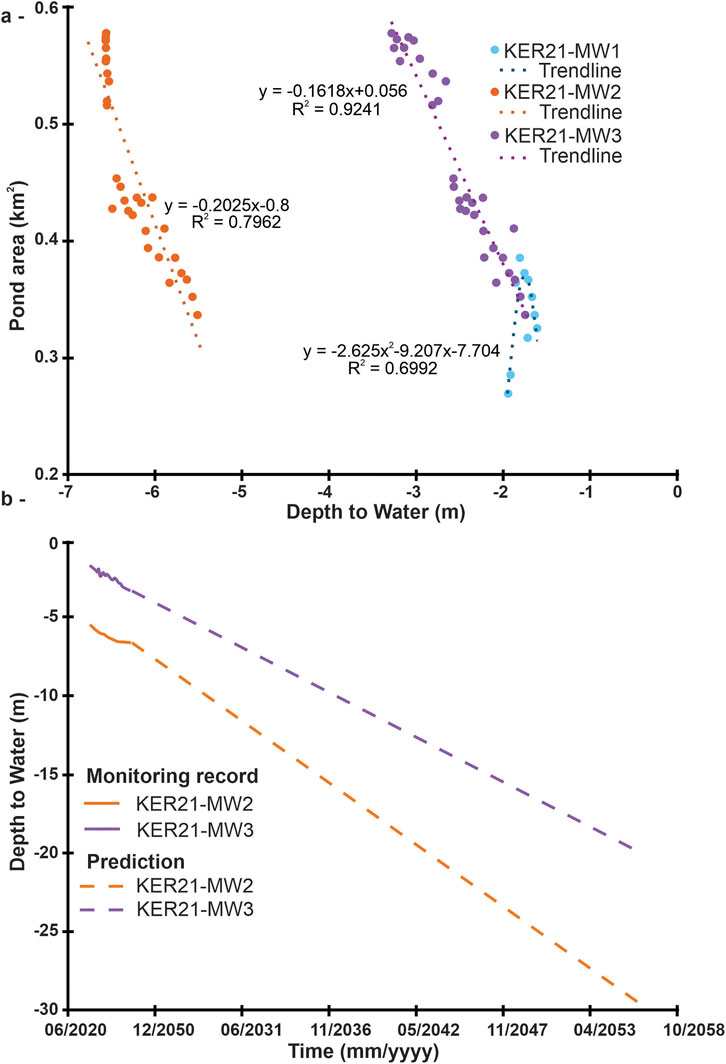
Figure 11. (a)-Relationship between the Kermit dredge pond area (in km2) and the depth to the water table measured in KER21-MW1, KER21-MW2 and KER21-MW3, per month between August 2021 and June 2024. The area of the pond was obtained by manual analysis of monthly aerial imagery from Planet. (b)-Water level evolution prediction in monitoring wells KER21-MW2 and MW3 until reaching the depth of the clay layer as estimated at both well location, assuming current conditions and decline rates are constant. At the location of KER21-MW2, the thickness of the aquifer is ∼30 m, and it is ∼19 m at the location of KER21-MW3.
Sand mining within a shallow aquifer has been recognized in various studies as the dominant cause for lowering the regional water table, reducing soil moisture and removing the protective filtrating unsaturated zone, leading to well failures in agricultural areas, aquifer pollution and increased vulnerability to evaporation (Brewer et al., 2024; Hemalatha et al., 2005; Peckenham et al., 2009). Soil moisture in sand dunes increases intergranular cohesion and adhesion which enhances the resistance to wind erosion capacity (Hallin et al., 2023; Namikas and Sherman, 1995; Van Rijn and Strypsteen, 2020). The increasing arid conditions and the expansion of the dredge pond and other mine pits on the Kermit dune field may lead to dewatering and reduced soil moisture. Notably, if current drought conditions and the rates of declining water level in the piezometers were to remain constant as documented for 2021–2024, the volume of Kermit dunal aquifer may decrease by >50% within the next 30 years (Figure 11). In addition, decreased soil moisture may lead to the replacement of sand-fixing vegetation cover by drought-resistant shrubs such as mesquite trees (Alamusa et al., 2023; Reynolds et al., 1999; Zhong et al., 2024). Mesquite-dominated areas in the Chihuahua Desert have undergone increasing desertification marked by landscape heterogeneity nutrient loss and soil erosion, associated with increased aeolian activity, enhanced lower atmospheric dust loading and periodic dust storms (Gillette and Pitchford, 2004; Gould, 1982; Sweeney et al., 2023).
The Kermit dune field, Winkler County, TX, is in part privately owned by mining companies and leased from the State of Texas. Private and leased lands in Texas fall under the common law of “rule of capture”. This rule gives the right to landowners and leasers to use the groundwater beneath their property with few restrictions and oversight from government agencies, unless limitations are specified by a Groundwater Conservation District (GCD). The GCDs are local government entities created either by the Texas Legislature or through a petition to the Texas Commission on Environmental Quality (TCEQ) started by landowners and residents. In Winkler County, there is currently no GCD. In the absence of regulations on the Kermit dune field, enforcing long-term monitoring and mitigating of the sand mining effects on local groundwater seems complicated. Possible sustainable strategies to protect the groundwater may include restricting the expansion of the dredge pond, solely mining the surficial sand to limit the evaporation, installing more piezometers near the mine facilities to monitor and regulate groundwater extraction, and creating reclamation projects for post-mining dune structure stabilization. Those actions would have to be implemented by the mine companies on a voluntary basis, unless a GCD is created to cover this area. Even without regulatory framework, the data produced during this study could serve the Texas Water Development Board (TWDB) for regional aquifer planning, and recharge and water-resource management modeling in the PVA. The TWDB is the Texas agency responsible for water data collection, interpretation and reporting.
6 Conclusion
Groundwater dynamics in the Kermit dune field were monitored from December 2021 to June 2024, during one of the dryest periods of the ongoing 2000s megadrought impacting the southwestern United States. Two piezometers measured the variations of the water table and a barometric logger recorded atmospheric pressure and surface temperature. Throughout the monitoring period, groundwater monitoring revealed an overall declined water level of ∼1.2 m in both piezometers in the Kermit dune field. However, the water table showed distinct responses to precipitation depending on the depth of the water table: in the shallow KER21-MW3, peak water levels are reached at a 3-day lag following precipitation. For each 1 mm of rainfall, the water table exhibited a 1.7 mm rise which allowed to estimate a sediments porosity of 36% at this location. In contrast, in the deeper KER21-MW2, the water table showed no discernible response to precipitation, suggesting that all precipitation falling nearby is taken up by evapotranspiration before reaching the water table. The monitoring record also highlighted a daily cycle in both piezometers seemingly influenced by seasonality, temperatures and daylight duration. Indeed, this cycle with early morning lows and afternoon highs seems muted in the shorter colder winter days while it is intensified during the spring and summer months when days are longer and warmer. The daylight effect is more pronounced in KER21-MW2, likely due to a higher vegetation cover with deep-rooted high-water consuming plants. Neither well record showed a direct statistical-significant response to daily evapotranspiration or air temperature variations, though there is a significant relationship between PDSI and monthly changes in water table, indicating a sensitivity to drought variability.
The Kermit dunal aquifer (KDA) holds ∼0.1 km3 of water and may contribute up to 9% of the annual recharge to the regional Pecos Valley Aquifer (PVA) (Fournier et al., 2024). However, mining and oil and gas production on the dune field may impact the quantity and quality of the groundwater. An oil and brine spill in 2022 may have caused long-term contamination of the groundwater near KER21-MW3 where electric conductivity values have remained >7500 μS/cm. Groundwater samples from KER21-MW2 and a deep water well revealed that up to 16% of the dissolved inorganic carbon may originate from hydrocarbons, indicating a possible widespread contamination (Fournier et al., 2024). Mining operations have also resulted in the creation of a dredge pond in the heart of the dunes, where evapotranspiration (up to 1200 mm/yr) exceeds precipitation (∼300 mm/yr). The pond likely drains the dunal aquifer, possibly contributing to the water static level decline observed in the piezometers. The modification of groundwater flow paths, the reduction of the volume of water in the KDA and possible hydrocarbon contamination may diminish the quality and sustainability of recharge to the PVA. In addition, dewatering of the sand dunes may lead to enhanced wind erosion and dust production as drought conditions persist through the 21st century. The absence of regional monitoring and management of aquifers in this dune dominated semi-arid area of west Texas, impedes sustainable use of this diminishing groundwater resource.
Data availability statement
The original contributions presented in the study are included in the article/Supplementary Material, further inquiries can be directed to the corresponding author.
Author contributions
AF: Writing – original draft, Investigation, Visualization, Formal analysis, Conceptualization, Writing – review and editing, Methodology. CF: Software, Writing – original draft, Formal analysis, Writing – review and editing, Methodology, Data curation. SF: Supervision, Writing – original draft, Resources, Funding acquisition, Writing – review and editing.
Funding
The author(s) declare that financial support was received for the research and/or publication of this article. This research was supported through funds from the Dept. of Geosciences, Luminescence Dating Research Laboratory, at Baylor University.
Acknowledgments
Many thanks to Connor Mayhack, Jasmine Kidwell, Ashley Gonzalez, Anna Lesko, and Daniel Shi for their assistance in installing piezometers. Discussions with Joe Yelderman and help from the Baylor Geosciences department, from lending the Geoprobe to financial support, were much appreciated. Additionally, we want to thank Rodney Sturdivant and the Baylor Statistical Consulting Center for their continuous support and precious advice.
Conflict of interest
The authors declare that the research was conducted in the absence of any commercial or financial relationships that could be construed as a potential conflict of interest.
The author(s) declared that they were an editorial board member of Frontiers, at the time of submission. This had no impact on the peer review process and the final decision.
Generative AI statement
The author(s) declare that no Generative AI was used in the creation of this manuscript.
Any alternative text (alt text) provided alongside figures in this article has been generated by Frontiers with the support of artificial intelligence and reasonable efforts have been made to ensure accuracy, including review by the authors wherever possible. If you identify any issues, please contact us.
Publisher’s note
All claims expressed in this article are solely those of the authors and do not necessarily represent those of their affiliated organizations, or those of the publisher, the editors and the reviewers. Any product that may be evaluated in this article, or claim that may be made by its manufacturer, is not guaranteed or endorsed by the publisher.
Supplementary material
The Supplementary Material for this article can be found online at: https://www.frontiersin.org/articles/10.3389/feart.2025.1617125/full#supplementary-material
References
Acworth, R. I., Halloran, L. J. S., Rau, G. C., Cuthbert, M. O., and Bernardi, T. L. (2016). An objective frequency domain method for quantifying confined aquifer compressible storage using Earth and atmospheric tides. Geophys. Res. Lett. 43 (22), 671 678. doi:10.1002/2016gl071328
Alamusa, A., Su, Y., Yin, J., Zhou, Q., and Wang, Y. (2023). Effect of sand-fixing vegetation on the hydrological regulation function of sand dunes and its practical significance. J. Arid Land 15 (1), 52–62. doi:10.1007/s40333-023-0002-y
Arias, P. A., Fu, R., Vera, C., and Rojas, M. (2015). A correlated shortening of the north and South American monsoon seasons in the past few decades. Clim. Dyn. 45 (11-12), 3183–3203. doi:10.1007/s00382-015-2533-1
Barandiaran, D., Wang, S. Y., and Hilburn, K. (2013). Observed trends in the great Plains low-level jet and associated precipitation changes in relation to recent droughts. Geophys. Res. Lett. 40 (23), 6247–6251. doi:10.1002/2013gl058296
Bates, D., Mächler, M., Bolker, B., and Walker, S. (2015). Fitting linear mixed-effects models using lme4. J. Stat. Softw. 67 (1), 1–48. doi:10.18637/jss.v067.i01
Berger, D. L. (1992). Ground-water recharge through actwe sand dunes in northwestern nevada1. Water Resour. Bull. 28 (5), 959–965. doi:10.1111/j.1752-1688.1992.tb03195.x
Boughanmi, M., Dridi, L., Hamdi, M., Majdoub, R., and Schäfer, G. (2018). Impact of floodwaters on vertical water fluxes in the deep vadose zone of an alluvial aquifer in a semi-arid region. Hydrological Sci. J. 63 (1), 136–153. doi:10.1080/02626667.2017.1410281
Brewer, W. A., Dawson, C. R., and Yelderman, J. C. (2024). Longitudinal investigation of groundwater and surface water interaction of two gravel pit Lakes in central Texas: chemical and flow implications. Water 16 (21), 3068. doi:10.3390/w16213068
Bruun, B., Jackson, K., Lake, P., and Walker, J. (2016). Texas aquifers Study - groundwater quantity, quality, flow, and contributions to surface water. Tex. Water Dev. Board. Available online at: https://www.twdb.texas.gov/groundwater/special_projects/valverde/docs/TexasAquiferStudy_FINAL_forWeb.pdf.
Chaudhuri, S., and Ale, S. (2014). Temporal evolution of depth-stratified groundwater salinity in municipal Wells in the major aquifers in Texas, USA. Sci. Total Environ. 472, 370–380. doi:10.1016/j.scitotenv.2013.10.120
Cheek, C. A., and Taylor, C. M. (2016). Salinity and geomorphology drive long-term changes to local and regional fish assemblage attributes in the lower pecos River, Texas. Ecol. Freshw. Fish 25 (3), 340–351. doi:10.1111/eff.12214
Cozzarelli, I. M., Kent, D. B., Briggs, M., Engle, M. A., Benthem, A., Skalak, K. J., et al. (2021). Geochemical and geophysical indicators of oil and gas wastewater can trace potential exposure pathways following releases to surface waters. Sci. Total Environ. 755, 142909. doi:10.1016/j.scitotenv.2020.142909
Craig, B. (1998). Predicting the conductivity of water-in-oil solutions as a means to estimate corrosiveness. Corrosion 54, 657–662. doi:10.5006/1.3287645
Crosbie, R. S., Binning, P., and Kalma, J. D. (2005). A time series approach to inferring groundwater recharge using the water table fluctuation method. Water Resour. Res. 41 (1). doi:10.1029/2004WR003077
De Vries, J. J., and Simmers, I. (2002). Groundwater recharge: an overview of processes and challenges. Hydrogeology J. 10 (1), 5–17. doi:10.1007/s10040-001-0171-7
English, S., Heo, J., and Won, J. (2020). Investigation of sinkhole Formation with human influence: a case study from wink sink in winkler county, Texas. Sustainability 12 (9), 3537. doi:10.3390/su12093537
Fan, J., Xu, X., Lei, J., Zhao, J., Li, S., Wang, H., et al. (2008). The temporal and spatial fluctuation of the groundwater level along the tarim Desert Highway. Sci. Bull. 53 (S2), 53–62. doi:10.1007/s11434-008-6005-4
Forman, S. L., Wu, Z., Wiest, L., Marin, L., and Mayhack, C. (2023). Late Quaternary fluvial and aeolian depositional environments for the Western red river, Southern Great Plains, USA. Quat. Res. 115, 3–24. doi:10.1017/qua.2023.15
Fournier, A., Forman, S. L., and Mayhack, C. (2024). Perched hydrologic systems of the Monahans and the kermit dune fields, northern chihuahuan Desert, West Texas, USA. Water 16 (22), 3188. doi:10.3390/w16223188
Gillette, D. A., and Pitchford, A. M. (2004). Sand flux in the northern chihuahuan desert, New Mexico, USA, and the influence of mesquite-dominated landscapes. J. Geophys. Res. Earth Surf. 109 (F4). doi:10.1029/2003JF000031
Gould, W. L. (1982). Wind erosion curtailed by controlling Mesquite. J. Range Manag. 35 (5), 563–566. doi:10.2307/3898638
Gribovszki, Z., Szilágyi, J., and Kalicz, P. (2010). Diurnal fluctuations in shallow groundwater levels and streamflow rates and their interpretation – a review. J. Hydrology 385 (1), 371–383. doi:10.1016/j.jhydrol.2010.02.001
Hallin, C., Ijzendoorn, C., Van Homberger, J.-M., and De Vries, S. (2023). Simulating surface soil moisture on sandy beaches. Coast. Eng. 185, 104376. doi:10.1016/j.coastaleng.2023.104376
Hart, C. (2004). Chapter 16: Brush management for water consumption. T. w. D. Board. Available online at: https://www.twdb.texas.gov/publications/reports/numbered_reports/doc/R360/Report360.asp.
Haskell, D., Heo, J., Park, J., and Dong, C. (2022). Hydrogeochemical evaluation of groundwater quality parameters for ogallala aquifer in the southern high plains region, USA. Int. J. Environ. Res. Public Health 19 (14), 8453. doi:10.3390/ijerph19148453
Hassani, K., Taghvaeian, S., and Gholizadeh, H. (2021). A geographical survey of center pivot irrigation systems in the central and southern high plains aquifer region of the United States. Appl. Eng. Agric. 37 (6), 1139–1145. doi:10.13031/aea.14693
Hemalatha, A., Chandrakanth, M. G., and Nagaraj, N. (2005). Effect of sand mining on groundwater depletion in Karnataka V international R and D conference of the central board of irrigation and power. Bangalore.
Heo, J., Yu, J., Giardino, R., and Cho, H. (2015). Water resources response to climate and land-cover changes in a semi-arid watershed. Terr. Atmos. Ocean. Sci. 26. doi:10.3319/TAO.2015.03.24.01(Hy
Howell, N. (2021). Comparative water qualities and blending in the ogallala and dockum aquifers in Texas. Hydrology 8 (4), 166. doi:10.3390/hydrology8040166
Huggins, X., Gleeson, T., Kummu, M., Zipper, S. C., Wada, Y., Troy, T. J., et al. (2022). Hotspots for social and ecological impacts from freshwater stress and storage loss. Nat. Commun. 13 (1), 439. doi:10.1038/s41467-022-28029-w
Huo, S., Jin, M., Liang, X., and Lin, D. (2014). Changes of vertical groundwater recharge with increase in thickness of vadose zone simulated by one-dimensional variably saturated flow model. J. Earth Sci. 25 (6), 1043–1050. doi:10.1007/s12583-014-0486-7
Hyndman, R., Athanasopoulos, G., Bergmeir, C., Caceres, G., Chhay, L., O'Hara-Wild, M., et al. (2024). “Forecast: forecasting functions for time series and linear models,” in (version R package version 8.23.0.9000). Available online at: https://pkg.robjhyndman.com/forecast/.
Jones, I. C. (2008). Investigating recharge in arid alluvial basin aquifers: the pecos valley aquifer, Texas gulf Coast association of geological societies transactions 58, 489–500.
Kandakji, T., Gill, T. E., and Lee, J. A. (2021). Drought and land use/land cover impact on dust sources in southern Great Plains and chihuahuan desert of the U.S.: inferring anthropogenic effect. Sci. Total Environ. 755, 142461. doi:10.1016/j.scitotenv.2020.142461
Kollet, S. J., and Maxwell, R. M. (2008). Capturing the influence of groundwater dynamics on land surface processes using an integrated, distributed watershed model. Water Resour. Res. 44 (2). doi:10.1029/2007WR006004
Langman, J., and Ellis, A. (2010). Geologic influences on source-water mixing along a paleochannel in the southern high plains aquifer, New Mexico. Carbonates Evaporites 25, 247–265. doi:10.1007/s13146-010-0029-y
Lauer, N. E., Harkness, J. S., and Vengosh, A. (2016). Brine spills associated with unconventional oil development in North Dakota. Environ. Sci. and Technol. 50 (10), 5389–5397. doi:10.1021/acs.est.5b06349
Lehmann, P., Assouline, S., and Or, D. (2008). Characteristic lengths affecting evaporative drying of porous media. Phys. Rev. E 77 (5), 056309. doi:10.1103/PhysRevE.77.056309
Mace, R., and Jones, C. (2023). Frac sand facilities and their potential effects on the groundwater resources of the monahans-mescalero sand ecosystem, Permian basin, Texas. Tex. Water J. 14 (1), 62–80. doi:10.21423/twj.v14i1.7132
Mair, P., and Wilcox, R. (2020). Robust statistical methods in R using the WRS2 package. Behav. Res. Methods 52 (2), 464–488. doi:10.3758/s13428-019-01246-w
Mohammadi, M., and Mohammadi, F. (2016). Parametric study on electrical conductivity of crude oils; basis experimental data. Petroleum Coal 58, 629–634. Available online at: https://www.vurup.sk/wp-content/uploads/dlm_uploads/2017/07/pc_6_2016_mohammadi_470cor.pdf.
Namikas, S. L., and Sherman, D. J. (1995). “A review of the effects of surface moisture content on aeolian sand transport,” in Desert aeolian processes. Editor V. P. Tchakerian (Netherlands: Springer), 269–293. doi:10.1007/978-94-009-0067-7_13
National Oceanic and Atmospheric Administration (2024). (NOAA) - climate data online. Available online at: https://www.ncei.noaa.gov/cdo-web/.
Nielsen-Gammon, J. W., Banner, J. L., Cook, B. I., Tremaine, D. M., Wong, C. I., Mace, R. E., et al. (2020). Unprecedented drought challenges for Texas water resources in a changing climate: what do researchers and stakeholders need to know? Earth's Future 8 (8), e2020EF001552. doi:10.1029/2020ef001552
O'Hara-Wild, M. H. R., and Wang, E. (2023). “Asts: feature extraction and statistics for time series_. R,” in (version R package version 0.3.1) CRAN.R-project.org/package=feasts>.
Open ET (2025). Open ET. Available online at: https://etdata.org.
Pathak, S., Adusumilli, N. C., Wang, H., and Almas, L. K. (2022). Irrigation water demand and elasticities: a case study of the high plains aquifer. Irrigation Sci. 40 (6), 941–954. doi:10.1007/s00271-022-00804-z
Pawlowicz, R. (2008). Calculating the conductivity of natural waters. Limnol. Oceanogr. Methods 6 (9), 489–501. doi:10.4319/lom.2008.6.489
Peckenham, J. M., Thornton, T., and Whalen, B. (2009). Sand and gravel mining: effects on ground water resources in hancock county, Maine, USA. Environ. Geol. 56 (6), 1103–1114. doi:10.1007/s00254-008-1210-7
Rail Road Commission of (2025). Texas - well distribution. Available online at: https://www.rrc.texas.gov/oil-and-gas/research-and-statistics/well-information/well-distribution-by-county/.
Reynolds, J. F., Virginia, R. A., Kemp, P. R., de Soyza, A. G., and Tremmel, D. C. (1999). Impact of drought on desert shrubs: effects of seasonality and degree of resource island development. Ecol. Monogr. 69 (1), 69–106. doi:10.2307/2657195
Rossman, N. R., Zlotnik, V. A., Rowe, C. M., and Szilagyi, J. (2014). Vadose zone lag time and potential 21st century climate change effects on spatially distributed groundwater recharge in the semi-arid Nebraska sand hills. J. Hydrology 519, 656–669. doi:10.1016/j.jhydrol.2014.07.057
Scanlon, B. R., Reedy, R. C., Gates, J. B., and Gowda, P. H. (2010). Impact of agroecosystems on groundwater resources in the central high plains, USA. Agric. Ecosyst. and Environ. 139 (4), 700–713. doi:10.1016/j.agee.2010.10.017
Scanlon, B. R., Reedy, R. C., and Wolaver, B. D. (2022). Assessing cumulative water impacts from shale oil and gas production: permian basin case study. Sci. Total Environ. 811, 152306. doi:10.1016/j.scitotenv.2021.152306
Seager, R., Ting, M., Alexander, P., Liu, H., Nakamura, J., Li, C., et al. (2023). Ocean-forcing of cool season precipitation drives ongoing and future decadal drought in southwestern North America. npj Clim. Atmos. Sci. 6 (1), 141. doi:10.1038/s41612-023-00461-9
Shimojima, E., Tamagawa, I., Horiuchi, M., Woodbury, R. J., and Turner, J. V. (2013). Observation of water and solute movement in a saline, bare soil, groundwater seepage area, Western Australia. Part 1: movement of water in near-surface soils in summer. Soil Res. 51 (4), 288–300. doi:10.1071/SR12282
Spane, F. A. (2002). Considering barometric pressure in groundwater flow investigations. Water Resour. Res. 38 (6), 14–18. doi:10.1029/2001WR000701
Steinberg, P. (2001). Prosopis glandulosa fire effects information system, issue. F. S. Laboratory. Available online at: https://www.fs.usda.gov/database/feis/plants/tree/progla/all.html.
Sweeney, M. R., Lacey, T., and Forman, S. L. (2023). The role of abrasion and resident fines in dust production from aeolian sands as measured by the portable in situ wind erosion laboratory (PI-SWERL). Aeolian Res. 63-65, 100889. doi:10.1016/j.aeolia.2023.100889
Team, R. C. (2022). R: a language and environment for statistical computing. Available online at: https://www.r-project.org/.
TexasET Network (2025). TexasET network. Available online at: https://texaset.tamu.edu/.
Turk, L. J. (1975). Diurnal fluctuations of water tables induced by atmospheric pressure changes. J. Hydrology 26 (1), 1–16. doi:10.1016/0022-1694(75)90121-3
Van Camp, M., and Vauterin, P. (2005). Tsoft: graphical and interactive software for the analysis of time series and Earth tides. Comput. and Geosciences 31 (5), 631–640. doi:10.1016/j.cageo.2004.11.015
Van Rijn, L. C., and Strypsteen, G. (2020). A fully predictive model for aeolian sand transport. Coast. Eng. 156, 103600. doi:10.1016/j.coastaleng.2019.103600
Wagner, R. J., Boulger, R. W., Oblinger, C. J., and Smith, B. A. (2006). Guidelines and standard procedures for continuous water-quality monitors—Station operation, record computation, and data reporting (techniques and methods, issue). Available online at: https://pubs.usgs.gov/tm/2006/tm1D3/.
Wang, P., Yu, J., Pozdniakov, S. P., Grinevsky, S. O., and Liu, C. (2014). Shallow groundwater dynamics and its driving forces in extremely arid areas: a case study of the lower heihe River in northwestern China. Hydrol. Process. 28 (3), 1539–1553. doi:10.1002/hyp.9682
Wang, G., Shi, H., Li, X., Yan, J., Miao, Q., Li, Z., et al. (2020). A study on water and salt transport, and balance analysis in sand dune–wasteland–lake systems of hetao oases, upper reaches of the yellow River basin. Water 12 (12), 3454. doi:10.3390/w12123454
WestWide Drought Tracker (2025). WestWide drought tracker. Available online at: https://wrcc.dri.edu/wwdt/time/.
White, W. N. (1932). A method of estimating ground-ater supplies based on discharge by plants and evaporation from soil: results of investigations in escalante valley, Utah (U. S. G. Survey, Ed. Washington, DC, United States: USGS Numbered Series ed., Vol. 659). doi:10.3133/wsp659A
White, D. E. (1971). Report 125: Water Resources of Ward County, Texas. Washington, DC: U.S. Geological Survey and Texas Water Development Board. Available online at: https://www.twdb.texas.gov/publications/reports/numbered_reports/doc/R125/report125.asp.
Wickham, H., Averick, M., Bryan, J., Chang, W., McGowan, L., François, R., et al. (2019). Welcome to the tidyverse. J. Open Source Softw. 4 (43), 1686. doi:10.21105/joss.01686
Williams, A. P., Cook, B. I., and Smerdon, J. E. (2022). Rapid intensification of the emerging southwestern North American megadrought in 2020–2021. Nat. Clim. Change 12 (3), 232–234. doi:10.1038/s41558-022-01290-z
Yubing, F., Sushil, K. H., Srinivasulu, A., Paul, B. D., Tian, Z., Seong, C. P., et al. (2022). The synergy between water conservation and economic profitability of adopting alternative irrigation systems for cotton production in the Texas high plains. Agric. Water Manag. 262, 107386. doi:10.1016/j.agwat.2021.107386
Zhong, L., Feng, X., and Zhao, W. (2024). Fixing active sand dune by native grasses in the desert of northwest China. Ecol. Process. 13 (1), 77. doi:10.1186/s13717-024-00556-y
Keywords: dunes, perched aquifer, groundwater monitoring, evapotranspiration, climate variation, anthropogenic impact, water table fluctuations
Citation: Fournier A, Fox C and Forman SL (2025) Seasonal and diurnal groundwater fluctuations linked to environmental and drought variability for the Kermit dune field, Chihuahuan Desert, West Texas, United States. Front. Earth Sci. 13:1617125. doi: 10.3389/feart.2025.1617125
Received: 23 April 2025; Accepted: 07 August 2025;
Published: 21 August 2025.
Edited by:
Tianming Huang, Chinese Academy of Sciences (CAS), ChinaReviewed by:
Zaiyong Zhang, Chang’an University, ChinaPiya Mohasin, Indian Institute of Science Education and Research Kolkata, India
Copyright © 2025 Fournier, Fox and Forman. This is an open-access article distributed under the terms of the Creative Commons Attribution License (CC BY). The use, distribution or reproduction in other forums is permitted, provided the original author(s) and the copyright owner(s) are credited and that the original publication in this journal is cited, in accordance with accepted academic practice. No use, distribution or reproduction is permitted which does not comply with these terms.
*Correspondence: Alix Fournier, QWxpeF9Gb3VybmllcjFAYmF5bG9yLmVkdQ==