 Yifei Gong
 Xiao Guo1*
- 1Lanzhou Institute of Seismology, China Earthquake Administration, Lanzhou, China
- 2School of Atmospheric Sciences, Nanjing University of Information Science and Technology, Nanjing, China
Seismically active northern Tibetan Plateau necessitates the application of remote sensing-driven earthquake precursor detection. We applied wavelet transform and power spectrum analysis to outgoing longwave radiation (OLR) from 37 M ≥ 5.0 earthquakes (2009–2024; 89°–105°E, 31°–43°N), establishing a magnitude prediction model. The results show that: (1) Frequency band 6 demonstrates optimal retrospective detection performance for M5.0–7.0 earthquakes, whereas Band 3 captures anomalies associated with M ≥ 7.0 events; (2) Anomaly area and maximum ratio quantify energy release in M5.0–6.0 earthquakes, while maximum anomaly ratio estimates magnitudes of M6.0-7.0 events; (3) The Qilian Mountains and Bayan Har Mountains exhibit high seismicity due to arid surface conditions, whereas the Qaidam Basin shows elevated OLR power spectrum detection rates attributed to its rigid substrate. Seasonally, summer’s warmer temperatures and atmospheric stability result in OLR anomalies accounting for 34.4% of observations, while winter snow cover induces signal attenuation; (4) Normal faults achieve 100% detection via efficient shallow heat transfer from tensile ruptures, contrasting with a 20% missed detection rate in low-dip reverse faults. The proposed split-band multi-parameter remote sensing prediction framework advances medium-to-strong earthquake risk assessment on the Tibetan Plateau, validating thermal infrared remote sensing’s unique capability in precursor identification.
1 Introduction
The northern Tibetan Plateau, situated within the collisional interface of the Indian and Eurasian plates, represents a key transitional tectonic domain, with its unique crustal shortening-left slip composite deformation system and high-frequency strong seismic activities (e.g., the 2010 Yushu M7.1, the 2021 Maduo M7.4, and the 2022 Menyuan M6.9 earthquakes), provides a typical dynamical window to explore intraplate seismic precursor signals (Tapponnier et al., 2001; Zhang et al., 2013). Recent advancements in satellite remote sensing technology have significantly enhanced spatiotemporal dynamic monitoring capabilities. The emerging methodology utilizing thermal infrared longwave radiation detection enables systematic observation of energy dissipation mechanisms associated with pre-seismic tectonic stress accumulation. This approach provides a novel paradigm for investigating pre-seismic lithospheric energy transfer.
Multisensor remote sensing systems have revolutionized seismogenic thermal anomaly detection over the past 30 years. A landmark study by Gorny et al. (1988) pioneered the identification of pre-earthquake surface temperature variations through satellite thermal infrared imagery. This discovery established the foundational framework for investigating earthquake precursors via remote sensing techniques. Subsequent integration of thermal infrared data into seismological research has enabled the development of innovative methodologies for large-scale, near real-time seismic monitoring. In 1990, Sun et al. explored the correlation between longwave radiation and earthquakes, and applied it to the field of earthquake prediction (Meng et al., 2014). Since then, there has been continuous innovation and development on the causal mechanism of seismic thermal anomalies as well as various types of extraction methods (Qiang et al., 1992; Geng et al., 1992; Deng et al., 1995; Liu et al., 1997; Xu and Xu, 2001; Kang et al., 2003; Saraf and Choudhury, 2005; Ouzounov et al., 2006; Qu et al., 2006; Wei et al., 2008; Aliano et al., 2008; Wu et al., 2008; Jing et al., 2009; Ma et al., 2010; Zhang et al., 2010; Wei et al., 2013; Jiao et al., 2015; Meng et al., 2016; Ma et al., 2020). Liu et al. (1997) demonstrated that, by comparing the monthly averages of outgoing longwave radiation (OLR) data over many years, significant anomalies appear in OLR before strong earthquakes, and such anomalies are usually manifested as elevated surface or atmospheric radiation, which provides an important basis for remote sensing monitoring of thermal anomalies before earthquakes; Aliano et al. (2008) used the RST (Robust Satellite Techniques) data method to compare and analyze the seismic thermal phenomenon from both positive and negative sides, and found that thermal infrared radiation anomalies consistent with the fault zone existed around the epicenter during earthquakes, and were absent during calm periods; Tronin et al. (2002) based on NOAA/AVHRR thermal infrared data, verified that anomalous enhancement of surface or atmospheric thermal infrared radiation prior to earthquakes is common, and summarized that thermal anomalies usually appear days to months before earthquakes and are distributed along active faults or rupture zones through a number of earthquake cases; Chakraborty et al. (2018) used the NOAA/IR day-by-day data to study the effect of earthquakes on the OLR by the vorticity field calculation averaging method, and analysis revealed anomalous vorticity singularities in OLR patterns encircling the epicentral zone, emerging 3 days prior to the 2015 Nepal M7.3 earthquake and progressively dissipating post-event, which may be related to the release of seismic energy; Ma et al. (2006) systematically proposed the TFFA (Tidal Force Fluctuant Analysis) algorithm, which can effectively extract short-term thermal anomalies by integrating the gravitational tidal force and geostress; Guo et al. (2010) proposed an effective method of extracting thermal infrared precursors by utilizing the OLR data “Relative Power Spectrum Changes”, and effectively applied it to the related earthquake prediction research; Liao et al. (2021) proposed the mean interpolated amplitude enhancement ratio method and used it to detect thermal infrared anomalies before the Wenchuan M8.0, Lushan M7.0 and Jiuzhaigou M7.0 earthquakes; Pulinets (2009) established a conceptual framework integrating multidisciplinary validation of seismic anomalies through lithospheric-atmospheric-ionospheric (LAI) coupling interactions, offering a mechanism to elucidate thermal radiation precursors generated by multi-layer Earth system coupling during earthquake preparation phases. In recent years, breakthroughs have also been made in research on surface temperature and atmospheric scintillation as earthquake precursors. Molina et al. (2022) focused on the 2021 La Palma volcanic activity as their research subject. Using observations from GNSS-R, GNSS-RO, and ground-based stations, they found a weak positive correlation between the ionospheric scintillation S4 index and seismic energy. Additionally, they noted that the time lags of scintillation anomalies varied across different observation methods. Meanwhile, they used the Kp index to exclude geomagnetic storm interference, concentrating on the association between ionospheric electromagnetic perturbations and seismic activity; Semlali et al. (2023) used Land Surface Temperature data from FY-2F/VISSR between 2014 and 2022 to find that there was a positive anomaly of 1 °C–4 °C 1–4 days before M4+ earthquakes, which decreased after the earthquake. They determined the optimal parameters for the Standard Deviation method and focused on near-surface thermal radiation anomalies; Liu et al. (2024) utilized FORMOSAT-5/AIP satellite and global ionospheric map data to conduct an in-depth analysis of ionospheric anomalies prior to the 2017 M7.3 earthquake in the Iran-Iraq border region and explored their correlation with seismic activity; Semlali et al. (2025) utilized Swarm satellite data from 2014 to 2024 to analyze the correlation between the Y-axis component of the magnetic field vector and Total Electron Content anomalies. The results showed that the two exhibited positive anomalies 1–7 days prior to the earthquake, and the optimal threshold was determined, with larger anomalies corresponding to larger magnitudes (Mw), indicating that these anomalies can serve as reliable precursors to earthquakes.
Observational studies have confirmed robust statistical correlations between OLR anomalies and seismic events. However, the geophysical coupling mechanisms remain systematically fragmented across spatiotemporal scales. On the one hand, tectonic activity-driven microfracture frictional heat generation, pore fluid migration, or greenhouse gas (CO2/CH4) release (Qiang et al., 1992; Zhang et al., 2010; Cai et al., 1987; Xu et al., 1991; Wu et al., 2004) can directly affect the surface thermal radiation flux and change the radiative balance of the surface-atmosphere system; on the other hand, meteorological factors (e.g., microphysical properties of cloud bodies, turbulence in the atmospheric boundary layer) cannot be ignored in their interference with the OLR signal (Lu et al., 1987). Disparities in spatiotemporal resolution among satellite platforms (e.g., NOAA/AVHRR, MODIS, Fengyun) and heterogeneous tectonic regimes introduce complexities in interpreting OLR anomaly signatures across geological settings (Wu, 2012; Kang et al., 2018). Therefore, establishing a quantitative response model linking OLR anomaly parameters (e.g., anomaly area A, max ratio MR) to seismic energy parameters (e.g., released energy E, magnitude M) is critical for enhancing the physical interpretability of earthquake precursor identification.
This study focuses on the northern Tibetan Plateau (89°–105°E, 31°–43°N), utilizing outgoing longwave radiation (OLR) data from the Advanced Geostationary Radiation Imager (AGRI) onboard Fengyun-2 (FY-2) and Fengyun-4 (FY-4) satellites (2009–2024) to compile a dataset of 37 M ≥ 5.0 earthquakes. The analysis followed a three-stage framework: (1) time-frequency feature extraction: Wavelet transform was applied to decompose OLR time series into multi-scale components, with normalized wavelet coefficients (NWC) extracted from the 8–64-day seismogenic sensitivity window. Time-frequency joint analysis enhanced separation of radiation anomalies across varying temporal scales during earthquake preparation; (2) Abnormal signal identification stage: Establish a power spectrum estimation of the 1-day sliding window, and conduct abnormal frequency band detection in combination with the relative power spectral density threshold method to screen out abnormal OLR frequency bands. This approach effectively suppressed seasonal variations and meteorological noise, enabling quantitative precursor signal extraction; (3) Magnitude-tiered modeling: Events were categorized into three magnitude tiers based on Gutenberg-Richter relationships: M5.0–6.0 (n = 28), M6.0–7.0 (n = 7), and M ≥ 7.0 (n = 2). Earthquakes exceeding magnitude 7.0 were omitted from regression analyses following Kolmogorov-Smirnov test results indicating non-significant distributional differences (p = 0.12, α = 0.05) (Kolomogoroff, 2013). Stepwise polynomial regression with cubic interaction terms (e.g., E3, M3) was employed to establish nonlinear relationships between OLR power spectral parameters and seismic energy metrics. Model fitness was evaluated through coefficient of determination (R2), with overall explanatory power quantified via F-test (α = 0.05).
2 Materials and methods
2.1 Study area
The investigated region (89°–105°E, 31°–43°N) encompasses a pivotal segment of the Tibetan Plateau’s northern tectonic transition belt, and as a leading-edge response area to the ongoing collision of the Indo-Eurasian plate, it is a typical area of intra-terrestrial tectonic deformation and strong seismic activity (Figure 1). The region is characterized by the rigid base units of the Qaidam Massif and the Bayan Har Massif, and is controlled by a number of active tectonic systems, such as the Qaidam North Rim Fracture System, the East Kunlun Fault zone, and the Yushu-Ganzi Fault zone, and is a key transition zone between uplift of the Tibetan Plateau and the extrusion of material to the east.

Figure 1. Overview of the study area and distribution of earthquake cases from 2009 to 2024. The names of the fracture zones are in red: Sunan-Qilian Fault (SF), North Qaidam Fault (NQF), South Qaidam Fault (SQF), East Kunlun Fault (EKF), Maduo-Gande Fault (MGF), Yushu-Ganzi Fault (YGF), Gado Fault (GF), and Northwestern Qinling Fault (NWQF).
The North Qaidam Fault zone, acting as a progressive deformation front accommodating the plateau’s northward crustal extrusion, transitions northward into the Qilian orogenic belt along the Tibetan Plateau’s northeastern margin, adjacent to the more rigid Qaidam Massif on its southern side, and forms a tectonic convergence with the Arjin left-trending strike-slip fracture system on its western end. The surface cover of the fracture zone is dominated by the Gobi desert and salt lake deposits, and its low thermal inertia enhances the sensitivity of the tectonic stress-induced thermal-infrared anomaly response (Peng et al., 2012), and the seismic process of the 2009 Hercynian M6.4 earthquake is related to this special surface-tectonic coupling effect; As the main control fault zone at the northern boundary of the Tibetan Plateau, the East Kunlun Fault zone extends more than 1,500 km, and its western section is connected with the West Kunlun orogenic belt and its eastern section is adjacent to the Bayan Har Massif, which shows a sliding rate of 8–10 mm/yr (Zhao et al., 2022), and the 2001 M8.1 Kunlunshan earthquake generated a 426-km coseismic rupture zone, with a 96-km segment near Kunlun Pass highlighting strain partitioning dynamics of large-scale strike-slip systems (Chen et al., 2004); to the southeast, the Yushu-Ganzi Fault structurally links the East Kunlun and Xianshuihe tectonic systems while serving as a kinematic transition interface along the Bayan Har Block’s southern boundary, whose complex geometric barrier structure led to the localized accumulation of strains, which ultimately triggered the Yushu M7.1 earthquake in 2010.
Based on the China Earthquake Networks Center dataset (https://news.ceic.ac.cn/history.html), this study constructed an earthquake activity catalog for the period 2009–2024 (Table 1), 37 M ≥ 5.0 seismic events were cumulatively recorded in the study area, and their magnitude-frequency distributions conformed to the modified Gutenberg-Richter relationship (b = 0.89 ± 0.05) (Ren, 2012). It should be noted that some consecutive earthquakes in the same area within a short period of time (within 5 days), such as the 5.3-magnitude and 5.5-magnitude earthquakes that occurred in Zaduo County, Qinghai Province, China, on March 5 and 7 March 2024, respectively, had an interval of only 2 days between the two events. After comprehensive consideration, it was classified as a moderate-strength earthquake event, with the first occurrence time and magnitude used as the basis for recording. The seismic activity shows significant graded characteristics: seven M6.0-7.0 medium-strong earthquake events and two M ≥ 7.0 strong earthquake events. Among them, the 2021 Maduo M7.4 earthquake, as the largest example, was revealed to have generated a co-seismic surface rupture system of about 170 km along and near the East Kunlun Fault Zone through satellite image interpretation and field verification, resulting in a maximum surface radar line-of-sight deformation of about 2.2 m, with spatial spreading characteristics that showed a high degree of coupling with the geometry of the fracture zone (Wang et al., 2022).
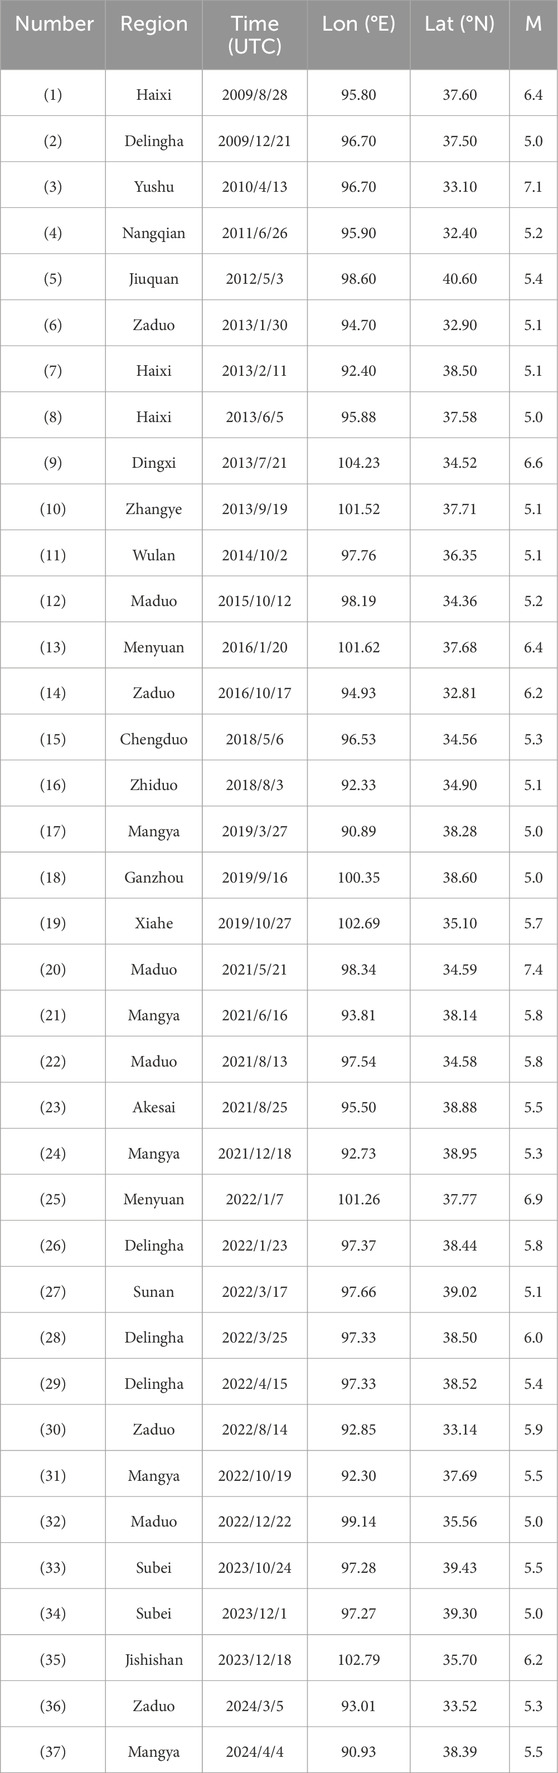
Table 1. Seismic information selected for this study.
2.2 Data collection
The Outgoing Longwave Radiation (OLR) datasets analyzed in this study were retrieved from Fengyun geostationary meteorological satellites, operated by the CMA National Satellite Meteorological Center (https://satellite.nsmc.org.cn/DataPortal/cn/home/index.html). OLR represents the broadband electromagnetic energy radiated by Earth’s surface into space, commonly referred to as thermal radiative flux, with its spectral range spanning 4 μm to longer wavelengths, and the value mainly depends on the temperature of the emitted subsurface (Wu, 2007). Operational production of OLR products commenced in June 2005 through the National Satellite Meteorological Center (NSMC) satellite data processing system, utilizing multispectral infrared (IR1, IR2) and water vapor channel radiometric data from FY-2C and subsequent geostationary satellites to generate eight daily time steps of thermal emission measurements, and at the same time integrates the data into a time series and produces OLR data files with different temporal resolutions of days, 5-day period, 10-day period, and months. OLR data files and store them in formats such as HDF for archiving (Guo et al., 2019).
Fengyun (FY) geostationary satellite-derived OLR datasets provide extensive spatial coverage with high-frequency sampling capabilities, covering the period from January 2009 to December 2024. These observations integrate multi-platform measurements from FY-2C/E/G and FY-4A/B satellites, leveraging their unique orbital configurations for continuous Earth radiation monitoring. To ensure data path consistency, satellite orbital intervals with sub-satellite point longitudes approximating 105°E are prioritized. This selection criterion stabilizes radiation reception geometry across observation cycles. Meanwhile, considering the direct influence of solar radiation and the range of time zones in China, the data from 15:00–21:00 UTC are selected daily, and the ground gas radiation can be basically balanced in this time. Given the voluminous nature of the datasets, analytical workflows were spatially constrained to the latitudinal (5°N-50°N) and longitudinal (55°E−150°E) domains for computational efficiency, and the latitude and longitude steps were all set to 0.05° to establish the original database of geostationary satellite remote sensing OLR. Our technical flowchart is shown in Figure 2, which details the logical relationships between our research objects, methods, content, and research objectives. In the research method module, we sequentially employed key algorithms including wavelet transform, power spectrum estimation, and least squares estimation.

Figure 2. Technical flow chart.
2.3 Methodology
2.3.1 Wavelet transform
Wavelet analysis facilitates geophysical signal decomposition via adaptive time-frequency resolution. This multi-resolution framework demonstrates particular efficacy in detecting transient anomalies within FY-4 OLR observations. These observations encapsulate base radiation components, annual/seasonal cycles, diurnal variations, and perturbation signals induced by meteorological processes (e.g., convective clouds, air mass advection) and tectonic activities, where wavelet techniques outperform conventional spectral methods in isolating seismically relevant anomalies. The wavelet transform can accurately separate the Earth’s base radiation field from the annually varying radiation field, while the wavelet transform is also able to efficiently remove short-period radiation fields (with periods ranging from a few hours to a few days) caused by rain clouds and hot and cold air currents.
The Daubechies-8 (db8) wavelet was implemented for multiresolution decomposition of OLR signals. Figure 3a displays the raw OLR temporal profiles along 97°E during 2024, while Figure 3b illustrates the time series of the wavelet-transformed 7th-order low-pass part of the OLR along the 97°E profile in 2024. Differential processing between 2nd-level and 7th-level approximations achieved spectral isolation in the intermediate frequency band, effectively suppressing both long-period baseline radiation (geothermal background, topography) and short-term atmospheric noise (cloud convection, air mass movement). Wavelet-processed OLR residuals (W/m2) at each pixel demonstrate bipolar oscillatory behavior in the temporal domain, with periodicities spanning the critical precursor window associated with imminent strong seismicity.

Figure 3. (a) Time series plot of raw OLR data and (b) time series plot of annual variation OLR data after wavelet transform processing along the 97-degree profile of longitude in 2024.
2.3.2 Power spectrum estimation method
Spectral analysis of signals is a key means to study signal characteristics. Deterministic signals can be analyzed by Fourier transform, while generalized smooth random signals are neither periodic nor satisfy the product of squares, so they cannot be strictly Fourier transformed, and the spectrum analysis is usually carried out by finding the power spectrum. Spectral estimation of wavelet-processed OLR signals employed Welch’s method, an enhanced variant of conventional periodogram analysis. This technique segments data into overlapping windows, computes individual periodograms (squared Fourier magnitude per segment), and averages them to suppress spectral variance. This approach enhances spectral stability while minimizing information loss through weighted averaging, with the overlapping window strategy preserving temporal continuity critical for detecting transient seismic precursors. It is calculated as in Equation 1:
where
Spectral estimation was conducted using a window length (n) of 64 days with a sliding window step (m) of 1 day. Spectral decomposition via Fast Fourier Transform (FFT) processed temporally segmented data, aligning timestamps to window terminal dates. The sliding-window algorithm executed daily pixel-wise incremental shifts across temporal profiles, systematically constructing continuous power spectral series through geometric sequence analysis. To quantify seismically induced spectral variations, amplitude normalization was performed against pre-seismic baselines, yielding pixel-level relative power spectral ratios. These ratios were then used to map spatiotemporal variations in power spectral characteristics (Guo et al., 2014). Leveraging 15 years of accumulated data, we calculated background values (multi-year averages) and standard deviations of relative power spectral ratios to establish statistically robust anomaly thresholds across the study region.
2.3.3 Least squares regression analysis
In order to quantify the nonlinear relationship between the OLR power spectrum anomaly parameters and the seismic energy parameters, a cubic polynomial regression model is constructed in this study using the Ordinary Least Squares (OLS) method. Its model expression is given by Equation 2:
where y is the OLR anomaly characteristics (anomaly area A, max ratio MR, and anomaly duration D), x is the seismic energy parameter (seismic energy E, seismicity level M),
The model fit goodness of fit was assessed by the Coefficient of Determination (R2), and its calculation method is given by Formula 3:
where RSS is the residual sum of squares, TSS is the total sum of squares, and
The overall explanatory power of the model is assessed by the F-test, and if the coefficient of determination (R2) is known, the F-statistic is calculated according to Equation 4:
where R2 denotes the coefficient of determination, where k represents the number of predictors (quantifying model sophistication) and n indicates total sample size (determining degrees of freedom for statistical testing). The global significance of the polynomial model was evaluated through F-statistic computation. The null hypothesis rejection criterion mandates either an F-statistic surpassing critical thresholds at defined degrees of freedom and a p-value below predetermined significance levels. This statistical significance demonstrates meaningful explanatory contributions from polynomial terms, thus validating the regression model’s capacity to capture nonlinear covariate relationships.
3 Results
3.1 Retrospective anomaly-performance analysis
In this study, all M ≥ 5.0 seismic events in the northern Tibetan Plateau study area (89°-105°E, 31–43°N) during the period 2009–2024 were categorized into three magnitude bins: M5.0–6.0 (n = 28), M6.0–7.0 (n = 7), and M ≥ 7.0 (n = 2), and the efficacy of OLR power spectrum anomalies in the detection of the retrospectivity of the seismic events was evaluated separately.
Based on the OLR relative power spectrum analysis method proposed by Guo et al. (2014), seven OLR feature bands (bands 1–7) are extracted, whose corresponding periods are 64 days, 32 days, 21 days, 16 days, 13 days, 11 days, and 9 days. Combining with the consensus of the previous studies on thermal infrared seismic anomalies (Liu et al., 1999; Qiang et al., 1999), we rule out the duration of less than 15 days of transient noise signals, focusing on the persistent anomalies associated with the gestation seismic process.
Anomaly determination criteria integrate regional OLR data characteristics with tectonic activity patterns (Luo et al., 2009; Yang et al., 2020; Zhang et al., 2024; Guo et al., 2024):
1. Intensity threshold: relative power spectrum amplitude exceeding six times the annual average power spectrum amplitude;
2. Spatial continuity: the anomaly needs to form a spatial cluster (excluding sporadic high value points), and the area of the cluster is not less than 2.0 × 10⁴ km2;
3. Time continuity: the anomaly signal should be maintained continuously for not less than 15 days;
4. Tectonic correlation: the anomalous areas are spread along active fracture zones and show dynamic migration characteristics.
Based on the above discriminative criteria, the OLR anomalies of all feature frequency bands in the study area are extracted, and the corresponding seismic events are restricted to be M ≥ 5.0 earthquakes occurring in the anomaly area and its neighboring 200 km (spatial range: 89°-105°E, 31–43°N). Table 2 demonstrates the retrospective test accuracies of all feature bands for different magnitude files. The statistical results show that for the M5.0–6.0 and M6.0-7.0 magnitude brackets, band 6 (i.e., with a characteristic period of 11 days) has the highest detection accuracy, 82.1% (23/28) and 100% (7/7), respectively; for the M ≥ 7.0 magnitude bracket, band 3 (i.e., with a characteristic period of 21 days) has the highest detection accuracy, 100% (2/2); for all magnitude brackets combined, band 6 has the best overall accuracy (81.1%) followed by band 3 (62.2%). Based on this, band 6 is preferred for the prediction models of M5.0–6.0 and M6.0–7.0 earthquakes, while band 3 is more appropriate for M ≥ 7.0 earthquakes, and subsequent studies and analyses for different magnitudes will be carried out based on the corresponding bands.

Table 2. Accuracy of retrospective tests for different magnitude classes in characteristic frequency bands.
As shown in Figure 4, the study of the spatial and temporal evolution process of the OLR relative power spectrum anomaly in band 6 and its associated seismic events indicates that the anomaly evolution of the 2023 Jishishan M6.2 earthquake presents three stages of characteristics: ① Initial stage (21 September 2023): the OLR relative power spectrum anomaly is first visible in the Sunan-Qilian fault zone northwest of the epicenter; ② Development stage (September 22-October 23): the anomaly showed an eastward migration and expansion trend along the Sunan-Qilian fault zone, and reached its first peak on October 7, with the main body of the anomaly located in the northwestern part of the epicenter, and the area covered extended to 1.0 × 10⁵ km2, with the maximum ratio reaching 16 times the regional annual average; after a short period of attenuation of 3 days, the anomaly showed a secondary peak on October 23, with the main body of the anomaly located in the northeastern part of the epicenter (104.5°-105°E, 37.5°-38°N), and its spatial distribution (about 0.7 × 10⁵ km2) and the anomaly intensity (about 14 times, Figure 5) were lower than the first peak, which is presumed to be related to the phased release of the precursor energy of the pregnant earthquake system; ③ Decay phase (October 23-October 30): the anomaly intensity and spatial extent of the synchronous rapid decay, until October 30 completely disappeared, the total duration of 40 days, forming a typical “double-peak” evolutionary pattern. It is noteworthy that the epicenter (102.79°E, 35.70°N) is located at the edge of the southwest gradient zone of the OLR power spectrum anomaly area (subpeak), whose observation aligns closely with established statistical patterns in fault zone systems, where geophysical anomalies exhibit spatiotemporal migration along tectonic corridors, and seismic epicenters predominantly localize within anomaly gradient zones (Zhang et al., 2024). Spatial analyses show that the anomaly migration paths are significantly consistent with the strike of the Sunan-Qilian fault zone (NW-SE direction), which further confirms that tectonic activities drive the OLR anomaly.

Figure 4. Spatiotemporal evolution of OLR relative power spectrum anomalies for the Jishishan M6.2 earthquake corresponding to band 6.

Figure 5. Regional time series of OLR power spectra in the region of Jishishan M6.2 earthquake (104.5°-105°E, 37.5°-38°N). Note: The black solid line is the 2023 day-by-day average of the OLR power spectrum in the region, the blue short line is the multi-year average of the regional OLR power spectrum (2009–2024), the green dotted line is the multi-year double standard deviation of the regional OLR power spectrum (2009–2024), and the red arrow points to the time of the Jishishan M6.2 earthquake. It should be noted that although there are two peaks in the OLR power spectrum in the precursor seismic anomaly of the Jishishan M6.2 earthquake, and the first peak intensity reaches 16 times, we chose to analyze the peak intensity closest to the epicenter due to the different geographic locations of the two peaks, so this time series curve shows only one peak of the anomalous OLR power spectrum.
Regarding Figure 5, it should be noted that there was an abnormal peak (approximately 4 times higher than normal) in this area in August. However, as can be seen from Figures 7c,d, the maximum ratio of local anomalies before the moderate-to-strong earthquake generally exceeded 8 times the normal value. Based on this, it is speculated that the August peak may not be a precursor to a moderate to strong earthquake, but is more likely related to minor seismic activity or meteorological factors. In October, the amplitude of anomalies in this region reached 14 times the normal level, causing a slight increase in the mean value and a significant deviation of twice the standard deviation. This fluctuation pattern indirectly suggests that the anomalies in October may be a potential precursor signal for a moderate to strong earthquake.
Due to differences in the spatiotemporal conditions of each earthquake, the spatiotemporal distribution of OLR anomalies preceding earthquakes exhibits diversity. Due to space constraints, this paper selects the 2023 Jishishan M6.2 earthquake (epicenter 102.79°E, 35.70°N, a recent strong earthquake of magnitude 6 or above) for a 2023 time-series curve analysis (Figure 5). It should be noted that this case study is only an individual example. The regional distribution characteristics of OLR anomalies preceding different earthquakes are similar, but also diverse and complex.
3.2 Seismic OLR spectral anomaly analysis
Moderate-magnitude seismicity (M5.0–6.0) predominantly clusters within the Qilian orogenic belt, Qaidam Basin, and Bayan Har block. Chronologically, the average annual frequency of this magnitude gear is 1.3 times in 2009–2019, while it enters the period of high-frequency activity in 2020–2024, and the average annual frequency rises to 2.8 times, with an increase of 115%. The OLR relative power spectral analysis shows (Table 2): For the M5.0-6.0 magnitude class, band 6 has the best retrospective detection performance with 82.1% (23/28) accuracy, followed by band 3 with 64.3% (18/28) accuracy. The statistics of spatial and temporal parameters show that 82.6% (19/23) of the earthquakes in the anomaly-generation time relationship occurred after the end of the anomaly, with the longest time from the beginning of the anomaly to the generation of earthquakes being 205 days, and the longest time from the end of the anomaly to the generation of earthquakes being 176 days, and that the anomaly window (beginning/end to the generation of earthquakes) for about 69.6% (16/23) of the seismic cases was centered within about 90 days. Spatially, the epicenters were distributed within a 200-km radius of the edge of the anomaly area, which is in line with the law of the “3-month window of seismicity”: within 3 months after the anomaly appeared, there was potential for earthquakes to be generated within the 200-km periphery of the anomaly area.
Larger events (M6.0–7.0) exhibit a bimodal spatial propagation pattern: east-west migration along the Qaidam Basin–eastern Tibetan Plateau tectonic corridor and north-south convergence toward the Qilian compressional front. In time, it gradually enters the “active period” from the “relatively quiet period”, with a low average of 0.4 earthquakes per year in 2009–2018, increasing to 0.6 earthquakes per year after 2019, as shown by the OLR relative power spectrum analysis (Table 2): For the M6.0-7.0 magnitude bracket, band 6 is able to achieve a 100% (7/7) detection rate, and band 7 is suboptimal with an accuracy of 85.7% (6/7), but with a wider spatial coverage of OLR power spectrum anomalies. In the time dimension, all earthquakes occurred after the end of the anomaly, with 85.7% (6/7) of the earthquake cases having an anomaly start-to-seismicity time ≤ about 120 days, and end-to-seismicity time ≤ about 100 days, with the only special case being the 2022 Delingha M6.0 earthquake, which had an anomaly start-to-seismicity interval of 216 days. Spatial analysis revealed all seismic events occurred within a 200-km radius of detected anomaly zones, indicating that the risk of M6.0–7.0 earthquakes is present in this range within 4 months after the appearance of the band 6 anomaly.
A total of two M ≥ 7.0 seismic events were recorded from 2009–2024: the 2010 Yushu M7.1 and the 2021 Maduo M7.4 earthquakes, both in the Bayan Har Massif. Band 3 OLR power spectral anomalies exhibited distinct precursory and post-seismic signatures during two major earthquakes. The Yushu M7.1 event displayed pre-seismic anomalies initiating 51 days before rupture, persisting for 21 days with peak intensity reaching 9 times the regional annual mean (3.0 × 10⁴ km2 anomaly zone within 200 km of the epicenter). Conversely, Maduo M7.4 post-seismic anomalies emerged 11 days post-rupture, lasting 37 days with 16 times mean intensity and spatial expansion to 1.5 × 10⁵ km2, where the epicenter resided within 200 km of the anomaly gradient boundary. Given the limited sample size (n = 2), these magnitude-specific patterns require validation through additional seismic events.
Based on the above laws, this study proposes the OLR power spectrum split-level prediction strategy, i.e., for M5.0–6.0 and M6.0–7.0 earthquakes: band 6 (with a characteristic period of 11 days) is prioritized for the precursor prediction of the OLR power spectra, and the seismic events mostly occur within 3 and 4 months after the anomalies, respectively, and need to pay attention to a 200-km radius around the periphery of anomalous zones; For M ≥ 7.0 earthquakes: anomalous signals in reference band 3 (with a characteristic period of 21 days), which need to be combined with an analysis of the regional tectonic stress field to improve reliability.
3.3 OLR-seismic energy anomaly correlation
The relative power spectrum anomaly of the top-of-atmosphere outward longwave radiation, as a core parameter characterizing the radiative energy balance of the earth-air system, which can sensitively reflect the coupled surface-atmosphere perturbations caused by tectonic activities (Qiang et al., 1999). In order to deeply analyze the mechanism of OLR band 6’s pregnant seismic response to M5.0–6.0 and M6.0–7.0 earthquakes of two seismic grades in the northern region of the Tibetan Plateau, we performed regression modeling on the quantitative relationships between the OLR anomaly parameters (anomaly area A, the maximum ratio MR, and anomaly duration D) and the seismic energy parameters (seismicity generation energy E and seismicity generation grade M), respectively, and the results are shown in Figure 6.

Figure 6. In the M5.0 - 6.0 earthquake sample, the fitted relationship between seismic energy E and (a) anomalous area, (c) maximum ratio MR, and (e) anomalous duration D; In the M6.0 - 7.0 earthquake sample, the fitted relationship between seismic energy E and (b) anomalous area, (d) maximum ratio MR, and (f) anomalous duration D. Note: Seismic energy release is quantified by the moment magnitude-energy conversion relationship, which is formulated as
For the M5.0–6.0 earthquakes, the anomalous area A (Figure 6a) and the maximu ratio MR (Figure 6c) of the OLR power spectra show an inflection point at about 17 × 1012 J with the increase of the seismic energy E, and the overall trend is “increasing first and then decreasing”, and the correlation curves of both of them correspond to R2 = 0.6734 and R2 = 0.8785. In comparison, the latter fit better, its regression model was able to explain 87.85% of the variance and passed the significance test with p < 0.05 in the F-test, while the former fit was not as good as the latter, but its explanatory power also reached 67.34%, which also passed the significance test. The anomaly duration D (Figure 6e) increases with the increase of the seismic energy E, and there is an obvious decreasing trend around the seismic energy E = 15 × 1012 J, showing the trend of “first flattening and then decreasing”, and the coefficient of determination is R2 = 0.1518, which can only explain a small part of the changes, the fitting effect is poor, and in the F-test, p > 0.05, it does not pass the significance test. Therefore, the anomalous area A and the maximum ratio MR of the OLR power spectrum can be used as effective indicators for predicting the generation energy E of the M5.0-6.0 seismic event in the northern region of the Tibetan Plateau, and their empirical relationships are given by Equations 5, 6:
where A represents the anomalous area, MR represents the maximum ratio, and E represents the seismic energy, which can be obtained from
For the M6.0–7.0 earthquakes, the anomalous area A (Figure 6b) and the maximum ratio MR (Figure 6d) of the OLR relative power spectra show an inflection point around the seismic energy E = 100 × 1012 J and E = 360 × 1012 J with the increase of the seismic energy E. The overall trend is “increase, then decrease, then increase”. The coefficient of determination of the correlation curve for the former is R2 = 0.6593, which can explain 65.93% of the variance, while the coefficient of determination of the latter is R2 = 0.1941, which is not a good fit, but neither of them passes the significance test of F. The anomalous duration D of the relative power spectrum of OLR (Figure 6f) shows an inflection point with the increasing of the energy of seismicity E, which occurs at around E = 320 × 1012 J, and the overall trend is “first increasing and then decreasing”, and the coefficient of determination of the fitted curve is R2 = 0.5043, which does not pass the significance test. Meanwhile, for the correlation fitting curve between anomaly area A and seismic energy E (Figure 6b), there is a long period of negative value of anomaly area A at seismic energy E = 250 × 1012 J to 450 × 1012 J, which is not physically meaningful. Therefore, there is no stable statistical correlation between OLR anomaly parameters and seismic energy for the M6.0-7.0 seismic events in this region, which may be limited by the sample size (n = 7) or the complexity of the generating mechanism, and it is not recommended to be used for energy prediction for the time being.
Therefore, it can be obtained that for the M5.0-6.0 magnitude class in the northern Tibetan Plateau, there is a good correlation between the anomalous parameters of the OLR power spectrum and the seismic energy E, and the seismic energy E can be predicted by the anomalous area A and the maximum ratio MR of the OLR power spectrum, which is of some significance for the prediction of the M5.0-6.0 magnitude class of the earthquakes in the northern Tibetan Plateau. Current analytical frameworks fail to establish statistically stable relationships between M6.0-7.0 seismic events and energy parameter E. This magnitude-specific correlation deficit persists despite rigorous empirical validation efforts. For this reason, this study further explores the statistical relationship between the OLR anomaly parameters and the corresponding seismic magnitude M, in order to reveal the differential response mechanism of the precursor signals of earthquakes of different magnitude classes.
For the M5.0–6.0 earthquakes, the anomalous area A of the OLR power spectrum (Figure 7a) shows a monotonically increasing trend with the increase of the seismicity M, and the anomalous duration D (Figure 7e) shows an overall trend of “increasing and then decreasing”, and the coefficients of determination of the related fitted curves are R2 = 0.6281 (p < 0.05, passed the F test of significance), respectively, R2 = 0.2646 (p > 0.05, did not pass F significance test). There is some statistical correlation between anomaly area A and earthquake magnitude M, but its goodness of fit to earthquake magnitude M is slightly lower than the goodness of fit of the regression model with seismic energy E, and its explanatory power decreases by about 5% compared with that of the seismic energy model (based on R2 comparison). The goodness of fit of the anomaly duration D to the earthquake magnitude M is very low, indicating that it is not statistically significantly correlated with the earthquake magnitude M. The anomaly peak MR (Figure 7c) shows a three-stage nonlinear change, i.e., “decreasing, then increasing, then decreasing”, with a coefficient of determination of R2 = 0.2602 (p > 0.05), which fails the F significance test, and the model can only explain 26.02% of the variance, which is insufficient to support its use as a reliable prediction indicator indicator. In conclusion, for the M5.0–6.0 earthquakes, the OLR power spectrum anomaly parameter has limited retrospective detection of the earthquake magnitude M. It is recommended to follow the strong correlation model with the seismic energy E for energy-constrained detection.

Figure 7. In the M5.0 - 6.0 earthquake sample, the fitted relationships between earthquake magnitude M and (a) anomaly area, (c) maximum ratio MR, and (e) anomaly duration D; In the M6.0 - 7.0 earthquake sample, the fitted relationships between earthquake magnitude M and (b) anomaly area, (d) maximum ratio MR, and (f) anomaly duration D.
For the M6.0–7.0 earthquakes, the OLR relative power spectrum anomaly area A (Figure 7b) shows an overall monotonically increasing trend with increasing magnitude M, especially after magnitude M = 6.5. The coefficient of determination of this fitted curve is R2 = 0.6576 (p > 0.05), which does not pass the F significance test. The maximum ratio MR (Figure 7d) and anomalous duration D (Figure 7f) show a three-phase trend of “first increase, then decrease, then increase” with the increase of seismic magnitude M, and both of them form a double inflection point at M = 6.2 and M = 6.7, and the coefficient of determination of the former is 0.9495 (p < 0.05), and the explanatory power of the polynomial model reaches nearly 95%, which is a good fit and passes the significance test, indicating that there is a strong nonlinear coupling between the maximum ratio MR and the magnitude M, while the latter has a coefficient of determination of R2 = 0.6930 (p > 0.05), which does not pass the F significance test. Therefore, for the M6.0–7.0 earthquakes in the northern region of the Tibetan Plateau, the earthquake magnitude M can be predicted by the OLR relative power spectrum maximum ratio MR, which has an empirical relationship expressed by Equation 7:
where MR is the maximum ratio and M is the earthquake magnitude.
Combining the above results, the preferred scheme of remote sensing precursor indicators for sub-seismic levels is proposed. For M5.0–6.0 earthquakes, the core indicators are anomaly area A (R2 = 0.6734), the maximum ratio MR (R2 = 0.8785), and the prediction target is the seismic energy E (the critical thresholds are both 17 × 1012 J), which can be combined with the moment magnitude-energy conversion relationship to realize the energy-constrained magnitude interval estimation; For M6.0–7.0 earthquakes, the core indicator is the anomalous maximum ratio MR (R2 = 0.9495), and the prediction target is the earthquake magnitude M. Segmented model and polynomial model joint constraints can be used to improve the magnitude prediction accuracy.
3.4 Comparison of different anomalous regions
A systematic statistical analysis of 37 moderate-to-strong seismic events (2009–2024) was conducted across four principal tectonic units in the northern Tibetan Plateau: the Qilian Mountains orogenic belt, Bayan Har block, Qaidam Basin, and eastern Tibetan Plateau (Table 3). These geotectonic domains exhibit marked regional disparities in seismicity patterns and corresponding OLR anomaly responses, revealing unit-specific crust-atmosphere coupling mechanisms.

Table 3. Distribution of epicenter area locations and corresponding anomaly statistics.
The most seismically active tectonic units in the region are the Qilian Mountains and the Bayan Har Mountains, both of which recorded 12 moderately strong seismic events (M ≥ 5.0), but there are two undetected seismic events in each region with an OLR power spectrum accuracy of 83.3%, and this good detection efficacy may stem from the fact that pre-seismic thermal radiation anomalies are more easily captured by remote sensing in arid zones. Among them, the Qilian Mountains area, as an important tectonic boundary on the northeastern margin of the Qinghai-Tibetan Plateau, is in the intersection area of the Qilian Mountains-Haiyuan Fault Zone and the Alashan Massif, and is subject to the tectonic coupling of the continuous eastward thrusting of the plateau and the blocking of the Ordos Massif, which has resulted in the formation of a belt of strong seismic activity dominated by the reverse type. Three M6.0–7.0 earthquakes were recorded during the study period, accounting for 42.9% of the total number of earthquakes of this magnitude file. The Bayan Har region shows anomalous OLR power spectra in band 3 of the OLR power spectrum for the two M ≥ 7.0 earthquakes, which we hypothesize may be related to the long-period radiative changes caused by the migration of deep fluids prior to the rupture of the large rupture zones (Ma et al., 2024).
The Qaidam Basin shows unique seismic detection characteristics, with 100% detection accuracy of 10 M5.0-7.0 seismic events (including the 2009 Haixi M6.4 earthquake) in the 6-band of the OLR power spectrum. This high seismicity and high OLR power spectrum detection accuracy may be related to its “basin effect”, i.e., the anomalies associated with the basin may be due to the oil and gas resources in the basin, and when the stress accumulates to a certain extent, the active tectonic zones and some microfractures at the periphery of the basin become the upward influx of greenhouse gases, which leads to a significant enhancement of the radiation effect. Enhancement effect is obvious (Zhang et al., 2018). Seismicity in the eastern Tibetan Plateau region exhibits obvious grading characteristics. The OLR power spectrum achieves complete detection for two M6.0-7.0 magnitude grade seismic events, but there is a missed detection for the M5.0–6.0 earthquake (Xiahe M5.7, 2019). This magnitude detection threshold may originate from the double effect of topography and cloud cover.
Comprehensive analysis reveals distinct seismogenic patterns across northern Tibetan Plateau’s tectonic units. The Qilian Mountains exhibit high-frequency moderate-to-strong seismicity (M5.0–7.0), where Band 6 OLR spectral ratios demonstrated 83.3% retrospective detection accuracy. In contrast, the Bayan Har block requires dual-band monitoring—Band 6 anomalies for general seismicity and Band 3 signatures for M ≥ 7.0 events. The Qaidam Basin showed predominant M5.0–6.0 activity (single M6.0–7.0 event since 2009) with 100% Band 6 detection efficacy, likely enhanced by basin amplification effects. Conversely, the eastern Tibetan Plateau presents detection challenges for M5.0–6.0 events via OLR spectral analysis, necessitating prioritized monitoring of M6.0–7.0 seismicity through integrated geophysical approaches.
Analyzed from a fault zone perspective (Table 4), the Sunan-Qilian fault zone and the northern Qaidam fault zone show the strongest seismicity. Among them, 11 seismic events occurred in the Sunan-Qilian fault zone during the observation period, including three M6.0–7.0 earthquakes, and their high-frequency activities may be related to the composite kinematic characteristics of this rift zone, which combines both thrust tectonics and strike-slip components. It is noteworthy that the OLR power spectrum anomaly showed spatial migration characteristics before the 2022 Menyuan M6.9 earthquake and formed a thermal radiation anomaly zone about 150 km long along the fault zone. Five seismic events, including the 2009 Haixi M6.4 earthquake, were recorded in the northern Qaidam fault zone. The eastern section of this fault zone (near Delingha) exhibits more intensive medium- and strong-seismic activity, which may be related to the non-uniform distribution of tectonic stresses by the rigid base of the Qaidam Basin (Peng et al., 2012).

Table 4. Distribution of fracture zone locations and corresponding anomaly statistics.
The Yushu-Ganzi Fault Zone and the Maduo-Gande Fault Zone show similar differences in detection effectiveness. Both of them detected one M5.0–6.0 earthquake and one M ≥ 7.0 earthquake during the study period. On the other hand, the Northwestern Qinling Fault Zone showed different detection efficacy, i.e., it accurately tested for two M6.0–7.0 earthquakes, but the test results were unsatisfactory for the M5.0–6.0 earthquakes. We consider that this difference may reflect the influence of different fracture zones’ sliding rates on the thermal radiation precursor signals - the sliding rates of the Yushu-Ganzi fault zone and the Maduo-Gande fault zone are 5–6 mm/yr and 4–6 mm/yr, in that order, which are much lower than the sliding rate of 12 mm/yr for the fracture zone at the northern margin of the West Qinling Mountains (Qiao et al., 2022; Huang et al., 2011), and the fracture zones with high slip rates are more prone to long-term thermodynamic perturbations due to continuous friction and creep-slip activities. Therefore, the prediction of medium-sized earthquakes (Xiahe M5.7 in 2019) is poor, whereas low-rate faults are usually accompanied by high-stress confinement with energy accumulating in the form of elastic strain, and thermal anomalies in such regions may be concentrated in the pre-slip or microfracture extension phase in the short term (weeks or months, e.g., anomalies of the Yushu M7.1 earthquake in 2010 started 51 days prior to the earthquake) prior to strong earthquakes (Song et al., 1944).
3.5 Seasonal-spectral anomaly correlation
The year was divided into 4 seasons based on natural months: spring from March-May, summer from June-August, fall from September-November, and winter from December-February of the following year. Classify the season in which the OLR power spectrum anomaly is located based on when it begins and ends (if the anomaly duration spans 2 seasons, it is classified according to the season in which it is located for the greater amount of time) (Zhang et al., 2024).
Table 5 presents seasonal seismicity distributions in the study area during 2009–2024. Table 6 analyzes seasonal occurrence frequencies of OLR power spectral anomalies associated with individual seismic events. According to the statistical analysis in Table 5, analysis reveals quasi-uniform seasonal seismicity distribution: (1) spring (10 events), summer (9), autumn (8), and winter (9); (2)Moderate-to-strong earthquakes (M6.0–7.0) demonstrate winter prevalence (42.9% frequency), while major events (M ≥ 7.0) exclusively cluster in spring; (3) The OLR relative power spectrum anomaly detection has full capture capability for springtime seismic events, but partial misses for other seasons, with the most significant misses in the fall, where the miss rate reaches 25% of the total.

Table 5. Seasonal statistics of earthquake occurrence in the study area from 2009–2024.

Table 6. Seasonal distribution statistics of OLR power spectrum anomalies.
Seasonal analysis of OLR power spectrum anomalies (Table 6) reveals pronounced spatiotemporal heterogeneity in their distribution patterns: (1) in the seasonal dimension, summer anomalies dominated the observed events, constituting 34.4% of total occurrences, while winter displayed the lowest incidence (6.3%), which may stem from the high temperature and relative atmospheric stability in summer, which is more favorable for thermal infrared anomaly identification; (2) In the magnitude dimension, M5.0-6.0 seismic anomalies occur mostly in spring (34.8%), M6.0-7.0 seismic anomalies are concentrated in summer and fall (42.9% each), and M ≥ 7.0 seismic anomalies are seen only in spring and summer (50% each).
Integrated with tectonic subdivision analysis (Table 7), OLR anomalies demonstrate distinct seasonal preferences across regions: (1) Qaidam Basin exhibited year-round anomalies with summer dominance (40% frequency), followed by spring, winter, and autumn; (2) Qilian Mountains showed concentrated summer occurrences (50%), complemented by autumn events (30%), with no winter anomalies detected; (3) Bayan Har Mountains displayed primary spring anomalies (50%), followed by autumn and summer, potentially associated with spring temperature increases and associated surface thermal radiation changes during snowmelt periods; (4) Eastern Qinghai-Tibet Plateau exclusively presented two autumn anomalies, likely attributable to enhanced thermal infrared detection efficiency under reduced cloud cover conditions during this season (Liu et al., 2025).

Table 7. Distribution of epicenter area locations and statistics of seasons where OLR power spectrum anomalies are located.
Taken together, the OLR power spectrum anomalies occur most frequently in summer and least frequently in winter. This may be attributed to: (1) the generally higher ambient temperature in summer, which enhances the thermal radiation of the object; (2) the better atmospheric transparency in summer and the relative stability of the atmosphere, which is less prone to complex meteorological conditions such as inversions at low temperatures, which reduces the scattering and absorption of the signals, and is conducive to the propagation of the thermal infrared signals; (3) Vegetation is capable of emitting thermal infrared radiation, which can be enhanced to some extent by the luxuriant growth of vegetation in summer. While the second highest frequency of anomalies in fall may be attributed to the reduced cloud cover in fall and the lithosphere-atmosphere coupling effect induced by the seasonal adjustment of atmospheric circulation, the scarcity of anomalies in winter may be related to the attenuation or even shielding effect of snow cover on the OLR radiation as well as the attenuation of the surface radiation by the inversion layer (Wang et al., 2018). However, there are some limitations in this part of the study. On the one hand, the small sample of winter earthquake cases (n = 2) affects the statistical significance of this study, and on the other hand, the modulation effect of topographic elevation on the thermal radiation transmission is not taken into account, which needs to be further validated by combining the InSAR surface deformation data with the observation of geothermal temperature field in a multi-parameter verification.
3.6 Source-OLR spectral anomaly correlation
Based on the statistics of the source mechanism solutions for 37 earthquakes in the northern Tibetan Plateau region from 2009 to 2024 (Table 8), this study reveals the correspondence between different fault types and OLR power spectrum anomalies. The statistical results show that (1) strike-silp earthquakes account for the highest proportion (45.9%, 17/37), and their OLR anomaly detection accuracy is 82.4% (14/17), and the missed cases are concentrated in the M5.0-6.0 magnitude, with a total of three undetected cases; (2) the reverse-fault type earthquakes were the next most common (27%, 10/37), with a detection accuracy of 80% (8/10); (3) the detection accuracy of the anomalies of the normal-fault type (n = 7) and thrust-fault type (n = 3) earthquakes was 100%, with the normal-fault type containing a single M6.0–7.0 earthquake and the thrust-fault type being distributed across the magnitude brackets. In terms of detection effectiveness, the OLR power spectra predicted 43.8%, 9.4%, 21.9%, and 25% of the strike-slip-type, thrust-type, normal-faulting, and reverse-faulting earthquakes, respectively.

Table 8. Correspondence statistics of seismic mechanism solutions and anomalies.
The study area is dominated by strike-slip type earthquakes (46%), which is closely related to the tectonic context of the northern Tibetan Plateau subjected to eastward extrusion shortening and lateral slip of the block (Zheng et al., 2016). Moreover, its high anomaly detection rate (82.4%) may be significantly related to the frictional heat generation effect during rapid sliding of the strike-slip faults, and such heat radiation signals are easily captured by satellite remote sensing. Although there are fewer samples of normal and thrust-strike earthquakes, the accuracy of OLR detection reaches 100%, which may reflect that the shallow thermal releases associated with tensional/compressive ruptures are more likely to penetrate the surface cover. The missed detection rate of 20% for the reverse earthquakes is presumably related to the dispersed spatial distribution of thermal anomalies due to the slower dip of the reverse faults, and such signals may be masked by cloud cover or topographic noise (Qin et al., 2010).
4 Conclusion
In this study, 37 M ≥ 5.0 seismic events in the study area of the northern Tibetan Plateau (89°-105°E, 31°-43°N) from 2009 to 2024 are characterized by longwave radiation (OLR) anomalies based on wavelet transform and relative power spectrum analysis methods, and the following conclusions are obtained through magnitude binning modeling:
1. Significant frequency-band dependence in detection efficiency. For earthquakes of different magnitudes, the OLR power spectrum feature bands show significant prediction advantages. For M5.0–6.0 and M6.0–7.0 earthquakes, band 6 (with a characteristic period of 11 days and prediction accuracies of 82.1% and 100%, respectively) is prioritized for precursor prediction of OLR power spectra, and most of the earthquakes occur within 3 and 4 months after the anomalies, so it is necessary to pay attention to the periphery of anomalies within the range of 200 km; for M ≥ 7.0 earthquakes: the anomalous signals in reference band 3 (with a characteristic period of 21 days and a prediction accuracy of 100%) need to be combined with the analysis of the regional tectonic stress field to improve the reliability.
2. Multi-scale correlation between anomaly parameters and seismic energy. A multi-frequency band-multi-parameter remote sensing prediction model is proposed for the OLR power spectrum anomalies in the study area: for the M5.0-6.0 magnitude class: anomalous area (A), anomalous maximum ratio (MR) and the seismic energy (E) show a significant non-linear correlation (R2 = 0.6734, R2 = 0.8785, p < 0.05), based on which, the energy prediction model is constructed, and the energy constraints of the energy interval estimation are realized by combining with the moment magnitude-energy conversion relationship; for the M6.0-7.0 magnitude class: anomalous maximum ratio (MR) vs. conversion relationship to realize the energy-constrained magnitude interval estimation; M6.0-7.0 magnitude file: the anomalous maximum ratio (MR) has a high explanatory power (R2 = 0.9495, p < 0.05) for the earthquake magnitude (M), and the segmented model can be used to enhance the magnitude prediction accuracy by using the segmented model and polynomial model joint constraints.
3. Control of anomaly distribution by tectonic activity. The Qilian Mountains and Bayan Har Mountains are high seismicity areas for medium and strong earthquakes, with 12 seismic events occurring during the study period, and the detection rate of the OLR power spectra reaches 83.3%, and it should be noted in particular that the Bayan Har Mountains, as the core area where two M ≥ 7.0 seismic events occurred, need to pay more attention to the anomalies in the 3-band of the OLR power spectra; the Qaidam Basin exhibits elevated seismic recurrence rates (M5.0–7.0) with 100% OLR spectral detection efficacy, attributed to basin-scale structural amplification effects. In contrast, moderate-magnitude events (M5.0–6.0) in the eastern Tibetan Plateau orogenic belt exhibit limited spectral detectability, revealing fundamental limitations in current thermal anomaly monitoring methodologies for complex tectonic regimes.
4. Seasonal variability of anomaly signals. The proportion of OLR anomalies is highest in summer (34.4%) and lowest in winter (6.3%), which is related to the temperature increase and atmospheric stability and transparency; the regional specificity is significant, with most of the OLR power spectrum anomalies in Qaidam Basin and Qilian Mountains concentrated in summer, whereas most of the anomalies in Bayan Har Mountains are concentrated in spring, and anomalies in the eastern part of the Tibetan Plateau appear only in fall. However, the winter anomalies occur only in the Qaidam Basin.
5. Impact of seismic source mechanism on detection effectiveness. Strike-slip earthquakes accounted for 46% (17/37) of the total number of earthquakes, with a detection accuracy of 82.4%, reflecting the thermal conduction advantage of steep-dip faults; normal and thrust earthquakes, due to the high efficiency of thermal release from tensional/compressive ruptures, all have an OLR detection accuracy of 100%; reverse earthquakes have a 20% missed detection rate, which may be related to the spatial dispersion characteristics of thermal anomalies on low-dip faults.
This study demonstrates that the multimagnitude staging prediction model based on OLR power spectrum anomalies can effectively reveal the seismic precursor characteristics in the northern Tibetan Plateau region, and its spatiotemporal heterogeneity is significantly coupled with regional tectonic activities, seasonal climate factors and physical processes of seismic sources, which provides a new quantitative basis for remotely sensed seismic monitoring.
5 Discussion
5.1 OLR split-band detection mechanisms
The seismic magnitude prediction model proposed in this study reveals differences in the response of OLR anomalies in different frequency bands to earthquakes of different magnitudes. The high detection rate (85.7%, 30/35) of M5.0–7.0 earthquakes in frequency band 6 (characteristic period of 11 days) may be related to its periodic characteristics and the energy release pattern of the earthquake incubation process. According to rock fracture experiments, the prenecessary stage of moderate to strong earthquakes (M5.0–7.0) is typically accompanied by accelerated microfracturing and expansion of the fracture network. Such processes may trigger short-period (7–15 days) thermal radiation fluctuations through surface-atmosphere coupling effects (Pulinets and Ouzounov, 2011). Abnormal signals from earthquakes with magnitudes greater than 7.0 tend to occur more frequently in band 3 (with a characteristic period of 21 days), which may reflect long-term disturbances caused by pre-slip or deep fluid migration in the locked segment of large fault zones during the late stages of stress accumulation. That is, due to changes in strain within the pores of the Earth’s lithosphere, large fault zones may experience pre-slip or restricted fluid stretching, leading to interstitial fluid flow and resulting in the redistribution of deep fluids (Fleischer, 1981). Dobrovolsky et al. (1979) provided an alternative description of the long-range stresses associated with earthquakes, which reasonably explains this phenomenon. For example, the anomaly that occurred 51 days before the M7.1 earthquake in Yushu was related to plastic deformation in the low-velocity layer of the lower crust of the Qinghai-Tibet Plateau. The thermal anomaly may have been caused by the combined effects of friction heat from the fault zone and fluid upwelling.
It is worth noting the magnitude-dependent features of the anomaly parameters. The anomalous area A of the OLR power spectrum and the anomalous maximum ratio MR of the M5.0–6.0 earthquakes show a nonlinear correlation with the energy E (R2 of 0.6734 and 0.8785, in that order). Among these, energy E is calculated based on the Gutenberg-Richter formula using the moment magnitude Mw (Gutenberg and Richter, 1942). This model is similar to the dislocation model proposed by Fleischer (1981), which derives the relationship between strain distance and magnitude using an empirical strain-energy equation to aid in predicting the time of earthquake occurrence (Fleischer, 1981). However, the difference lies in the fact that the dislocation model calculates energy E using the surface wave magnitude Ms according to Stacey (1969) formula
Virk and Singh (1994) studied the 1991 M7.0 earthquake in Uttarkashi, India, and found that the abnormal radon concentration prior to the earthquake was caused by local fluid migration triggered by distant stress. This study elucidated the mechanism of radon as a precursor to earthquakes from a structural physics perspective. In the 1966 M5.4 earthquake in the Garm region of the Soviet Union, the P/S wave velocity ratio (Vp/Vs) decreased significantly before the earthquake, and the duration of the anomaly was related to the magnitude of the earthquake. This phenomenon was attributed to changes in the microfractures of the crustal rocks and fluid permeability caused by stress (Rikitake, 1976). The above study reveals that the mechanism of earthquake precursors is related to changes in medium properties (such as microfractures and fluid migration) caused by crustal stress. Therefore, when using OLR power spectra to predict earthquakes, in addition to the model based on magnitude and energy described in this paper, analyzing the coupling mechanism between OLR anomalies and crustal stress-strain will be a key focus of future research.
5.2 Tectonic-OLR anomaly spatial constraints
The spatial variability of OLR power spectrum anomalies in the northern Tibetan Plateau region is significantly controlled by the active tectonic pattern. The high detection rates (100%, 83.3%, and 83.3%, respectively) in the Qaidam Basin, Qilian Mountains, and Bayan Har Mountains can be attributed to the following mechanisms: (1) the stress-shielding effect of the rigid basement of Qaidam on the peripheral ruptures, which concentrates the energy release at the basin margins and creates a significant gradient of thermal radiation (Zhang et al., 2018); (2) The arid areas of the Qilian Mountains and the Bayan Har Mountains have low vegetation cover, and the surface thermal radiation signals are highly penetrating and more easily captured by satellite remote sensing. On the contrary, the missed detection phenomenon in the eastern Tibetan Plateau may be related to the higher surface thermal inertia of alpine meadows, and such environments will have a certain damping effect on thermal anomalies (Liu et al., 1999).
For the fracture zones, the modulation effect of their sliding rates on the OLR anomalies should not be neglected. High-rate slip fractures (e.g., the Northwestern Qinling Fault, with a sliding rate of 12 mm/yr) are more prone to long-term dynamical perturbations due to the release of some strain energy from continuous creep-slip, while low-rate fracture zones (e.g., the Ganzi-Yushu Fault Zone, with a sliding rate of 5–6 mm/yr) are dominated by short-term strong anomalies. In addition, the 1.5 × 10⁵ km2 anomaly area observed after the M7.4 earthquake in Maduo in 2021 may be the result of large-scale CO2 emissions within the tensile section of the East Kunlun Fault Zone. This phenomenon implies that the combination of gas geochemical observations can enhance the interpretation reliability of OLR anomalies.
5.3 Seasonal anomaly detection mechanisms
The seasonal distribution of OLR anomalies (34.4% in summer) is characterized by a clear connotation of the dynamics of the earth-air system. Increased solar radiation in summer, more energy received at the surface, and significant surface warming enhance the release of longwave radiation from the surface to the atmosphere (Wei et al., 2024). At the same time, the atmosphere is relatively stable in summer, with fewer complex meteorological conditions such as inversions at low temperatures, which reduces the scattering and absorption of signals and facilitates the propagation of thermal infrared signals (Chen, 2015). In addition, summer is full of sunlight and the atmosphere is more transparent, which is conducive to the acquisition of clear remote sensing images by thermal infrared sensors.
The cause of the scarcity of winter anomalies (6.3%) may involve multi-scale coupled processes: (1) snow cover (thickness > 10 cm) can reflect up to 80% of surface longwave radiation, significantly attenuating the signal of true thermal anomalies (Wang et al., 2018); and (2) frequent occurrence of an inversion layer leads to attenuation of upward transmission of surface radiation (Qin et al., 2010); (3) The crustal loading rate slows down in winter (GPS observations show that the strain rate decreases by about 30%), and the energy accumulation of the seismogenic system enters into a relatively silent period (Wang et al., 2018). However, the winter anomaly case of the 2022 Menyuan M6.9 earthquake suggests that large-scale strike-slip earthquakes may break through the seasonal limitation, and its thermal anomaly generation mechanism needs to be further investigated.
5.4 Focal-OLR coupling mechanisms
Differences in the thermal radiation response of different earthquake source types reveal the role of fault kinematics in modulating precursor signals. The high detection rate (82.4%) of strike-slip type earthquakes may be due to two aspects: (1) the steeper dip angle of strike-slip faults (usually > 70°), which makes it easier for heat flux generated by frictional heat generation to be vertically conducted to the surface; (2) the shear heating effect accompanying strike-slip motion can increase the temperature of the fault zone, significantly changing the local thermal radiation background field (Wu et al., 2004). In contrast, the high miss detection rate (20%) of reverse-type earthquakes may be due to the horizontal diffusion of thermal anomalies due to low-angle retroflex (dip < 30°), and satellite data with insufficient spatial resolution (2 km spatial resolution for Feng Yun geostationary meteorological satellites) have difficulty in recognizing such diffuse signals. Notably, the anomalous signal intensity (maximum ratio exceeding 11 times the annual average) is significantly higher for the normal fault type of earthquake than for the other types, which may reflect that the rapid opening of the fissure accompanying tensional rupture promotes efficient upwelling of fluids from the depths.
5.5 Possible physical mechanisms
Regarding seismic thermal radiation anomalies, experts and scholars have proposed various hypotheses regarding their causes, such as the gas heat theory and the stress-induced heat theory. Qiang et al. (1999) “Earth gas release theory” posits that fractures in fault zones allow gases accumulated underground to diffuse to the surface, where they emit invisible infrared light under the influence of low-altitude electric fields, absorb solar and ground radiation, and trigger a greenhouse effect that causes regional warming. Zhang et al. (2010) proposed the “Earth greenhouse effect-atmospheric coupling” mechanism for the cause of seismic thermal infrared anomalies, pointing out that these anomalies are caused by the combined effects of basic and indirect causes. The basic cause (Earth greenhouse effect) is related to rapid accumulation of regional stress, active tectonics, and geological environment; the indirect cause (atmospheric coupling) is related to regional atmospheric water vapor content. Cai et al. (1987) used a fault creep model to infer that the abnormal ground temperature during the Tangshan earthquake may have been caused by accelerated fault creep prior to the earthquake. Xu et al. (1991) verified the “electromagnetic warming effect theory” and found that rock conductivity is highly sensitive to temperature. Increased crustal activity can cause the release of large amounts of greenhouse gases, forming an electromagnetic anomaly field. Under the influence of an electric field, greenhouse gases can produce a warming effect. Wu et al. (2004) experimentally confirmed that rock fractures are preceded by thermal infrared precursors, including two forms: abnormal average infrared radiation temperature-time curves and thermal infrared radiation anomalies. Furthermore, thermal infrared radiation anomalies exhibit spatial migration characteristics prior to fracture, developing in the sequence of “appearance-intensification-calm-fracture.”
In summary, currently, regarding the physical mechanisms underlying seismic thermal radiation anomalies, scholars have proposed a wide range of hypotheses and explanations from multiple perspectives, including Earth outgassing, greenhouse effect-atmospheric coupling, fault creep, electromagnetic heating, and rock fracturing. These research findings provide diverse perspectives for our deeper understanding of the phenomenon of seismic thermal radiation anomalies. However, due to the complexity and uncertainty of the seismic system, a unified and definitive theoretical framework has not yet been established, and further exploration and verification are still needed in the future.
5.6 Reflections and prospects
Previous studies have thoroughly confirmed that pre-earthquake thermal radiation anomalies are evident in a large number of observations. From a spatial perspective, thermal radiation anomalies generally exhibit a dynamic process of “onset-intensification-peak-attenuation-disappearance.” In terms of anomaly intensity, when reaching its peak, the area exceeding twice the standard deviation of the long-term average can span tens of thousands to hundreds of thousands of square kilometers, with the maximum relative power spectrum amplitude typically exceeding six times the average. From a temporal perspective, such anomalies typically emerge within 3 months prior to an earthquake, with durations ranging from 15 to 120 days (Guo et al., 2010; Wei et al., 2013; Zhang et al., 2024).
However, most studies have focused on only one or a few aspects of pre-earthquake precursors, and during the analysis process, they often use only a single parameter of OLR anomalies (such as the area of anomaly) and simply compare it with information from a single earthquake case. While this research approach can reveal some characteristics of pre-earthquake thermal radiation anomalies to a certain extent, it lacks comprehensiveness and systematicness. As a result, it is difficult to form a complete understanding of pre-earthquake thermal radiation anomaly phenomena, and there are certain limitations.
Therefore, this paper focuses its research perspective on the entire northern region of the Qinghai-Tibet Plateau. By conducting a comprehensive review and summary of all OLR anomalies preceding major earthquakes in this region over the past 15 years, the study not only statistically analyzed multiple key parameters of OLR anomalies but also introduced the Gutenberg-Richter relationship formula to precisely calculate the energy released prior to earthquakes using the moment magnitude (Mw) scale. The calculated results were then deeply integrated with OLR anomaly parameters. Building on this foundation, a magnitude-classified prediction model specifically tailored to the northern Tibetan Plateau has been developed. This research represents a significant breakthrough in terms of scope, parameter application, and the construction of prediction paradigms, providing new insights and methods for understanding the seismic precursors of the northern Tibetan Plateau and enhancing earthquake prediction capabilities.
Kang et al. (2011) used OLR grid data from NOAA polar-orbiting meteorological satellites to extract seismic anomaly information through vorticity quantification calculations. Their anomaly determination criteria relied solely on a significant increase in vorticity values 1–2 days before the earthquake. This method can be used for strong earthquake monitoring in many regions around the world; Fu et al. (2020) used daily OLR data obtained from NOAA satellites and calculated the difference between daily vorticity and the average vorticity of the previous 16 days to characterize OLR anomalies. This method took into account the influence of the hypocenter depth and focused on monitoring abnormal signals that appeared 2–15 days before the earthquake. Unlike previous studies, this paper utilizes OLR data from the FY series of geostationary meteorological satellites, dividing the signal into seven characteristic frequency bands. Based on anomalies in different frequency bands, the magnitude of the earthquake can be preliminarily determined. Further analysis combines the constructed fitting model and the coefficient of determination R2 to determine the earthquake magnitude and energy. The coefficient of determination R2 can reach up to 0.9495, indicating high fitting accuracy. Additionally, this method integrates various influencing factors such as regional tectonic units, seasonal changes, and seismic source mechanism solutions, enabling effective monitoring of OLR anomalies 1–4 months prior to moderate to strong earthquakes. Compared to the aforementioned two methods, more influencing factors are considered, resulting in higher fitting accuracy and providing more reliable precursory evidence.
Since 2007, the FY satellite has entered a stable operational phase and achieved routine OLR data collection. However, the limited number of strong earthquakes (M ≥ 7.0) in the study area (n = 2) casts doubt on the statistical significance of Band 3, and the generalizability of the constructed model lacks sufficient support. More data is needed for validation, and future research should utilize global datasets for extensive validation to enhance the model’s accuracy and practicality. Additionally, the terrain of the Qinghai-Tibet Plateau is complex, with the Bayan Kara Mountains exceeding 5,000 m in elevation, and the attenuation effect of OLR radiation transmission has not yet been quantified. Future studies should incorporate terrain correction models such as the Minard model to accurately assess terrain impacts. The current study relies on a single data source, using only OLR anomaly parameters. Future research should integrate multi-source remote sensing data such as surface temperature and aerosol optical depth to construct multi-parameter coupled prediction indices, thereby enhancing the scientific rigor of predictions.
Data availability statement
The original contributions presented in the study are included in the article/Supplementary Material, further inquiries can be directed to the corresponding author.
Author contributions
YG: Conceptualization, Methodology, Writing – original draft, Writing – review and editing. XG: Conceptualization, Funding acquisition, Software, Writing – original draft, Writing – review and editing. YZ: Funding acquisition, Software, Writing – review and editing. MZ: Conceptualization, Software, Writing – review and editing. DG: Investigation, Methodology, Writing – original draft. YX: Investigation, Writing – review and editing. QQ: Investigation, Writing – original draft. YF: Investigation, Writing – review and editing.
Funding
The author(s) declare that financial support was received for the research and/or publication of this article. This work was supported by the Natural Science Foundation of Gansu Province (Grant numbers [23JRRA1566]), the Gansu Provincial Major Science and Technology Project (Grant numbers [21ZD4FA011]), and the Major Science and Technology Project of the Ministry of Science and Technology of the People’s Republic of China (Grant numbers [2018YFC1503206]).
Acknowledgments
We would like to thank the National Satellite Meteorological Center of China Meteorology for providing the management of the infrared satellite data. We would also like to thank researcher YZ of the Lanzhou Geophysical National Astronomical Observatory and Research Station for his technical support and valuable suggestions.
Conflict of interest
The authors declare that the research was conducted in the absence of any commercial or financial relationships that could be construed as a potential conflict of interest.
Generative AI statement
The author(s) declare that no Generative AI was used in the creation of this manuscript.
Any alternative text (alt text) provided alongside figures in this article has been generated by Frontiers with the support of artificial intelligence and reasonable efforts have been made to ensure accuracy, including review by the authors wherever possible. If you identify any issues, please contact us.
Publisher’s note
All claims expressed in this article are solely those of the authors and do not necessarily represent those of their affiliated organizations, or those of the publisher, the editors and the reviewers. Any product that may be evaluated in this article, or claim that may be made by its manufacturer, is not guaranteed or endorsed by the publisher.
Supplementary material
The Supplementary Material for this article can be found online at: https://www.frontiersin.org/articles/10.3389/feart.2025.1621149/full#supplementary-material
References
Aliano, C., Corrado, R., Filizzola, C., Pergola, N., and Tramutoli, V. (2008). Robust satellite techniques (RST) for the thermal monitoring of earthquake prone areas: the case of Umbria-Marche October, 1997 seismic events. Ann. Geophys. 51, 2–3. doi:10.4401/ag-3025
Cai, Y. E., Yin, Y. Q., and Wang, R. (1987). Exploration of pre-seismic fault creep and geothermal anomalies. Acta Seismol. Sin. 2, 167–175.
Chakraborty, S., Sasmal, S., Chakrabarti, S. K., and Bhattacharya, A. (2018). Observational signatures of unusual outgoing longwave radiation (OLR) and atmospheric gravity waves (AGW) as precursory effects of May 2015 Nepal earthquakes. J. Geodyn. 113, 43–51. doi:10.1016/j.jog.2017.11.009
Chen, J., Chen, Y. K., Ding, G. Y., Wang, Z. J., Tian, Q. J., and Yin, G. M. (2004). Characteristics of surface co-seismic displacement distribution for the 2001 ms8.1 earthquake at kunlun pass west. Seismol. Geol. 378–392. doi:10.3969/j.issn.0253-4967.2004.03.003
Chen, X. T. (2015). Characteristics of summer precipitation in Shaanxi Province and its relationship with OLR in the Pacific region. J. Anhui Agric. Sci. 43, 205–208. doi:10.13989/j.cnki.0517-6611.2015.07.074
Deng, M. D., Geng, N. G., Cui, C. Y., and Zhi, Y. Q. (1995). Laws and characteristics of the variation of infrared radiation temperature of rocks with rock stress and its relation to acoustic emissivity. Chin. Earthq. Eng. J. 4, 79–86.
Dobrovolsky, I. P., Zubkov, S. I., and Miachkin, V. I. (1979). Estimation of the size of earthquake preparation zones. Pure Appl. Geophys. 117, 1025–1044. doi:10.1007/bf00876083
Fleischer, R. L. (1981). Dislocation model for radon response to distant earthquakes. Geophys. Res. Lett. 8, 477–480. doi:10.1029/gl008i005p00477
Fu, C. C., Lee, L. C., Ouzounov, D., and Jan, J. C. (2020). Earth’s outgoing longwave radiation variability prior to M ≥ 6.0 earthquakes in the Taiwan area during 2009-2019. Front. Earth Sci. 8, 364. doi:10.3389/feart.2020.00364
Geng, N. G., Cui, C. Y., and Deng, M. D. (1992). Remote sensing observations in rock fracture experiments and the beginnings of remote sensing rock mechanics. Acta Seismol. Sin. S1, 645–652.
Gorny, V. I., Salman, A. G., Tronin, A. A., and Shilin, B. V. (1988). Terrestrial outgoing infrared radiation as an indicator of seismic activity. Proc. Acad. Sci. USSR 301, 67–69. doi:10.48550/arXiv.2001.11762
Guo, X., Zhang, Y. S., Zhong, M. J., Shen, W. R., and Wei, C. X. (2010). Relative change of power spectrum method for extracting seismic thermal anomaly information and analysis of earthquake cases. Chin. J. Geophys. 53, 2688–2695. doi:10.3969/j.issn.0001-5733.2010.11.016
Guo, X., Zhang, Y. S., Wei, C. X., Zhong, M. J., and Zhang, X. (2014). Mid-wave infrared thermal radiation anomalies in the Wenchuan magnitude 8.0 and Zhongba magnitude 6.8 earthquakes. Acta Geosci. Sin. 35, 338–344. doi:10.3975/cagsb.2014.03.09
Guo, X., Zou, R., Zhang, X., and Wang, Y. (2019). Analysis of longwave radiation anomalies of several strong earthquakes in mainland China. China Earthq. Eng. J. 41, 1221–1227+1250. doi:10.3969/i.issn.1000-0844.2019.05.1221
Guo, Y. Q., Zhang, L. F., Zheng, K. X., Liu, Y., and Li, D. Y. (2024). Characterization of seismic thermal anomaly variations in South China. South China J. Seismol. 44, 14–23. doi:10.13512/j.hndz.2024.02.03
Gutenberg, B., and Richter, C. F. (1942). Earthquake magnitude, intensity, energy, and acceleration. Bull. Seismol. Soc. Am. 32, 163–191. doi:10.1785/bssa0460020105
Huang, X. M., Du, Y., He, Z. T., Ma, B. Q., and Xie, R. F. (2011). Late quaternary sliding rate of the eastern section of the wulanwula lake-Yushu fracture. Seismol. Geol. 33, 889–900. doi:10.3969/j.issn.0253-4967.2011.04.013
Jiao, Z. H., Yan, G. J., Zhao, J., Wang, T. X., and Chen, L. (2015). Estimation of surface upward longwave radiation from MODIS and VIIRS clear-sky data in the Tibetan Plateau. Remote Sens. Environ. 162, 221–237. doi:10.1016/j.rse.2015.02.021
Jing, F., Shen, X. H., Kang, C. L., Meng, Q. Y., and Xiong, P. (2009). A case study of longwave radiation anomalies preceding moderately strong earthquakes. Earthq. 29, 117–122.
Kang, C. L., Xu, Z. W., Xu, L. Z., Tian, Q. J., and Liu, D. F. (2003). Satellite thermal infrared precursor characterization of the magnitude 8.1 earthquake west of the Kunlun Mountains pass. Chin. Earthq. Eng. J. 1, 15–18+1+97.
Kang, C. L., Liu, D. F., Jing, F., Xiong, P., and Cao, Z. Q. (2011). Spatial-temporal characteristics analysis of infrared radiation anomalies during major earthquakes. Adv. Geophys. 1897–1905. doi:10.3969/j.issn.1004-2903.2011.06.002
Kang, R. H., Jiang, W., and Song, Y. F. (2018). Interpretation and analysis of geological environment and hazard types based on satellite remote sensing images. Sci. Technol. Inf. 16, 44+46. doi:10.16661/j.cnki.1672-3791.2018.28.044
Liao, H. Y., Dong, N., and Wang, G. (2021). Rapid extraction of pre-earthquake thermal infrared anomalies by a mean difference amplitude enhancement ratio method. Seismol. Geomagn. Obs. 42, 172–175. doi:10.3969/j.issn.1003-3246.2021.S1.057
Liu, D. F., Luo, Z. L., and Peng, K. Y. (1997). OLR anomalies before strong earthquakes. Earthq. 2, 126–132.
Liu, D. F., Peng, K. Y., Liu, W. H., Li, L. Y., and Hou, J. S. (1999). Thermal omens before earthquakes. Acta Seismol. Sin. 12, 710–715. doi:10.1007/s11589-999-0072-8
Liu, J. Y., Chang, F. Y., Chen, Y. I., Chang, L. C., Wen, Y. C., Wu, T. Y., et al. (2024). Pre-earthquake ionospheric anomalies and ionospheric storms observed by FORMOSAT-5/AIP and GIM TEC. Surv. Geophys 45, 577–602. doi:10.1007/s10712-023-09807-7
Liu, L., Huang, Y., and Gyakum, J. R. (2025). Clouds reduce downwelling longwave radiation over land in a warming climate. Nat. 637, 868–874. doi:10.1038/s41586-024-08323-x
Lu, J. H., Yang, Y., and Duan, X. (1987). A study of the effect of cirrus clouds on ejected longwave radiation on the Tibetan Plateau. Meteorol. Mon. 12, 22–27.
Luo, G. F., Zhao, W. M., Sheng, J. Q., and Ma, H. Q. (2009). A study on the grading characteristics of seismic anomalies for earthquakes of moderate to strong intensity in the northern part of the Qinghai-Tibetan Plateau. China Earthq. Eng. J. 31, 179–185.
Ma, J., Chen, S. Y., Hu, X. Y., Liu, P. X., and Liu, L. Q. (2010). Temporal and spatial variations of continental surface temperature fields and present-day tectonic activity. Earth Sci. Front. 17, 1–14. doi:10.1016/j.gsf.2010.09.002
Ma, W. Y., Xu, X. D., Xu, B. H., Zhang, X. C., and Xu, J. (2006). A study of the correlation of the MW9.0 earthquake sequence in Indonesia with warming anomalies and celestial gravitational tidal forces. Chin. Earthq. Eng. J. 28, 129–133+158.
Ma, W. Y., Yu, C., Yao, Q., Yuan, Z. Y., and Cui, J. (2020). Analysis of spatial and temporal variations of remotely sensed thermal coefficients of the Tangshan MS 5.1 earthquake on July 12, 2020. Earthq. Res. China. 36, 367–374.
Ma, Z. F., Zeng, H. Y., Luo, H. P., Liu, Z. M., Jiang, Y., Aoki, Y. S., et al. (2024). Slow rupture in a fluid rich fault zone initiated the 2024 Mw 7.5 Noto earthquake. Sci. Sci. 385, 866–871. doi:10.1126/science.ado5143
Meng, Q. Y., Kang, C. L., and Shen, X. H. (2014). Earthquake thermal infrared remote sensing. Beijing, China: Seismological Press.
Meng, Q. Y., Lu, X., Shao, N. Q., Shen, X. H., and Geng, F. (2016). Progress of seismic infrared background field research and construction of bright temperature background field in demonstration area. Acta Seismol. Sin. 38, 438–447+508. doi:10.11939/jass.2016.03.011
Molina, C., Semlali, B. E. B., González-Casado, G., Park, H., and Camps, A. (2022). Ionospheric scintillation anomalies associated with the 2021 La Palma volcanic eruption detected with GNSS-R and GNSS-RO observations. Int. Geosci. Remote Sens. Symp. (IGARSS). 7445–7448. doi:10.1109/igarss46834.2022.9883701
Ouzounov, D., Bryant, N., Logan, T., Pulinets, S. A., and Taylor, P. (2006). Satellite thermal IR phenomena associated with some of the major earthquakes in 1999–2003. Phys. Chem. Earth Part A. 31, 154–163. doi:10.1016/j.pce.2006.02.036
Peng, X. Q., Wu, F., and Zhang, Y. F. (2012). Logging evaluation of conglomerate reservoirs in the xiaoliangshan area of the Qaidam Basin. Oil Geophys. Prospect. 47, 136 –139+151+170+162. doi:10.13810/j.cnki.issn.1000-7210.2012.s1.015
Pulinets, S. A. (2009). Lithosphere-atmosphere-ionosphere coupling (LAIC) model. Electromagn. Phenom. Earthq. 9, 235–253. doi:10.1016/j.jseaes.2010.03.005
Pulinets, S. A., and Ouzounov, D. (2011). Lithosphere–Atmosphere–Ionosphere Coupling (LAIC) model – an unified concept for earthquake precursors validation. Asian Earth Sci. 41, 371–382. doi:10.1016/j.jseaes.2010.03.005
Qiang, Z. J., Kong, L. C., Wang, G. P., Li, Q. Z., Lin, C. G., and Xu, X. D. (1992). Earth outgassing, thermal infrared anomalies and seismicity. Chin. Sci. Bull. 4, 2259–2262.
Qiang, Z. J., Dian, C. G., Li, L. Z., Xu, M., Ge, F. S., Liu, T., et al. (1999). Atellitic thermal infrared brightness temperature anomaly image—short-term and impending earthquake precursors. Sci. China Ser. D. Earth Sci. 42, 313–324. doi:10.1007/bf02878968
Qiao, X., Zhou, Y., and Zhang, P. Z. (2022). Along-strike variation in fault structural maturity and seismic moment deficits on the Yushu-Ganzi-Xianshuihe fault system revealed by strain accumulation and regional seismicity. Earth Planet. Sci. Lett. 596, 117799. doi:10.1016/j.epsl.2022.117799
Qin, K., Wu, L. X., and Ma, W. Y. (2010). Spatio-temporal characteristics of latent heat flux anomalies in the 2009 qinghai haixi earthquake sequence. Sci. Technol. Rev. 28, 68–73.
Qu, C. Y., Shan, L. J., and Ma, J. (2006). A discussion on the genesis of the high-temperature strips of the Red River rupture and their relationship with seismic activity. Acta Seismol. Sin. 28, 91–97.
Ramola, R. C., Singh, S., and Virk, H. S. (1988). A model for the correlation between radon anomalies and magnitude of earthquakes. Int. J. Radiat. Appl. Instrum. 15, 689–692. doi:10.1016/1359-0189(88)90229-4
Ren, X. M. (2012). A study of some problems of b-value statistics in seismic zoning. Prog. Earthq. Sci. 1, 2.
Saraf, A. K., and Choudhury, S. (2005). Cover: satellite detects surface thermal anomalies associated with the Algerian earthquakes of May 2003. Int. J. Remote Sens. 26, 2705–2713. doi:10.1080/01431160310001642359
Semlali, B. E. B., Molina, C., Park, H., and Camps, A. (2023). Fengyun-2F/VISSR land surface temperature anomalies between 2014 and 2022 and their potential correlation with earthquakes. Int. Geosci. Remote Sens. Symp., 2560–2563. doi:10.1109/igarss52108.2023.10282233
Semlali, B. E. B., Molina, C., Park, H., and Camps, A. (2025). Global correlation of Swarm satellites magnetic field and TEC data with M4+ earthquakes between 2014 and 2024. Adv. Space Res. 75 (10), 7589–7609. doi:10.1016/j.asr.2025.02.065
Song, H. Z., Liu, J., Wu, Y. X., and Liu, G. M. (1944). An attempt at seismic hazard estimation. North China Earthq. Sci. 12, 27–32.
Tapponnier, P., Zhiqin, X., Roger, F., Meyer, B., Arnaud, N., Wittlinger, G., et al. (2001). Oblique stepwise rise and growth of the Tibet Plateau. Sci. 294, 1671–1677. doi:10.1126/science.105978
Tronin, A. A., Hayakawa, M., and Molchanov, O. A. (2002). Thermal IR satellite data application for earthquake research in Japan and China. J. Geodyn. 33, 519–534. doi:10.1016/s0264-3707(02)00013-3
Virk, H. S., and Singh, B. (1994). Radon recording of Uttarkashi earthquake. Geophys. Res. Lett. 21, 737–740. doi:10.1029/94gl00310
Wang, Q. X., Sun, P. J., Liu, X. L., Li, S. Z., and Gao, J. C. (2018). Importance analysis of cultivated land area prediction and influencing factors based on random forest algorithm--taking Qingyang city in Gansu Province as an example. Bull. Soil Water Conserv. 38, 341–346. doi:10.13961/j.cnki.stbctb.2018.05.054
Wang, S. W., Ji, L. Y., Zhu, L. Y., and Liu, C. J. (2022). InSAR-based monitoring of co-seismic deformation field and fault slip of the 2021 Mw7.4 earthquake in Mado, Qinghai Province. J. Earth Sci. Environ. 44, 1016–1026. doi:10.19814/j.jese.2022.04017
Wei, C. X., Zhang, Y. S., Guo, X., Qin, M. Z., and Ning, Y. L. (2013). Thermal infrared and longwave radiation anomalies in the Yushu 7.1 magnitude earthquake. Prog. Geophys. 28, 2444–2452. doi:10.6038/pg20130523
Wei, L. J., Guo, J. F., Cai, H., and Qiang, Z. J. (2008). Satellite thermal infrared anomalies before the Wenchuan MS 8.0 earthquake. Prog. Earthq. Sci. 11, 55. doi:10.3969/j.issn.0253-4975.2008.11.056
Wei, Y. T., Ren, H. L., Duan, W. S., and Sun, G. D. (2024). MJO-equatorial Rossby wave interferences in the tropical intraseasonal oscillation. Clim. Dyn. 62, 9097–9116. doi:10.1007/s00382-024-07380-2
Wu, L. X., Liu, S. J., Chen, Y. H., Ma, B. D., and Li, L. L. (2008). Satellite thermal infrared anomalies and cloud anomalies before the Wenchuan earthquake. Sci. Technol. Rev. 10, 32–36.
Wu, L. X., Liu, S. J., Wu, Y. H., and Li, Y. Q. (2004). Remote sensing-rock mechanics (I)-Thermal infrared radiation patterns of discontinuous combined fault rupture and its significance for tectonic seismic precursors. Chin. J. Rock Mech. Eng. 1, 24–30.
Wu, X. (2007). Calculation of emitted longwave radiation flux density from FY-2C geostationary meteorological satellite data. Meteorol. Sci. Technol. 4, 474–479. doi:10.19517/j.1671-6345.2007.04.005
Wu, X. (2012). Climate and ecological changes in the three gorges reservoir area analyzed by satellite OLR and surface albedo data. Resour. Environ. Yangtze Basin 21, 145–149.
Xu, X. D., and Xu, X. M. (2001). Basic characteristics and causal mechanisms of pre-seismic infrared anomalies. Chin. Earthq. Eng. J. 3, 95–97.
Xu, X. D., Qiang, Z. J., and Lin, C. G. (1991). Thermal infrared anomalies of proseismic satellites and ground warming anomalies. Chin. Sci. Bull. 4, 291–294.
Yang, X., Zhang, T. B., Chen, R., Long, F., and Gan, G. Q. (2020). Study of longwave radiation changes before the Yushu and Jiuzhaigou earthquakes. J. Seismol. Res. 43, 79–86.
Zhang, A. H., Zhong, M. J., Yi, A. S., and Liu, P. (2024). Seismic thermal infrared anomalies in Xinjiang and neighboring regions. Seismol. Geol. 46, 1192–1206. doi:10.3969/j.issn.0253-4967.2024.05.011
Zhang, L. F., Guo, X., Zhang, X., and Tu, H. W. (2018). Thermal infrared bright temperature anomalies and basin effects before the 2017 Jiuzhaigou MS 7.0 earthquake. Acta Seismol. Sin. 40, 797–808+832. doi:10.11939/jass.20170207
Zhang, P. Z., Deng, Q. D., Li, Z. Q., and Li, H. B. (2013). Active ruptures, seismic hazards and their dynamical processes in mainland China. Sci. China Earth Sci. 43, 1607–1620. doi:10.1360/zd-2013-43-10-1607
Zhang, Y. S., Guo, X., Zhong, M. J., Shen, W. R., Li, W., and He, B. (2010). Wenchuan earthquake: brightness temperature changes from satellite infrared information. Chin. Sci. Bull. 55, 1917–1924. doi:10.1007/s11434-010-3016-8
Zhao, D. Z., Qu, C. Y., Bürgmann, R., Gong, W. Y., Shan, X. J., Qiao, X., et al. (2022). Large-scale crustal deformation, slip-rate variation, and strain distribution along the kunlun fault (tibet) from sentinel-1 insar observations (2015–2020). J. Geophys. Res. Solid Earth. 127, e2021JB022892. doi:10.1029/2021JB022892
Keywords: earthquake, outgoing longwave radiation, thermal infrared anomaly, split-band-multi-parameter remote sensing prediction, northern Tibetan Plateau, remote sensing seismic monitoring
Citation: Gong Y, Guo X, Zhang Y, Zhong M, Guo D, Xu Y, Qin Q and Fu Y (2025) Longwave radiation anomalies associated with seismic activity in the northern Tibetan Plateau. Front. Earth Sci. 13:1621149. doi: 10.3389/feart.2025.1621149
Received: 30 April 2025; Accepted: 22 August 2025;
Published: 05 September 2025.
Edited by:
Stelios M. Potirakis, University of West Attica, GreeceReviewed by:
Stylianos Stoulos, Aristotle University of Thessaloniki, GreeceGaetano De Luca, National Institute of Geophysics and Volcanology (INGV), Italy
Badr-Eddine Boudriki Semlali, UPC, Spain
Copyright © 2025 Gong, Guo, Zhang, Zhong, Guo, Xu, Qin and Fu. This is an open-access article distributed under the terms of the Creative Commons Attribution License (CC BY). The use, distribution or reproduction in other forums is permitted, provided the original author(s) and the copyright owner(s) are credited and that the original publication in this journal is cited, in accordance with accepted academic practice. No use, distribution or reproduction is permitted which does not comply with these terms.
*Correspondence: Xiao Guo, Z3VveEBnc2R6ai5nb3YuY24=