 Monica Ionita
 Di Cai
 Viorica Nagavciuc
- 1Paleoclimate Dynamics, Alfred Wegener Institute for Polar and Marine Research, Bremerhaven, Germany
- 2Forest Biometrics Laboratory – Faculty of Forestry, “Stefan cel Mare” University of Suceava, Suceava, Romania
- 3Frontier Science Center for Deep Ocean Multi-spheres and Earth System and Physical Oceanography Laboratory, Ocean University of China, Qingdao, China
Mountain regions are warming rapidly, yet long records across elevation are rare. This study presents the first comprehensive assessment of temperature extremes across an elevation gradient in the Bavarian Alps at two long-term observatories: Hohenpeißenberg (977 m a.s.l., 1781–2024) and Zugspitze (2,956 m a.s.l., 1901–2024). We find a pronounced warming at both sites, characterized by significant acceleration in recent decades. At Hohenpeißenberg, the annual mean temperature increased by approximately +0.07 °C dec−1 since 1781, intensifying to +0.51 °C dec−1 after 1980. At Zugspitze, the corresponding warming rates are +0.08 °C dec−1 since 1901 and +0.33 °C dec−1 post 1980. Warming trends exhibit strong seasonality: summer has warmed the fastest (e.g., +0.60 at Hohenpeißenberg and +0.62 °C dec−1 at Zugspitze, since the 1980s), whereas long-term winter warming was more modest (+0.07 °C dec−1 at Hohenpeißenberg since 1781, +0.11 °C dec−1 at Zugspitze since 1901) before sharply accelerating in recent decades. A weak elevation dependent warming (EDW) signal emerges in autumn, with high altitude temperatures increasing as rapidly as, or exceeding, those at lower elevation. In contrast, winter, spring, and summer warming magnitudes are greater at the lower elevation site, resulting in comparable or even stronger overall warming there. Temperature extremes have also changed markedly: cold extremes have declined significantly at both locations (e.g., the duration of cold spells has decreased by 16 days at Hohenpeißenberg and by 10 days at Zugspitze, over the period 1981–2024), while warm extremes exhibit a pronounced rise, especially in the Warm Spell Duration Index (WSDI), which has nearly doubled since the 1980s. Snow depth has declined across all seasons, with losses accelerating during the past 4 decades, particularly at Zugspitze. Interannual variations in warm and cold extremes are significantly modulated by leading Euro Atlantic modes of variability, including the North Atlantic Oscillation, the East Atlantic pattern, the Arctic Oscillation, and the Scandinavian pattern, whose influence peaks in winter. Collectively, these long-term records provide robust evidence of an anthropogenic influence on temperature extremes at the two long-term observatories, characterized by fewer and shorter cold spells, more frequent and persistent heatwaves, and declining snowpack. These findings highlight the urgent necessity of incorporating mountain specific observational evidence into regional climate adaptation and policy frameworks.
1 Introduction
Temperature extremes, including heatwaves and cold spells, are among the most societally impactful manifestations of climate variability and change (Fischer and Schär, 2010; Perkins and Alexander, 2013; Manning et al., 2019; Russo et al., 2019; Smid et al., 2019; Masson-Delmotte et al., 2021; Doshi et al., 2023; Nygård et al., 2023; Wu et al., 2025). While gradual shifts in mean climate are important, it is the frequency, intensity, and duration of temperature extremes that often determine ecological resilience, human health risks, and infrastructural vulnerabilities (Robine et al., 2008; García-Herrera et al., 2010; Chakraborty et al., 2019; Benz and Burney, 2021). Over recent decades, scientific consensus has increasingly emphasized that extreme events are intensifying under global warming. Yet, most of the existing literature has concentrated on lowland and urban sites, where heatwaves and cold spells have immediate consequences for densely populated areas. Comparatively less attention has been devoted to high-altitude stations, even though mountainous environments are particularly sensitive to climatic shifts and provide unique insights into the dynamics of temperature extremes across elevation gradients (Pepin et al., 2015; IPCC, 2019).
Mountains cover nearly a quarter of the Earth’s land surface and serve as critical “water towers,” biodiversity refuges, and climatic buffers (Immerzeel et al., 2020). Their thermal regimes are, however, exceptionally complex. Lapse rate variability, cold-air pooling, and the influence of large-scale synoptic patterns all shape how temperature extremes manifest with elevation. While lowland heatwaves are well-documented (Ionita et al., 2021a; Masson-Delmotte et al., 2021; Barriopedro et al., 2023; Adeyeri et al., 2025), it is less clear how such events propagate into high-altitude contexts. Moreover, cold spells—traditionally viewed as less of a research priority in the era of accelerated warming—retain significance at high elevations, where persistent low temperatures can disrupt energy demand, alpine ecosystems, transport links, and even aviation safety (Chersich et al., 2015; van Ruijven et al., 2019; Liu et al., 2022; Li et al., 2024). Thus, a systematic investigation of both warm and cold extremes across elevation gradients is therefore indispensable for understanding the full spectrum of climate risks in mountainous regions (Pepin et al., 2022).
Next to the overall influence of climate change on the variability and trends of temperature, regional differences in elevation-dependent warming (EDW) may also be modulated by interannual to decadal shifts in large-scale atmospheric teleconnection patterns—including ENSO, NAO, and PDO (Monteiro and Morin, 2023; Bozzoli et al., 2024). For example, strongly positive phases of the NAO have been associated with warmer-than-average winters in the European Alps, particularly at higher elevations—a phenomenon linked to more frequent warm, moist air advection (Beniston, 2005a; Pepin et al., 2015; Abbas et al., 2024). Conversely, during persistently negative NAO winters, the Alps have experienced relatively cooler conditions and extended snowpack durations (Beniston, 1997; Kim et al., 2013; Bozzoli et al., 2024).
Mountain regions such as the Bavarian Alps are highly sensitive indicators of climate change, exhibiting not only rapid but also spatially variable warming trends (Hagg et al., 2012; Wastl et al., 2012). A crucial aspect of this variability is elevation-dependent warming (EDW), a phenomenon where temperature increases are more pronounced at higher elevations compared to surrounding lowlands (Pepin et al., 2015; Pepin et al., 2022; Dumont et al., 2025). Recent studies have highlighted that the rate of warming in the Alps, including Bavaria, exceeds that of adjacent lowland areas and frequently surpasses the global average (Ponds et al., 2025). For instance, analysis of long-term climate records and advanced modeling consistently show that temperature increases in the region can range from 0.4 °C to 2.4 °C per century, with the highest rates observed at elevations above 2,000 m, particularly during spring and summer (Zitzmann et al., 2025). Since the late nineteenth century, the mean temperature increase in the Alps has been estimated at approximately 2.0 °C ± 0.3 °C, underscoring the region’s marked sensitivity to global climate change (Hagg et al., 2012; Zitzmann et al., 2025). Thus, understanding the drivers and impacts of EDW in the Bavarian Alps is essential for interpreting regional climate trends and for developing effective adaptation strategies in these vulnerable mountain environments.
The focus on heatwaves and cold spells, in this study, is especially pertinent given the current trajectories of climate change. Heatwaves have already emerged as one of the most pressing challenges facing mid-latitude societies, with events such as the 2003, 2015, 2018 and 2024 European summers demonstrating the cascading impacts on human health, energy systems, and agriculture (Ionita et al., 2017; Faranda et al., 2023; Luo et al., 2023; Rousi et al., 2023; Ionita and Nagavciuc, 2025). While such impacts are typically associated with lowland populations, heat extremes at altitude can accelerate glacier melt, destabilize permafrost, and alter alpine ecosystems. Conversely, cold spells—although decreasing in relative frequency—can still exert profound effects, particularly when sudden or unseasonal. In Alpine settings, late spring frosts remain damaging for agriculture, while winter cold extremes challenge energy supply planning and regional mobility (Beniston, 2005b; Zandonai et al., 2024; Osmolska et al., 2025). Thus, by evaluating both warm and cold extremes in a unified framework, this study addresses temperature variability as a two-sided risk spectrum rather than a unidirectional phenomenon, by employing two of the longest meteorological records in the Bavarian Alps, namely Hohenpeißenberg and Zugspitze.
Long-term meteorological observation data in mountain areas are crucial for understanding the complex climate dynamics and variability inherent to these regions. Mountains influence local and regional climate patterns through orographic effects, temperature gradients, and unique precipitation regimes, which are vital for water resource management, natural hazard prediction, and ecological conservation (Beniston, 2003). However, the availability of long-term meteorological data in mountain areas remains severely limited. Many mountain regions are characterized by difficult terrain, remote locations, and limited infrastructure, which hinder the establishment and maintenance of weather observation networks (Beniston, 2003; Pepin and Lundquist, 2008; Abbas et al., 2024). This data scarcity is compounded by inconsistent data collection practices, equipment failures, and gaps in historical records, leading challenges in obtaining comprehensive datasets for analysis (Lo et al., 2011; Shakoor and Ejaz, 2019; Pepin et al., 2022). The resulting data deficiency hampers effective climate monitoring, reduces the accuracy of predictive models, and impairs the ability of policymakers and local stakeholders to make informed decisions. Thus, improving long-term observational coverage in mountain regions requires increased investments in infrastructure and innovative approaches, such as remote sensing and community-based monitoring, to bridge these gaps and enhance our understanding of climate variability and change in these critical landscapes.
High-altitude environments are particularly sensitive to global warming, with numerous studies showing amplified temperature trends in mountains compared to surrounding lowlands (Rangwala and Miller, 2012; Pepin et al., 2015; Pepin et al., 2022). Continuous measurements from mountain stations are therefore crucial for documenting processes such as snowpack changes, glacier retreat, and shifts in the hydrological cycle, all of which have cascading impacts on ecosystems and societies (Beniston, 2005a; IPCC, 2019). Beyond their local significance, such records provide essential benchmarks for validating reanalyses and climate model outputs in complex terrain where observational coverage is sparse (Auer et al., 2007; Durand et al., 2009; Bozzoli et al., 2024). In this respect, Germany provides a particularly useful data source for such investigations. Its meteorological network includes two long-standing high-quality observatories: Hohenpeißenberg (977 m.a.s.l., in the Bavarian Alpine foreland) and Zugspitze (2,956 m.a.s.l, Germany’s highest peak). Both stations are operated by the German Meteorological Service (www.dwd.de), and together they offer an exceptional multi-decadal archive of continuous measurements extending back more than two centuries in the case of Hohenpeißenberg and more than a century in the case of Zugspitze. This longevity and data continuity are rare in mountain environments, where instrumental records are often short, fragmented, or compromised by relocation and methodological changes. As such, these two sites make it possible to address not only present-day differences in temperature extremes between low-mountain and alpine conditions, but also their historical evolution over time.
Analyzing the long-term observational record from Hohenpeißenberg and Zugspitze is particularly valuable for several reasons. First, the comparison across altitudes enables us to quantify the magnitude of attenuation—or amplification—of temperature extremes with elevation. Second, the analysis can reveal whether the timing and persistence of extreme events are synchronous across elevations, or whether mountain environments experience distinct temporal signatures due to their unique boundary-layer dynamics, including processes such as cold-air pooling, persistent temperature inversion layers, and terrain-induced turbulence. At Hohenpeißenberg, located on a mid-elevation ridge, nocturnal cold-air drainage and frequent inversions can enhance surface cooling and decouple near-surface air from the free atmosphere. In contrast, Zugspitze, situated above the inversion layer and more strongly coupled to the free atmosphere, is less affected by local boundary-layer processes and thus more representative of regional-scale temperature variability. These differing boundary-layer regimes may therefore contribute to the contrasting long-term temperature trends observed between the two sites. Third, the long observation period allows us to examine potential long-term trends and variability, thereby linking local events to broader-scale climate change narratives in Central Europe and beyond. Importantly, establishing robust baselines from such datasets contributes to ongoing discussions around “elevation-dependent warming,” a phenomenon suggesting that high-mountain regions may respond disproportionately to global climatic shifts. Moreover, our study was motivated also by the fact that although these long-term meteorological records are available, no in-depth analysis has been performed so far for extreme temperature events. The objective of this paper is therefore three-fold: (1) to characterize the frequency, intensity, and temporal structure of heatwaves and cold spells at two mountain observatories (Hohenpeißenberg and Zugspitze) with different elevations; (2) to investigate the degree of similarity and divergence in extreme event patterns across the two sites over multi-decadal timescales; and (3) to analyze the large-scale drivers on seasonal temperature variability at these high-altitude stations.
2 Data and methods
Hohenpeißenberg observatory (Figure 1), established in 1781, is widely recognized as the world’s oldest mountain observatory with continuous records, and it’s situated at 977 m.a.s.l. in the Bavarian foothills (Winkler, 2015; 2023). The time-series form Hohenpeißenberg, which capture ∼150 years of daily data for different climate variables (e.g., minimum, mean, and maximum air temperature, precipitation), provide an unparalleled record for studying long-term variability of temperature, precipitation, and atmospheric circulation in central Europe. The station has served as a reference point in many European climatological datasets and reconstructions, including HISTALP (Auer et al., 2007) and plays a central role in homogenization and quality-control efforts. The Zugspitze station (Wege, 2000), situated at 2,956 m.a.s.l., complements Hohenpeißenberg by capturing conditions at the highest elevation regularly monitored and provides the highest meteorological observations in Germany, capturing conditions in the high-alpine environment (Figure 1). Together, these stations form a unique pair, bridging low-mountain and high-alpine climates within close geographical proximity. Their records are characterized by exceptional length, quality control, and continuity, making them invaluable for monitoring regional climate variability and change. As a high-alpine site, Zugspitze provides crucial observations for understanding elevation-dependent climate processes, including snow and ice dynamics, radiation budgets, and precipitation extremes influenced by orography. Together, the two stations form a unique lowland–alpine pair within a short horizontal distance, allowing direct comparisons of climate and extreme events across an elevation gradient.
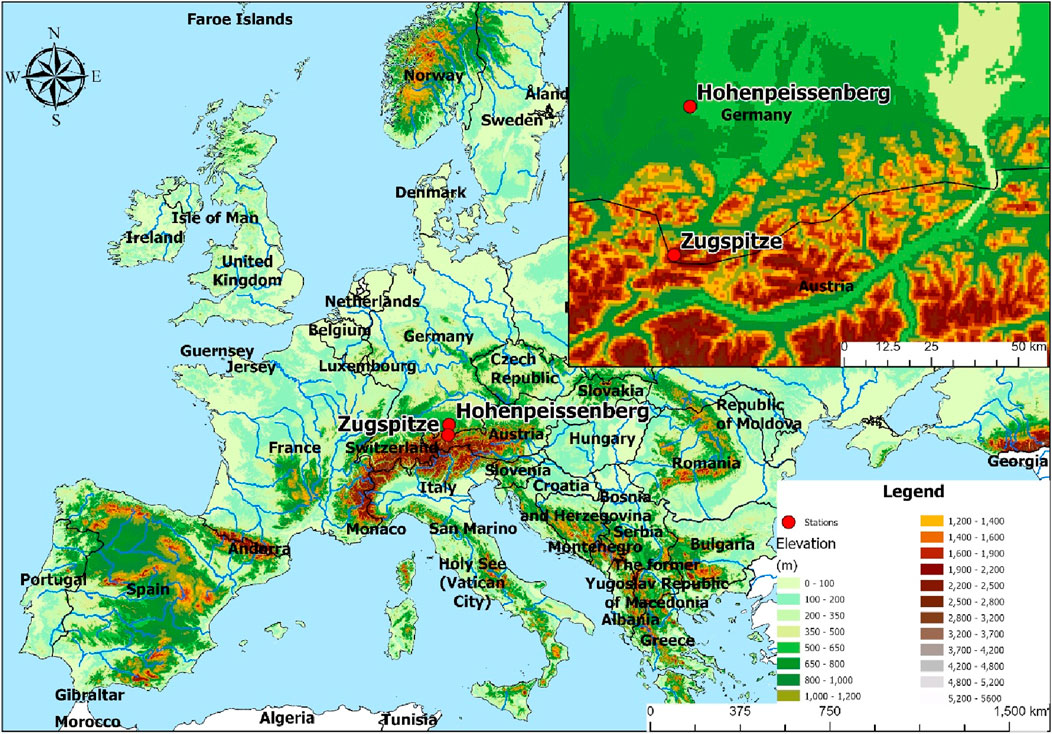
Figure 1. Location of the meteorological stations used in this study: Hohenpeißenberg (977 m) and Zugspitze (2956 m).
For the current study, we used both the daily and monthly mean (TT), minimum (TN) and maximum (TX) temperature records at Hohenpeißenberg and Zugspitze. For Hohenpeißenberg, the daily data for TT is available for the period 1781–2024, while the daily and monthly data for TX and TN are available for the period 1879–2024. For Zugspitze, both the daily and monthly TT, TN and TX are available over the period 1901–2024. The data are freely available from the Deutscher Wetterdienst data server (https://opendata.dwd.de/climate_environment/CDC/). We also made use of the monthly sum of daily height of snow pack (SC) at Hohenpeißenberg (i.e., 1937–2024) and Zugspitze (i.e., 1947–2024). The dataset is regularly updated with recent as well as recovered historical data, and the stations are nowadays selected and operated according to WMO guidelines. We have to mention that in the case of snow pack, the German weather service (DWD) applies an operational quality-control scheme to station reports, combining automated and manual checks. Nevertheless, according to the official data-set description, no homogenization is applied to the snow related variables and no systematic corrections. We therefore treat SC data as quality-controlled, but not homogenized input. To limit sensitivity to undocumented issues, our main inference regarding the SC emphasizes the post-1981 period (when the quality level of the data is highest and observing practices are more consistent), while longer-period results are shown for context. The anomalies for the different variable used in this study is computed relatively to the base period 1971–2000.
The evolution of heatwaves (HW) and cold spells (CS) in this study was analyzed by employing the Climpact R package (https://www.climdex.org/). HW and CS can be defined either by utilizing a threshold-based methodology (Perkins, 2015) or by using the exceedance of a fixed absolute value (e.g., daily maximum temperature >30 °C or daily minimum temperature <0 °C) (Robinson, 2001). The threshold-based method identifies HWs/CSs as periods where the daily maximum temperature (TX)/minimum temperature (TN) exceeds/falls below a specific percentile threshold for that calendar day, taking into account the regional temperature variations. In our study, we used both the threshold-based method, specifically employing the 90th (10th) percentile of daily maximum (minimum) temperatures within a 15-day window centered around each calendar day (Perkins and Alexander, 2013), and the fixed absolute method for the number of days with TN < 0 °C (i.e., frost days, FD) and TX < 0 °C (i.e., ice days, ID). For the percentile-based method, we have selected a 3-day period for our analysis. Our choice of a 3-day threshold aligns with the recommendations of the Expert Team on Climate Change Detection and Indices (ETCCDI) and allows us to focus on disastrous, extreme HW/CS events. Our baseline for calculating the 90th percentile for TX and the 10th percentile for TN, is the period of 1971–2000.
For the HW we used three complementary indices to characterize different aspects of heatwave intensity and duration: the Warm Spell Duration Index (WSDI), which quantifies the annual number of days that are part of HW events with at least three consecutive days when the daily maximum temperature (TX) exceeds its 90th percentile; the maximum temperature heatwave index (Tx90), defined as periods of three or more consecutive days with TX above the 90th percentile for the corresponding calendar days; and the minimum temperature heatwave index (Tn90), defined analogously for daily minimum temperature (TN) exceeding the 90th percentile. For the TX90p and TN90p, only the period May–September is taken into account. In the case of CS, we also use 3 different indices, namely: the cold spell duration index (CSDI, which represents the annual number of days contributing to events where 3 or more consecutive days experience TN < 10th percentile), the total number of frost days (the total annual number of days when TN < 0 °C) and the total number of ice days (the total annual number of days when TN < 0 °C).
To analyze the large-scale atmospheric circulation pattern associated with the occurrence of warm and cold periods, we use the monthly geopotential height anomalies at 500 mb level (Z500) and the zonal and meridional wind at the same level, based on the NOAA/CIRES/DOE 20th Century Reanalysis (V3) (NCEPV3) (Slivinski et al., 2019). This data set covers the period 1836–2015 and has a spatial resolution of 2° × 2°. The large-scale anomaly patterns associated with long-term changes in the seasonal mean temperature variability are analyzed through composite map analysis (von Storch and Zwiers, 1999). The composite maps are computed for the years when a certain index (e.g., mean air temperature) is higher (lower) than +1 (−1) standard deviation. Under a Gaussian assumption, this corresponds to selecting the upper and lower ∼16% of the distribution in each season—close to (but slightly broader than) a 90th/10th percentile rule—and yields balanced sample sizes across seasons, and the two stations. This balance improves the stability of composites and field-significance tests while still targeting distinctly warm/cold regimes. Composite significance is evaluated at each grid point using a two-sided Student’s t-test. We also used the time series of pre-defined monthly teleconnection indices, namely: the East Atlantic Pattern (EA), the East Atlantic-Western Russia pattern (EAWR), the North Atlantic Oscillation (NAO), the Artic Oscillation (AO), the Pacific North American Oscillation (PNA), the Polar Eurasia Pattern (POL), the Scandinavian Pattern (SCA) and the Atlantic Multidecadal Oscillation (AMO). All these teleconnection indices cover the period 1950–2024 and have been extracted from the Climate Explore (https://climexp.knmi.nl). From the monthly time series, we computed the seasonal means by averaging the months December/January/February (DJF), March/April/May (MAM), June/July/August (JJA) and September/October/November (SON). For correlations with teleconnection indices, we use a two-sided t-test with effective sample size to account for autocorrelation.
For our study, we have separated our time series into two different periods, before and after 1980s. The decision to separate the observational record into periods before and after 1980 is grounded in well-documented shifts in the global and regional climate system. From a global perspective, the late 1970s and early 1980s mark the onset of a pronounced and sustained anthropogenic warming signal, which emerges clearly above natural variability (IPCC, 2013; Masson-Delmotte et al., 2021). For Europe, specifically, the 1980s mark a transition toward more frequent and intense extreme events, particularly in temperature and precipitation (Zolina et al., 2010; IPCC, 2023; Ionita et al., 2024). Long-term analyses demonstrate an increase in heatwaves, warm nights, and heavy precipitation events since this time, consistent with the amplification of regional warming (Zolina et al., 2010; Vautard et al., 2023; Ionita et al., 2024). The period after 1980, therefore, represents a distinct climate regime, one in which anthropogenic forcing dominates and extremes have become increasingly prominent. By splitting the dataset at this point, it is possible to contrast the earlier, relatively stable period with the later era of accelerated change, thereby highlighting the emergence of new climatological baselines and the evolution of extremes.
The Theil–Sen estimator was employed to quantify the magnitude of trends. This method determines the slope as the median of all pairwise slopes in the ranked dataset (Sen, 1968; Gocic and Trajkovic, 2013; Helsel et al., 2020). To evaluate whether the identified trends were statistically significant, we used the Mann–Kendall (MK) test (Mann, 1945; Hamed and Ramachandra Rao, 1998). The MK is a nonparametric, rank-based test designed to detect the presence of monotonic trends. Its null hypothesis assumes independence and random ordering of observations, while the alternative indicates a systematic monotonic trend (Yue and Wang, 2002). Statistical significance was assessed at the 5% level (α = 0.05). For each series we (i) estimated Sen’s slope and computed trend-free residuals, (ii) tested lag-1 autocorrelation, and then applied an autocorrelation-robust MK. Specifically, we use the variance-corrected MK (modified variance with effective sample size based on the rank-ACF) as our primary significance test, and we confirm results with Trend-Free prewhitening (TFPW) (prewhiten residuals, add trend back, then performed the MK test).
3 Results
3.1 Seasonal and annual mean temperature evolution at Hohenpeißenberg (1781–2024)
The Hohenpeißenberg mean air temperature record provides one of the most valuable mountain station time series worldwide, capturing over 240 years of climate variability and change. The seasonal and annual mean temperature anomalies reveal both pronounced interannual variability and robust long-term warming, with the strongest acceleration observed after 1980. Linear trends differ across sub-periods (i.e., 1781–2024, 1901–2024, 1981–2024), reflecting the transition from predominantly natural variability to anthropogenically driven warming.
Winter shows modest long-term warming of +0.07 °C dec−1 since 1781, but the rate has accelerated to +0.56 °C dec−1 since 1981 (Figure 2a). Cold winters were particularly prominent in the early 19th century, such as during the Dalton Minimum (e.g., 1816, the “Year Without a Summer,” also affecting winter (Casty et al., 2007; Raible et al., 2016)), and around the 1940s. In contrast, recent decades include exceptionally mild winters, and the rate of warming has accelerated significantly, with the trend from 1981 to 2024 increasing to 0.56 °C dec−1. The winters with the highest positive anomalies (warmest years) were all recorded in the 21st century: 2015/16 (+3.60 °C above the climatological mean), 2019/20 (+3.74 °C above the climatological mean) and 2023/24 (+3.72 °C above the climatological mean).
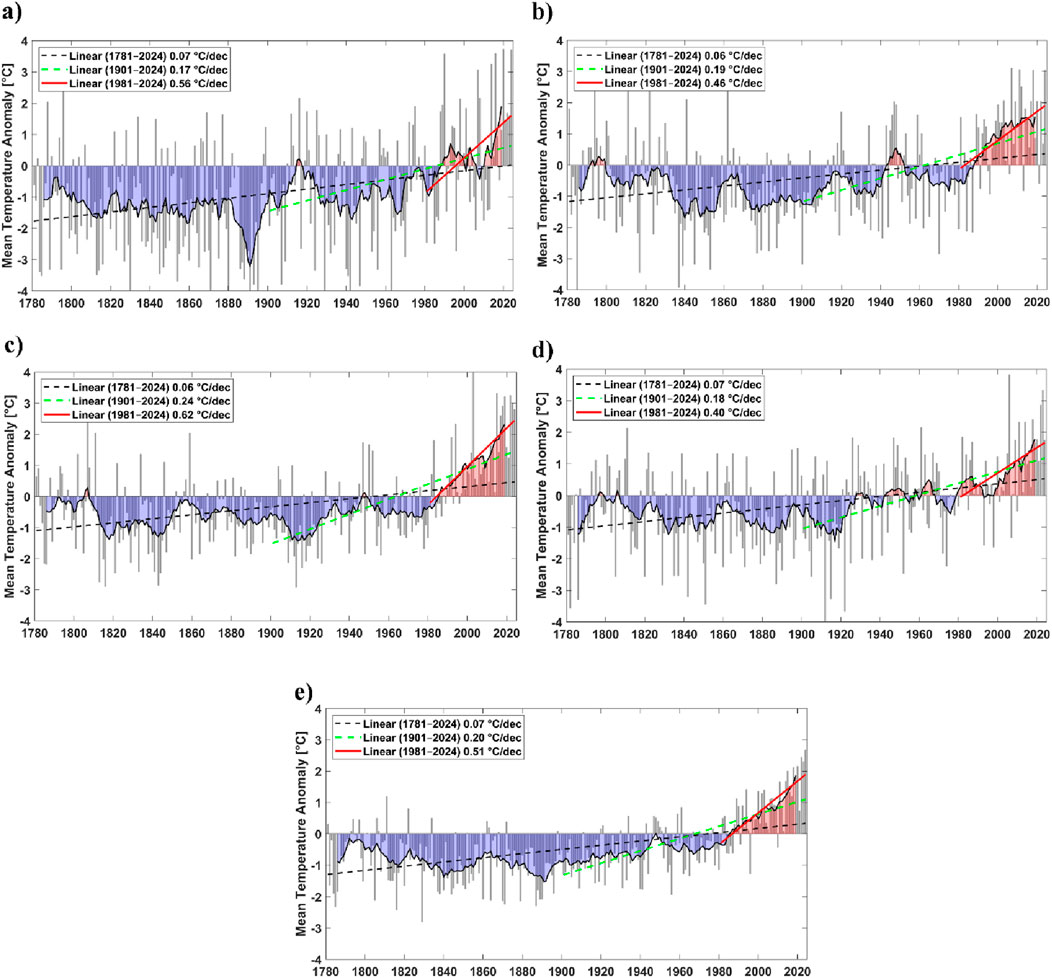
Figure 2. Temporal evolution of the seasonal and annual mean air temperature anomalies at Hohenpeißenberg, over the period 1781–2024. (a) Winter (DJF); (b) Spring (MAM); (c) Summer (JJA); (d) Autumn (SON), and (e) Annual. In (a–e) the black dashed line represents the linear trend over the period 1781–2024, the green dashed line represents the linear trend over the period 1901–2024, and the red line represents the linear trend over the period 1981–2024. Reference period to compute the anomalies: 1971–2000. Units: °C. Significant trends (i.e., 95% significance level) are highlighted with * in Table 1.
The spring season shows a warming trend of 0.06 °C dec−1 over the entire period. Similar to the winter trend, the rate of warming increases sharply in recent decades, with the 1901–2024 trend at 0.19 °C dec−1 and the 1981–2024 trend at 0.46 °C dec−1 (Figure 2b). Cold springs dominate much of the 19th century, while notable warm springs appear from the mid-20th century onwards. The coldest springs have all been recorded before 1900: 1875 (−4.53 °C below the climatological mean), 1816 (−3.46 °C below the climatological mean) and 1837 (−3.93 °C below the climatological mean). Opposite to this, most of the warmest springs have been recorded after 2000s. The years 2007 (+3.11 °C above the climatological mean), 2011 (+3.07 °C above the climatological mean) and 2024 (+3.05 °C above the climatological mean) stand out as extremely warm springs, consistent with European-scale early-season heat events (Ionita et al., 2020). Moreover, the strong springtime warming is consistent with the earlier onset of phenological phases in Central Europe (Menzel and Fabian, 1999).
Summer shows the most dramatic warming, with a rate of +0.62 °C dec−1 since 1981 (Figure 2c). While the long-term trend since 1781 is +0.06 °C dec−1, the 20th century already showed strong warming from 1901 onwards (+0.24 °C dec−1). Extremely cool summers occurred in 1816 (−2.89 °C, the Tambora eruption), 1843 (−2.86 °C below the climatological mean) and 1913 (−2.93 °C below the climatological mean), while recent decades include unprecedented warm summers such as 2003 (+4.61 °C above the climatological mean), 2015 (+3.32 °C above the climatological mean) and 2022 (+3.26 °C above the climatological mean), which were associated with persistent blocking and soil-moisture feedbacks (Fischer et al., 2007; Seneviratne et al., 2010; Bakke et al., 2023; Ionita and Nagavciuc, 2025). In the case of the summer season, it is noteworthy that since 2000, all years have exhibited exclusively positive temperature anomalies.
Over the whole analyzed period, autumn has warmed at +0.07 °C dec−1 since 1781 (Figure 2d). The recent period trends are 0.18 °C dec−1 (1901–2024) and 0.48 °C dec−1 (1981–2024), showing a clear acceleration in warming. As in the case of winter, spring and summer, cold autumns dominated the late 19th century, while recent decades feature record-breaking warmth. The coldest autumns have been recorded in 1782 (−3.57 °C below the climatological mean), 1912 (−4.24 °C below the climatological mean) and 1922 (−3.67 °C below the climatological mean). The warmest three autumns, over the period 1781–2024, have been recorded in 2006 (+3.83 °C above the climatological mean), 2022 (+2.86 °C above the climatological mean) and 2023 (+3.34 °C above the climatological mean).
The annual mean temperature anomalies reveal a persistent long-term warming trend of +0.07 °C per decade since 1781, which intensifies markedly to +0.51 °C per decade after 1981 (Figure 2e). The coldest multi-decadal interval aligns with the late Little Ice Age (ca. 1810–1850), whereas the most pronounced warming is concentrated in the most recent 4 decades. The three warmest years have been recorded in the past 3 years, namely: in 2022 (+2.45 °C above the climatological mean), 2023 (+2.31 °C above the climatological mean) and 2024 (+2.68 °C above the climatological mean). This accelerated warming is consistent with broader global mountain climate trends, where temperature increases have been amplified compared to adjacent lowland regions, largely as a result of snow–albedo feedbacks, enhanced radiative forcing, and boundary-layer processes (Pepin et al., 2015).
The Hohenpeißenberg record illustrates a clear transition from a climate dominated by natural variability (18th century to the beginning of the 20th century) to one dominated by strong anthropogenic warming (post-1980). Over the period 1981–2024, the trends are significantly steeper, ranging from 0.31 °C to 0.55 °C dec−1. This shows that in the last 4 decades, the rate of temperature increase has accelerated dramatically, a clear sign of recent anthropogenic climate change. Moreover, the most recent years consistently register the highest temperature anomalies. Summer emerges as the fastest-warming season, with direct consequences for extreme heat and drought. Winters also exhibit accelerated warming, consistent with cryospheric decline. The years 2003, 2018, 2019, 2020, 2022, 2023, and 2024 are among the warmest on record across all seasons and annually. The year 2003 stands out as a particularly extreme hot summer.
3.2 Seasonal and annual mean temperature evolution at Zugspitze (1901–2024)
The Zugspitze time-series representing the highest meteorological observatory in Germany (2,956 m.a.s.l.), provides critical insights into mountain climate variability and change. Like other alpine records, it reveals a pronounced warming trend across all seasons, with marked acceleration since the early 1980s (Pepin et al., 2015; Pepin et al., 2022). At Zugspitze, the winter temperatures warmed by +0.11 °C dec−1 over 1901–2024, but the rate of warming has accelerated dramatically in recent decades, with the trend from 1981 to 2024 increasing to 0.32 °C dec−1 (Figure 3a). Cold winters have dominated the first half of the 20th century, especially during the 1940s, while mild winters have prevailed since the late 1980s. The coldest winters were recorded in 1906/07 (−3.79 °C below the climatological mean), 1941/42 (−3.78 °C below the climatological mean) and 1962/63 (−3.88 °C below the climatological mean). The warmest three winters have been recorded in 1989/90 (+3.25 °C above the climatological mean), 2006/07 (+2.49 °C above the climatological mean) and 2019/20 (+2.79 °C above the climatological mean).
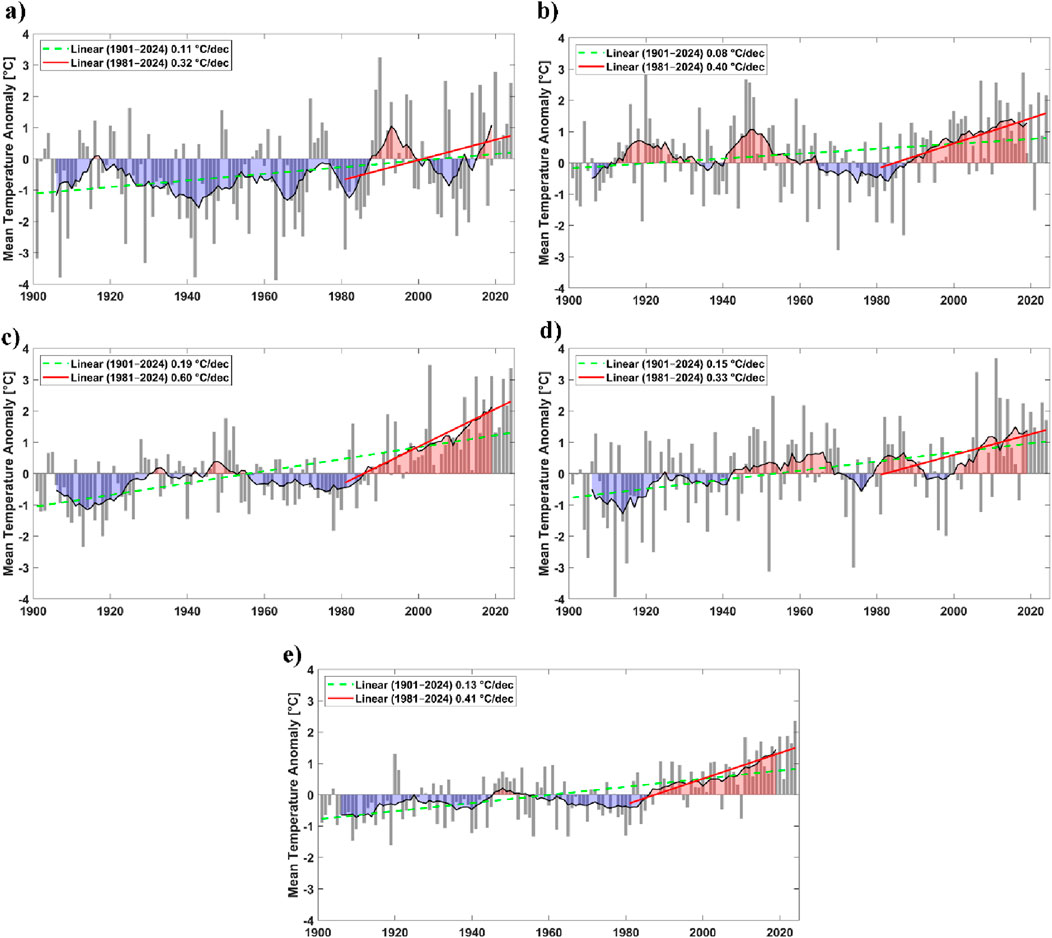
Figure 3. Temporal evolution of the seasonal and annual mean air temperature anomalies at Zugspitze, over the period 1901–2024. (a) Winter (DJF); (b) Spring (MAM); (c) Summer (JJA); (d) Autumn (SON), and (e) Annual. In (a–e) the green dashed line represents the linear trend over the period 1901–2024, and the red line represents the linear trend over the period 1981–2024. Reference period to compute the anomalies: 1971–2000. Units: °C. Significant trends (i.e., 95% significance level) are highlighted with * in Table 1.
In spring (Figure 3b), the earlier period shows a moderate warming trend of approximately 0.08 °C per decade, suggesting relatively slow spring temperature increases during much of the twentieth century. From 1981 onwards, the warming accelerates to about +0.40 °C per decade, indicating a significant increase in spring temperatures over recent decades. Early decades feature several cold springs, e.g., 1970 (−2.79 °C below the climatological mean), 1984 (−1.92 °C below the climatological mean) and 1987 (−2.31 °C below the climatological mean). Exceptionally warm springs have occurred in 1920 (+2.94 °C above the climatological mean), 1946 (+2.68 °C above the climatological mean) and 2018 (+2.89 °C above the climatological mean). The acceleration in spring warming is relevant for earlier snowmelt and advancing alpine phenology (Menzel and Fabian, 1999; Keller et al., 2000).
Summer warming at Zugspitze is particularly strong (Figure 3c). For the earlier period (1901–1980), a mild warming trend of approximately 0.19 °C per decade is observed, indicated by the green dashed line. This suggests a relatively slow and steady increase in summer temperatures during most of the 20th century. However, post-1980, the warming accelerates substantially, with a rate of approximately +0.60 °C per decade. This rapid increase in temperature anomalies after 1980 clearly marks an intensified warming phase in the late 20th and early 21st centuries at Zugspitze. This acceleration aligns with broader patterns observed in the European Alps, where post-1980 warming has intensified considerably. Recent studies (Beniston et al., 2018; Bozzoli et al., 2024) have also identified amplified warming in alpine regions during recent decades, highlighting elevation-dependent warming effects and changes in snow cover as key drivers. Cool summers were frequent in the early 20th century, e.g., 1913 (−2.33 °C below the climatological mean) and 1918 (−1.99 °C below the climatological mean), while the most extreme heat anomalies appear in recent decades: 2003 (+3.48 °C above the climatological mean), 2019 (+3.12 °C above the climatological mean) and 2024 (+3.38 °C above the climatological mean). As in the case of Hohenpeißenberg, it is noteworthy to mention that since 1997, all summers have exhibited exclusively positive temperature anomalies.
The Zugspitze autumn temperature anomalies reveal both a clear warming trend and considerable year-to-year variability marked by pronounced extreme temperature events. Autumn has warmed at +0.15 °C dec−1 since 1901, with a recent acceleration to +0.33 °C dec−1. This indicates that autumn temperatures are also increasing at a high rate, though slightly less than in summer (Figure 3d). Several striking extreme autumn years stand out, with notably cold periods around the 1910s, 1930s, and the late 1950s. The coldest autumns have been observed in: 1912 (−3.93 °C below the climatological mean), 1952 (−3.12 °C below the climatological mean) and 1974 (−3.0 °C below the climatological mean). Conversely, the post-2000 era sees several exceptional warm autumns, with temperature anomalies exceeding +2 °C, pointing to a trend toward more frequent and intense warm anomalies during autumn in the recent decades. The warmest autumns have been recorded in 1953 (+2.49 °C above the climatological mean); 2012 (+2.43 °C above the climatological mean); 2006 (+3.25 °C above the climatological mean), and 2011 (+3.69 °C above the climatological mean).
The annual mean temperature anomalies at Zugspitze from 1901 to 2024 show a clear warming trend with notable differences between the early and recent periods. For 1901–2024, the warming trend is modest at approximately +0.13 °C per decade (Figure 3e, green dashed line). From 1981 onwards, the warming rate increases to about +0.44 °C per decade (Figure 3e, red line). This acceleration reflects intensified warming typical of many mountain regions globally and corroborates findings from broader alpine climate studies, where similar shifts have been observed (Gobiet et al., 2014; Pepin et al., 2022). The early 20th century exhibits several decades of below-average conditions, while the past 30 years are unprecedented in terms of sustained warmth. Examining extremes, the three coldest years occurred in the early part of the 20th century, namely 1909 (−1.48 °C below the climatological mean), 1919 (−1.62 °C below the climatological mean) and 1956 (−1.33 °C below the climatological mean). These cold extremes align with known cooler periods affecting Europe and the Alps during those decades, influenced by natural climate variability (Casty et al., 2005; 2007; Ionita et al., 2021b). In contrast, the three warmest years occur predominantly in the 21st century, reflecting the significant warming acceleration. The three warmest years all occurred in the 21st century, namely 2002 (+1.86 °C above the climatological mean), 2022 (+1.88 °C above the climatological mean) and 2024 (+2.36 °C above the climatological mean).
Overall, the Zugspitze record confirms strong and accelerating warming across all seasons, with summer showing the most pronounced increase since the 1980s. If we consider the whole analyzed period (i.e., 1901–2024), the warming trend ranges from 0.08 °C to 0.19 °C dec−1. This shows that the 20th century was already a period of noticeable warming at Zugspitze. Nevertheless, if we consider the period 1981–2024, the trends are dramatically steeper for all seasons, ranging from 0.32 °C to 0.60 °C dec−1. This shows that in the last 4 decades, the rate of temperature increase has accelerated to a new level. The most recent years consistently register the highest temperature anomalies, indicating a clear and rapidly accelerating warming trend.
According to the results presented in Table 1, both Hohenpeißenberg (977 m.a.s.l) and Zugspitze (2,956 m.a.s.l) experienced significant warming since 1901. However, across all seasons and for both periods (the full: 1901–2024 and the recent one: 1981–2024), the low-elevation site (i.e., Hohenpeißenberg) generally warmed more rapidly than the high-elevation site. This is reflected in consistently negative EDW signals (−0.001 to −0.012 °C dec−1 per 100 m), indicating a steepening rather than a weakening of the near-surface lapse rate (Table 1). The contrast is most pronounced in winter over the full record, while in spring and summer the differences are very small. Taken together, these results suggest an absence of elevation-dependent warming at this pair of long-term Alpine stations, with warming dominated by changes at lower elevation.
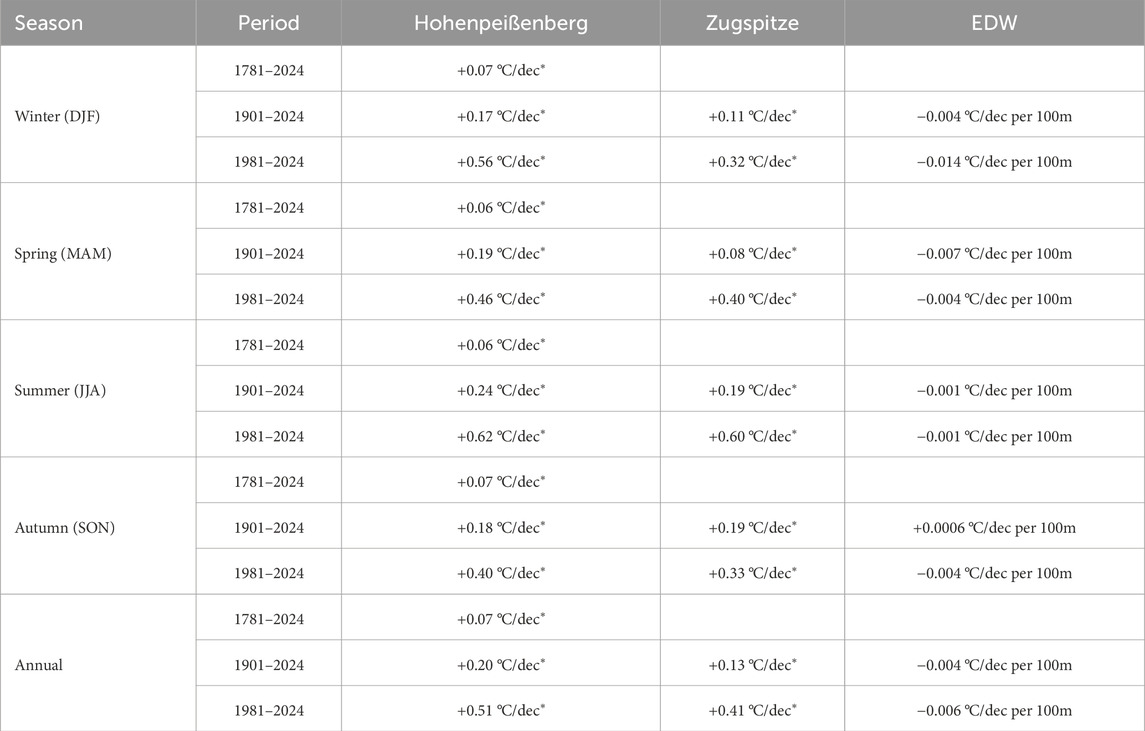
Table 1. Trends and elevation-dependent warming signal for the seasonal and annual mean temperature between Hohenpeißenberg (977 m) and Zugspitze (2956 m). Trend significance: *p < 0.05.
A similar analysis (trend + EDW signal) was also performed for the minimum temperature (Table 2; Supplementary Figures S1 and S2) and for the maximum temperature (Table 3; Supplementary Figures S3 and S4). In the case of the minimum seasonal and annual temperature (Table 2; Supplementary Figures S1 and S2), the temperatures have increased at both Hohenpeißenberg and Zugspitze over the full 1901–2024 period and more strongly since 1981. As in the case of mean temperatures, the low-elevation site generally exhibits higher warming rates, leading to predominantly negative EDW signals (−0.008 to −0.025 °C dec−1 per 100 m). The only exceptions occur in recent summers, where Zugspitze shows slightly stronger nighttime warming than Hohenpeißenberg, yielding small positive EDW signals (+0.016 °C dec−1 per 100 m). Overall, the temporal evolution and the trends observed for the minimum temperature indicate that elevation-dependent warming is absent or weak in minimum temperatures, with a slight suggestion of enhanced high-elevation warming emerging in the warm season since 1981.
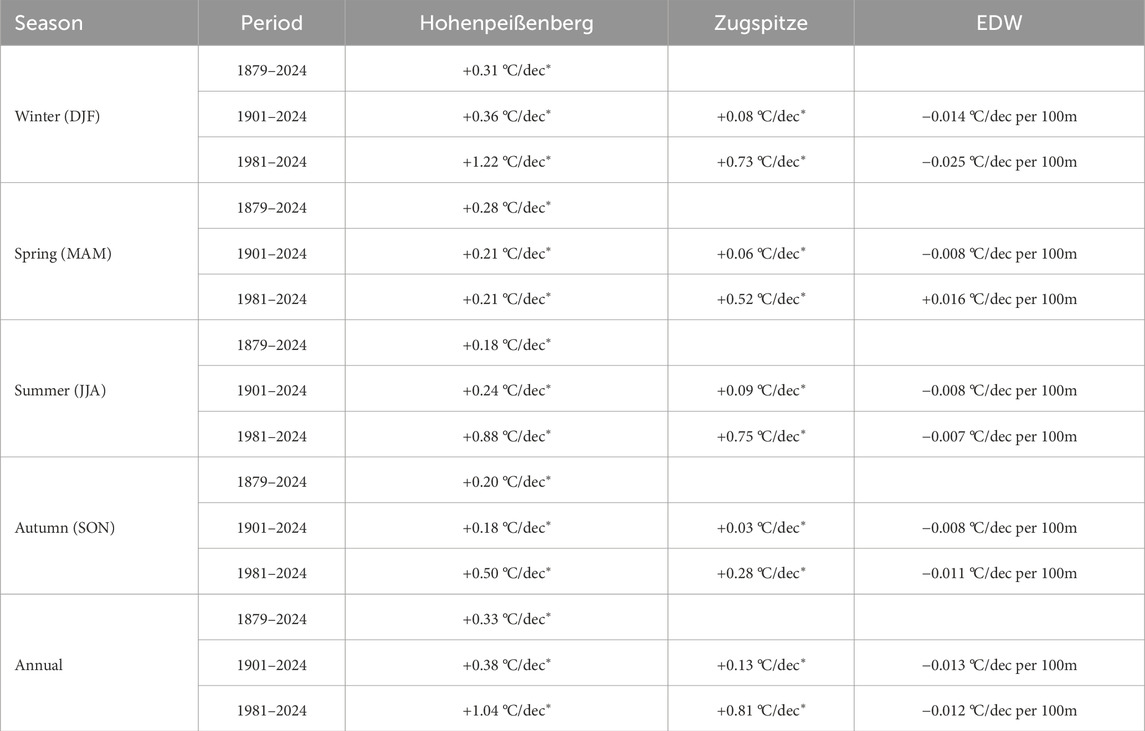
Table 2. Trends and elevation-dependent warming signal for the seasonal and annual minimum temperature between Hohenpeißenberg (977 m) and Zugspitze (2956 m). Trend significance: *p < 0.05.
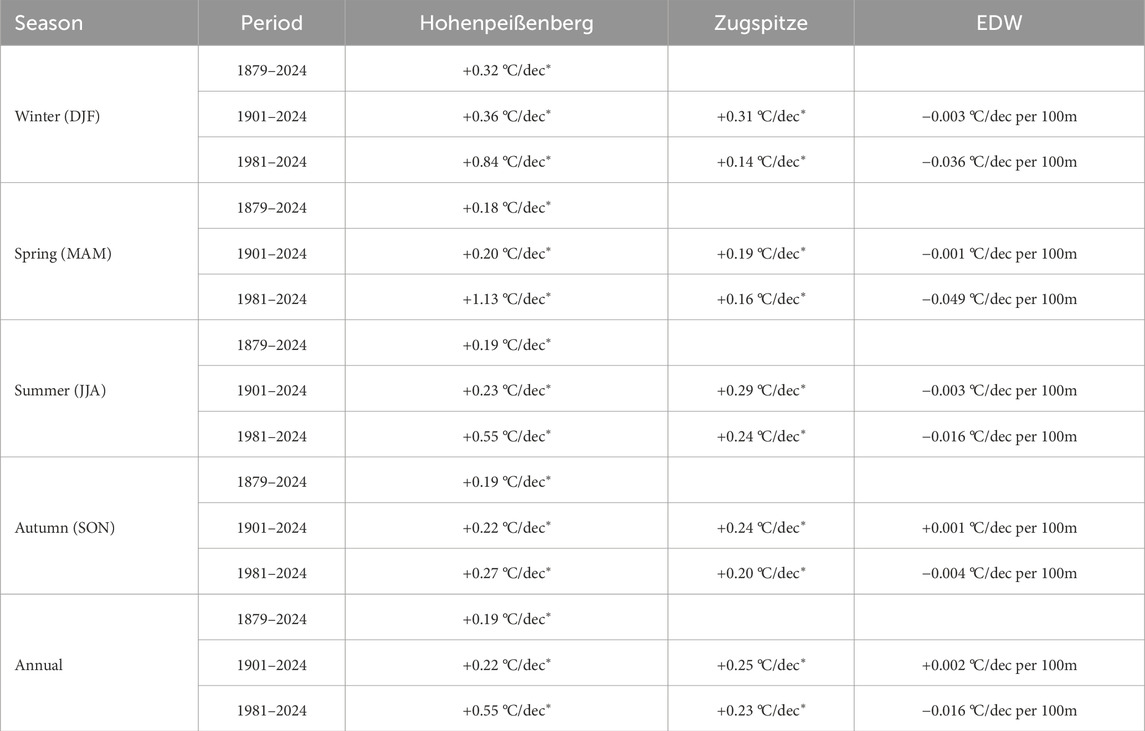
Table 3. Trends and elevation-dependent warming signal for the seasonal and annual maximum temperature between Hohenpeißenberg (977 m) and Zugspitze (2956 m). Trend significance: *p < 0.05.
Maximum temperatures also increased at both Hohenpeißenberg and Zugspitze over the 20th and early 21st centuries, with much stronger trends emerging after 1981 (Table 3; Supplementary Figures S3 and S4). In nearly all seasons, the warming is larger at the lower-elevation site, leading to negative EDW signals and a steepening of the vertical temperature gradient. The largest contrast is evident in winter during 1981–2024, when Hohenpeißenberg warmed at a higher rate than at Zugspitze, producing a strongly negative EDW value (−0.036 °C dec−1 per 100 m). Only autumn trends and the annual means yield values close to zero or marginally positive, suggesting little elevation influence in these seasons. Taken together, TT, TN and TX show a common signal of enhanced low-elevation warming in most seasons, leading to lapse-rate steepening rather than the expected elevation-dependent warming. The only consistent divergence arises in minimum (maximum) temperatures during spring and summer (autumn and annual) of the recent decades, where Zugspitze warms more rapidly, hinting at processes (e.g., snow cover decline, changes in longwave radiation) that selectively enhance high-elevation nighttime temperatures. Thus, while overall EDW is absent or negative in our analyzed stations, there are season- and variable-specific exceptions that align with proposed mechanisms of elevation-dependent warming.
3.3 Variability and trends of cold spells at Hohenpeißenberg (1879–2024)
Having established the long-term evolution of mean temperatures, the next step is to examine cold spells, focusing on their variability and trends as indicators of changes in climate extremes. Figure 4 presents the long-term evolution of three distinct indicators recorded at Hohenpeißenberg, offering valuable insights into how cold extremes have changed from the late 19th century through the 21st century. The record spans from 1871 until 2024, providing a uniquely long perspective on cold extremes in Central Europe. For each index, both the historical trend (1879–2024) and the recent trend (1981–2024) are highlighted, showing an overall marked decline in cold events frequency and persistence over the observation period. The top panel shows the CSDI (Figure 4a), defined as days per year when cold spells of at least three consecutive nights below the 10th percentile of minimum temperature occur. Both long-term (1879–2024) and recent (1981–2024) trends are significantly negative, with decreases of −39 and −16 days, respectively. The early-to-mid 20th century experienced frequent, sometimes prolonged, cold spells, with multiple years exceeding 60 days with CSDI characteristics. Notably, the most extreme events are clustered before the 1960s. Since then, there has been a clear downward trend, as demonstrated by the regression lines: a total decline of 39 days since 1879, with an even sharper reduction of −16 days over the past 4 decades. Recent years rarely exceed 20 days, emphasizing the rarity of such cold spells in the contemporary climate. This decline reflects the marked reduction in the persistence of cold spells, consistent with broader European and global studies documenting fewer prolonged cold events in a warming climate (Donat et al., 2013; Sillmann et al., 2013).
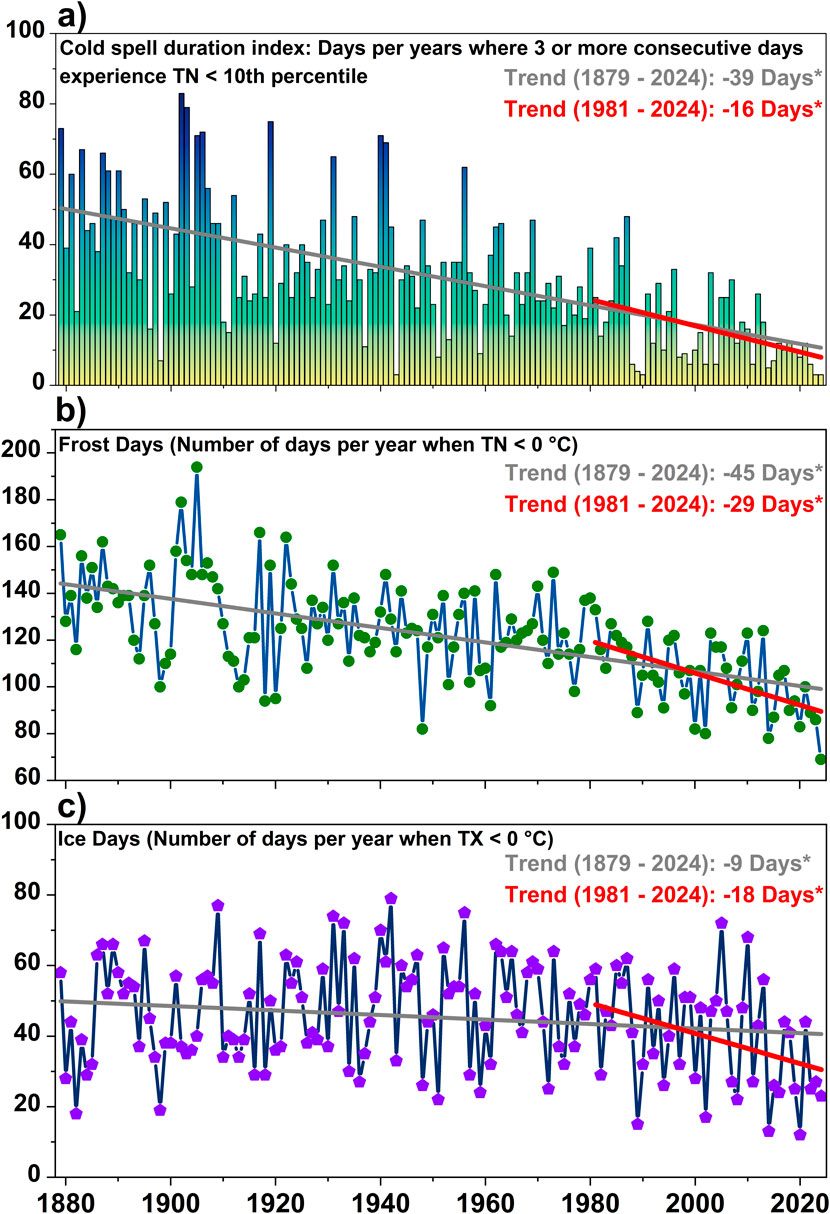
Figure 4. Temporal evolution of cold extreme indicators at Hohenpeißenberg: (a) Cold spell duration index (CSDI); (b) Annual number of frost days (FD) and (c) Annual number of ice days (ID). Analyzed period: 1879–2024. Units: (a–c) Days. Trend significance: *p < 0.05.
The middle panel (Figure 4b) shows the annual number of frost days (TN < 0 °C). Early 20th-century years routinely saw more than 120 frost days, with several extreme years—especially in the 1920s and late 1940s—when frost days peaked close to or above 180. The trend line reveals a decrease of −45 days from 1879 to 2024 and a more pronounced −29-day reduction since 1981, coinciding with accelerated global warming. This underscores both a long-term and recent acceleration in the loss of frost days, likely reflecting milder winters and fewer opportunities for sub-freezing nights at this site. This is in line with observed reductions in frost days across Europe (Ruosteenoja and Jylhä, 2025), driven by warmer winters and shifts in circulation patterns associated with anthropogenic climate change (Tomczyk et al., 2019). The bottom panel (Figure 4c) shows the temporal evolution of the annual number of ice days (TX < 0 °C), when the daily maximum temperatures remain below freezing. The long-term decrease is more modest (−9 days since 1879), but the modern rate of decline from 1981 onwards has nearly doubled, with a loss of −18 days. This pattern suggests that, while the frequency of days not exceeding 0 °C was relatively stable for much of the 20th century, recent decades of intensified warming have markedly reduced their occurrence. Similar signals have been reported in the European Alps, where warming rates are amplified compared to the global mean (Beniston, 2003; 2005a). Overall, all three indices demonstrate a clear climate change fingerprint: a strong reduction in cold spells, frost, and ice days. The accelerated decline since the 1980s reflects the rapid increase in greenhouse-gas-driven warming, particularly in the mid-latitudes of Europe (Hartmann et al., 2013). The Hohenpeißenberg record, with its long continuity and mountain setting, provides crucial evidence for how climate change manifests in cold extremes and aligns with large-scale climate assessments (IPCC, 2021).
3.4 Variability and trends of cold spells at Zugspitze (1901–2024)
The long-term changes in cold-related indices at Zugspitze, are presented in Figure 5. The overall trend for CSDI (Figure 5a), over the period 1901 to 2024, shows a decline of −12 days. Critically, the trend from 1981 to 2024 shows an even sharper decrease of −10 days, suggesting that the frequency and duration of these cold snaps have diminished significantly in recent decades. The most extreme winters were recorded in the late 1940s, with a peak of over 50 days of cold spells, followed by another significant peak around 1960. More recently, the number of days has been consistently lower, with very few years exceeding 20 days. This reflects a significant reduction in the persistence of extreme cold events at high elevation. Although the alpine setting still experiences intense cold, the decline is consistent with global evidence of fewer and shorter cold spells under anthropogenic warming (Donat et al., 2013; Sillmann et al., 2013; Tomczyk et al., 2019; Ruosteenoja and Jylhä, 2025).
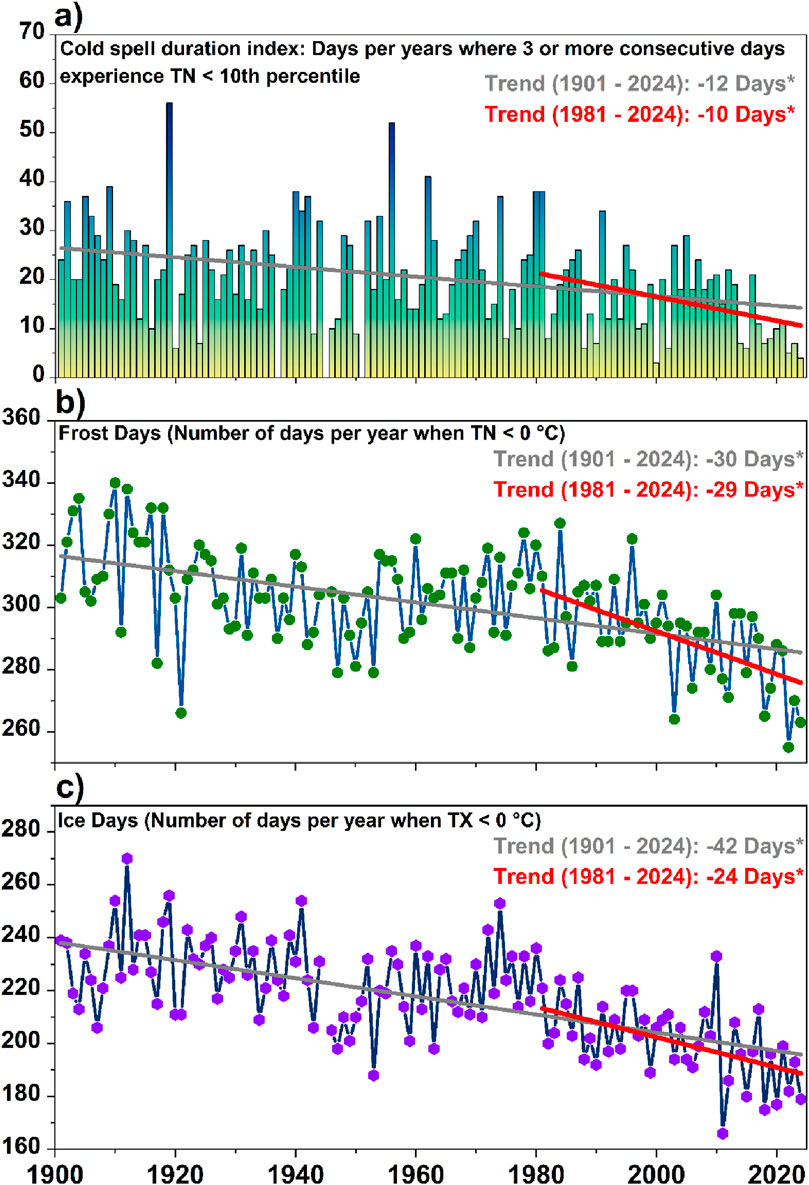
Figure 5. Temporal evolution of cold extreme indicators at Zugspitze: (a) Cold spell duration index (CSDI); (b) Annual number of frost days (FD), and (c) Annual number of ice days (ID). Analyzed period: 1901–2024. Units: (a–c) Days. Trend significance: *p < 0.05.
The middle panel shows the temporal evolution of frost days, when the daily minimum temperature falls below 0 °C (Figure 5b). Despite the high-elevation location where frost is a common phenomenon, the data reveals a long-term decrease of the frost days (FD) occurrence of −30 days from 1901 to 2024. The trend since 1981 is particularly striking, showing a similar decrease of −29 days, indicating that nearly all of the reduction in frost days has occurred during the last 4 decades. This suggests that nearly all of the reduction in frost days has occurred in the last 4 decades. The data shows a consistent decline from the late 1970s and early 1980s, which marked the end of a period with consistently higher numbers of frost days. The earliest part of the record, from 1901 to around 1920, also shows a high number of frost days, with a notable drop in the mid-1940s. Since 2010, some of the lowest numbers of frost days on record have been observed. This implies a substantial shortening of the frost season at the peak of the German Alps, and this reduction is striking, given the naturally cold climate of the site. It illustrates how even alpine environments are not immune to global warming, as milder winters and extended autumn and spring seasons shorten the frost season (Beniston, 2005a; Pepin and Lundquist, 2008; Gobiet et al., 2014).
The bottom panel shows the temporal evolution of ice days (Figure 5c), defined as days when the maximum temperature does not rise above freezing temperatures. Here, the decrease is even more pronounced: −42 days since 1901 and –24 days since 1981. The reduction in ice days indicates a clear upward shift in wintertime daily maxima, consistent with amplified warming in mountain regions compared to lowlands (Pepin et al., 2015). This has far-reaching implications for snowpack duration, glacier mass balance, and alpine hydrology, all of which depend on sustained sub-freezing daytime conditions.
Overall, the Zugspitze record provides robust evidence that even the coldest and highest-elevation sites in Central Europe are undergoing significant reductions in cold extremes. The long-term trend from 1901 to 2024 shows a significant reduction of −42 days. The trend from 1981 to 2024 is also substantial, with a decrease of 24 days. This indicates that not only are minimum temperatures staying above freezing more often, but maximum temperatures are also failing to drop below freezing with increasing frequency. The most extreme winters in this record occurred in the early 20th century and around the 1940s and 1950s, when the number of days with sub-zero maximum temperatures was regularly above 240 days. In contrast, since the late 1990s, the number of such days has consistently remained below 200, with the last 2 decades showing some of the lowest values ever recorded. The decline is particularly steep from the early 1980s onwards, reinforcing the pattern seen in the other two indices and highlighting the significant acceleration of warming at Zugspitze in recent decades. The accelerated trends since the 1980s coincide with the rapid increase in anthropogenic greenhouse forcing, mirroring large-scale assessments of temperature extremes (Horton et al., 2015; IPCC, 2021). Taken together with the Hohenpeißenberg results, these findings highlight that the climate change signal is now strongly imprinted in both low-mountain and high-alpine environments. The observed declines in cold spells, frost days, and ice days emphasize the vulnerability of alpine ecosystems and cryospheric processes to continued warming.
The dramatic and significant reduction in frost and ice days at Germany’s highest peak can be a direct consequence of the global temperature increase driven by human-induced greenhouse gas emissions. These trends are not isolated; they are consistent with observations from other high-altitude stations worldwide, highlighting the vulnerability of mountain ecosystems to climate change (IPCC, 2021; Pepin et al., 2022). Moreover, the shortening of the frost and ice seasons can lead to significant implications for local hydrology, permafrost stability, and unique alpine ecosystems.
3.5 Variability and trends of warm spells at Hohenpeißenberg (1879–2024)
Building on the observed decline in cold spells at both Hohenpeißenberg and Zugspitze, we now shift our focus to the other end of the temperature spectrum, namely heatwaves. The analysis of trends and variability of warm extremes will explore whether a corresponding increase in the frequency of warm spells is evident at these same high-altitude stations. As in the case of CS, we focus on three different indicators for HWs, namely: the Warm Spell Duration Index (WSDI), the number of days contributing to maximum-temperature heatwaves (TX90p), and the number of days contributing to minimum-temperature heatwaves (TN90p). All indices are based on the requirement of at least three consecutive days above the 90th percentile. The record spans 1879–2024, offering a unique perspective on changes in warm extremes in Central Europe.
The top panel depicts the WSDI (Figure 6A), defined as the annual number of days lasting at least three consecutive days with maximum temperatures above the 90th percentile. The long-term trend indicates an increase of +29 days since 1879, while the recent period (1981–2024) shows an even stronger rise of +44 days. This indicates that the most significant increase in prolonged warm periods has occurred in the last 4 decades. While the early 20th century shows some variability, the period from the 1980s onward is marked by a consistent and steep upward trajectory. The most extreme warm years in this record are clearly visible in the recent past, with the most notable peaks occurring after 2000 (i.e., 2003–33 days, 2015–58 days, 2018–47 days, 2019–40 days and 2023–39 days).
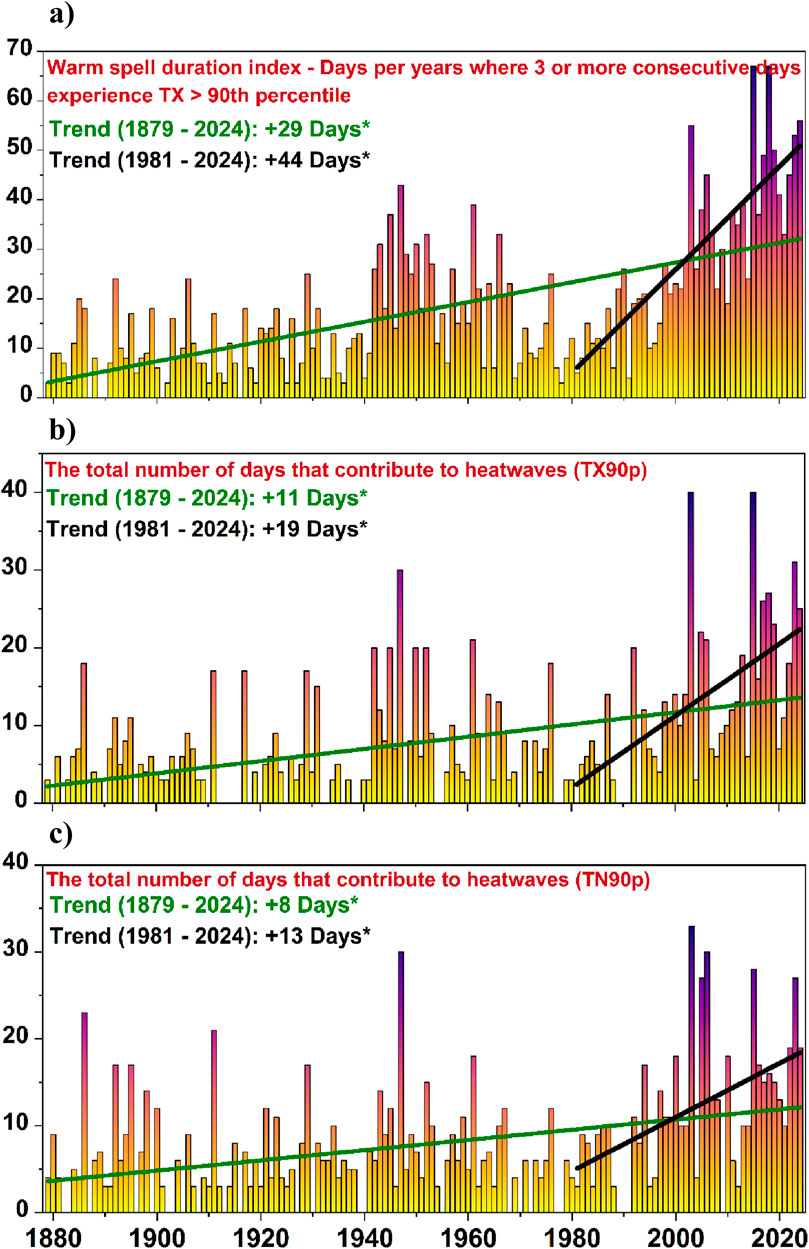
Figure 6. Temporal evolution of warm extreme indicators at Hohenpeißenberg: (a) Warm spell duration index (WSDI); (b) Total number of days that contribute to heatwaves (based on TX90P); and (c) Total number of days that contribute to heatwaves (based on TX90P). Analyzed period: 1879–2024, WSDI: Annual, TX90P and TN90P: May -September. Units: (a–c) Days. Trend significance: *p < 0.05.
The middle panel (Figure 6B) shows the number of days contributing to maximum-temperature heatwaves (TX90p). It has to be mentioned that for the index we only focused on the extended summer season, namely May–September, while in the case of WSDI, the number of days contributing to HWs are computed over the whole year. This index shows a more moderate but still significant increase. The long-term trend from 1879 to 2024 shows an increase of +11 days. The recent trend from 1981 to 2024, however, is a much steeper increase of +19 days, indicating that the recent rise in maximum temperature heatwave days is the primary driver of the overall trend. The temporal evolution highlights both interannual variability and a clear upward trend in recent decades, with particularly pronounced clusters of hot summers since the 1990s. The record shows some individual extreme years in the mid-20th century (e.g., 1947), but the most pronounced and sustained period of HWs days begins in the late 1990s. The most extreme years are 2003 (+40 days), 2015 (+40 days), 2018 (+27 days) and 2023 (+31 days). This reflects both rising mean temperatures and an intensification of heat extremes in recent decades, which have been linked to increased risks for human health, agriculture, and energy systems across Europe (Barriopedro et al., 2011; Russo et al., 2015; Ionita et al., 2024).
The bottom panel (Figure 6C), which tracks the total number of days that contribute to heatwaves based on the minimum temperature (TN) exceeding the 90th percentile, also shows a consistent warming trend. The overall trend from 1879 to 2024 shows an increase of +8 days, while the trend from 1981 to 2024 shows a more substantial increase of +13 days. This suggests that the number of nights that stay unusually warm is increasing at an accelerated rate, which is a key indicator of climate warming (IPCC, 2019; 2021). While the earlier part of the record shows some warm years, such as the ones around the 1940s (e.g., 1947–30 days), the consistent high values are found in the recent period. The extreme years are clearly clustered in the last 2 decades, with a particularly high peak in 2003 (+33 days), 2006 (+30 days), 2015 (+28 days) and 2023 (+27 days). The increase in TN90p aligns with global-scale findings that minimum temperatures are warming faster than maxima, reducing diurnal temperature ranges (Wild, 2009; Ionita et al., 2012; Donat et al., 2013; Alexander, 2016).
Considering all indices together, the Hohenpeißenberg record clearly illustrates the intensification of warm extremes over the 20th and 21st centuries. Whereas cold spells, frost days, and ice days have declined, warm spells and heatwaves have markedly increased, showing a robust climate change signal. The stronger acceleration since the 1980s highlights the role of anthropogenic greenhouse gas forcing in shaping extreme temperature events (IPCC, 2021). The data demonstrate that even mountain regions, often perceived as buffered from extremes, are experiencing a substantial amplification of heat-related indices.
3.6 Variability and trends of warm spells at Zugspitze (1901–2024)
The analysis of warm extremes at Zugspitze, covering the period from 1901 to 2024 is presented in Figure 7. The top panel (Figure 7a) shows the temporal evolution of WSDI, which reveals a significant upward trend in the occurrence and duration of warm spells at Zugspitze. Over the full observational period (1901–2024), the WSDI has increased by +32 days, with this trend entirely sustained during the more recent period from 1981 to 2024, as indicated by the congruent trend values (i.e., +32 days). This marked increase is particularly evident from the late 20th century onwards, where the number of warm spell days frequently exceeds +30 days per year, compared to the early 20th century, where these values rarely rose above +10 days. The trend line for 1981–2024 (red line in Figure 7a) captures this accelerating increase, underscoring a rapid intensification of warm spells in recent decades. The most extreme years, are clustered in the most recent decades (i.e., 2003–62 days, 2012–56 days, 2012–56 days, 2015–66 days and 2023–56 days), suggesting that recent years have experienced unprecedented frequencies and durations of warm spells. This strong upward trend, particularly visible since the late 20th century, highlights a robust intensification of prolonged warm spells in the alpine environment. Comparable increases in WSDI have been observed across Europe (Donat et al., 2013; Boboc et al., 2025).
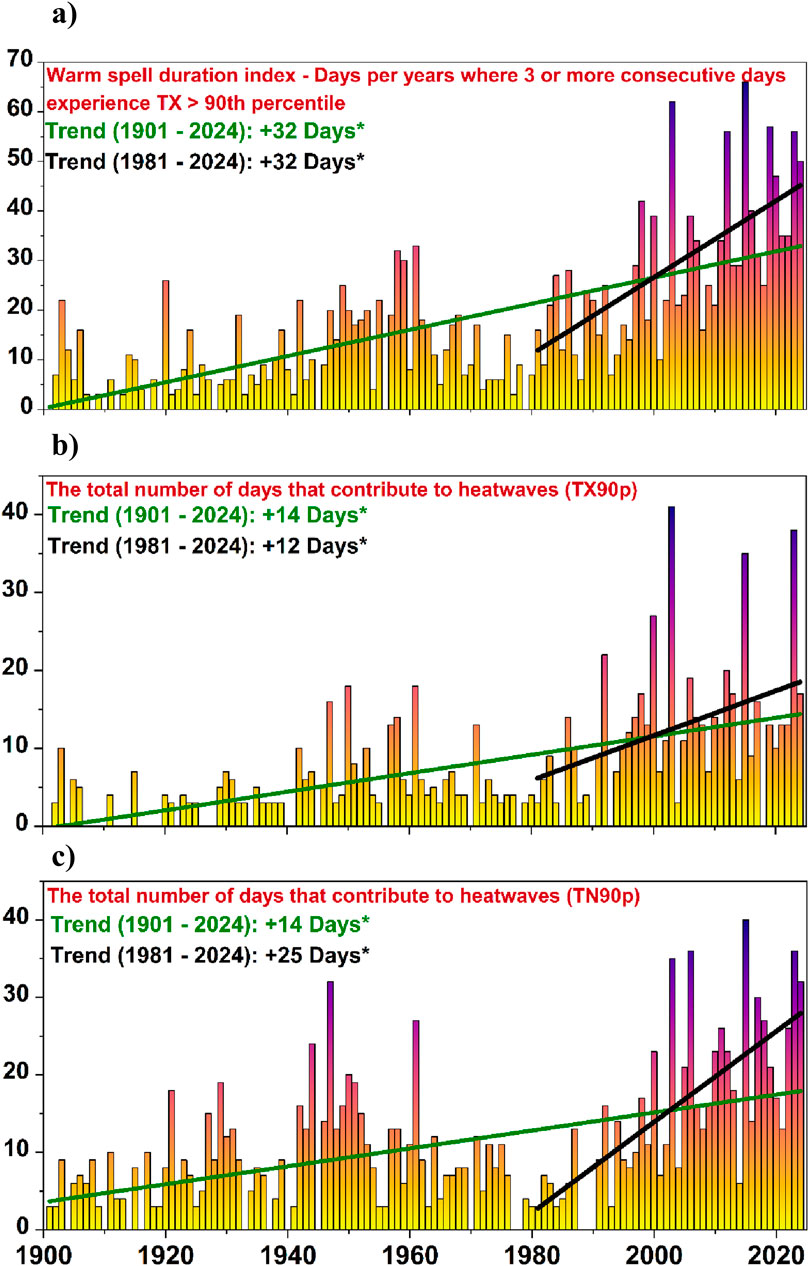
Figure 7. Temporal evolution of warm extreme indicators at Zugspitze: (a) Warm spell duration index (WSDI); (b) Total number of days that contribute to heatwaves (based on TX90P); and (c) Total number of days that contribute to heatwaves (based on TX90P). Analyzed period: 1879–2024, WSDI: Annual, TX90P and TN90P: May -September. Units: (a–c) Days. Trend significance: *p < 0.05.
The middle panel shows the temporal evolution of TX90p (Figure 7b), and indicates that the long-term trend for 1901–2024 shows a +14-day increase, while the trend for the past 4 decades (1981–2024) is slightly lower at +12 days, albeit the frequency of TX90P days is more concentrated in the recent years. While the trend is less pronounced than for the WSDI, a consistent increase is still evident, with a notable clustering of extreme years above 20 and 30 days per year since the late 20th century (e.g., 2000–27 days, 2003–41 days, 2012–20 days, 2015–35 days and 2023–38 days). This reflects the increased frequency of extreme maximum temperature days synonymous with modern heatwaves. Although the absolute number of very hot days is smaller at Zugspitze than at low-altitude site, the relative increase is significant, pointing to enhanced warming even in traditionally cold high-alpine conditions. Such changes in maximum temperature extremes are closely linked to snowpack decline, earlier melt, and shifts in alpine hydrology (Beniston, 2005b; Gobiet et al., 2014).
The lower panel focuses on the TN90p index (Figure 7c). This index also shows a +14-day increase from 1901 to 2024, but indicates a far greater acceleration over the past 4 decades (1981–2024), with a +25-day increase. This pattern highlights that not only daytime, but also nighttime temperatures, are contributing to the rise in warm spell and heatwave indices, and possibly to a greater extent in recent decades. Similar to the other indices, the most extreme years—those exceeding 30 or even 40 days—are observed nearly exclusively in the last several decades (e.g., 2003–35 days, 2006–36 days, 2015–40 days, 2023–36 days and 2024–32 days), emphasizing an intensification of nocturnal heat events. The accelerated rise in warm nights over the last decades is critical, as reduced nocturnal cooling amplifies heat stress for ecosystems and increases melt rates of glaciers. The prevalence of warm nights at high elevation illustrates that minimum temperatures are rising faster than maximum temperatures, a well-documented global phenomenon (Donat et al., 2013; IPCC, 2021).
Taken together, all three indicators show an unequivocal and accelerating increase in both the frequency and duration of warm spells and heatwaves at Zugspitze, especially since the early 1980s. The strongest relative increase is observed for the WSDI, but both TX90p and TN90p show substantial rises, with TN90p indicating particularly strong recent growth. The clustering of extreme years in the recent past across all indices points toward more frequent and persistent warm and extreme temperature events, a finding that is consistent with other European and global trends in a warming climate (Luo et al., 2023; Rousi et al., 2023; Ma et al., 2024; Boboc et al., 2025). These results mirror the trends observed at Hohenpeißenberg, but highlight that even the highest alpine sites in Central Europe are no longer insulated from the impacts of climate change. In mountain regions such as the Alps, these changes have cascading impacts on glaciers, permafrost, ecosystems, and water resources, making the monitoring of sites like Zugspitze indispensable for understanding climate change in vulnerable high-elevation environments.
3.7 Snow pack evolution at Hohenpeißenberg (1901–2024) and Zugspitze (1947–2024)
While the analysis of cold spells and heatwaves provides important insights into the changing frequency of temperature extremes, these metrics alone do not fully capture the impacts of climate variability and change at high-elevation sites. In mountain regions such as Hohenpeißenberg and Zugspitze, snowpack dynamics serve as a critical link between temperature fluctuations and hydrological as well as ecological processes. Therefore, the next step is to examine how snowpack has evolved over time in relation to the observed temperature extremes. Figure 8 shows the seasonal and annual time series of snowpack (cm) from 1937 to 2024 at Hohenpeißenberg, with linear trends computed for two different periods: the full record (1937–2024, in grey) and the recent decades (1981–2024, in red). Across all seasons, a pronounced decline is evident, but the magnitude of decrease varies by season. In winter (DJF), the snowpack declined by −14 cm since 1937 and by −8 cm since 1981, highlighting a persistent long-term reduction, though with considerable interannual variability (Figure 8a). Spring (MAM) also shows a marked decrease of −6 cm since 1981, which exceeds the century-scale reduction (−5 cm), pointing to an acceleration of snow loss in recent decades (Figure 8b). The strongest seasonal decline is observed in autumn (SON), with a long-term decrease of −7 cm over the period 1937–2024, but a steeper decline of −14 cm since 1981 (Figure 8c), reflecting the disappearance of early-season snow cover. At the annual scale, snowpack decreased by −6 cm over the full record and by −7 cm since 1981, consistent with the seasonal patterns (Figure 8d). The interannual variability is large, with occasional extreme snow years still occurring, yet the downward trend is robust and statistically significant in most cases (indicated by the asterisk in each panel). The stronger decline since 1981 aligns with global and regional warming, particularly with the accelerated temperature increase after the 1980s (Figure 2, Supplementary Figures S1, S2), which shortens the snow season and reduces accumulation. The seasonal differences suggest that both earlier snowmelt in spring and later snow onset in autumn contribute to the overall reduction, while winter snowfall has also diminished. Overall, the figure indicates a clear and accelerating reduction in snow depth, underscoring the sensitivity of snowpack to climate warming and its potential impacts on hydrology and ecosystems.
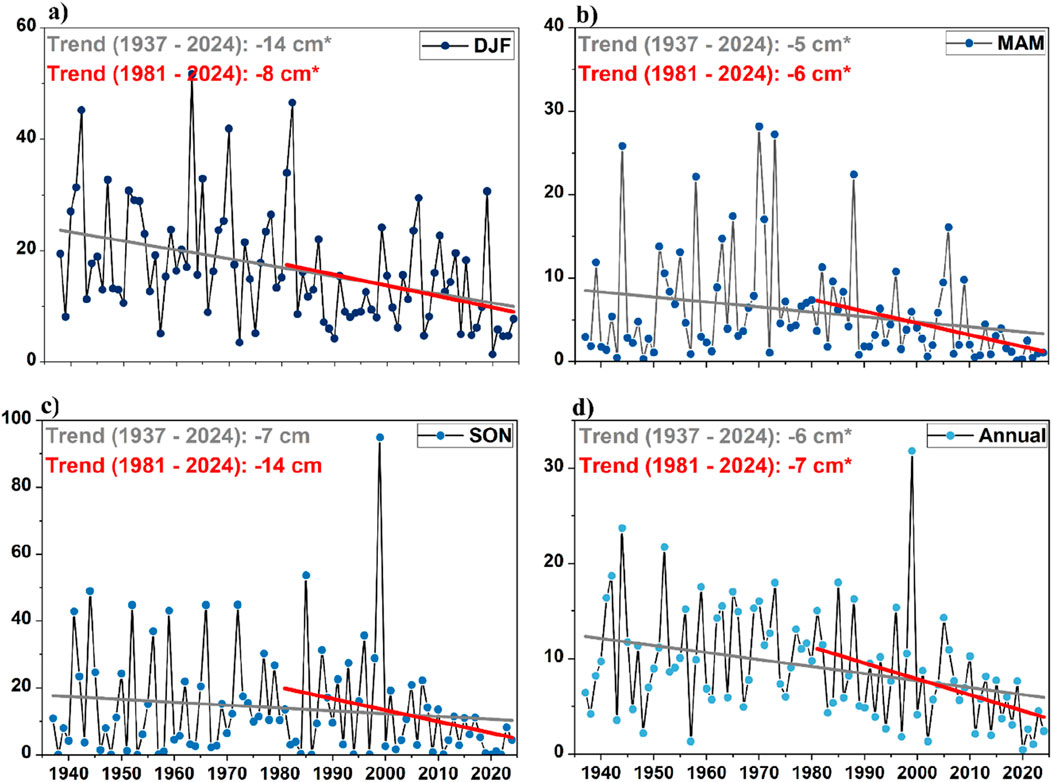
Figure 8. Seasonal and annual average of daily height of snow pack at Hohenpeißenberg: (a) Winter (DJF); (b) Spring (MAM); (c) Autumn (SON), and (d) Annual: Units of measure: cm. Summer (JJA) is not shown, as there is no snow cover in summer @Hohenpeißenberg. Trend significance: *p < 0.05.
Figure 9 presents the seasonal and annual mean snowpack height at Zugspitze from 1947 to 2024, together with the long-term (1947–2024, grey) and the more recent (1981–2024, red) linear trends. A clear downward tendency is observed across all seasons, though the magnitude varies. Winter (DJF) shows the strongest reductions, with a −70 cm decrease over the full record and −49 cm since 1981, indicating substantial snow loss during the core snow season (Figure 9a). In spring (MAM), snow depth declined by −59 cm since 1947 and –31 cm since 1981 (Figure 9b), reflecting earlier snowmelt and reduced accumulation. Summer (JJA) displays an especially steep decline since 1981 (−58 cm), exceeding the long-term reduction (−6 cm), suggesting that snow retention into summer has become increasingly rare (Figure 9c). Autumn (SON) also shows notable decline (−19 cm since 1947; −31 cm since 1981), pointing to delayed snow onset (Figure 9d). At the annual scale, the snowpack has decreased by −38 cm over the entire record and by −42 cm since 1981, consistent with the seasonal declines (Figure 9e).
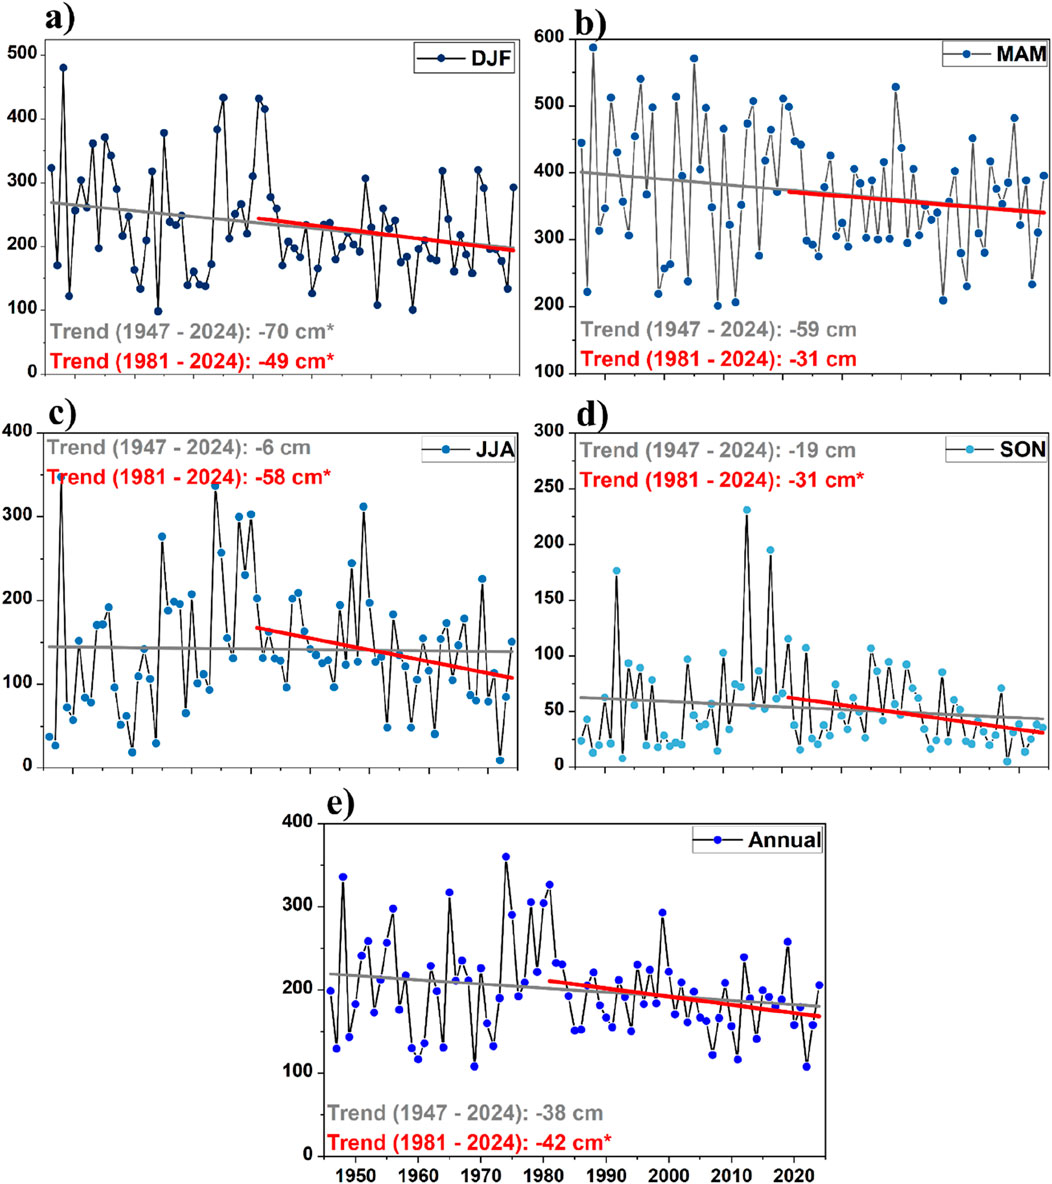
Figure 9. Seasonal average of daily height of snow pack at Zugspitze: (a) Winter (DJF); (b) Spring (MAM); (c) Summer (JJA); (d) Autumn (SON), and (e) Annual: Units of measure: cm. Trend significance: *p < 0.05.
The strong interannual variability, including years with extended snow depth, highlights the influence of weather fluctuations, yet the downward trend is robust, with significant reductions in most seasons. The acceleration of snow loss since the early 1980s aligns with regional warming in the European Alps and with the warming trends observed in all seasons, which in turn reduces snowfall, accelerates melt, and delays accumulation (Figure 3, Supplementary Figures S3, S4). The seasonal differences indicate that both ends of the snow season—onset in autumn and melt in spring and summer—are contributing to the annual decline. Overall, our results underscore a long-term and accelerating reduction in snowpack both at Hohenpeißenberg and Zugspitze, with implications for alpine hydrology, ecosystems, and winter tourism.
3.8 Large-scale atmospheric drivers of seasonal temperature extremes
In the following sub-section, we focus on analyzing the large-scale atmospheric circulation patterns associated with extreme seasonal temperature variations. The focus is on warm (seasonal TT > 1 standard deviation) and cold (seasonal TT < -1 standard deviation) years. In this respect, we make use of composite map analysis (see methods), which is a statistical method used to reveal statistically robust and recurring circulation features linked to temperature extremes. The LOW and HIGH years for each season are shown in Table 4 for Hohenpeißenberg and Supplementary Table S1 for Zugspitze. Warm winters (Figure 10a) are associated with a dominant high-pressure ridge (H) over Central Europe and a strong low-pressure trough (L) over the North Atlantic/Greenland, which diverts the typical westerly flow of the jet stream (Figure 10a). This spatial pattern resembles the positive phase of the East Atlantic pattern (Comas-Bru and McDermott, 2014), and the resulting southerly air flow brings warm air from subtropical latitudes into Europe, preventing the intrusion of cold, arctic air masses and leading to exceptionally mild winters. Conversely, low temperature extremes (Figure 10b) are driven by a deep low-pressure system over Europe, which funnels cold northerly air directly from the Arctic into the continent. Such a dipole-like structure (i.e., atmospheric blocking structure over the North Atlantic and a low-pressure system over central Europe) has been linked to cold-air outbreaks and severe winters across central Europe (Rimbu et al., 2014; Tomczyk et al., 2019; Sulikowska and Wypych, 2021; Kautz et al., 2022). The relationship between the variability of winter temperature and the EA is also captured by the significant correlation between the winter mean temperature at Hohenpeißenberg and the winter EA index (r = 0.69; p < 0.001), Figure 10a).
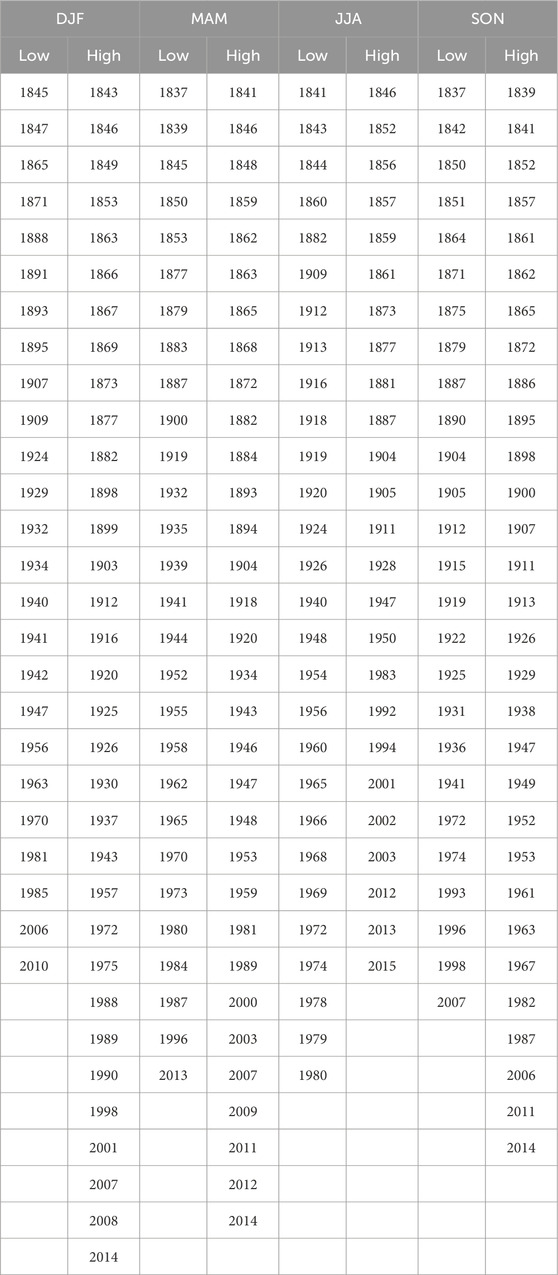
Table 4. The years corresponding to the low values (TT < −1 standard deviation) and high values (TT > 1 standard deviation) over the 1836–2015 period for Hohenpeißenberg.
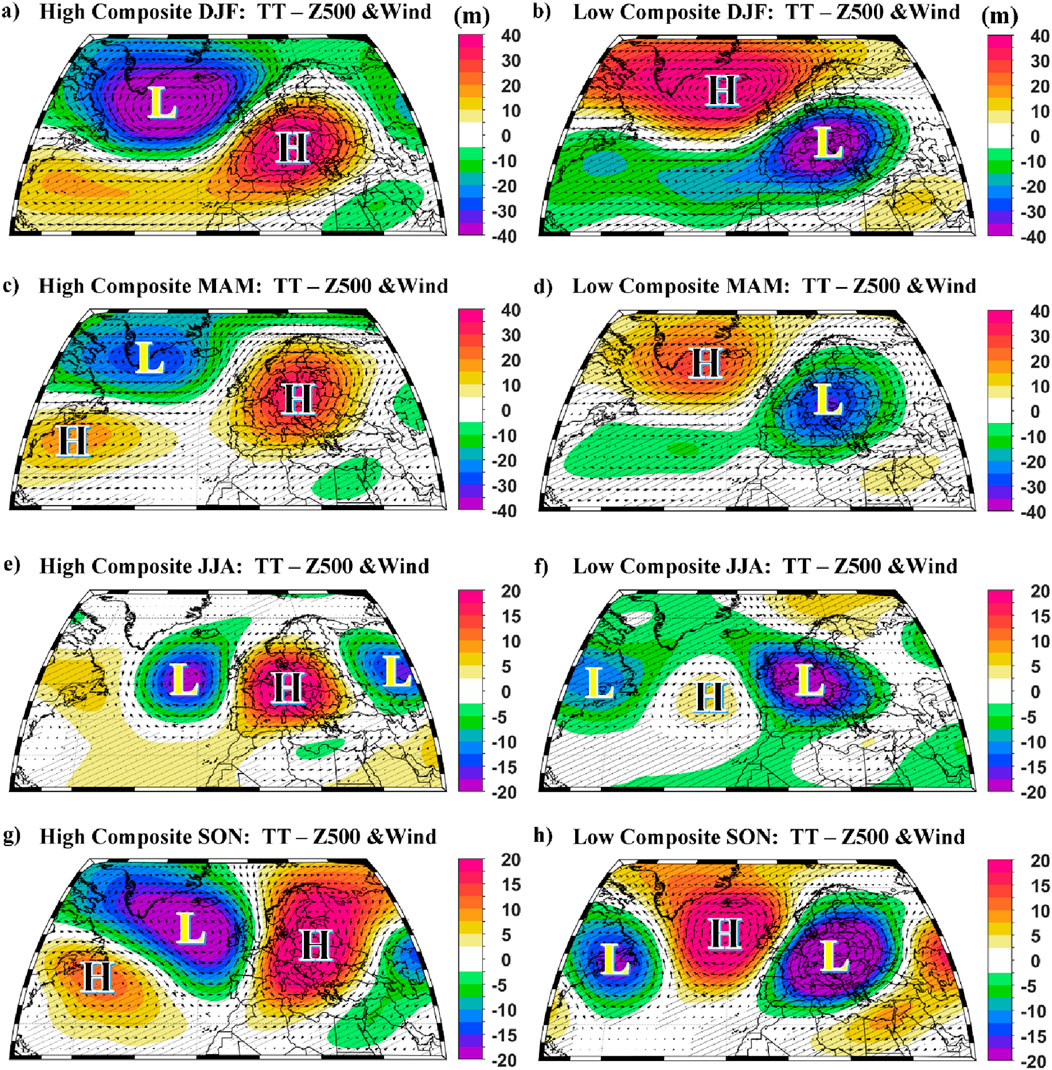
Figure 10. The composite map between High TT (>1 std. dev., left column) and Low TT (<- std. dev, right column) at Hohenpeißenberg and the seasonal Geopotential Height and wind vectors at 500 mb level (Z500). (a,b) Winter (DJF); (c,d) Spring (MAM); (e,f) Summer (JJA) and (g,h) Autumn (SON). Composite significance is evaluated at each grid point using a two-sided Student’s t-test; hatched areas denote regions where p < 0.05. Units: Z500(m). Analyzed period: 1836–2015.
Warm temperatures in spring, at Hohenpeißenberg, are associated with a high-pressure system over Central Europe and an associated ridge extending eastward, which is associated with persistent subsidence and early-season warming (Figure 10c). Periods dominated by anticyclonic circulation often lead to warm extremes, due to increased sunshine duration and the advection of warm air, sometimes linked to subtropical intrusions (Beck et al., 2007; Sousa et al., 2020; Faranda et al., 2023; Ionita et al., 2025). Cold springs (Figure 10d) display the opposite pattern: cold temperatures are associated with a high-pressure system over the North-Atlantic basin and a low-pressure system over the central part of Europe, which promotes northerly advection and below-average temperatures in central Europe. The spring composite maps are similar to the winter ones, indicating persistent large-scale features being associated with above/below temperatures. Nevertheless, the highest correlation between spring mean temperature is with the spring Arctic Oscillation index (r = 0.51, p < 0.0001). Our results are in line with previous studies, which have shown that the positive phase of AO is associated with above-average temperatures over Europe (Rimbu et al., 2014; Friedel et al., 2022).
The summer composites show a classic tripole-like structure, in the form of a Rossby wave, associated with European extreme temperatures (Cassou et al., 2005; Zveryaev and Gulev, 2009; Schubert et al., 2014; Nagavciuc et al., 2024). Warm summers (Figure 10e) are associated with a high-pressure system over Central Europe flanked by a low-pressure system over the eastern Atlantic and a low-pressure system over the eastern part of Europe. This pattern is often associated with a meandering jet stream to the north, which leads to long periods of clear skies, enhanced solar radiation and the advection of hot air from the south (Christidis et al., 2015; Ma et al., 2024; Ionita et al., 2025). The absence of cooling fronts allows temperatures to build up day after day, resulting in extremely high temperatures and long-lasting HWs (Christidis et al., 2015). This Rossby-wave-like pattern has been linked to persistent summer heatwaves (Cassou et al., 2005; Stefanon et al., 2012). In contrast, cold summers are associated with a low-pressure system over Central Europe flanked by two ridges to the west and east (Figure 10f). The low-pressure system over Central Europe is consistent with enhanced cyclonic activity and cool and wet summers (Folland et al., 2009), driven by increased cloudiness and rainfall, and limiting solar heating (Vautard et al., 2023).
The composite maps for the autumn season show distinct patterns for both temperature extremes (i.e., warm and cold periods). Warm temperatures in autumn (Figure 10g) are associated with a high-pressure ridge (H) centered over central Europe and a low-pressure system (L) over Greenland and the subpolar North Atlantic. This specific configuration leads to a persistent flow of warm, southerly air into Europe, bringing mild conditions. Conversely, the low temperature composite for autumn (Figure 10h) shows a pronounced low-pressure trough (L) centered over Central and Eastern Europe and to the west, over the North Atlantic basin, a high-pressure system (H). This pattern leads to the advection of cold northerly air flow across the central part of the European continent. These patterns are consistent with well-known Euro-Atlantic teleconnection modes, especially the East Atlantic pattern. Studies have shown that positive EA phases or strong blocking highs over Europe and the North Atlantic frequently lead to warmer autumns in Central Europe by enabling advection of subtropical air (Comas-Bru and McDermott, 2014; Craig and Allan, 2022). Conversely, negative EA-like patterns or amplified troughs enable cold air outbreaks, leading to anomalously cold conditions.
Across all seasons, the composites demonstrate that warm extremes at Hohenpeißenberg coincide with ridging/blocking highs over Central Europe, while cold extremes are linked to cyclonic anomalies or blocking upstream over the North Atlantic. These patterns are consistent with known modes of European climate variability: the EA in winter, summer and autumn and the AO in spring in spring (Figure 11). The persistence and recurrence of these circulation regimes underscore their importance as drivers of Central European temperature variability and extremes. It has to be mentioned that the same seasonal composite analysis was performed also for Zugspitze (Supplementary Figure S5), but since the structure of the composite maps is almost identical with the ones observed for Hohenpeißenberg, they are not analyzed in the current study.
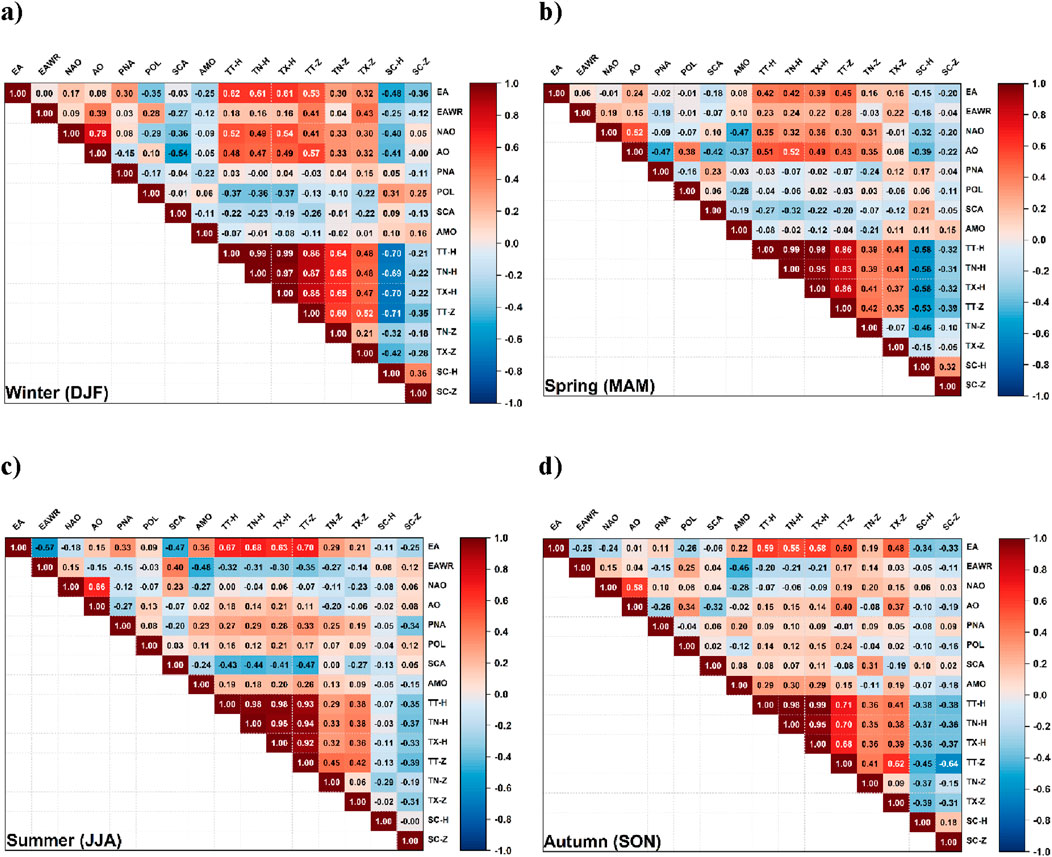
Figure 11. The correlation coefficients between the seasonal climate indicators (i.e., TT, TN, TX and SC) at Hohenpeißenberg (H) and Zugspitze (Z) and the seasonal teleconnection patterns (i.e., EA, EAWR, NAO, AO, PNA, POL, SCA and AMO). (a) Winter season (DJF); (b) Spring season (MAM); (c) Summer season (JJA) and (d) Autumn seasons (SON). The color bar indicates the range of the correlation coefficients (i.e., from −1 to 1), where light to dark blue colors indicate negative correlation coefficients, while light to dark red colors indicate positive correlation coefficients.
3.9 The influence of well-known teleconnection patterns on the climate of Hohenpeißenberg and Zugspitze
Large-scale atmospheric circulation patterns and their influence on the local climate of different regions can be examined using different methodological approaches, each with distinct advantages and limitations. In the previous sections, we used composite analysis, a statistical method which focuses on high and low temperature events, and provides a process-oriented view of large-scale circulation anomalies associated with local extremes, offering intuitive spatial insights into synoptic structures such as atmospheric blocking or storm tracks. However, such composites are event-focused and may conflate multiple drivers acting simultaneously. In contrast, correlation analyses with predefined teleconnection indices, such as the NAO, EA, or SCA (Barnston and Livezey, 1987), provide a statistical quantification of the strength and direction of the link between local climate variables and large-scale modes of variability. This approach facilitates comparability across sites and seasons, and connects local anomalies to established modes of climate variability, but it is constrained by the fixed definition of teleconnection indices and may overlook circulation features not captured by standard patterns. Nevertheless, taken together, the two perspectives are complementary: composites emphasize circulation mechanisms behind extremes, while correlations highlight systematic and potentially predictable linkages to large-scale modes of variability. In this respect, in the following we analyzed also the correlation coefficients between different climate indicators at Hohenpeißenberg and Zugspitze (i.e., TT, TN, TX and snow cover) and different teleconnection indices (i.e., NAO, AO, EA, EAWR, SCA, POL, PNA and AMO).
Figure 11a, which shows the wintertime (DJF) correlation matrix, reveals prominent links between the Euro-Atlantic teleconnection patterns and local climatic conditions at Hohenpeißenberg and Zugspitze. Notably, the NAO, EA, and AO exhibit the strongest positive correlations with mean, minimum, and maximum temperatures at Hohenpeißenberg, typically in the range of r ≈ 0.4 to 0.6 (p < 0.001). This underscores the primary role of mid-latitude Atlantic circulation in modulating regional winter temperature variability, consistent with prior findings emphasizing the NAO and EA dominant influence over Central European winter climate (Hurrell, 1995; Visbeck et al., 2001; Comas-Bru and McDermott, 2014; Rodrigo, 2021). Conversely, snow cover at both stations shows negative correlations with these indices—particularly NAO, EA, and AO—ranging approximately from −0.3 to −0.5 (p < 0.001). This indicates that the positive phases of these indices (i.e., NAO and EA), which are associated with milder winter conditions over the central part of Europe, reduces regional snow accumulation (Trigo et al., 2002). The Scandinavian Pattern (SCA), by contrast, displays weakly positive associations with snow cover, suggesting its linkage to colder, more continental winter regimes, in line with existing literature on SCA’s winter impacts (Barnston and Livezey, 1987; Bueh and Nakamura, 2007; Comas-Bru and McDermott, 2014). At the high-elevation Zugspitze site, correlation magnitudes are generally muted compared to Hohenpeißenberg. This attenuation likely reflects stronger influence from local microclimatic processes—such as orographic effects and snow–albedo feedback—damping the expression of large-scale circulation signals. Teleconnection patterns associated with Pacific drivers (PNA) and longer-term ocean variability (AMO) show negligible or absent correlation with both temperature and snow cover. This suggests that interannual winter variability in this region is strongly governed by Euro-Atlantic teleconnections, rather than remote Pacific or low-frequency oceanic drivers (Qasmi et al., 2020; Rodrigo, 2021).
In spring (MAM), the correlations between the Euro-Atlantic teleconnection indices and local climate variables at Hohenpeißenberg and Zugspitze are weaker compared to winter (Figure 11b). The North Atlantic Oscillation (NAO), East Atlantic (EA), and Arctic Oscillation (AO), which strongly influence winter variability, display only modest associations with spring temperatures (generally r ≤ 0.3). This seasonal reduction in sensitivity is consistent with the transitional character of spring circulation over Europe, when synoptic-scale weather variability becomes less tightly governed by the NAO–AO complex (Barnston and Livezey, 1987; Hurrell, 1995; Trigo et al., 2002). At both stations, TT, TN and TX are significantly intercorrelated (r ≥ 0.9, p < 0.001), while snow cover correlates negatively with temperature, particularly at Zugspitze (r ≈ −0.6, p < 0.001). This reflects the strong control of local thermal conditions on snow persistence during the melting season, with elevation amplifying the signal. Correlations between snow cover and large-scale teleconnections are weak and generally insignificant, underscoring that local thermodynamics and radiation balance dominate spring snow evolution (Frei et al., 2018). The Scandinavian Pattern (SCA) shows some moderate negative correlations with spring temperatures (r ≈ −0.3, p < 0.05), consistent with its role in promoting blocking and cold incursions over Central Europe (Bueh and Nakamura, 2007). However, these correlations remain weaker than in winter, suggesting that the SCA’s dynamical influence on local temperature diminishes as the seasonal cycle advances. Teleconnections associated with Pacific (PNA) and multidecadal Atlantic variability (AMO) continue to show negligible correlations with both temperature and snow cover. It has to be mentioned that while the large-scale teleconnections shape Central European winter climate, their influence on spring conditions is markedly weaker, with local thermodynamic processes—especially snow–albedo feedback—playing the dominant role in governing station-level variability.
In summer (JJA), the correlation coefficients between the Euro-Atlantic teleconnections and the local climate at Hohenpeißenberg and Zugspitze are generally weak, highlighting the reduced influence of large-scale circulation indices compared to winter (Figure 11c). The NAO, which strongly influences winter climate variability, shows only modest correlations with station temperatures (r ≤ 0.3, p < 0.05) and no systematic relationship with snow cover. This weakening is consistent with earlier studies showing that the NAO exerts less control on Central European climate during summer, when blocking activity and regional land–atmosphere feedbacks become more important drivers of variability (Folland et al., 2009; Bladé et al., 2012). The East Atlantic (EA) pattern maintains modest positive correlations with temperature at both stations (r ≈ 0.3–0.4, p < 0.01), suggesting that Atlantic inflow variability continues to influence summer thermal conditions in the region. In contrast, the Scandinavian Pattern (SCA) shows weak to moderate negative correlations with temperature (r ≈ −0.3, p < 0.05). As expected for the melting season, snow cover shows the strongest relationships with local thermal conditions, with correlations reaching r = −0.6 (p < 0.001) at Zugspitze. This indicates that interannual snow variability in summer is primarily governed by local temperature anomalies and ablation processes rather than remote teleconnections (Beniston, 2005a; Beniston et al., 2018). Other teleconnection indices, including the AO, POL and PNA, display negligible correlations with both temperature and snow cover, reinforcing the fact that Central European summer variability is largely shaped by regional circulation regimes and local radiative processes (Beniston et al., 2018). Overall, our results emphasize that summer climate variability at the two analyzed stations is weakly linked to Euro-Atlantic teleconnections, with snow and temperature anomalies primarily controlled by local thermodynamic and land–surface feedbacks rather than pre-defined large-scale circulation indices.
In autumn (SON), the influence of Euro-Atlantic teleconnections on local climate conditions at Hohenpeißenberg and Zugspitze is similar to spring, which is also a transition season (Figure 11d). The East Atlantic (EA) pattern and the North Atlantic Oscillation (NAO) show moderate positive correlations with station temperatures (r ≈ 0.3–0.5, p > 0.01), suggesting that Atlantic inflow variability remains an important control on thermal conditions during the transition to winter. This is consistent with studies emphasizing the role of NAO and EA in shaping autumn circulation and surface climate over Europe (Feldstein and Franzke, 2006; Bueh and Nakamura, 2007; Zveryaev and Gulev, 2009; Ionita et al., 2012; Rodrigo, 2021). The Arctic Oscillation (AO) also correlates positively with temperature (r ≈ 0.3, p < 0.05), though less strongly than in winter, indicating a reduced but still detectable influence of hemispheric pressure variability on Central European autumn climate. By contrast, the Scandinavian Pattern (SCA) is negatively correlated with temperature (r ≈ −0.3, p < 0.05), reflecting its tendency to promote blocking and cooler conditions over Central Europe in autumn (Bueh and Nakamura, 2007). Snow cover shows moderate negative correlations with temperature (r = −0.4 to −0.6, p < 0.001), particularly at Zugspitze, highlighting the growing importance of early-season snowfall and snow–temperature coupling as the region transitions into winter. However, snow cover exhibits only weak associations with large-scale teleconnections. Other indices, including the AMO, PNA, and POL, display negligible correlations with both temperature and snow cover. Overall, the autumn climate at Hohenpeißenberg and Zugspitze is moderately shaped by Euro-Atlantic circulation variability (EA, NAO, AO, SCA), but snow cover is primarily governed by local temperature dynamics, rather than large-scale teleconnections.
3.10 Cross-site synthesis: Hohenpeißenberg (977 m) vs. Zugspitze (2,956 m)
In the previous sub-sections, we have shown that both mountain observatories show pronounced long-term warming with clear post-1980 acceleration, but the distribution of that change along the elevation gradient is not uniform. Across most seasons and indicators, the lower site (Hohenpeißenberg) warms faster than the summit (Zugspitze), yielding predominantly negative elevation-dependent warming (EDW) signals—that is, a steepening of the near-surface lapse rate rather than the canonical high-elevation amplification. Exceptions are modest and season-specific. Considering the full overlap period (1901–2024) and the recent decades (1981–2024), both stations warmed significantly, with the strongest late-century acceleration in summer and winter. Yet, for annual and most seasonal means, Hohenpeißenberg exhibits the larger trend, leading to consistently negative EDW values on the order of −0.001 to −0.012 °C dec−1 per 100 m (Table 1). The winter contrast is most pronounced: since the 1980s, Hohenpeißenberg warmed by ∼+0.5 °C dec−1 versus ∼+0.3 °C dec−1 at Zugspitze. By contrast, summer warming is rapid at both sites (∼+0.60 to +0.62 °C dec−1 post-1980), yielding small cross-site differences despite the strong common signal. In autumn, EDW weakens and can approach zero or slightly positive. Collectively, these features indicate that EDW at this station pair is negative or weak in winter–spring–summer, with ambiguous/weakly positive tendencies in autumn. Patterns in TN and TX mirror the mean: robust long-term warming at both stations, with stronger low-elevation trends in most seasons since 1901 and especially after 1981. For TN, EDW is predominantly negative (−0.008 to −0.025 °C dec−1 per 100 m), but a small positive EDW emerges in recent summers (e.g., +0.016 °C dec−1 per 100 m), implying that warm-season nighttime temperatures have sometimes risen slightly faster at Zugspitze than at Hohenpeißenberg. This nuance is consistent with enhanced atmospheric moisture and radiative trapping at altitude during warm seasons. For TX, the agreement with TT and TN is strong: Hohenpeißenberg generally outpaces Zugspitze, except for small/insignificant differences in some warm-season windows.
A coherent and substantial decline in cold extremes is evident at both sites, but with distinct emphases along the elevation gradient. The Cold Spell Duration Index (CSDI) fell by about −39 days at Hohenpeißenberg since 1879 (with −16 days since 1981), compared to −12 days at Zugspitze over 1901–2024 (and −10 days since 1981), indicating a stronger absolute reduction in cold-spell persistence at the lower station. Frost days (FD) decreased by up to −45 days at Hohenpeißenberg and −30 days at Zugspitze (1901–2024). In contrast, ice days (ID; TX < 0 °C) show the clearest high-elevation sensitivity: Zugspitze lost −42 days over 1901–2024 (and −24 days since 1981), reflecting the marked contraction of days with sub-freezing daytime maxima in the summit environment. Together, these results reveal a shared direction of change, but different cold-extreme pathways: Hohenpeißenberg exhibits larger reductions in persistence metrics and frost occurrence, while Zugspitze shows the largest losses in ice days, consistent with an upward shift of winter daytime temperatures above freezing at high elevation. When analyzing the warm-extremes, both observatories record strong and accelerating increases in the frequency and duration, especially since the early 1980s. The Warm Spell Duration Index (WSDI) nearly doubled in the modern era, with +44 days at Hohenpeißenberg (1981–2024) and +32 days at Zugspitze over both the long period and the recent decades. For heat-wave day counts based on maxima (TX90p), the increase since 1981 is +19 days at Hohenpeißenberg and ∼+12 days at Zugspitze. Strikingly, warm nights (TN90p) show particularly strong recent growth at Zugspitze (+25 days since 1981), underscoring a nocturnal warming surge even at high altitude; Hohenpeißenberg also shows an increase (∼+13 days since 1981), though smaller in magnitude. These results indicate directional synchrony (more frequent/longer warm events at both sites) with magnitude asymmetry (generally larger increases at Hohenpeißenberg for WSDI/TX90p, but a notable high-elevation surge in TN90p).
Snow depth declined significantly at both stations, but the magnitude is much larger at Zugspitze. At Hohenpeißenberg (analyzed period: 1937–2024), the snowpack decreased by −14 cm in winter and −7 cm annually, with a −14 cm decline in autumn since 1981, pointing to a later onset. At Zugspitze (analyzed period: 1947–2024), the decline is steeper across all seasons: winter −70 cm (−49 cm since 1981), spring −59 cm (−31 cm since 1981), summer −58 cm since 1981 (virtually eliminating summer snow retention), and annual −38 cm (−42 cm since 1981). These contrasts highlight the enhanced cryospheric sensitivity at high elevation (earlier melt, later onset), while at mid-elevation the shallower baseline snowpack still yields clear declines, albeit smaller in absolute terms.
Overall, the two observatories are similar in direction and timing of change but diverge in magnitude and pathways, resulting in a net lapse-rate steepening over recent decades. This cross-site synthesis directly addresses the stated objective on “the degree of similarity,” demonstrating high synchrony in sign/seasonality, yet substantial elevation-structured differences that matter for impacts and predictability.
4 Discussion and conclusion
By utilizing the unique long-term records from Hohenpeißenberg and Zugspitze, this study provides novel insights into the evolution of temperature extremes and the dynamics of warming across an elevation gradient in the Bavarian Alps. Our central finding of a non-uniform warming pattern, where the lower-elevation site, Hohenpeißenberg, exhibits a more pronounced increase in mean and maximum temperatures than the high-alpine site, Zugspitze, challenges the generalized concept of elevation-dependent warming (EDW) in this specific regional context (Rangwala and Miller, 2012; Pepin et al., 2022; Abbas et al., 2024). This result is of significant importance as it suggests that the mechanisms governing temperature trends in complex mountainous terrain are not universally consistent and are likely influenced by a combination of local and regional factors.
Our analysis confirms that both mountain observatories have experienced substantial long-term warming, with an especially pronounced rise in temperature over the past ∼40 years. At Hohenpeißenberg, the mean annual temperature increase is on the order of +0.07 °C dec−1 over the period 1781–2024, sharply accelerating after the 19th century (i.e., +0.20 °C/dec over the period 1901–2024). By the early 21st century, warming rates exceeded +0.5 °C/dec. This recent warming is roughly double the global average, consistent with findings that Europe (and alpine regions in particular) have warmed at about twice the global rate in recent decades (Copernicus Climate Change Service, 2025). The temperature evolution at Zugspitze also shows a transition from moderate early-century trends (+0.08 °C dec−1 over 1901–2024) to rapid warming in the contemporary period (+0.3 °C dec−1 or higher after 1980). These figures agree with regional estimates that the Alps have warmed ∼2.0 °C total since the late 19th century, far outpacing pre-1980 trends and underscoring the mountains’ high sensitivity to anthropogenic climate change (Beniston et al., 2018; Haberkorn et al., 2021; Noetzli et al., 2024). Nevertheless, the observed warming in the Bavarian Alps exhibits a clear seasonality. Summers show the most intense warming, whereas winters have warmed more unevenly. At Hohenpeißenberg, the summer temperature trend since 1901 (+0.34 °C dec−1) is roughly double the winter trend over the same period. Since the 1980s, summer warming has further intensified–reaching approximately +0.62 °C dec−1 at Hohenpeißenberg and a similar +0.60 °C dec−1 at Zugspitze. This dramatic summer warming aligns with broader observations in the European Alps, where spring and summer temperatures have risen faster than autumn or winter temperatures (Dumont et al., 2025).
The seasonal signal in the trends is also reflected in the elevation contrast. Both sites exhibit a ∼+2.0 °C increase in mean summer temperatures since the early 20th century, with post-1980 trends near +0.6 °C per decade, but this does not translate into systematic high-elevation amplification at our station pair. Classical mechanisms that could favor stronger summer warming at altitude (e.g., snow–albedo feedback, enhanced absorption over snow-free surfaces, aerosol declines) are well documented in the Alps and elsewhere (Pepin et al., 2015; Napoli et al., 2022), however, in our data the summer mean (TT) and maximum (TX) temperatures warm slightly more at the lower site, yielding negative EDW (i.e., lapse-rate steepening). The exception is found in the case of the night-time minima (TN): in recent summers, TN shows a small positive EDW (Zugspitze warming a bit faster), consistent with enhanced moisture and longwave trapping at altitude. Altitude-enhanced summer warming has been reported also in the Swiss and French Alps (Gobiet et al., 2014; Kotlarski et al., 2023) and more broadly in mountain regions worldwide (Pepin et al., 2022). In autumn, the temperature at Zugspitze has warmed at least as rapidly—and in some respects more so—than the temperature at Hohenpeißenberg. By contrast, winter warming does not conform to the classic EDW expectation of greater high-altitude warming. Instead, Hohenpeißenberg has warmed more rapidly in winter, spring and summer. Since the 1980s, mean winter temperatures have increased by about +0.5 °C per decade at Hohenpeißenberg, significantly faster than the ∼+0.3 °C per decade at Zugspitze, yielding strongly negative EDW values. This suggests a steepening rather than flattening of the lapse rate. This mirrors regional studies showing weak or absent EDW in the Alpine mean temperatures (Pepin et al., 2015).
The trends and EDW signal for TN and TX are similar to those observed for TT, with both Hohenpeißenberg and Zugspitze exhibiting a clear long-term warming, for TN and TX, since 1901, with accelerated trends after 1981. A consistent feature is that the low-elevation station warms more strongly than the summit, leading to negative EDW signals in most seasons and variables. This implies a general steepening of the near-surface lapse rate rather than the expected elevation-dependent warming. The agreement across variables is strongest in winter and summer, where TN and TX show larger low-elevation warming and robustly negative EDW. Autumn is more nuanced: minimum temperatures show nearly identical warming rates at the two stations (EDW ≈0), while maximum temperatures in recent decades hint at slightly stronger high-elevation warming in spring (small positive EDW).
Several processes may explain this divergence from the canonical EDW framework. First, valley and mid-elevation sites are more exposed to longwave radiative forcing and declining snow albedo feedback compared to snow-dominated high-altitude conditions (Beniston, 2005a; Gobiet et al., 2014). Second, microclimatic processes, including fog, low-level inversions, and cold-air pooling, remain important at mid-altitudes and amplify sensitivity to warming. By contrast, the high-altitude regions are more directly linked to free-atmospheric conditions, where the anthropogenic signal may manifest with different dynamics (Beniston, 2012; Beniston et al., 2018). Taken together, our findings highlight that EDW is not spatially uniform; instead, it depends strongly on variable, season, and elevation (Gobiet et al., 2014; Abbas et al., 2024; Dumont et al., 2025). We have to mention that this negative EDW might be consistent with stronger boundary-layer and surface-energy sensitivity at the mid-elevation station (i.e., Hohenpeißenberg)—frequent inversions and their erosion, fog/low clouds, snow-to-rain transitions, and soil-moisture feedbacks—amplifying TT/TX trends, whereas the summit (i.e., Zugspitze) is more tightly coupled to the free troposphere and cryospheric/radiative feedbacks (loss of snow, higher humidity and longwave trapping) that preferentially elevate TN and reduce ice/snow days. Accordingly, TT/TX trends are larger at Hohenpeißenberg, while Zugspitze shows the strongest rise in warm nights and the steepest snow-depth losses; the EDW sign remains negative across the full record and post-1981 (with only modest seasonal/variable exceptions, e.g., summer TN). These patterns point to a physical elevation-gradient signal rather than a processing artifact, with site-specific microclimate effects modulating magnitudes but not the direction of change. And, although we document a consistent negative EDW for the Hohenpeißenberg - Zugspitze pair, we do not generalize this magnitude to the entire Bavarian Alps; broader inference will require multi-station, multi-valley analyses that resolve topographic and surface-process heterogeneity.
One of the most prominent finding in our study is the systematic decline in cold extremes at both stations. The Cold Spell Duration Index (CSDI) decreased by around −39 days at Hohenpeißenberg since 1879, with an accelerated loss of −16 days in the post-1980 era. Zugspitze showed slightly smaller but equally significant reductions (−12 days since 1901 and –10 after 1981). Frost and ice days, traditionally present in Alpine winters, showed sharp declines: frost days fell by up to −45 days at Hohenpeißenberg and by −30 days at Zugspitze, while ice days decreased particularly steeply at Zugspitze (−42 days since 1901). This pattern aligns with broader European assessments of extreme indices (Donat et al., 2013; Sillmann et al., 2013; IPCC, 2021) and reflects the dominant influence of anthropogenic forcing on wintertime thermal regimes. The faster decline in cold extremes than the rise in mean temperatures highlights the nonlinear response of extremes to global warming. This decline in cold extremes carries practical implications: reduced winter freezing can alleviate some cold-related hazards, but it may also disrupt chill-dependent ecological processes and, paradoxically, increase late frost risk if plants leaf-out earlier (European Environment Agency EEA, 2021).
The significant reduction in cold spells, frost and ice days, at both stations is corroborated with a significant intensification of warm events. At both stations, all three indices (WSDI, TX90p, TN90p) exhibit strong upward trends since the 1980s. The most dramatic increases were found in the WSDI: at Hohenpeißenberg, WSDI increased by +44 days since 1981, while Zugspitze registered a rise of +32 days. The clustering of extreme heatwaves in 2003, 2015, 2018, and 2024 corresponds to well-documented pan-European extreme warm summers (Barriopedro et al., 2011; Russo et al., 2015; Rousi et al., 2023; Ionita et al., 2025). Heatwave metrics based on daily maxima and minima also exhibit significant upward trends. For example, the number of hot days (TX90P) at Zugspitze increased by ∼+12 days since 1981, while at Hohenpeißenberg it increased by +19 days since 1981. Although absolute temperatures remain lower at high-altitude sites than in the low-lands, the relative increase in extremely warm days is large, indicating a meaningful shift toward a warmer extreme climate even at high-elevations sites. Complementary to the increase in warm days, we also found a significant increase in warm nights. At Zugspitze, TN90p increased by +25 days since 1981, suggesting minimum temperature extremes increasingly dominate the alpine “heatwave” regime. The significant increase in minimum temperature heatwaves (TN90p) is a particularly strong climate change signal. Warmer nights are not solely due to warmer days but are also influenced by a warmer atmosphere and increased moisture content, which prevents efficient nighttime cooling (Dong et al., 2017; Wild et al., 2021; Ionita et al., 2025). This is critical for ecological and cryospheric processes: nocturnal heat limits cooling, accelerates snow and glacier melt, and exacerbates biological stress, particularly at high elevations where species are adapted to narrow thermal ranges (Beniston et al., 2007; 2018; Gobiet et al., 2014; Burtscher et al., 2018; Gaston et al., 2023). Overall, the observed trends in temperature extremes are consistent with broader findings across Europe, but their manifestation at these specific elevations provides crucial context. The significant decline in cold spells and ice days, coupled with the robust increase in heatwaves and warm spell duration, echoes the shift towards an extreme-event regime dominated by warm anomalies (Zolina et al., 2010; Donat et al., 2013; Gobiet et al., 2014; IPCC, 2021; Cook et al., 2022). The fact that even the high-elevation Zugspitze shows a significant relative increase in warm extremes, despite lower absolute temperatures, underscores that no part of the mountain environment is immune to the effects of climate change. These changes have cascading impacts on ecosystems, from glacier melt and permafrost degradation at high altitudes to shifts in agricultural growing seasons and increased risk of forest fires at lower elevations (Beniston et al., 2007; 2018; Gobiet et al., 2014; Burtscher et al., 2018; Gaston et al., 2023).
One of the most consequential impacts of the observed warming and the significant decrease in cold spells and frost and ice days is on snow cover and related cryospheric components. The data from Hohenpeißenberg and Zugspitze, suggest that the Alpine snowpack has become thinner and shorter-lasting, especially at mid elevations. Warmer winters mean a higher rain/snow threshold altitude and more frequent snowmelt events, while warmer springs drive earlier melt-out–all leading to reduced snow accumulation and duration (Dumont et al., 2025). In our study, both time series show statistically significant declines in snowpack. At Zugspitze, the seasonal mean snow depth losses exceeded −70 cm in winter and −59 cm in spring since the mid-20th century, with record declines since 1981. Summer snow retention has almost vanished, with a decline of −58 cm in recent decades. At Hohenpeißenberg, the decline in show depth is more modest but still notable (−14 cm in winter and −7 cm annually since 1937), consistent with its lower elevation and shallower baseline snow cover. These results fit within a growing consensus that snowpack in the European Alps is highly sensitive to warming and expected to decline further in the 21st century, with major repercussions for hydrology, water storage, ecosystems, permafrost stability, and tourism economies (Beniston, 2003; 2012; Dumont et al., 2025). Earlier snowmelt coupled with later onset, as shown here, shortens the snow season and magnifies the risk of mid-winter rain-on-snow events, avalanches, and spring flooding. For example, a shorter snow season can shift peak river runoff to earlier in the year and reduce water availability in summer (Stahl et al., 2017; Rottler et al., 2020). In summary, our findings on extreme temperature trends and seasonal warming align with observed snowpack changes in the Alps: shorter and thinner snow cover at low-to-mid elevations and earlier spring melt even at high elevations (Dumont et al., 2025).
Our analysis of large-scale atmospheric drivers of temperature extremes at the two stations reinforces the importance of Euro-Atlantic circulation patterns in modulating seasonal variability. Composite and correlation analyses confirm the strong role of Euro–Atlantic teleconnections in modulating alpine extremes, especially in the winter season. Warm winters are associated with a positive East Atlantic (EA) phase and enhanced ridging over central Europe, while cold winters are tied to blocking and northerly advection during negative phases (Trigo et al., 2002; Comas-Bru and McDermott, 2014). Spring extremes show sensitivity to the Arctic Oscillation, with positive AO linked to anomalous warmth (Ionita et al., 2012; Friedel et al., 2022). Summer extremes resemble Rossby-wave-like tripole structures leading to blocking-induced persistent heatwaves and increased frequency of warm summers over central Europe (Cassou et al., 2005; Stefanon et al., 2012; Vautard et al., 2023). Autumn resembles spring features, with EA/NAO (and to a lesser extent with AO) positively correlated with temperature and, to a lesser extent, with snow depth. The significant correlation between winter temperatures and the NAO and EA patterns aligns with well-established literature on the influence of these teleconnections on European climate (Barnston and Livezey, 1987; Hurrell, 1995; Visbeck et al., 2001; Trigo et al., 2002). The weakening of these correlations in spring and summer, however, suggests that during the transition and warmer seasons, local processes and land-atmosphere feedbacks, such as snow-albedo feedback and soil-moisture deficits, become the dominant drivers of temperature variability and extremes (Seneviratne et al., 2010; Miralles et al., 2019). This seasonal weakening is consistent with the reduced influence of large-scale circulation in the transitional season (Barnston and Livezey, 1987; Ionita et al., 2020; Craig and Allan, 2022). Moreover, the teleconnection signal is also diminished at the high elevation site, possibly due to localized snow–albedo feedbacks and radiative microclimates at summits. Nevertheless, the relationship between the seasonal temperature variability and the large-scale atmospheric circulation and well-known teleconnection patterns demonstrates that the sensitivity of Central European Mountain climate to these drivers is highly seasonally dependent. Winter emerges as the season of strongest teleconnection control, especially from the NAO–EA–AO triad, while summer is dominated by local thermodynamic and land–surface feedbacks. Spring and autumn represent transitional states, with weakening or re-emerging teleconnection influences. Importantly, snow cover at both stations is consistently most sensitive to local temperature anomalies rather than to remote circulation indices, underscoring the primacy of local thermodynamic processes in controlling snowpack evolution. This seasonal contrast highlights the necessity of considering the timing of teleconnection influences when assessing the predictability of temperature and snow cover in Central Europe. The strong winter signal suggests that skillful forecasts may be possible through teleconnection-based predictors, while in summer, local processes such as snow–albedo feedbacks must be incorporated to capture the observed snow cover variability. The complementarity of composites and index correlations in our study can be regarded as a strength. Composites clarify the large-scale circulation mechanisms of extremes (blocking, jet displacement, moisture pathways) but can conflate co-occurring drivers; while correlations with pre-defined teleconnection patterns quantify systematic linkages and comparability, but inherit the constraints of fixed Empirical Orthogonal Functions (EOF)-based patterns and may miss regime-specific dynamics (Barnston and Livezey, 1987). Together, they show that Central European temperature extremes are governed by a small set of recurrent regimes whose persistence is strongly seasonal.
Summarizing, this study demonstrates that mountain observatories with unique, century-scale records, offer unparalleled insights into the evolving extremes of alpine climates. The exceptional value of long-term mountain observatories lies in their temporal continuity and quality control, which allow the detection of trends and extremes beyond the noise of short-term variability. This is especially relevant for extremes (e.g., heatwaves, cold spells, and heavy precipitation events) that are among the most societally relevant aspects of climate change (IPCC, 2021). The combination of long-term duration, high altitude, and rigorous measurement practices makes mountain observatories like Hohenpeißenberg and Zugspitze indispensable for advancing our understanding of climate processes in alpine regions, where both vulnerability and sensitivity to change are particularly pronounced. Using two of the most exceptional long-term datasets in the German Alps, we show:
• A rapid post-1980 acceleration of warming at both mid- and high-elevation sites, with summer warming most pronounced.
• Observed patterns show predominantly negative EDW, indicating stronger warming at low elevation, with only variable-specific signs of enhanced high elevation warming.
• Significant decline in cold extremes (CSDI, frost and ice days) and significant increases in warm extremes (WSDI, TX90p, TN90p), particularly in recent decades.
• A marked and accelerating reduction in snowpack, most pronounced at Zugspitze, affecting all seasons.
• Large-scale atmospheric circulation modes (NAO, EA, AO, SCA) exert strong control on the variability of extremes, though with elevation-dependent attenuation and seasonality.
These findings confirm a robust anthropogenic fingerprint in alpine extremes and underline the urgency of integrating high-elevation records into climate assessments. Continued monitoring at long-duration sites such as Hohenpeißenberg and Zugspitze is essential for constraining models, understanding processes of extremes across elevation gradients, and informing adaptation in sensitive mountain regions. Future research should focus on a more detailed analysis of the underlying physical mechanisms driving the observed lapse-rate steepening. This could involve using high-resolution regional climate models to disentangle the roles of atmospheric circulation, cloud cover, and land-atmosphere interactions. Furthermore, expanding the analysis to include a wider network of stations across the region would help to determine if our findings are specific to these two sites or representative of a broader regional phenomenon. Ultimately, this work serves as a critical long-term benchmark, emphasizing the need for continued, high-quality observational data to inform climate models and develop effective adaptation strategies for these highly vulnerable mountain environments.
Data availability statement
The original contributions presented in the study are included in the article/Supplementary Material, further inquiries can be directed to the corresponding author.
Author contributions
MI: Conceptualization, Data curation, Formal Analysis, Funding acquisition, Investigation, Methodology, Project administration, Resources, Software, Supervision, Validation, Visualization, Writing – original draft, Writing – review and editing. DC: Methodology, Validation, Writing – review and editing. VN: Investigation, Methodology, Validation, Visualization, Writing – review and editing.
Funding
The author(s) declare that financial support was received for the research and/or publication of this article. VN was partially supported by a grant of the Ministry of Research, Innovation and Digitization, under the “Romania’s National Recovery and Resilience Plan–Founded by EU-NextGenerationEU” program, project “Compound extreme events from a long-term perspective and their impact on forest growth dynamics (CExForD)” number 760074/23.05.2023, code 287/30.11.2022, within Pillar III, Component C9, Investment 8. VN was also partially supported by a BMBF project and acknowledges funding via “Künstliche Intelligenz in der zivilen Sicherheits-forschung II” of the BMBF in the framework of “Forschung für die zivile Sicherheit” of the German Federal Government. MI was supported by Helmholtz Association through the joint program “Changing Earth - Sustaining our Future” (PoF IV) program of the AWI. Funding by the Helmholtz Climate Initiative - REKLIM is gratefully acknowledged.
Conflict of interest
The authors declare that the research was conducted in the absence of any commercial or financial relationships that could be construed as a potential conflict of interest.
The author(s) declared that they were an editorial board member of Frontiers, at the time of submission. This had no impact on the peer review process and the final decision.
Generative AI statement
The author(s) declare that no Generative AI was used in the creation of this manuscript.
Any alternative text (alt text) provided alongside figures in this article has been generated by Frontiers with the support of artificial intelligence and reasonable efforts have been made to ensure accuracy, including review by the authors wherever possible. If you identify any issues, please contact us.
Publisher’s note
All claims expressed in this article are solely those of the authors and do not necessarily represent those of their affiliated organizations, or those of the publisher, the editors and the reviewers. Any product that may be evaluated in this article, or claim that may be made by its manufacturer, is not guaranteed or endorsed by the publisher.
Supplementary material
The Supplementary Material for this article can be found online at: https://www.frontiersin.org/articles/10.3389/feart.2025.1701260/full#supplementary-material
References
Abbas, H., Daramola, M. T., and Xu, M. (2024). Elevation-dependent warming and possible-driving mechanisms over global highlands. Int. J. Climatol. 44, 4157–4177. doi:10.1002/joc.8572
Adeyeri, O. E., Zhou, W., Ndehedehe, C. E., Ishola, K. A., Laux, P., Akinsanola, A. A., et al. (2025). Global heatwaves dynamics under climate change scenarios: multidimensional drivers and cascading impacts. Earth’s Futur. 13, e2025EF006486. doi:10.1029/2025EF006486
Alexander, L. V. (2016). Global observed long-term changes in temperature and precipitation extremes: a review of progress and limitations in IPCC assessments and beyond. Weather Clim. Extrem. 11, 4–16. doi:10.1016/j.wace.2015.10.007
Auer, I., Böhm, R., Jurkovic, A., Lipa, W., Orlik, A., Potzmann, R., et al. (2007). HISTALP—Historical instrumental climatological surface time series of the greater alpine region. Int. J. Climatol. 27, 17–46. doi:10.1002/joc.1377
Bakke, S. J., Ionita, M., and Tallaksen, L. M. (2023). Recent European drying and its link to prevailing large-scale atmospheric patterns. Sci. Rep. 13, 21921. doi:10.1038/s41598-023-48861-4
Barnston, A. G., and Livezey, R. E. (1987). Classification, seasonality and persistence of low-frequency atmospheric circulation patterns. Mon. Weather Rev. 115, 1083–1126. doi:10.1175/1520-0493(1987)115<1083:CSAPOL>2.0.CO;2
Barriopedro, D., Fischer, E. M., Luterbacher, J., Trigo, R. M., García-Herrera, R., and Garcia-Herrera, R. (2011). The hot summer of 2010: redrawing the temperature record map of Europe. Sci. 332, 220–224. doi:10.1126/science.1201224
Barriopedro, D., García-Herrera, R., Ordóñez, C., Miralles, D. G., and Salcedo-Sanz, S. (2023). Heat waves: physical understanding and scientific challenges. Rev. Geophys. 61, e2022RG000780. doi:10.1029/2022RG000780
Beck, C., Jacobeit, J., and Jones, P. D. (2007). Frequency and within-type variations of large-scale circulation types and their effects on low-frequency climate variability in central Europe since 1780. Int. J. Climatol. 27, 473–491. doi:10.1002/joc.1410
Beniston, M. (1997). “Variations of snow depth and duration in the Swiss alps over the last 50 years: links to changes in large-scale climatic forcings,” in Climatic change at high elevation sites. Editors H. F. Diaz, M. Beniston, and R. S. Bradley (Dordrecht: Springer Netherlands), 49–68. doi:10.1007/978-94-015-8905-5_3
Beniston, M. (2003). Climatic change in Mountain regions: a review of possible impacts. Clim. Change 59, 5–31. doi:10.1023/A:1024458411589
Beniston, M. (2005a). Mountain climates and climatic change: an overview of processes focusing on the European alps. pure Appl. Geophys. 162, 1587–1606. doi:10.1007/s00024-005-2684-9
Beniston, M. (2005b). Warm winter spells in the Swiss alps: strong heat waves in a cold season? A study focusing on climate observations at the saentis high mountain site. Geophys. Res. Lett. 32. doi:10.1029/2004GL021478
Beniston, M. (2012). Is snow in the alps receding or disappearing? WIREs Clim. Chang. 3, 349–358. doi:10.1002/wcc.179
Beniston, M., Stephenson, D. B., Christensen, O. B., Ferro, C. A. T., Frei, C., Goyette, S., et al. (2007). Future extreme events in European climate: an exploration of regional climate model projections. Clim. Change 81, 71–95. doi:10.1007/s10584-006-9226-z
Beniston, M., Farinotti, D., Stoffel, M., Andreassen, L. M., Coppola, E., Eckert, N., et al. (2018). The european mountain cryosphere: a review of its current state, trends, and future challenges. Cryosphere 12, 759–794. doi:10.5194/tc-12-759-2018
Benz, S. A., and Burney, J. A. (2021). Widespread race and class disparities in surface urban heat extremes across the United States. Earth’s Futur. 9, e2021EF002016. doi:10.1029/2021EF002016
Bladé, I., Liebmann, B., Fortuny, D., and van Oldenborgh, G. J. (2012). Observed and simulated impacts of the summer NAO in Europe: implications for projected drying in the mediterranean region. Clim. Dyn. 39, 709–727. doi:10.1007/s00382-011-1195-x
Boboc, L., Dima, M., Vaideanu, P., and Ionita, M. (2025). Trends and variability of heat waves in Europe and the association with large-scale circulation patterns. Weather Clim. Extrem. 49, 100794. doi:10.1016/j.wace.2025.100794
Bozzoli, M., Crespi, A., Matiu, M., Majone, B., Giovannini, L., Zardi, D., et al. (2024). Long-term snowfall trends and variability in the alps. Int. J. Climatol. 44, 4571–4591. doi:10.1002/joc.8597
Bueh, C., and Nakamura, H. (2007). Scandinavian pattern and its climatic impact. Q. J. R. Meteorol. Soc. 133, 2117–2131. doi:10.1002/qj.173
Burtscher, M., Gatterer, H., Burtscher, J., and Mairbäurl, H. (2018). Extreme terrestrial environments: life in thermal stress and hypoxia. A narrative review. Front. Physiol. 9, 572. doi:10.3389/fphys.2018.00572
Cassou, C., Terray, L., and Phillips, A. S. (2005). Tropical Atlantic influence on European heat waves. J. Clim. 18, 2805–2811. doi:10.1175/JCLI3506.1
Casty, C., Wanner, H., Luterbacher, J., Esper, J., and Böhm, R. (2005). Temperature and precipitation variability in the european alps since 1500. Int. J. Climatol. 25, 1855–1880. doi:10.1002/joc.1216
Casty, C., Raible, C. C., Stocker, T. F., Wanner, H., and Luterbacher, J. (2007). A European pattern climatology 1766-2000. Clim. Dyn. 29, 791–805. doi:10.1007/s00382-007-0257-6
Chakraborty, T., Hsu, A., Manya, D., and Sheriff, G. (2019). Disproportionately higher exposure to urban heat in lower-income neighborhoods: a multi-city perspective. Environ. Res. Lett. 14, 105003. doi:10.1088/1748-9326/ab3b99
Chersich, S., Rejsek, K., Vranova, V., Bordoni, M., and Meisina, C. (2015). Climate change impacts on the alpine ecosystem: an overview with focus on the soil. J. For. Sci. 61, 496–514. doi:10.17221/47/2015-JFS
Christidis, N., Jones, G. S., and Stott, P. A. (2015). Dramatically increasing chance of extremely hot summers since the 2003 European heatwave. Nat. Clim. Chang. 5, 46–50. doi:10.1038/nclimate2468
Comas-Bru, L., and McDermott, F. (2014). Impacts of the EA and SCA patterns on the European twentieth century NAO–Winter climate relationship. Q. J. R. Meteorol. Soc. 140, 354–363. doi:10.1002/qj.2158
Cook, B. I., Smerdon, J. E., Cook, E. R., Williams, A. P., Anchukaitis, K. J., Mankin, J. S., et al. (2022). Megadroughts in the common era and the anthropocene. Nat. Rev. Earth Environ. 3, 741–757. doi:10.1038/s43017-022-00329-1
Copernicus Climate Change Service (2025). European state of the climate 2024. Available online at: https://climate.copernicus.eu/esotc/2024.
Craig, P. M., and Allan, R. P. (2022). The role of teleconnection patterns in the variability and trends of growing season indices across Europe. Int. J. Climatol. 42, 1072–1091. doi:10.1002/joc.7290
Donat, M. G., Alexander, L. V., Yang, H., Durre, I., Vose, R., Dunn, R. J. H., et al. (2013). Updated analyses of temperature and precipitation extreme indices since the beginning of the twentieth century: the HadEX2 dataset. J. Geophys. Res. Atmos. 118, 2098–2118. doi:10.1002/jgrd.50150
Dong, B., Sutton, R. T., and Shaffrey, L. (2017). Understanding the rapid summer warming and changes in temperature extremes since the mid-1990s over Western Europe. Clim. Dyn. 48, 1537–1554. doi:10.1007/s00382-016-3158-8
Doshi, S. C., Lohmann, G., and Ionita, M. (2023). Hotspot movement of compound events on the Europe continent. Sci. Rep. 13, 18100. doi:10.1038/s41598-023-45067-6
Dumont, M., Monteiro, D., Filhol, S., Gascoin, S., Marty, C., Hagenmuller, P., et al. (2025). The european alps in a changing climate: physical trends and impacts. Comptes Rendus. Géoscience 357, 25–42. doi:10.5802/crgeos.288
Durand, Y., Giraud, G., Laternser, M., Etchevers, P., Mérindol, L., and Lesaffre, B. (2009). Reanalysis of 47 years of climate in the French alps (1958–2005): climatology and trends for snow cover. J. Appl. Meteorol. Climatol. 48, 2487–2512. doi:10.1175/2009JAMC1810.1
European Environment Agency (EEA) (2021). Europe’s changing climate hazards an index-based interactive EEA report. doi:10.2800/458052
Faranda, D., Pascale, S., and Bulut, B. (2023). Persistent anticyclonic conditions and climate change exacerbated the exceptional 2022 european-mediterranean drought. Environ. Res. Lett. 18, 34030. doi:10.1088/1748-9326/acbc37
Feldstein, S. B., and Franzke, C. (2006). Are the north Atlantic oscillation and the northern annular mode distinguishable? J. Atmos. Sci. 63, 2915–2930. doi:10.1175/JAS3798.1
Fischer, E. M., and Schär, C. (2010). Consistent geographical patterns of changes in high-impact European heatwaves. Nat. Geosci. 3, 398–403. doi:10.1038/ngeo866
Fischer, E. M., Seneviratne, S. I., Lüthi, D., and Schär, C. (2007). Contribution of land-atmosphere coupling to recent European summer heat waves. Geophys. Res. Lett. 34. doi:10.1029/2006GL029068
Folland, C. K., Knight, J., Linderholm, H. W., Fereday, D., Ineson, S., and Hurrell, J. W. (2009). The summer north Atlantic oscillation: past, present, and future. J. Clim. 22, 1082–1103. doi:10.1175/2008jcli2459.1
Frei, P., Kotlarski, S., Liniger, M. A., and Schär, C. (2018). Future snowfall in the alps: projections based on the EURO-CORDEX regional climate models. Cryosphere 12, 1–24. doi:10.5194/tc-12-1-2018
Friedel, M., Chiodo, G., Stenke, A., Domeisen, D. I. V., and Peter, T. (2022). Effects of arctic ozone on the stratospheric spring onset and its surface impact. Atmos. Chem. Phys. 22, 13997–14017. doi:10.5194/acp-22-13997-2022
García-Herrera, R., Díaz, J., Trigo, R. M., Luterbacher, J., and Fischer, E. M. (2010). A review of the european summer heat wave of 2003. Crit. Rev. Environ. Sci. Technol. 40, 267–306. doi:10.1080/10643380802238137
Gaston, K. J., Gardner, A. S., and Cox, D. T. C. (2023). Anthropogenic changes to the nighttime environment. Bioscience 73, 280–290. doi:10.1093/biosci/biad017
Gobiet, A., Kotlarski, S., Beniston, M., Heinrich, G., Rajczak, J., and Stoffel, M. (2014). 21st century climate change in the european alps—A review. Sci. Total Environ. 493, 1138–1151. doi:10.1016/j.scitotenv.2013.07.050
Gocic, M., and Trajkovic, S. (2013). Analysis of changes in meteorological variables using mann-kendall and Sen’s slope estimator statistical tests in Serbia. Glob. Planet. Change 100, 172–182. doi:10.1016/j.gloplacha.2012.10.014
Haberkorn, A., Kenner, R., Noetzli, J., and Phillips, M. (2021). Changes in ground temperature and dynamics in Mountain permafrost in the Swiss alps. Front. Earth Sci. 9, 626686. doi:10.3389/feart.2021.626686
Hagg, W., Mayer, C., Mayr, E., and Heilig, A. (2012). Climate and glacier fluctuations in the Bavarian alps in the past 120 years. Erdkunde 66, 121–142. doi:10.3112/erdkunde.2012.02.03
Hamed, K. H., and Ramachandra Rao, A. (1998). A modified mann-kendall trend test for autocorrelated data. J. Hydrol. 204, 182–196. doi:10.1016/S0022-1694(97)00125-X
Hartmann, D. L., Klein Tank, A. M. G., Rusticucci, M., Alexander, L. V., Brönnimann, S., Charabi, Y., et al. (2013). “Observations: atmosphere and surface,” in Climate change 2013: the physical science basis. Contribution of working group I to the fifth assessment report of the intergovernmental panel on climate change. T. F. Stocker, D. Qin, G.-K. Plattner, M. Tignor, S. K. Allen, and J. Boschung (Cambridge, United Kingdom and New York, NY: Cambridge University Press), 159–254. doi:10.1017/CBO9781107415324.008
Helsel, D., Hirsch, R., Ryberg, K., Archfield, S., and Gilroy, E. (2020). Statistical methods in water resources. Reston, VA. doi:10.3133/tm4A3
Horton, D. E., Johnson, N. C., Singh, D., Swain, D. L., Rajaratnam, B., and Diffenbaugh, N. S. (2015). Contribution of changes in atmospheric circulation patterns to extreme temperature trends. Nature 522, 465–469. doi:10.1038/nature14550
Hurrell, J. W. (1995). Decadal trends in the north Atlantic oscillation: regional temperatures and precipitation. Science 269, 676–679. doi:10.1126/science.269.5224.676
Immerzeel, W. W., Lutz, A. F., Andrade, M., Bahl, A., Biemans, H., Bolch, T., et al. (2020). Importance and vulnerability of the world’s water towers. Nature 577, 364–369. doi:10.1038/s41586-019-1822-y
Ionita, M., and Nagavciuc, V. (2025). 2024: the year with too much summer in the eastern part of Europe. Weather n/a 80, 288–295. doi:10.1002/wea.7696
Ionita, M., Lohmann, G., Rimbu, N., and Scholz, P. (2012). Dominant modes of diurnal temperature range variability over Europe and their relationships with large-scale atmospheric circulation and sea surface temperature anomaly patterns. J. Geophys. Res. Atmos. 117. doi:10.1029/2011JD016669
Ionita, M., Tallaksen, L. M., Kingston, D. G., Stagge, J. H., Laaha, G., Van Lanen, H. A. J., et al. (2017). The European 2015 drought from a climatological perspective. Hydrol. Earth Syst. Sci. 21, 1397–1419. doi:10.5194/hess-21-1397-2017
Ionita, M., Nagavciuc, V., Kumar, R., and Rakovec, O. (2020). On the curious case of the recent decade, mid-spring precipitation deficit in central Europe. npj Clim. Atmos. Sci. 3, 49. doi:10.1038/s41612-020-00153-8
Ionita, M., Caldarescu, D. E., and Nagavciuc, V. (2021a). Compound hot and dry events in Europe: variability and large-scale drivers. Front. Clim. 3, 688991. doi:10.3389/fclim.2021.688991
Ionita, M., Dima, M., Nagavciuc, V., Scholz, P., and Lohmann, G. (2021b). Past megadroughts in central Europe were longer, more severe and less warm than modern droughts. Commun. Earth Environ. 2, 61. doi:10.1038/s43247-021-00130-w
Ionita, M., Vaideanu, P., Antonescu, B., Roibu, C., Ma, Q., and Nagavciuc, V. (2024). Examining the eastern european extreme summer temperatures of 2023 from a long-term perspective: the role of natural variability vs. anthropogenic factors. Nat. Hazards Earth Syst. Sci. 24, 4683–4706. doi:10.5194/nhess-24-4683-2024
Ionita, M., Vaideanu, P., Nichita, D., and Nagavciuc, V. (2025). Breaking records under clear skies: the impact of sunshine duration and atmospheric dynamics on the 2024 eastern European extreme summer temperatures. npj Nat. Hazards 2, 82. doi:10.1038/s44304-025-00137-9
IPCC (2013). “Summary for policymakers,” in Climate change 2013: the physical science basis. Contribution of working group I to the fifth assessment report of the intergovernmental panel on climate change. T. F. Stocker, D. Qin, G.-K. Plattner, M. Tignor, S. K. Allen, and J. Boschung (Cambridge, United Kingdom and New York, NY, USA: Cambridge University Press), 1–30. doi:10.1017/CBO9781107415324.004
IPCC (2019). in IPCC special report on the ocean and cryosphere in a changing climateH.-O. Pörtner, D. C. Roberts, V. Masson-Delmotte, P. Zhai, M. Tignor, and E. Poloczanska (Cambridge, UK and New York, NY, USA: Cambridge University Press). doi:10.1017/9781009157964
IPCC (2021). In Climate change 2021: the physical science basis. Contribution of working group I to the sixth assessment report of the intergovernmental panel on climate change. V. Masson-Delmotte, P. Zhai, A. Pirani, S. L. Connors, C. Péan, and S. Berger (Cambridge University Press. In Press).
IPCC (2023). Climate change 2021 – the physical science basis. Cambridge University Press. doi:10.1017/9781009157896
Kautz, L.-A., Martius, O., Pfahl, S., Pinto, J. G., Ramos, A. M., Sousa, P. M., et al. (2022). Atmospheric blocking and weather extremes over the euro-atlantic sector -- A review. Weather Clim. Dyn. 3, 305–336. doi:10.5194/wcd-3-305-2022
Keller, F., Kienast, F., and Beniston, M. (2000). Evidence of response of vegetation to environmental change on high-elevation sites in the Swiss alps. Reg. Environ. Chang. 1, 70–77. doi:10.1007/PL00011535
Kim, Y., Kim, K.-Y., and Kim, B.-M. (2013). Physical mechanisms of European winter snow cover variability and its relationship to the NAO. Clim. Dyn. 40, 1657–1669. doi:10.1007/s00382-012-1365-5
Kotlarski, S., Gobiet, A., Morin, S., Olefs, M., Rajczak, J., and Samacoïts, R. (2023). 21st century alpine climate change. Clim. Dyn. 60, 65–86. doi:10.1007/s00382-022-06303-3
Li, A., Toll, M., and Bentley, R. (2024). The risk of energy hardship increases with extreme heat and cold in Australia. Commun. Earth Environ. 5, 595. doi:10.1038/s43247-024-01729-5
Liu, C.-Y., Lu, B., Jin, L., Chen, H., Wu, J., Xiang, Y., et al. (2022). Impact of the cold surge event in January 2021 on the power system of China. Adv. Clim. Chang. Res. 13, 803–810. doi:10.1016/j.accre.2022.11.004
Lo, Y.-H., Blanco, J. A., Seely, B., Welham, C., and Hamish) Kimmins, J. P. (2011). Generating reliable meteorological data in mountainous areas with scarce presence of weather records: the performance of MTCLIM in interior British Columbia, Canada. Environ. Model. Softw. 26, 644–657. doi:10.1016/j.envsoft.2010.11.005
Luo, B., Luo, D., Zhuo, W., Xiao, C., Dai, A., Simmonds, I., et al. (2023). Increased summer European heatwaves in recent decades: contributions from greenhouse gases-induced warming and Atlantic multidecadal oscillation-like variations. Earth’s Futur. 11, e2023EF003701. doi:10.1029/2023EF003701
Ma, Q., Chen, Y., and Ionita, M. (2024). European summer wet-bulb temperature: spatiotemporal variations and potential drivers. J. Clim. 37, 2059–2080. doi:10.1175/JCLI-D-23-0420.1
Mann, H. B. (1945). Nonparametric tests against trend. Econometrica 13, 245–259. doi:10.2307/1907187
Manning, C., Widmann, M., Bevacqua, E., Van Loon, A. F., Maraun, D., and Vrac, M. (2019). Increased probability of compound long-duration dry and hot events in Europe during summer (1950–2013). Environ. Res. Lett. 14, 094006. doi:10.1088/1748-9326/ab23bf
Masson-Delmotte, V., Zhai, P., Pirani, A., Connors, S. L., Péan, C., Berger, S., et al. (2021). AR6 PSB - IPCC: climate change 2021: the physical science basis. Cambridge, United Kingdom/New York, NY: Cambridge University Press.
Menzel, A., and Fabian, P. (1999). Growing season extended in Europe. Nature 397, 659. doi:10.1038/17709
Miralles, D. G., Gentine, P., Seneviratne, S. I., and Teuling, A. J. (2019). Land–atmospheric feedbacks during droughts and heatwaves: state of the science and current challenges. Ann. N. Y. Acad. Sci. 1436, 19–35. doi:10.1111/nyas.13912
Monteiro, D., and Morin, S. (2023). Multi-decadal analysis of past winter temperature, precipitation and snow cover data in the european alps from reanalyses, climate models and observational datasets. Cryosph 17, 3617–3660. doi:10.5194/tc-17-3617-2023
Nagavciuc, V., Michel, S. L. L., Balting, D. F., Helle, G., Freund, M., Schleser, G. H., et al. (2024). A past and present perspective on the European summer vapor pressure deficit. Clim. Past. 20, 573–595. doi:10.5194/cp-20-573-2024
Napoli, A., Desbiolles, F., Parodi, A., and Pasquero, C. (2022). Aerosol indirect effects in complex-orography areas: a numerical study over the great alpine region. Atmos. Chem. Phys. 22, 3901–3909. doi:10.5194/acp-22-3901-2022
Noetzli, J., Isaksen, K., Barnett, J., Christiansen, H. H., Delaloye, R., Etzelmüller, B., et al. (2024). Enhanced warming of european mountain permafrost in the early 21st century. Nat. Commun. 15, 10508. doi:10.1038/s41467-024-54831-9
Nygård, T., Papritz, L., Naakka, T., and Vihma, T. (2023). Cold wintertime air masses over Europe: where do they come from and how do they form? Weather Clim. Dyn. 4, 943–961. doi:10.5194/wcd-4-943-2023
Osmolska, W., Chemel, C., Maycock, A., and Field, P. (2025). A methodology for tracking cold spells in space and time: development, evaluation and applications. EGUsphere 2025, 1–34. doi:10.5194/egusphere-2025-1014
Pepin, N. C., and Lundquist, J. D. (2008). Temperature trends at high elevations: patterns across the globe. Geophys. Res. Lett. 35. doi:10.1029/2008GL034026
Pepin, N., Bradley, R. S., Diaz, H. F., Baraer, M., Caceres, E. B., Forsythe, N., et al. (2015). Elevation-dependent warming in mountain regions of the world. Nat. Clim. Chang. 5, 424–430. doi:10.1038/nclimate2563
Pepin, N. C., Arnone, E., Gobiet, A., Haslinger, K., Kotlarski, S., Notarnicola, C., et al. (2022). Climate changes and their elevational patterns in the Mountains of the world. Rev. Geophys. 60, e2020RG000730. doi:10.1029/2020RG000730
Perkins, S. E. (2015). A review on the scientific understanding of heatwaves—Their measurement, driving mechanisms, and changes at the global scale. Atmos. Res. 164–165, 242–267. doi:10.1016/j.atmosres.2015.05.014
Perkins, S. E., and Alexander, L. V. (2013). On the measurement of heat waves. J. Clim. 26, 4500–4517. doi:10.1175/JCLI-D-12-00383.1
Ponds, M., Hanus, S., Zekollari, H., ten Veldhuis, M.-C., Schoups, G., Kaitna, R., et al. (2025). Adaptation of root zone storage capacity to climate change and its effects on future streamflow in alpine catchments: towards non-stationary model parameters. Hydrol. Earth Syst. Sci. 29, 3545–3568. doi:10.5194/hess-29-3545-2025
Qasmi, S., Cassou, C., and Boé, J. (2020). Teleconnection processes linking the intensity of the Atlantic multidecadal variability to the climate impacts over Europe in boreal winter. J. Clim. 33, 2681–2700. doi:10.1175/JCLI-D-19-0428.1
Raible, C. C., Brönnimann, S., Auchmann, R., Brohan, P., Frölicher, T. L., Graf, H.-F., et al. (2016). Tambora 1815 as a test case for high impact volcanic eruptions: earth system effects. WIREs Clim. Chang. 7, 569–589. doi:10.1002/wcc.407
Rangwala, I., and Miller, J. R. (2012). Climate change in Mountains: a review of elevation-dependent warming and its possible causes. Clim. Change 114, 527–547. doi:10.1007/s10584-012-0419-3
Rimbu, N., Lohmann, G., and Ionita, M. (2014). Interannual to multidecadal euro-atlantic blocking variability during winter and its relationship with extreme low temperatures in Europe. J. Geophys. Res. Atmos. 119, 13621–13636. doi:10.1002/2014JD021983
Robine, J. M., Cheung, S. L. K., Le Roy, S., Van Oyen, H., Griffiths, C., Michel, J. P., et al. (2008). Death toll exceeded 70,000 in Europe during the summer of 2003. Comptes Rendus - Biol. 331, 171–178. doi:10.1016/j.crvi.2007.12.001
Robinson, P. J. (2001). On the definition of a heat wave. J. Appl. Meteorol. 40, 762–775. doi:10.1175/1520-0450(2001)040<0762:OTDOAH>2.0.CO;2
Rodrigo, F. S. (2021). Exploring combined influences of seasonal east atlantic (EA) and north atlantic oscillation (NAO) on the temperature-precipitation relationship in the iberian peninsula. Geosciences 11, 211. doi:10.3390/geosciences11050211
Rottler, E., Francke, T., Bürger, G., and Bronstert, A. (2020). Long-term changes in central European river discharge for 1869--2016: impact of changing snow covers, reservoir constructions and an intensified hydrological cycle. Hydrol. Earth Syst. Sci. 24, 1721–1740. doi:10.5194/hess-24-1721-2020
Rousi, E., Fink, A. H., Andersen, L. S., Becker, F. N., Beobide-Arsuaga, G., Breil, M., et al. (2023). The extremely hot and dry 2018 summer in central and northern Europe from a multi-faceted weather and climate perspective. Nat. Hazards Earth Syst. Sci. 23, 1699–1718. doi:10.5194/nhess-23-1699-2023
Ruosteenoja, K., and Jylhä, K. (2025). Extreme cold days and spells in northern Europe at 0.5°C–2.0°C global warming levels. Int. J. Climatol. 45, e8875. doi:10.1002/joc.8875
Russo, S., Sillmann, J., and Fischer, E. M. (2015). Top ten European heatwaves since 1950 and their occurrence in the coming decades. Environ. Res. Lett. 10, 124003. doi:10.1088/1748-9326/10/12/124003
Russo, A., Gouveia, C. M., Dutra, E., Soares, P. M. M., and Trigo, R. M. (2019). The synergy between drought and extremely hot summers in the mediterranean. Environ. Res. Lett. 14, 014011. doi:10.1088/1748-9326/aaf09e
Schubert, S. D., Wang, H., Koster, R. D., Suarez, M. J., and Groisman, P. Y. (2014). Northern Eurasian heat waves and droughts. J. Clim. 27, 3169–3207. doi:10.1175/JCLI-D-13-00360.1
Sen, P. K. (1968). Estimates of the regression coefficient based on kendall’s tau. J. Am. Stat. Assoc. 63, 1379–1389. doi:10.1080/01621459.1968.10480934
Seneviratne, S. I., Corti, T., Davin, E. L., Hirschi, M., Jaeger, E. B., Lehner, I., et al. (2010). Investigating soil moisture-climate interactions in a changing climate: a review. Earth-Science Rev. 99, 125–161. doi:10.1016/j.earscirev.2010.02.004
Shakoor, A., and Ejaz, N. (2019). Flow analysis at the snow covered high altitude catchment via distributed energy balance modeling. Sci. Rep. 9, 4783. doi:10.1038/s41598-019-39446-1
Sillmann, J., Kharin, V. V., Zhang, X., Zwiers, F. W., and Bronaugh, D. (2013). Climate extremes indices in the CMIP5 multimodel ensemble: part 1. Model evaluation in the present climate. J. Geophys. Res. Atmos. 118, 1716–1733. doi:10.1002/jgrd.50203
Slivinski, L. C., Compo, G. P., Whitaker, J. S., Sardeshmukh, P. D., Giese, B. S., McColl, C., et al. (2019). Towards a more reliable historical reanalysis: improvements for version 3 of the twentieth century reanalysis system. Q. J. R. Meteorol. Soc. 145, 2876–2908. doi:10.1002/qj.3598
Smid, M., Russo, S., Costa, A. C., Granell, C., and Pebesma, E. (2019). Ranking European capitals by exposure to heat waves and cold waves. Urban Clim. 27, 388–402. doi:10.1016/j.uclim.2018.12.010
Sousa, P. M., Barriopedro, D., García-Herrera, R., Ordóñez, C., Soares, P. M. M., and Trigo, R. M. (2020). Distinct influences of large-scale circulation and regional feedbacks in two exceptional 2019 European heatwaves. Commun. Earth Environ. 1, 1–13. doi:10.1038/s43247-020-00048-9
Stahl, K., Weiler, M., Freudiger, D., Kohn, I., Seibert, J., Vis, M., et al. (2017). Final report to the international commission for the hydrology of the rhine basin (CHR).
Stefanon, M., Dandrea, F., and Drobinski, P. (2012). Heatwave classification over Europe and the mediterranean region. Environ. Res. Lett. 7, 014023. doi:10.1088/1748-9326/7/1/014023
Sulikowska, A., and Wypych, A. (2021). Seasonal variability of trends in regional hot and warm temperature extremes in Europe. Atmos. (Basel) 12, 612. doi:10.3390/atmos12050612
Tomczyk, A. M., Bednorz, E., and Sulikowska, A. (2019). Cold spells in Poland and Germany and their circulation conditions. Int. J. Climatol. 39, 4002–4014. doi:10.1002/joc.6054
Trigo, R. M., Osborn, T. J., and Corte-Real, J. M. (2002). The north Atlantic oscillation influence on Europe: climate impacts and associated physical mechanisms. Clim. Res. 20, 9–17.
van Ruijven, B. J., De Cian, E., and Sue Wing, I. (2019). Amplification of future energy demand growth due to climate change. Nat. Commun. 10, 2762. doi:10.1038/s41467-019-10399-3
Vautard, R., Cattiaux, J., Happé, T., Singh, J., Bonnet, R., Cassou, C., et al. (2023). Heat extremes in Western Europe increasing faster than simulated due to atmospheric circulation trends. Nat. Commun. 14, 6803. doi:10.1038/s41467-023-42143-3
Visbeck, M. H., Hurrell, J. W., Polvani, L., and Cullen, H. M. (2001). The north Atlantic oscillation: past, present, and future. Proc. Natl. Acad. Sci. U. S. A. 98, 12876–12877. doi:10.1073/pnas.231391598
von Storch, H., and Zwiers, F. W. (1999). Statistical analysis in climate research. Cambridge University Press. doi:10.1017/cbo9780511612336
Wastl, C., Schunk, C., Leuchner, M., Pezzatti, G. B., and Menzel, A. (2012). Recent climate change: long-term trends in meteorological forest fire danger in the alps. Agric. For. Meteorol. 162–163, 1–13. doi:10.1016/j.agrformet.2012.04.001
Wege, K. (2000). Die Geschichte der Wetterstation Zugspitze. Offenb. Am. Main. Selbstverlag Des. Dtsch. Wetterd.
Wild, M. (2009). Global dimming and brightening: a review. J. Geophys. Res. Atmos. 114, 2008JD011470–31. doi:10.1029/2008JD011470
Wild, M., Wacker, S., Yang, S., and Sanchez-Lorenzo, A. (2021). Evidence for clear-sky dimming and brightening in central Europe. Geophys. Res. Lett. 48, e2020GL092216–9. doi:10.1029/2020GL092216
Winkler, P. (2015). Frühgeschichte des Bergobservatoriums {Hohenpeißenberg}: neue Erkenntnisse und Präzisierungen. Offenb. Am. Main. Selbstverlag Des. Dtsch. Wetterd.
Winkler, P. (2023). The early meteorological network of the societas meteorologica palatina (1781–1792): foundation, organization, and reception. Space Sci. 14, 93–120. doi:10.5194/hgss-14-93-2023
Wu, S., Luo, M., Lau, G. N.-C., Zhang, W., Wang, L., Liu, Z., et al. (2025). Rapid flips between warm and cold extremes in a warming world. Nat. Commun. 16, 3543. doi:10.1038/s41467-025-58544-5
Yue, S., and Wang, C. Y. (2002). Applicability of prewhitening to eliminate the influence of serial correlation on the mann-kendall test. Water Resour. Res. 38, 4–7. doi:10.1029/2001WR000861
Zandonai, A., Fontana, V., Klotz, J., Bertoldi, G., Crepaz, H., Tappeiner, U., et al. (2024). Six years of high-resolution climatic data collected along an elevation gradient in the Italian alps. Sci. Data 11, 751. doi:10.1038/s41597-024-03580-x
Zitzmann, S., Fersch, B., and Kunstmann, H. (2025). “Understanding elevation-dependent warming in the alps through high-resolution surface energy balance analysis,” in EGU general assembly 2025 (Vienna, Austria: copernicus meetings). doi:10.5194/egusphere-egu25-16132
Zolina, O., Simmer, C., Gulev, S. K., and Kollet, S. (2010). Changing structure of European precipitation: longer wet periods leading to more abundant rainfalls. Geophys. Res. Lett. 37. doi:10.1029/2010GL042468
Keywords: elevation dependent warming, climate change, heatwaves, cold spells, snow cover
Citation: Ionita M, Cai D and Nagavciuc V (2025) Temperature extremes across elevation gradients: evidence from two German mountain observatories. Front. Earth Sci. 13:1701260. doi: 10.3389/feart.2025.1701260
Received: 08 September 2025; Accepted: 28 October 2025;
Published: 18 November 2025.
Edited by:
Dongliang Luo, Chinese Academy of Sciences (CAS), ChinaReviewed by:
Josep Ramon Miró, Servei Meteorologic de Catalunya, SpainYulizar Yulizar, National Taiwan University, Taiwan
Copyright © 2025 Ionita, Cai and Nagavciuc. This is an open-access article distributed under the terms of the Creative Commons Attribution License (CC BY). The use, distribution or reproduction in other forums is permitted, provided the original author(s) and the copyright owner(s) are credited and that the original publication in this journal is cited, in accordance with accepted academic practice. No use, distribution or reproduction is permitted which does not comply with these terms.
*Correspondence: Monica Ionita, bW9uaWNhLmlvbml0YUBhd2kuZGU=