 Justina Grubb
 Ellie L. Young
- Counseling Psychology and Special Education, Brigham Young University, Provo, UT, United States
Schoolwide social-emotional screening identifies students who may be at-risk for school problems and benefit from prevention efforts, additional supports, or individualized interventions. Data from screening can also pinpoint topics that bolster teachers’ knowledge and skills when they provide supports and instruction focused on social, emotional, and behavioral needs. While research has explored many aspects of schoolwide screening, studies that focus on how the process of summarizing and using screening data are limited. This study investigated school teams’ perspectives on the use of a structured guide for reviewing their screening data. After collecting schoolwide screening data, 47 participants from seven school leadership teams used a Discussion Guide (DG) to answer a series of questions about their Student Risk Screening Scale – Internalizing and Externalizing (SRSS-IE) data. Using content analysis, this qualitative study identified what teams found helpful, less helpful, and what they might add to the DG. Participants valued the DG’s usefulness in developing data-based responses to the SRSS-IE results and identifying patterns and trends in their data. Including a menu of specific intervention strategies and supports was a frequent suggestion for improving the DG. Reviewing their screening data took longer than expected; participants recommended that teams needed multiple meetings for organizing, analyzing, and developing action plans.
Introduction
A key practice in Multi-Tiered Systems of Support (MTSS) is universal schoolwide screening of students who may be at risk for social, emotional, and behavioral (SEB) problems. SEB risk factors may include a range internalizing (e.g., withdrawal, thinking errors, low self-efficacy, and some aspects of anxiety or depression) and externalizing behaviors (e.g., aggressive, non-compliant, or coercive behaviors; Lane et al., 2012b; Romer et al., 2020). Recent research has focused on the psychometric properties of various screening measures (Renshaw, 2019; Lane et al., 2021, 2023; Moulton and Young, 2021), training teachers to complete screeners (von der Embse et al., 2018), understanding the preponderance of schools participating in universal screening (Wood and Ellis, 2022), and barriers to screening (Wood and McDaniel, 2020). Romer et al. (2020) identified practical, key considerations for screening procedures. We found few articles that explored what is needed for school or district teams to use their screening data and develop supports and interventions. This preliminary study explored perceptions of the usefulness of a discussion guide (DG) that school-based teams used to guide their use of screening data as part of their efforts to effectively implement MTSS.
Multi-tiered systems of support
MTSS is framework of increasingly intense instructional and support strategies aimed at ensuring that students’ instruction matches their current skills and needs. MTSS is intended to simultaneously consider the behavior, social–emotional and academic needs of students to improve outcomes. Typically, MTSS implementation involves three tiers of instruction. Tier 1, or universal instruction, which delivers robust evidence-based instruction to all students and typically meets the needs of 80% of students. Initiatives that explicitly teach and reinforce positive behaviors is an example of a Tier 1 practice. Ensuring that schoolwide literacy instruction is evidence-based and delivered with fidelity is another example of Tier 1 efforts. Selected or targeted strategies, or Tier 2, address the learning gaps for about 10–15% of students and are often delivered in small groups. Tier 2 initiatives are typically short-term and address the specific skills deficits related to the core curriculum. Friendship groups, social skills groups, or check in-check out (McIntosh and Goodman, 2016; Bundock et al., 2020) are common Tier 2 strategies. Pre-teaching and reviewing skills for Tier 1 academic lessons could be a Tier 2 strategy (The Iris Center, 2024a). Tier 3, intensive interventions, involves individualized instruction, and about 5 % of students need Tier 3 supports (McIntosh and Goodman, 2016). Behavior support plans and individual counseling are common types of Tier 3 strategies that target SEB concerns (Young et al., 2011). Individualized academic instruction that targets significant academic concerns is another example of Tier 3 supports. The specific tiered services may vary at each school, depending on the needs of students and the capacity of the school to address those needs. Data informed decisions about student and educator needs are critical elements of effective three-tiered models (Lane et al., 2013b).
When schools adopt MTSS, teams focus on gathering and utilizing universal screening data. Universal screening guarantees equal consideration of all students’ circumstances within a school and is crucial for identifying the specific challenges faced by students who may be easily overlooked. This helps tailor supports across tiers to align with students’ present skills. For example, screening data may reveal that students’ emotional regulation skills need to be bolstered, encouraging teams to develop Tier 1 instruction that teaches ways to identify emotions and use calming strategies. The screening data also can inform teams about teachers professional learning needs related to delivering universal instruction (McIntosh and Goodman, 2016).
Understanding students’ social emotional and behavioral needs
Some estimate that about 20% of schools are implementing positive behavioral interventions and supports (PBIS; McIntosh and Goodman, 2016) and approximately 94% of schools were engaged in some level of Response to Intervention (RTI) implementation (Global Scholar, 2011). Academic progress has a history of being easily measured, and states develop standards for assessing academic proficiency (Merrell et al., 2022). In contrast, identifying SEB skills and needs of students can be a complex and complicated endeavor because explicit SEB expectations or standardized SEB assessments may be unfamiliar to educators, or they lack funding and access to universal screeners (Wood and McDaniel, 2020). Despite these challenges, the importance of addressing students’ SEB needs through an effective screening process is an essential component in ensuring healthy educational outcomes for all students (Young et al., 2011; McIntosh and Goodman, 2016).
Research has provided evidence that attending to the SEB needs of students strengthens students’ academic outcomes (Durlak et al., 2011; Greenberg, 2023). In fact, a meta-analysis found that even years after participating in social–emotional learning programs, students’ academic performance averaged 13 percentile points above students who did not participate in these programs (Taylor et al., 2017). Studies have also stipulated that approximately one in five youth were likely to meet the diagnostic criteria for a mental health disorder before the COVID pandemic (Merikangas et al., 2010; Centers for Disease Control and Prevention (CDCP), 2023). More recently, Panchal et al. (2021) reported a substantial increase in behaviors indicative of depression and anxiety in the post COVID environment. Research findings show that when children participate in mental health care, students are about as likely to receive services in schools are they are in outpatient settings (Duong et al., 2021). Given that students’ emotional wellbeing is likely to impact their academic performance (Durlak et al., 2011), and that approximately 20% of students are likely to need SEB support [Centers for Disease Control and Prevention (CDCP), 2023], schoolwide SEB screening has the potential to identify the students that have the highest need for services, which is a foundational step in creating a range of services and supports to ensure that students’ needs are met. As noted earlier, implementing a schoolwide screening process to make data-based decisions requires substantial resources to collect and use data to improve student outcomes, and school-based teams serve a vital role in effective implementation of a screening process.
Screening implementation and school-based teams
Implementing a screening process involves a complex process lead by teams; team members are charged with selecting an instrument that matches school needs and culture, training teachers, getting consents, then collecting, storing, and using the data to develop supports. Researchers investigating the implementation of PBIS have emphasized that teams consistently gathering, disaggregating, and sharing data play pivotal roles in maintaining PBIS implementation with high fidelity (McIntosh et al., 2013). Similarly, McIntosh et al. (2015) found that data utilization by teams surpassed school demographics as a stronger predictor of sustainability. More recently, McIntosh et al. (2018) found that teams consistently utilizing data emerged as a reliable predictor of PBIS sustainability across various implementation levels (e.g., exploration, installation).
In MTSS implementation, teams play two key roles: directing resources to improve student outcomes and assisting educators to implement evidence-based practices with fidelity (Kittelman et al., 2021). Teams can effectively fulfill these roles when they use data in each step of a problem-solving model: (a) problem identification, (b) problem analysis, (c) intervention, and (d) evaluation (Marx and Goodman, 2019). Marx and Goodman also posited that team meetings needed to include data-infused agendas and graphed data prior to the meeting.
Limited publications that discuss using screening data are available (see Lane et al., 2013b; Verlenden et al., 2021), and these authors present guiding principles for implementing screening processes or case studies of the screening process. However, the extant research literature has not yet fully explored how a discussion guide (DG) may be useful in team meetings when analyze and summarize screening data. This study explored the perceived helpfulness of a DG used by school teams during their review of data from the Student Risk Screening Scale–Internalizing and Externalizing (SRSS-IE; see Lane et al., 2012a,b, 2013a). Knowing what teams would add or eliminate in the DG was another study outcome.
Method
Participants
The participants for this research study were selected using a convenience sampling method in the mountain west region of the United States. All participants were educators serving on teams in schools that were using the Student Risk Screening Scale-Internalizing and Externalizing (SRSS-IE; see Lane et al., 2012a,b, 2013a). The researcher contacted district leaders who suggested school teams that may be interested in participating in this study and who were planning to use the DG during the Fall screening data team meeting. School leaders were then contacted by the researcher to further assess interest and logistics of participation.
There were 47 participants for this research project from seven different schools. The focus group sizes ranged from six people to ten people. Each focus group consisted of one school team that had just used the DG to review the SRSS-IE. There was one middle school team and six elementary school teams. Participants ranged in professional roles, and all were active members of the SRSS-IE data review teams. There were teachers, counselors, school psychologists, vice principals, principals, and district-level employees. Each school team had a different combination of participants involved in the data review process. Table 1 provides a summary of participant characteristics.
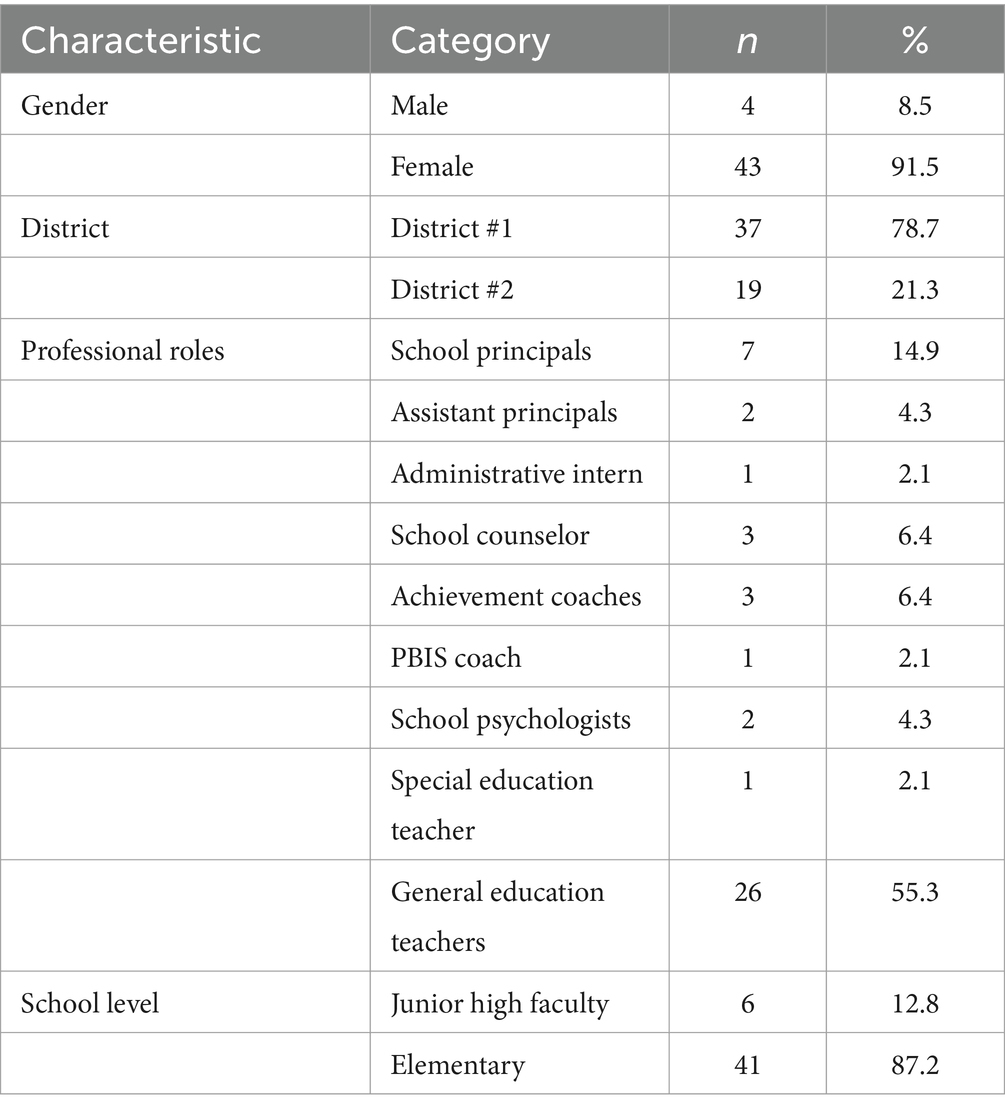
Table 1. Demographic characteristics of participants.
The university Institutional Review Board (IRB) approval was obtained before the research study began and all requested procedures were followed. All participants were de-identified and assigned code names that then corresponded to their focus group. All participants were given a $25 Amazon gift card as compensation for participating in this research project.
Procedures
Two school districts were invited to participate because they were using the SRSS-IE in their schools. Each district was asked to identify 3–5 teams that would be willing to participate in the research. Building administrators were contacted to determine if their teams would be willing to participate in the study. After the SRSS-IE data were collected and the school teams scheduled a meeting to review the data, the teams were given the DG when the meetings were scheduled with the researcher, which gave them an opportunity to be familiar with the questions before the meeting.
The DG included questions that specified how many students scored in each risk category (i.e., low, some or high risk) for both internalizing and externalizing concerns (see Appendix A). As teams reviewed their data, the DG questions asked how the data showed both strengths and needs of the student body. The teams were also asked to review how their current tiered supports or initiatives aligned with the data they were reviewing. The DG was intentionally designed to ask the teams to consider group data before they considered individual data. Analyzing schoolwide data before individual data aligns with the recommended practice of focusing first on Tier 1 supports (McIntosh and Goodman, 2016). After the teams reviewed their group data, they were asked to identify individual students who scored in each risk category in both the internalizing and externalizing domains. Other questions asked teams to identify what trends or patterns they saw in the data, and what other data were needed. Finally, teams were asked to consider what other data are being collected or could be collected to determine if interventions and supports were effective.
After the SRSS-IE data were collected and the teams scheduled a meeting to review the data, the researcher asked the team to move through the DG questions as they reviewed their screening data. After the team answered as many questions from the DG as they chose, the researcher conducted a focus group with the team members and asked the following questions:
What do teams that are reviewing screening data using the SRSS-IE report find useful, or not useful, about the DG?
How does the DG contribute to efficiently reviewing schoolwide data?
What would teams add to the list of questions and what would they eliminate?
The researcher read each of the three questions separately, allowing each group time to discuss each one at length. The questions were read exactly as written and the researcher did not participate in the discussion, leaving room for the participants to share their ideas without further guidance. The focus group comments were recorded and transcribed.
Development of discussion guide
The problem-solving model (Ervin et al., 2009) was the basis for the DG, which emphasized the first three steps of the problem-solving model: problem identification and problem analysis, and then developing and implementing interventions and supports. For this research, the final step of the problem-solving model, evaluation, was not a concrete step included in the DG because using the screening data to make instructional decisions was prioritized. Analyzing group data rather than individual data for students with internalizing or externalizing concerns was prioritized in the development of the DG to ensure that Tier 1 and Tier 2 strategies were considered before considering individual interventions.
Design
A qualitative method was used for this study to allow an in-depth understanding of participants’ opinions and attitudes about the DG. Brantlinger et al. (2005) described exploration of attitudes and opinions as one of the purposes of qualitative research. This research project used focus groups to collect data. Focus groups not only allow the researcher to collect data from many individuals at one time (Onwuegbuzie et al., 2009), but also provide an environment that is a comfortable and safe place to share opinions, which is beneficial to the participants (Krueger and Casey, 2014). For this study, focus groups were chosen to efficiently collect perspectives from a variety of educators when they had just participated in a shared experience using the DG.
Data analysis
Content analysis was used to analyze and summarize the data. For this project, spoken comments during focus groups were recorded as the content. This content was broken into units that were coded, and word sense or phrase was selected for this project. Content analysis is completed as the researcher codes chunks of data, grouping similar data together, and counting data in each category (Onwuegbuzie et al., 2009). Data were coded literally, meaning codable ideas were extracted and analyzed with the belief that the participant said exactly what they meant. All responses from each of the seven focus groups were transcribed by the primary researcher.
A codable idea was any phrase expressing an independent thought. Categories were developed by the researchers and involved reviewing the data to identify recurring ideas. Ideas that initially appeared to be similar were grouped together and reviewed so the researchers could get a sense of the breadth and cohesiveness of the proposed category. Then initial inclusionary and exclusionary criteria for each category were developed by the researchers. The inclusionary and exclusionary criteria were descriptive in nature and developed through inductive reasoning. For each interview question, two members of the researcher team independently coded approximately 20% of the ideas and inter-rater reliabilities (IRR) were determined. If the IRR was below 90%, the researchers reviewed the coded items and looked for common patterns in their disagreements. If needed, the researchers refined the description of the category and inclusionary/exclusionary criteria. Most of these changes resulted in increasing the specificity of the inclusionary/exclusionary criteria descriptions. In a few instances, categories were eliminated or combined to increase the cohesiveness of the category. When categories were changed, previously coded data were recoded to reflect the current categories. The researchers then coded approximately 20% additional ideas and IRR was again determined. The researchers then discussed items that were coded differently until consensus was reached.
Each research question had a “not codable” category, which included participants’ statements that did not apply to the questions asked by the researcher during the focus group. For example, question one asked what was useful or not useful about the DG in terms of the team’s experience using it to interpret and organize SRSS-IE data. A not codable response was a comment about how much the team appreciates the SRSS-IE. While that is an idea that has meaning, it was directed toward the screener itself, instead of a response to the interview question asked by the researcher about the usefulness of the DG.
Results
Improvements to the discussion guide
Typically, participants conveyed that the Decision Guide (DG) was helpful and guided them in the identification of students’ needs. Participants also provided specific insights into enhancing the DG’s overall utility. Table 2 includes a complete list of categories and numerical information based on responses to the first interview question. A total of 120 ideas across seven focus groups were recorded for the first interview question. Thirty-five (29.2%) ideas focused on identifying schoolwide, group data and patterns. One participant shared, “I think it can be helpful to know what patterns we are seeing schoolwide.” Another comment that also addressed seeing group needs, “…we could see there were certain grades that had – were a little more elevated”.
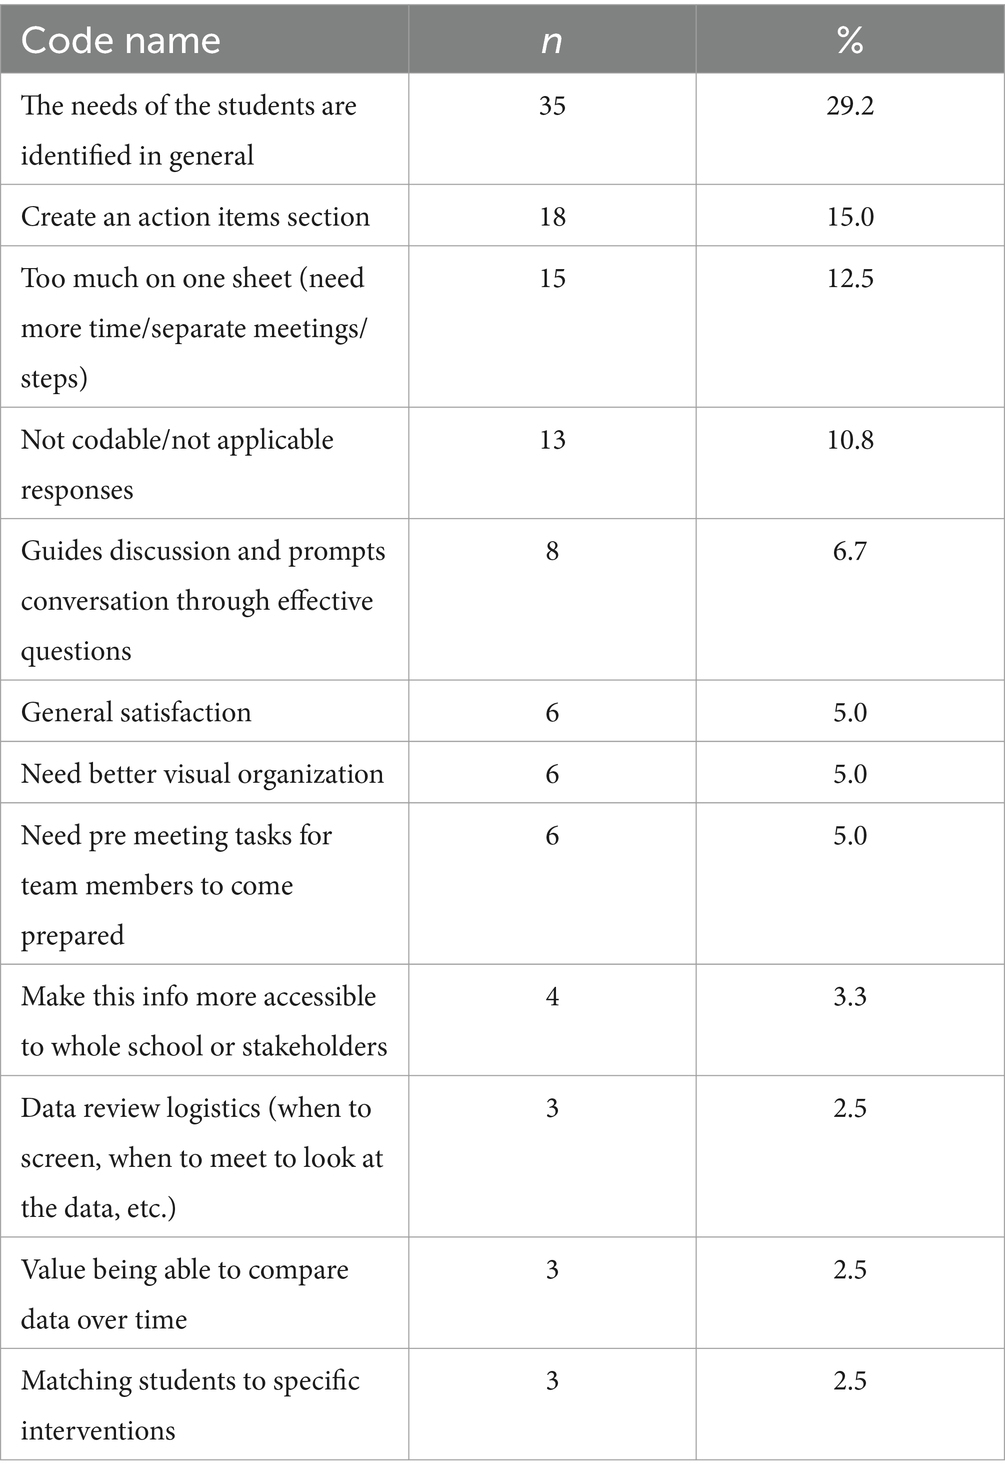
Table 2. Code list and statistics for question 1.
The second most frequently mentioned idea (15.0%) included creating an action items section, next steps, or specific ways to use the screening data. One example of a comment from this section was the statement, “maybe the next step would be knowing what we can do.” The next most frequently noted idea (12.5%) focused on having too much data to adequately review in one meeting. Comments that stated there is not enough time to consider all the SRSS-IE data or there should be multiple meetings to review the data. For example, one participant stated, “You could have separate discussions in separate meetings with separate teams.” Another stated, “I think it’s too overwhelming”.
The remaining codes indicated that the participants found the DG included effective questions that generated valuable conversations and general satisfaction with the DG. Some examples of this are “keep[s] the conversation moving” and “prompt some thoughts.” A few responses, six (5%), indicated that the DG needed better visual organization such as including a graph that displayed grades and attendance for at-risk students. One participant said, “So a graph … would be helpful,” and another shared, “I just made…a little graph by each person. And then I can put the scores in and that would help organize my information”.
A few responses (5%) highlighted the need for tasks to be done before the meeting. One educator noted the following, “So, I think the form could be set up that way to say do this first [before the meeting] you know” and “And maybe that [listing high risk internalizing and externalizing students] does not have to be done in the meeting.” Four (3.3%) responses noted that the information from the screening needed to be accessible to the whole school. These comments indicated a desire to create a way for other educators to easily review or use the data. For example, one participant said, “I agree with sharing the so the whole school has engagement”.
Three categories had fewer than four coded ideas each. These comments in these categories included ideas about when to screen, review the data, the importance of comparing data over time, and matching students to specific interventions. Finally, only 13 ideas (10.8%) were coded as “Not Codable” because topics other than the Discussion Guide were addressed.
Discussion guide contributions
There were 44 codable responses to the second interview question, “How does the DG contribute to efficiently reviewing schoolwide data?” Refer to Table 3 for a complete list of codes and numerical information pertaining to each code. The inter-rater reliability for question two was 95%. The most common response (38.6%, n = 17) to this question focused on the DG being efficient and helping the team to be focused and have clear direction for the discussion. Participants noted how efficiency, conversation, or flow were positively impacted by the DG. “I think it’s always more efficient if you have an outlined agenda and have some questions” is one example of a statement that fits into this category. Another is, “It really helped – helped us look at the data”.
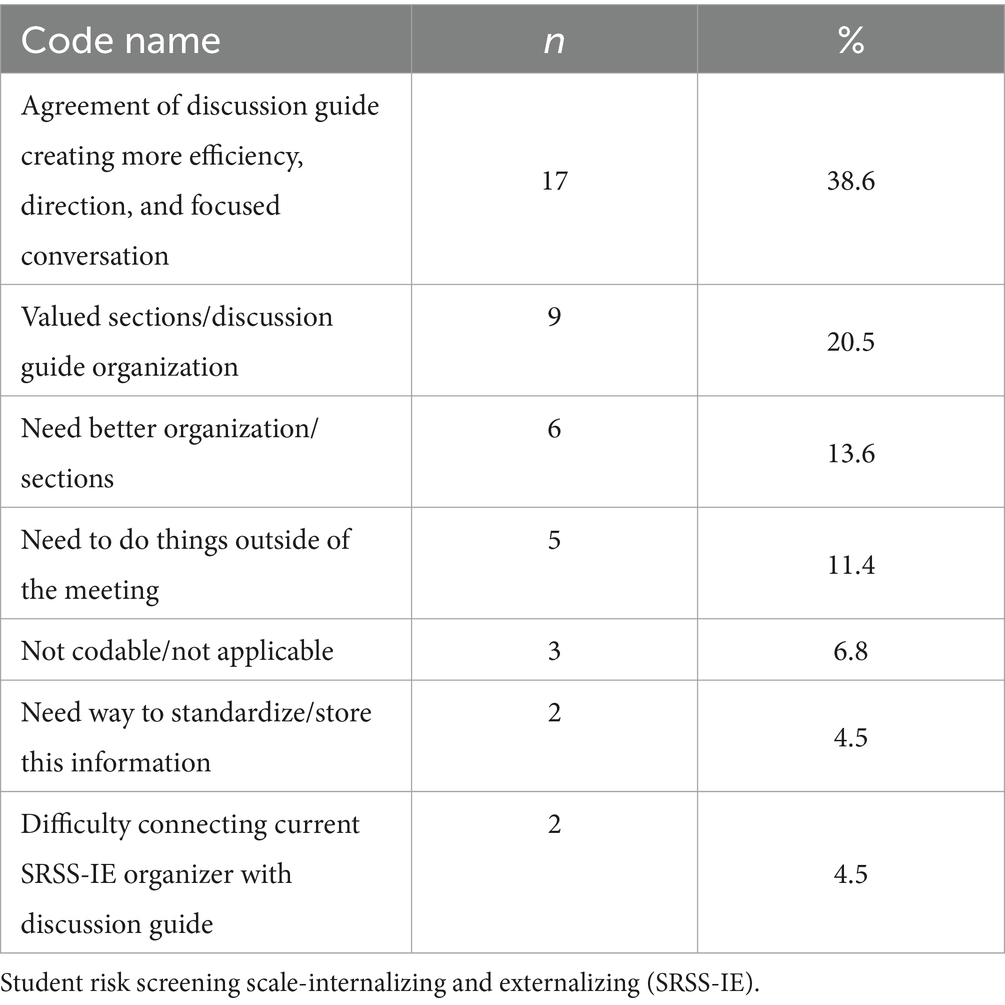
Table 3. Code list and statistics for question 2.
The next most common coding category included nine (20.5%) responses that focused on specific aspects of the DG. “And it starts pretty broad then it makes you drill in [sic] so I really liked that.” A total of six (13.6%) responses targeted organizational weaknesses in the Discussion Guide. One participant noted, “if the form was a little more in step one, step two.” Another example, “there needs to be more of a process” is a general call for explicitly stating the organization of the DG. Other comments highlighted the need to prepare for the meeting by doing “leg work” before the meeting. One participant claimed, “this meeting here would have been half the time had we done leg work ahead of time” and another stated, “that step one is the pre meeting work done by the data analyst”.
Recommended changes to the discussion guide
Responses to question three, “What would teams add to the list of questions and what would they eliminate?” resulted in 64 codable ideas. Refer to Table 4 for a complete list of codes and numerical information pertaining to each code. The inter-rater reliability for question three was 91%. Ten (15.6%) of the ideas for this question emphasized that there was too much to do at one meeting. Responses in this category conveyed feelings of being overwhelmed, not having enough time to complete the tasks at hand or needing separate or additional meetings or steps. “I’m like, not only is that a little redundant, but…for me that’s overwhelming.” Another example of a comment that matches this code is, “I do not know if this was intended to be as a – as one meeting. But I can see how this could potentially – we could spend hours on this.”
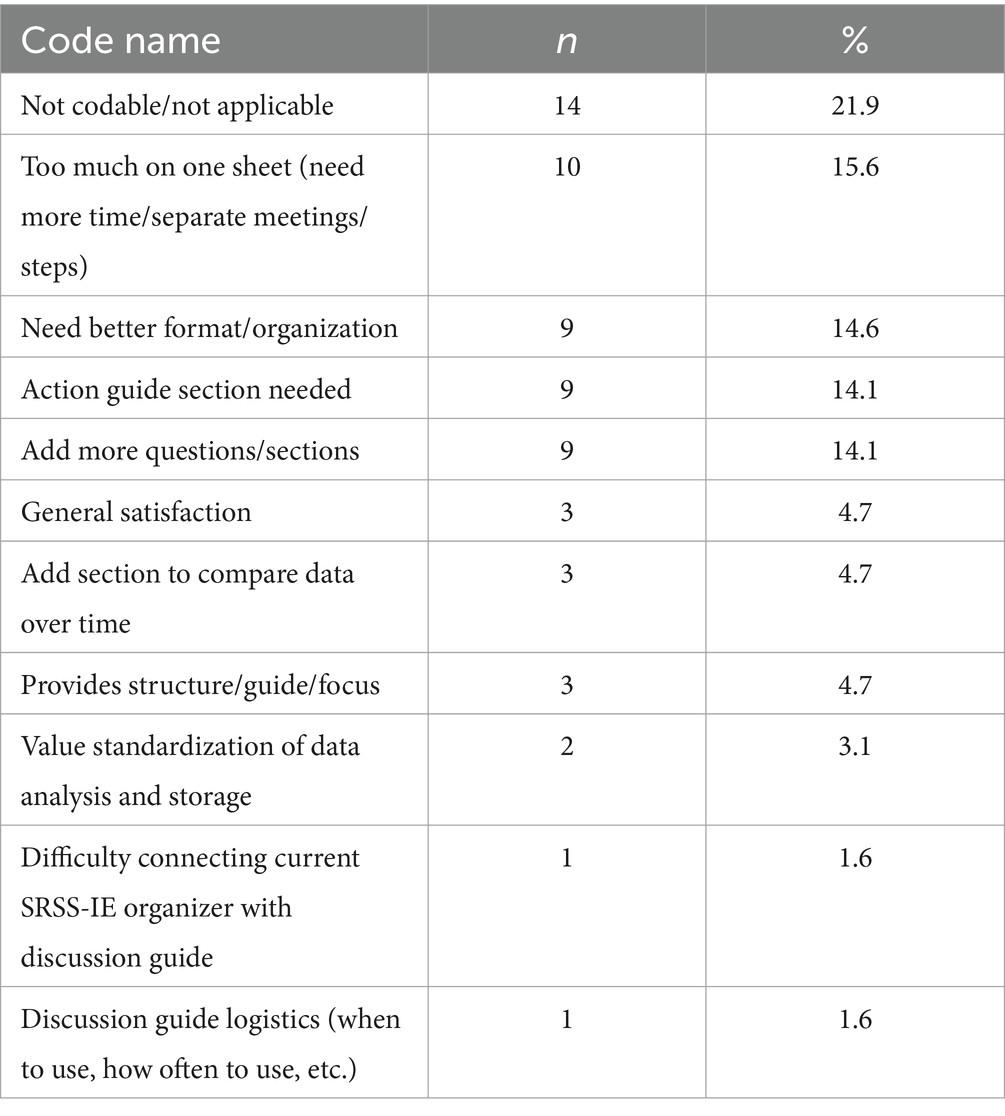
Table 4. Code list and statistics for question 3.
A total of 14.6% (n = 9) of the codable ideas again referred to developing and including a section to for developing action items. Respondents shared the following, “I think an action step question. Or step or whatever. Like what to do next.” They also said, “we can identify the needs but how do we address them.” Similar ideas were expressed and coded in a different category and expressed a need for knowing what supports a student is currently receiving. For example, “I wonder if it might be helpful to have a section to say what that student is receiving” conveys this. Additionally, “it could be checked off – are they on a 504?”
Similarly, nine (14.6%) of the responses suggested changes in format and organization. This does not include ideas expressing a need for additional sections, but rather improved organization and formatting. One participant shared, “the other thing is we had no room to write our comments next to the questions so a space to be able to make notes and comments.” Six of the categories developed for this section had less than four ideas in each of them. A few comments suggested a way to compare data over time. Other participants noted the challenges of the using the DG with their current data management system. Other comments addressed the standardization of data analysis and storage, while the other statements discussed logistics for using the DG (e.g., how often the team should meet to review SRSS-IE data).
Discussion
The extant literature emphasizes the importance of effective SEB screening when MTSS is successfully implemented (Young et al., 2011; McIntosh and Goodman, 2016; Romer et al., 2020), with some guidance for analyzing and summarizing screening data (see Lane et al., 2013b; Verlenden et al., 2021) and supporting teams as they direct resources and support colleagues during the implementation of evidence-based strategies (Kittelman et al., 2021). The purpose of this project was to bridge that gap to increase our understanding of what MTSS school teams need when they are analyzing and summarizing their screening data. Specifically, this study provided insights about the reflections and needs of professionals as they worked to make meaning of their screening data and develop supports and strategies based on that data. We gained insights into the effectiveness of the DG, pinpointing aspects that needing strengthened and aligning our findings with effective MTSS implementation.
Discussion guide strengths
The participants emphasized the importance of having a structure and focus for reviewing their data. The DG provided a step-by-step strategy for reviewing data, encouraging teams to effectively move through the data analysis process. Participants commented on the specific way the DG led teams through the data, starting with schoolwide data or Tier 1 needs (e.g., overall percentages of students scoring in the high-risk range of the SRSS-IE), and then narrowing the focus to students needing Tier 2 or Tier 3 supports. The comment from a participant about how the questions, “keep[s] the conversation moving,” communicates that teams valued having an explicit plan for reviewing data.
The participants did not identify questions that were not helpful or confusing. The participants seemed to find the questions easy to understand and recognized that the answers could enhance their understanding of students’ needs. This ideally guides teams in making data-based decisions about specific strategies and supports that align with the needs of their students. The team members also reported that the structured series of questions prompted conversations and exploring new insights about students’ needs. The DG questions specifically asked about Tier 1 needs first, so teams would consider the possibility that if more than 20% of students needed supports, than practices need to be solidified for all students (McIntosh and Goodman, 2016). Participants did not express any dissatisfaction with the initial focus on schoolwide data or Tier 1 strategies.
Proposed changes for discussion guide
McIntosh et al. (2013, 2015) emphasized the crucial practice of teams utilizing data; nevertheless, these participants stressed the challenges of translating screening information into practices and initiatives. Participants shared the need for the data to be organized, charted, or graphed before the meeting to increase the efficient use of meeting time. Similarly, some participants indicated that integrating other data (e.g., office discipline referrals, academic screening data) would be helpful, especially if the other data were gathered, summarized, and graphed before the meeting. Ensuring that the school’s data management system or platform aligns with the DG was also mentioned. Data-based decision making is a key element of sustained MTSS implementation (Lane et al., 2013b), and participants in this study acknowledged the importance of integrating data from a variety of sources to ensure a comprehensive understanding of students’ needs was available as they developed supports across the tiers.
One of the most important recommended changes was the need for a list of interventions and supports that matched students’ needs. Participants seemed to be asking for clearly defined decision rules and standard protocol instructional strategies. Participants’ responses may have been suggesting a need for more team members with expertise in working with students with SEB needs and familiarity with evidence-based supports across the tiers. These educators seemed to be asking for more expertise or guidance on how to act on their data. It’s also plausible that team members possessed the necessary expertise, but the challenge lay in accessing that expertise while simultaneously summarizing the data. As teams consider or explore strategies, they can also consider if their faculty have the capacity to effectively implement the instruction across tiers.
An implication of knowing what the next steps can be, is also knowing how to share the data with vested partners in the school community. When participants talked about sharing the data with others (e.g., teachers, caregivers, school-based support personnel, and community partners) their comments may be implying that collaboration was valued and expected as they strived to address students’ needs. These comments may reflect the richness or scarcity of resources in their communities.
Another area for improvement discussed throughout the focus groups addressed the immensity of the task of reviewing screening data. Participants expressed feelings of being overwhelmed by the amount of work and time needed to really understand the data and then create next steps (e.g., “we could spend hours on this”). Breaking the DG into parts to discuss during a series of meetings rather than in one long meeting was an important and consistent insight of the participants. For example, one team recommended having a clear separation between the interpretation and analysis of schoolwide and individual student data. The feelings of being overwhelmed may reflect the cumbersome nature the data systems already in place.
Implications for practice
When teams engage in a screening process as part of an MTSS framework, they may initially consider the cost of the instrument and the time needed to administer the measure. However, as teams move to analyzing and using their data to make instructional decisions, they may not realize the time intensive nature of integrating other data, summarizing, analyzing, and then using the data to develop and implement student supports. These participants indicated that reviewing and using their data required more time than they anticipated. Collecting the screening data is only one of many steps in implementing an effective and impactful screening that is key to MTSS implementation. School teams that are implementing a screening process, could use the Hexagon Tool (Metz and Louison, 2019), which provides a series of questions to help teams consider feasibility and fit factors of related to implementing a screening process.
These participants emphasized the need for a list of practices that align with their students’ needs and informed by their data. A technical guide developed by the National Technical Assistance Center of Positive Behavior Interventions and Supports (2017) for aligning initiatives and programs could be especially helpful in reviewing what programs are already available in a school, what programs may have overlapping emphases, or be boutique programs developed by a champion of that specific initiative. Completing the forms in this technical guide, could provide a structure that systematically identifies current and needed initiatives and supports.
The participant who stated, “we could spend hours on this,” may have been expressing the challenges of efficiently reviewing their data. The process may be cumbersome, especially if reviewing screening data is a new skill. If teams begin using the DG and the process continues to require a great deal of time, team leaders may explore the need for professional learning, coaching, and repeated practice to become fluent in making sense of data and aligning instructional strategies with their data. Teams may want to adapt the DG to include decision rules and standard protocols to increase the efficiency of the process. For instance, a typical decision rule entails solidifying instruction for all students if more than 20% are grappling with internalizing concerns.
The researchers revised the original DG (found in Appendix A) after analyzing the focus group data. The revised Discussion Guide (found in Appendix B) provides directions for three separate meetings, with a section to be completed before the team gathers. A new chart was added to the second meeting for better visualization of critical information gathered for high-risk students. Finally, the third meeting includes a section to identify actions that support their student body (Tier 1), small groups of students (Tier 2), and individual students (Tier 3).
When using the revised DG, team leaders are encouraged to have the data available for team members before the meeting and to plan for at least two to three meetings to thoroughly analyze the data and plan for developing student supports across the tiers. Several tasks (e.g., creating graphs or charts) are best completed before each meeting to increase meeting efficiency. Deciding who will complete these pre-meeting tasks also contributes to effective use of team members’ time.
As teams establish routines for using the DG, they are encouraged to determine what other data points will be helpful to have to better understand individual students as well as group trends. Additional data points could include but are not limited to office discipline referrals, suspensions, attendance, academic screening scores, and grades. The data available may vary by school or grade. Triangulating data, at least for students scoring in the high-risk range, is likely to help teams develop instructional strategies based on a thorough understanding of students’ complex needs. Similarly, teams are encouraged to consider how decision rules and standard protocol responses to the data would increase the efficiency of service delivery so that instruction and supports are delivered in a timely, responsive manner to students.
Limitations and implications for future research
One limitation of following a strict content analysis design is that all language is considered at face value. Each statement that a participant makes is understood and analyzed by the researcher as if the participant meant exactly what they articulated. Additionally, conducting a content analysis in a focus group also limits how many times an idea is counted. If one participant shares an idea that many other participants agree with, it is unlikely that other participants will repeat that idea, possibly limiting the depth or breadth of the participants’ ideas. Additionally, because one of the researchers helped to develop the DG was also the discussion group leader, the participants may have been hesitant to share critical comments about the DG.
While the problem-solving model (Ervin et al., 2009) has been adapted in a variety of ways (see National Association of School Psychologists, 2016; National Center on Intensive Intervention, 2024; The Iris Center, 2024b), additional refinements of the problem-solving model may be needed when considering both group and individual data. Future research could consider the benefits or drawbacks of reviewing group data before considering individual data. How teams review and use screening data may depend on the data literacy expertise of team members. Depending on the characteristics of the school student body, additional DG questions may be needed and considered in future research.
The researchers did not ask questions during the focus groups about other strategies or guides the teams may have used and the results of this study do not provide a comparison to other strategies or guides that may be useful. In fact, many teams shared with the researcher that they had never gathered in a group setting to review screening data, and familiarity with the questions and process may influence perspectives about the usefulness of the DG. Future research could consider how the DG works for elementary teams compared to teams in secondary schools. Additionally, the effective use of the discussion guide may vary depending geographic characteristics: urban schools may have different needs than rural schools. Additionally, it is important to consider the interview questions may have been perceived as leading questions that influenced responses. For example, the second interview question assumes that the DG did contribute to efficiently reviewing schoolwide data.
Future research could replicate this study using the revised DG. The DG could be further refined by seeking a panel of experts to make recommendations for improvement. Using an expert panel of academics and practitioners to review the DG may be effective at increasing content validity and is an important step in the instrument development process (Davis, 1992). Additional research could also focus on individual interviews with school principals, support personnel (e.g., school psychologists, school counselors, coaches), teachers, and other team members to gather their perceptions about the effectiveness of the updated DG. Longitudinal case studies could provide insights about how the DG may or may not contribute to sustained implementation of a screening process.
Conclusion
Despite the limitations, the school teams who participated in this research study expressed appreciation for the DG in their data-review meeting. They noted how the DG guided the discussion, prompted other questions and discussion topics, and provided structure to an often overwhelming task. The participants frequently shared that the process of thoroughly reviewing their data took much longer than they expected, and having the data analyzed and graphed before the meeting would have been especially helpful. Having a predetermined set of action items or interventions seemed especially important. Finally, one of the key findings of this study addresses the importance of planning beyond just data collection and considering the resources (e.g., time available for meetings) and skills (e.g., charting and triangulating data) needed to actually use the screening data to make instructional decisions.
Data availability statement
The original contributions presented in the study are included in the article. Further inquiries can be directed to the corresponding author.
Ethics statement
The studies involving humans were approved by Brigham Young University Institutional Review Board. The studies were conducted in accordance with the local legislation and institutional requirements. The participants provided their written informed consent to participate in this study.
Author contributions
JG: Data curation, Formal analysis, Investigation, Project administration, Writing – original draft, Writing – review & editing. EY: Conceptualization, Data curation, Formal analysis, Methodology, Project administration, Supervision, Writing – review & editing.
Funding
The author(s) declare that no financial support was received for the research, authorship, and/or publication of this article.
Conflict of interest
The authors declare that the research was conducted in the absence of any commercial or financial relationships that could be construed as a potential conflict of interest.
Publisher’s note
All claims expressed in this article are solely those of the authors and do not necessarily represent those of their affiliated organizations, or those of the publisher, the editors and the reviewers. Any product that may be evaluated in this article, or claim that may be made by its manufacturer, is not guaranteed or endorsed by the publisher.
Supplementary material
The Supplementary material for this article can be found online at: https://www.frontiersin.org/articles/10.3389/feduc.2024.1306385/full#supplementary-material
References
Brantlinger, E., Jimenez, R., Klingner, J., Pugach, M., and Richardson, V. (2005). Qualitative studies in special education. Except. Child. 71, 195–207. doi: 10.1177/001440290507100205
Bundock, K., Hawken, L. S., Kladis, K., and Breen, K. (2020). Innovating the check-in, check-out intervention: a process for creating adaptations. Interv. Sch. Clin. 55, 169–177. doi: 10.1177/1053451219842206
Centers for Disease Control and Prevention (CDCP). (2023). Improving Access to Children’s Mental Health Care. Available at: https://www.cdc.gov/childrensmentalhealth/access.html#print
Davis, L. L. (1992). Instrument review: getting the most from a panel of experts. Appl. Nurs. Res. 5, 194–197. doi: 10.1016/s0897-1897(05)80008-4
Duong, M. T., Bruns, E. J., Lee, K., Cox, S., Coifman, J., Mayworm, A., et al. (2021). Rates of mental health service utilization by children and adolescents in schools and other common service settings: a systematic review and meta-analysis. Adm. Policy Ment. Health Ment. Health Serv. Res. 48, 420–439. doi: 10.1007/s10488-020-01080-9
Durlak, J. A., Weissberg, R. P., Dymnicki, A. B., Taylor, R. D., and Schellinger, K. B. (2011). The impact of enhancing students’ social and emotional learning: a meta-analysis of school-based universal interventions. Child Dev. 82, 405–432. doi: 10.1111/j.1467-8624.2010.01564.x
Ervin, R. A., Peacock, G. G., and Merrell, K. W. (2009). “The school psychologist as a problem solver in the 21st century” in Practical handbook of school psychology: effective practices for the 21st century. eds. G. G. Peacock, R. A. Ervin, E. J. Daly III, and K. W. Merrell (New York, NY, USA: The Guildford Press), 3–115.
Global Scholar (2011). 2011 response to intervention report by global scholar, NASDSE, CASE and AASA Uncovers Latest Trends in RTI Adoption Among US School Districts. Available at: https://www.prnewswire.com/news-releases/2011-response-to-intervention-report-by-globalscholar-nasdse-case-and-aasa-uncovers-latest-trends-in-rti-adoption-among-us-school-districts-128001008.html
Greenberg, M. T. (2023). Evidence for social and emotional learning in schools Learning Policy Institute. Available at: https://learningpolicyinstitute.org/media/3978/download?inline&file=Evidence_for_SEL_BRIEF.pdf
Kittelman, A., Goodman, S., and Rowe, D. A. (2021). Effective teaming to implement evidence-based practices. Teach. Except. Child. 53, 264–267. doi: 10.1177/0040059921993020
Krueger, R. A., and Casey, M. A. (2014). Focus groups: a practical guide for applied research. Los Angeles, CA, USA: Sage publications.
Lane, K. L., Buckman, M. M., Common, E. A., Oakes, W. P., Lane, N. A., Schatschneider, C., et al. (2021). The student risk screening scale for early childhood: additional validation studies. Top. Early Child. Spec. Educ. 41, 129–146. doi: 10.1177/0271121420922299
Lane, K. L., Menzies, H. M., Oakes, W. P., Lambert, W., Cox, M. L., and Hankins, K. (2012a). A validation of the student risk screening scale for internalizing and externalizing behaviors: patterns in rural and urban elementary schools. Behav. Disord. 37, 244–270. doi: 10.1177/019874291203700405
Lane, K. L., Oakes, W. P., Carter, E. W., Lambert, W. E., and Jenkins, A. B. (2013a). Initial evidence for the reliability and validity of the student risk screening scale for internalizing and externalizing behaviors at the middle school level. Assess. Eff. Interv. 39, 24–38. doi: 10.1177/1534508413489336
Lane, K. L., Oakes, W. P., Harris, P. J., Menzies, H. M., Cox, M., and Lambert, W. (2012b). Initial evidence for the reliability and validity of the student risk screening scale for internalizing and externalizing behaviors at the elementary level. Behav. Disord. 37, 99–122. doi: 10.1177/019874291203700204
Lane, K. L., Oakes, W. P., Menzies, H. M., Oyer, J., and Jenkins, A. (2013b). Working within the context of three-tiered models of prevention: using schoolwide data to identify high school students for targeted supports. J. Appl. Sch. Psychol. 29, 203–229. doi: 10.1080/15377903.2013.778773
Lane, K. L., Oakes, W. P., Monahan, K., Smith, A., Lane, K. S., Buckman, M. M., et al. (2023). A comparison of DESSA-mini and SRSS-IE screening tools. Educ. Treat. Child. 46, 367–381. doi: 10.1007/s43494-023-00106-9
Marx, T. A., and Goodman, S. (2019). “Teaming structures to support intensive intervention using data-based individualization” in Essentials of intensive intervention. eds. R. Z. Edmonds, A. G. Gandhi, and L. Danielson (New York, NY, USA: Guilford Press), 114–135.
McIntosh, K., and Goodman, S. (2016). Integrated multi-tiered systems of support: blending RTI and PBIS. New York, NY, USA: Guilford Publications.
McIntosh, K., Kim, J., Mercer, S. H., Strickland-Cohen, M. K., and Horner, R. H. (2015). Variables associated with enhanced sustainability of school-wide positive behavioral interventions and supports. Assess. Eff. Interv. 40, 184–191. doi: 10.1177/1534508414556503
McIntosh, K., Mercer, S. H., Hume, A. E., Frank, J. L., Turri, M. G., and Mathews, S. (2013). Factors related to sustained implementation of schoolwide positive behavior support. Except. Child. 79, 293–311.
McIntosh, K., Mercer, S. H., Nese, R. N., Strickland-Cohen, M. K., Kittelman, A., Hoselton, R., et al. (2018). Factors predicting sustained implementation of a universal behavior support framework. Educ. Res. 47, 307–316. doi: 10.3102/0013189x18776975
Merikangas, K. R., He, J. P., Burstein, M., Swanson, S. A., Avenevoli, S., Cui, L., et al. (2010). Lifetime prevalence of mental disorders in US adolescents: results from the national comorbidity survey replication-adolescent supplement (NCS-A). J. Am. Acad. Child Adolesc. Psychiatry 49, 980–989. doi: 10.1016/j.jaac.2010.05.017
Merrell, K. W., Ervin, R. A., Gimpel Peacock, G., and Renshaw, T. L. (2022). School psychology for the 21st century: foundations and practices. Third Edn. New York, NY, USA: The Guilford Press.
Metz, A., and Louison, L. (2019) The hexagon tool: exploring context. Chapel Hill, NC: National Implementation Research Network, Frank porter Graham child development institute, University of North Carolina at Chapel Hill. Based on Kiser, Zabel, Zachik, & Smith (2007) and Blase, Kiser & van Dyke (2013). Available at: https://nirn.fpg.unc.edu/sites/nirn.fpg.unc.edu/files/imce/documents/NIRN%20Hexagon%20Discussion%20Analysis%20Tool%20v2.2.pdf
Moulton, S. E., and Young, E. L. (2021). An item analysis of gender differences on the SRSS-IE in middle school. Psychol. Sch. 58, 789–803. doi: 10.1002/pits.22470
National Association of School Psychologists. (2016). Integrated model of academic and behavioral supports [position statement]. Available at: https://www.nasponline.org/research-and-policy/policy-priorities/position-statements
National Center on Intensive Intervention. (2024). Data-based individualization: a framework for intensive intervention. Available at: https://intensiveintervention.org/resource/data-based-individualization-framework-intensive-intervention
National Technical Assistance Center of Positive Behavior Interventions and Supports (2017). Technical guide for alignment of initiatives, Programs and Practices in School Districts. Center on Positive Behavioral Interventions and Supports. Available at: https://www.pbis.org/resource/technical-guide-for-alignment-of-initiatives-programs-and-practices-in-school-districts
Onwuegbuzie, A. J., Dickinson, W. B., Leech, N. L., and Zoran, A. G. (2009). A qualitative framework for collecting and analyzing data in focus group research. Int J Qual Methods 8, 1–21. doi: 10.1177/160940690900800301
Panchal, U., Salazar de Pablo, G., Franco, M., Morena, C., Parellada, M., Arango, C., et al. (2021). The impact of COVID-19 lockdown on child and adolescent mental health: systematic review. Eur. Child Adolesc. Psychiatry 32, 1151–1177. doi: 10.1007/s00787-021-01856-w
Renshaw, T. L. (2019). Screening using the SDQ total difficulties scale: an analog test of three cutoff values. J. Psychoeduc. Assess. 37, 1030–1036. doi: 10.1177/0734282918809808
Romer, N., von der Embse, N., Eklund, K., Kilgus, S., Perales, K., Splett, J. W., et al., (2020). Best practices in social, emotional, and behavioral screening: an implementation guide. School mental health collaborative. Available at: https://smhcollaborative.org/wp-content/uploads/2019/11/universalscreening.pdf
Taylor, R. D., Oberle, E., Durlak, J. A., and Weissberg, R. P. (2017). Promoting positive youth development through school-based social and emotional learning interventions: a meta-analysis of follow-up effects. Child Dev. 88, 1156–1171. doi: 10.1111/cdev.12864
The IRIS Center. (2024a). RTI (part 3): reading instruction. Available at: https://iris.peabody.vanderbilt.edu/module/rti03-reading/
The IRIS Center. (2024b). RTI (part 1): an overview. Available at: https://iris.peabody.vanderbilt.edu/module/rti01/#content
Verlenden, J., Naser, S., and Brown, J. (2021). Steps in the implementation of universal screening for behavioral and emotional risk to support multi-tiered systems of support: two case studies. J. Appl. Sch. Psychol. 37, 69–107. doi: 10.1080/15377903.2020.1780660
von der Embse, N. P., Kilgus, S. P., Eklund, K., Ake, E., and Levi-Neilsen, S. (2018). Training teachers to facilitate early identification of mental and behavioral health risks. Sch. Psychol. Rev. 47, 372–384. doi: 10.17105/spr-2017-0094.v47-4
Wood, B. J., and Ellis, F. (2022). Universal mental health screening practices in midwestern schools: a window of opportunity for school psychologist leadership and role expansion? Contemp. Sch. Psychol. doi: 10.1007/s40688-022-00430-8
Wood, B. J., and McDaniel, T. (2020). A preliminary investigation of universal mental health screening practices in schools. Child Youth Serv. Rev. 112, 1–5. doi: 10.1016/j.childyouth.2020.104943
Keywords: universal screening, data-based decision making, multi-tiered systems of support, school-based teams, service delivery models, at risk students
Citation: Grubb J and Young EL (2024) Using screening data: Educators’ perceptions of a structured data review. Front. Educ. 9:1306385. doi: 10.3389/feduc.2024.1306385
Edited by:
Wendy Peia Oakes, Arizona State University, United StatesReviewed by:
Paloma Perez, University of Virginia, United StatesCarrie Brandon, Arizona State University, United States
Copyright © 2024 Grubb and Young. This is an open-access article distributed under the terms of the Creative Commons Attribution License (CC BY). The use, distribution or reproduction in other forums is permitted, provided the original author(s) and the copyright owner(s) are credited and that the original publication in this journal is cited, in accordance with accepted academic practice. No use, distribution or reproduction is permitted which does not comply with these terms.
*Correspondence: Ellie L. Young, ZWxsaWVfeW91bmdAYnl1LmVkdQ==