 Emi Kalita1Abdullah Mana Alfarwan2
 Houssam El Aouifi3,4Ashima Kukkar5
 Sadiq Hussain1Tazid Ali1
 Silvia Gaftandzhieva6*
- 1Centre for Computer Science and Applications, Dibrugarh University, Dibrugarh, India
- 2Department of Education and Psychology, Najran University, Najran, Saudi Arabia
- 3FSJES, Ibn Zohr University, Ait Melloul, Morocco
- 4IRF-SIC Laboratory, Faculty of Science, Ibn Zohr University, Agadir, Morocco
- 5Chitkara University Institute of Engineering and Technology, Chitkara University, Rajpura, India
- 6Faculty of Mathematics and Informatics, University of Plovdiv Paisii Hilendarski, Plovdiv, Bulgaria
Introduction: Educational Data Mining (EDM) involves analysing educational data to identify patterns and trends. By uncovering these insights, educators can better understand student learning, optimise teaching methods, and refine curriculum. One of the main tasks in educational data mining is predicting the student’s academic performance because it makes it possible to provide appropriate interventions supporting students’ achievements. Predicting the student’s academic performance also helps to identify at-risk students and explore the possibility of providing intervention techniques.
Methods: In this paper, a deep learning model using a Bi-LSTM network is introduced to predict second term GPA.
Results: The model had an average accuracy of 88.23% and was statistically better than traditional machine learning algorithms such as CatBoost, XGBoost, Hist Gradient Boosting, and LightGBM for accuracy, precision, recall, or F1-score metrics. The results are also analysed with the help of SHAP values for model interpretability to understand feature contributions, making the proposed framework more transparent. The performance of models is also compared using various statistical tests.
Discussion: The results demonstrate that BI-LSTM performance is significantly different from other models. Hence, the proposed model provides a way to prevent student dropouts and improve academic achievements.
1 Introduction
Student academic performance is a key factor when evaluating the outcome of global education systems. Our civilisation depends heavily on education, which is a crucial component. Research in many areas, particularly education, has been impacted by information and communication technology. For instance, the recent COVID-19 pandemic forced many countries to adopt various e-learning platforms (Albreiki et al., 2021). Higher education institutions prioritise student academic achievement as a key indicator of quality education. However, identifying the factors that significantly impact student success early in their academic journey is a complex challenge. Several useful strategies have been employed to address the academic performance issues of the students (Bravo-Agapito et al., 2021; Alamri and Alharbi, 2021; Hamsa et al., 2016). These resources may not be easily implemented everywhere. Also, while technology has improved student performance prediction, further work is necessary to achieve higher accuracy through new data and techniques. Additionally, clustering and classification techniques are presented to identify the impact of students’ performance early on the GPA. Grade Point Average, commonly known as GPA, is the widely used and accepted criterion for determining student academic performance. It is a very significant component of the overall academic evaluation process. However, there is a need to predict GPA initially to easily track and address any student who is most likely to drop out during their academic period. To address this challenge, this study applies modern computational techniques.
Student performance is a major component of the learning process. Predicting student performance is necessary to identify those most likely to experience poor academic accomplishment in the future. The data may be helpful and utilised to make predictions if it has been converted into knowledge. Therefore, the information could help students reach their academic goals and enhance the quality of education and learning. This study, Educational Data Mining (EDM), analyses data from educational backgrounds using data mining techniques (Kaunang and Rotikan, 2018; Yağcı, 2022). EDM application also assists in preparing action plans for enhancing student performance. This will ultimately lead to improved teaching, learning, and the overall student experience within the institution (Ajibade et al., 2022; Nabil et al., 2021). Analysing academic data with machine learning has shown promising results in identifying learning patterns and predicting student performance (Hussain and Khan, 2023). Through the application of ML algorithms, an assessment of student outcomes can be made due to the identification of patterns that exist within the data (Dabhade et al., 2021). While machine learning offers potential for academic data analysis, traditional model-building methods are inadequate. They suffer from issues such as lack of interpretability, vulnerability to overfitting in imbalanced datasets, and difficulty managing feature interdependencies (Alam and Mohanty, 2022). These limitations, in turn, make it difficult for those who apply the models to make important decisions based on the provided information by the models. Deep Learning (DL) has emerged as a promising solution to address the limitations of traditional machine learning models (Rodríguez-Hernández et al., 2021). However, even with DL, handling the complexities and non-linear relationships found in academic datasets remains a significant challenge (Waheed et al., 2020; Lee et al., 2021; Al-Azazi and Ghurab, 2023; Shen, 2024; Sateesh et al., 2023; Manigandan et al., 2024). Moreover, DL’s capability of handling big data will enhance the prediction accuracy of GPA if integrated with workflows of handling imbalanced data and the feature importance workflow, as shown in Figure 1.
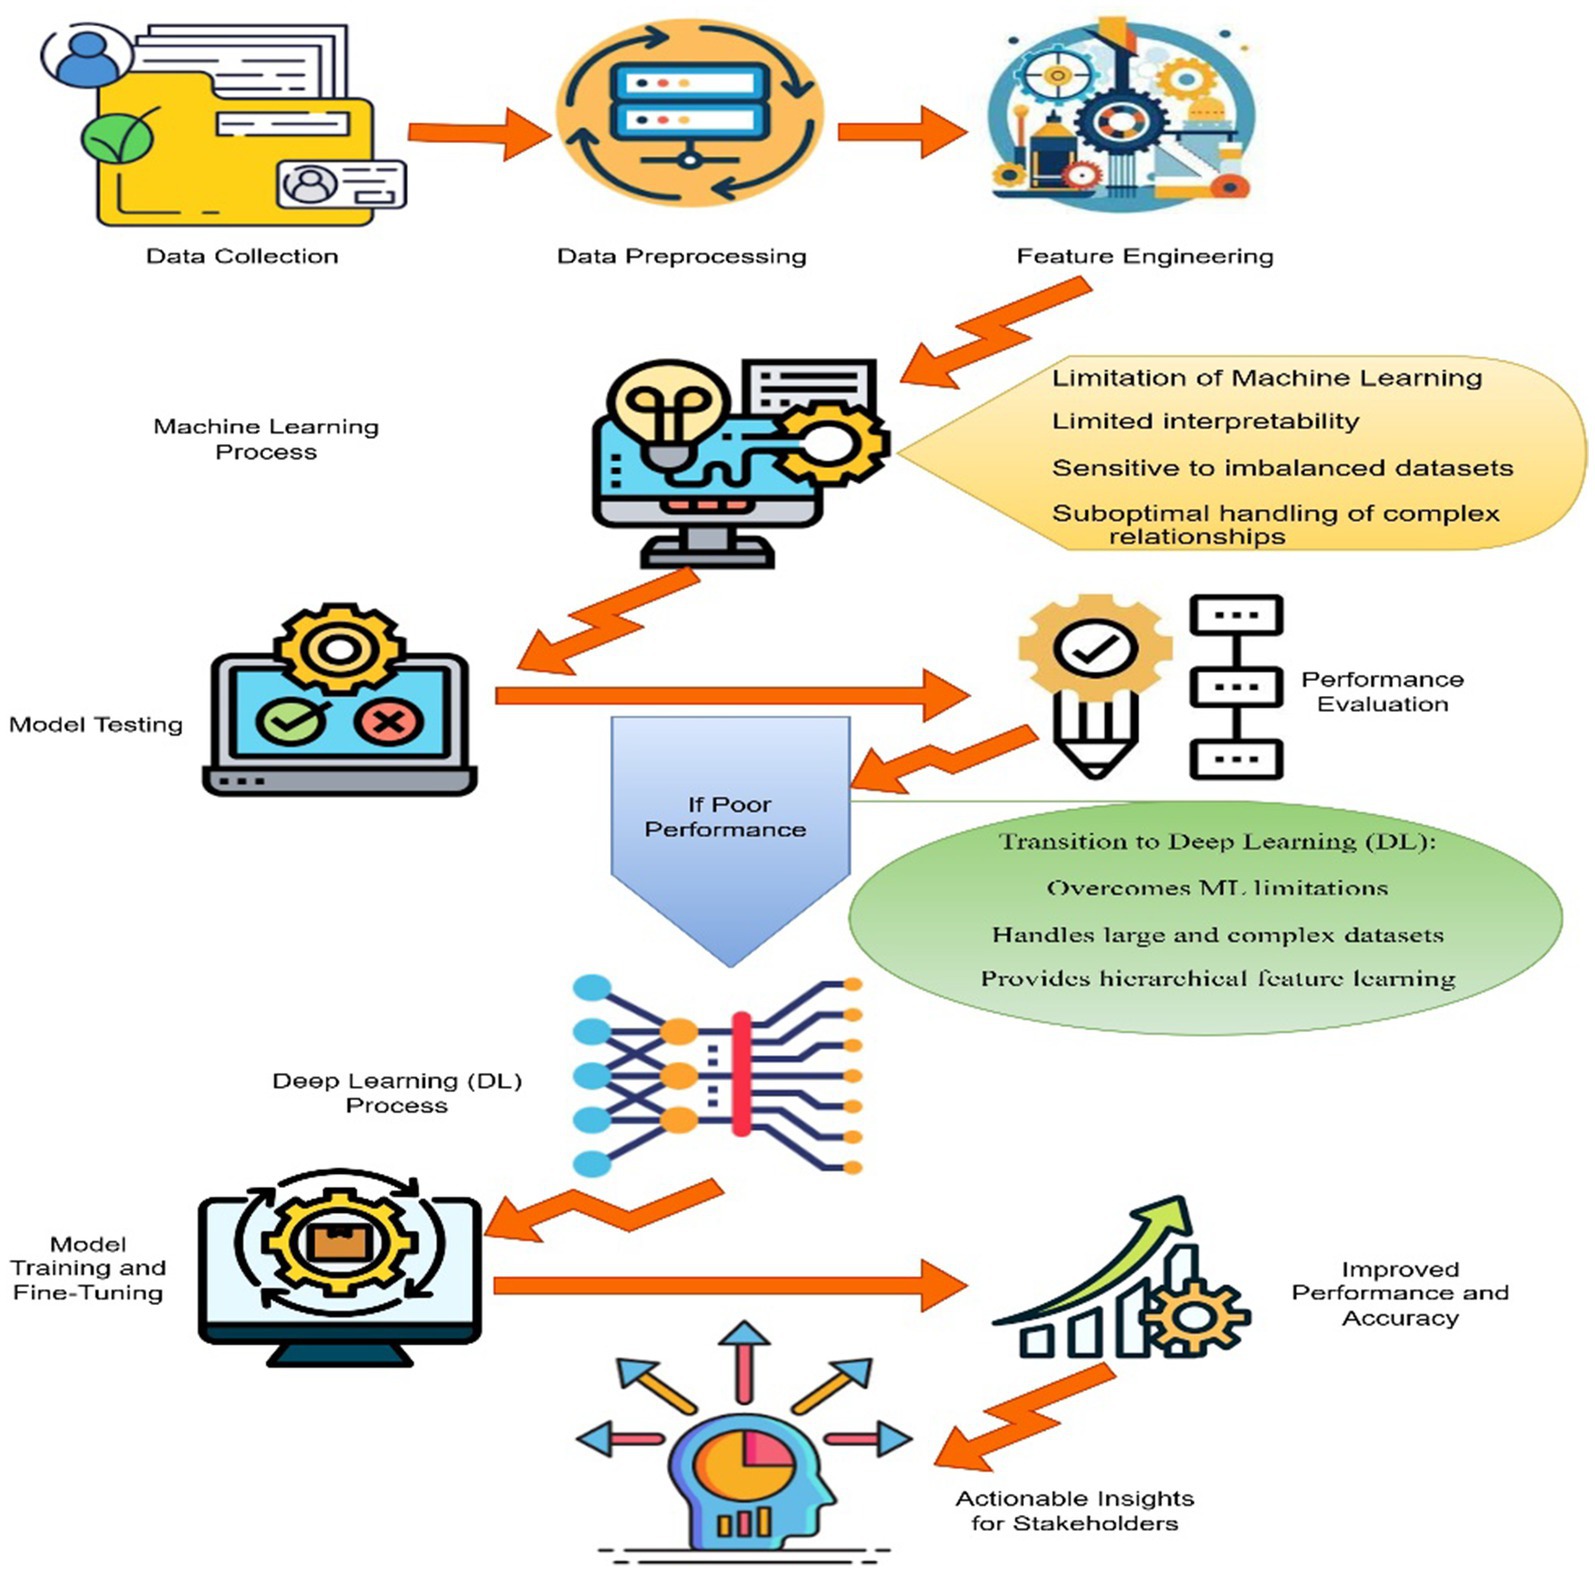
Figure 1. A flowchart of the ML & DL process with the constraints and transition stages.
Academic achievement is significant since it is closely related to the favourable results that we appreciate. Students’ academic achievement in college or university is one of the aspects that contribute to academic success. Every college or university’s performance is still determined by the total academic achievement of its students. To enhance our analysis and prediction of academic achievement, we can incorporate variables like aptitude test results, high school GPAs, and the student’s graduating high school. We think that a student’s success during their first year of college can be used as a predictor of how well they will perform during the remaining years of their education. These elements enable students to receive early feedback and take steps to enhance their performance. The main purpose of this study is to achieve early classification of at-risk students and the prediction of their GPA to allow timely intervention by educators and other policymakers. That is why recognising potential dropouts can help an institution improve dropout and retention rates. The three key objectives of this research are:
• To predict the at-risk students using classification so that the teachers and policymakers can stop the possible dropout of these students.
• To find the best classifiers among different classifiers to predict the at-risk students that may be applied to similar datasets of other Universities.
• To utilise SHAP (Shapley Additive exPlanations) to interpret the results, providing stakeholders with insights into the key features influencing predictions and reinforcing the principles of Explainable AI (XAI).
• To compute the performance of the best classifier with others, a statistical analysis such as the mean, median, standard deviation, t-test–test, bootstrap confidence levels, Friedman test, Effect Sizes (Cohen’s d) and Tukey’s HSD Test are employed on the four performance metrics.
This study aims to improve predictive accuracy while providing comprehensible and practical recommendations to educational stakeholders using deep learning methodologies and interpretability tools like SHAP. The proposed framework offers a reference model for early GPA prediction, contributing to better academic outcomes and fewer student dropouts.
The rest of the paper is organised as follows. Section 2 describes the related works, while Section 3 depicts the methodology section. Results and discussions were described in Section 4, and Section 5 is the conclusion.
2 Related work
The growth and development of a country depend on the achievements of students in school. Therefore, various researchers work to develop diverse methods for the early prediction of student’s academic performance.
Sarker et al. (2024) conducted a study by applying the EDM method to investigate student achievement in higher secondary education in Bangladesh. The research focused on categorising students into good, average, and poorly performing groups. It evaluated their academic performance through four key aspects: assessment of probable outcomes, comparison of subject-wise performance analysis, performance trends, and internal examination pattern parameters. Therefore, a two-year dataset of humanities students was used, and five machine learning algorithms were used for analysis, such as Naive Bayes (NB), Decision Tree (DT), Random Forest (RF), Neural Network (NN), and Nearest Neighbour. The study demonstrated a clear correlation between students’ performance during the term and their final grades, and it also identified specific subjects that significantly contribute to high academic achievement. Such a concept can help college administrations with intervention strategies that can be used to help low achievers while motivating high achievers.
Kukkar et al. (2023) proposed a new Student Academic Performance Predicting (SAPP) system to enhance the prediction accuracy and solve performance prediction issues. The proposed system combined 4-layer stacked LSTM with RF and Gradient Boosting (GB) algorithms. The system performance was evaluated using Accuracy, Precision, F-measure and Recall parameters on a newly created emotional dataset with an OULAD dataset. The accuracy of the proposed SAPP system was around 96%, which is higher than ANN, RNN, CNN, SVM, DT, and NB. These results supported its accuracy over other approaches employed in student prediction performance.
Mahawar and Rattan (2025) developed a performance prediction model using ML models involving demographic, social, psychological, and economic indicators. An online survey was performed, and a dataset of pre-year undergraduate students was considered for analysis using eight different ML classifiers, namely, Logistic Regression (LR), RF, Support Vector Machine (SVM), and XGB. The proposed system also included nine feature selection techniques, including variance threshold and recursive feature elimination. The ensemble DXK (DT + XGB + KNN) model achieved 97.83% accuracy with 80:20 data proportions, showing better results than traditional classifiers. Furthermore, the ACO-DT Model achieved a 98.15% accuracy rate and was higher than all the models used. The authors highlighted that more research should enhance the performance of more accurate and faster predictions.
Another analysis was done by Liang et al. (2024) using five machine learning models to predict academic performance in an engineering mechanics course with inputs as online learning behaviours and comprehensive performance and outputs as final exam scores (FESs). The best performance was achieved by GB Regression (GBR) with RMSE (9.3595) and a correlation coefficient of (0.7558). Thus, they found that the Intellectual Education Score (IES) was the most important performance indicator affecting the change in the scores. Live viewing rate (LVR), replay viewing rate (RVR), and number of completed assignments (NOCA) were critical for FESs. They presented practical information for educators who could incorporate or modify particular practices to help a student at risk.
Huang and Zeng (2024) developed a novel academic performance prediction model leveraging dual graph NN to utilise both interaction-based structural information and attribute feature spaces of students. The model included a local academic performance representation module obtained from online interaction activities and a global representation module constructed from attribute features with the help of dynamic graph convolution. These various data representations are integrated with a learning module that analyses information from individual and overall perspectives to predict performance on a test. The experiment outcome showed that performance was improved with 83.96% accuracy for pass/fail prediction and 90.18% for pass/withdraw prediction in a public dataset. Additionally, ablation studies were performed to validate these improvements and to showcase that the proposed model outperformed the other approaches.
Hussain et al. (2024) implemented an innovative deep learning approach that uses the Levenberg Marquardt Algorithm (MLA), which solves problems like insufficient attributes and model complexity in the current approach. The input data included the assignments, class tests, midterm scores, and attendance. This data is fed through the NN via four input variables, three hidden layers and an output layer. The proposed model obtained an accuracy of 88.6%, more accurate than previous approaches. The study achieved its goal of predicting final grades, which proved beneficial for students, teachers, and educational leaders by providing actionable information.
Kukkar et al. (2024) developed a system that analysed the sequences and long-dependent structures of OULAD and self-derived emotional data using RNN and LSTM networks. Integrating RF, SVM, NB, and DT with RNN and LSTM improves the method’s predictive capability. The proposed model with the RNN + LSTM + RF model achieved a high accuracy of 97% as compared to the other models: RNN + LSTM + SVM with 90.67%, RNN + LSTM + NB with 86.45% and RNN + LSTM + DT with 84.42%. This method effectively modelled the intricate time-dependent relationships within the data and outperformed all other tested configurations.
Demographic and personality features are combined by Shaninah and Mohd Noor (2024) to develop a SAP prediction model. They collected the dataset from 305 students studying at Al-Zintan University, Libya, through a questionnaire containing 44 questions. The proposed approach involved one latent dependent construct, i.e., SAP and five independent constructs. Both were tested using PLS-SEM, which was more effective in handling smaller samples and complex models than CB-SEM. The research outcomes identified personality features as the most influential factors that affect SAP performance.
The issues faced by DHH students in their education were addressed by Raji et al. (2024). They proposed a new ML system with LIME and SHAP methods. The proposed system predicted the student at risk and weighted the key risk factors like early intervention, family deafness history, mode of communication, and type of schooling. They generated a new dataset combining 454 DHH student records with synthetic and SMOTE datasets. After that, various ML methods were applied, among which a stacked model with XGB + RF + Extra Trees gained 92.99% accuracy. This system provided practical recommendations allowing stakeholders to enhance DHH students’ performance.
Kapucu et al. (2024) explored ML and DL approaches to predict student performance in science classes. They collected the data from 445 students in grades 5–8 from a school in Central Anatolia, Turkey, during the 2022–2023 academic year. The results revealed that out of several factors, the average number of books read per year significantly affected performance more than other factors. The DNN model achieved the highest accuracy, i.e., 90%.
Nurudeen et al. (2024) established the correlation between the first-year GPA and the final-year CGPA. Data were collected using an ex-post facto design and analysed using Pearson’s correlation and regression in Minitab. It was also found that first-year GPA had a consistently high correlation (i.e., 0.9334) with the final-year CGPA, proving that early academic performance is a major determinant of success. However, other demographic characteristics were not significantly related to CGPA.
The problem of imbalanced datasets in learning was minimised by Wang et al. (2023). They proposed a ProbSAP system for predicting academic performance. The ProbSAP incorporated three key modules: a cooperative data enhancement sub-module for improving data quality, accessible in large-scale metadata clustering sub-module for reducing potential imbalances of academic features, and the XGBoost-based prediction sub-module for final course mark prediction. The comparative assessments revealed that ProbSAP leads to lower mean absolute error than the current methods, including CNN, SVR, and Catboost-SHAP, and improved on an average by up to 84.76%. It provided a sample accuracy above 98%; there is less than 1–9% prediction error. Table 1 showcases different state-of-the-art studies in this domain.
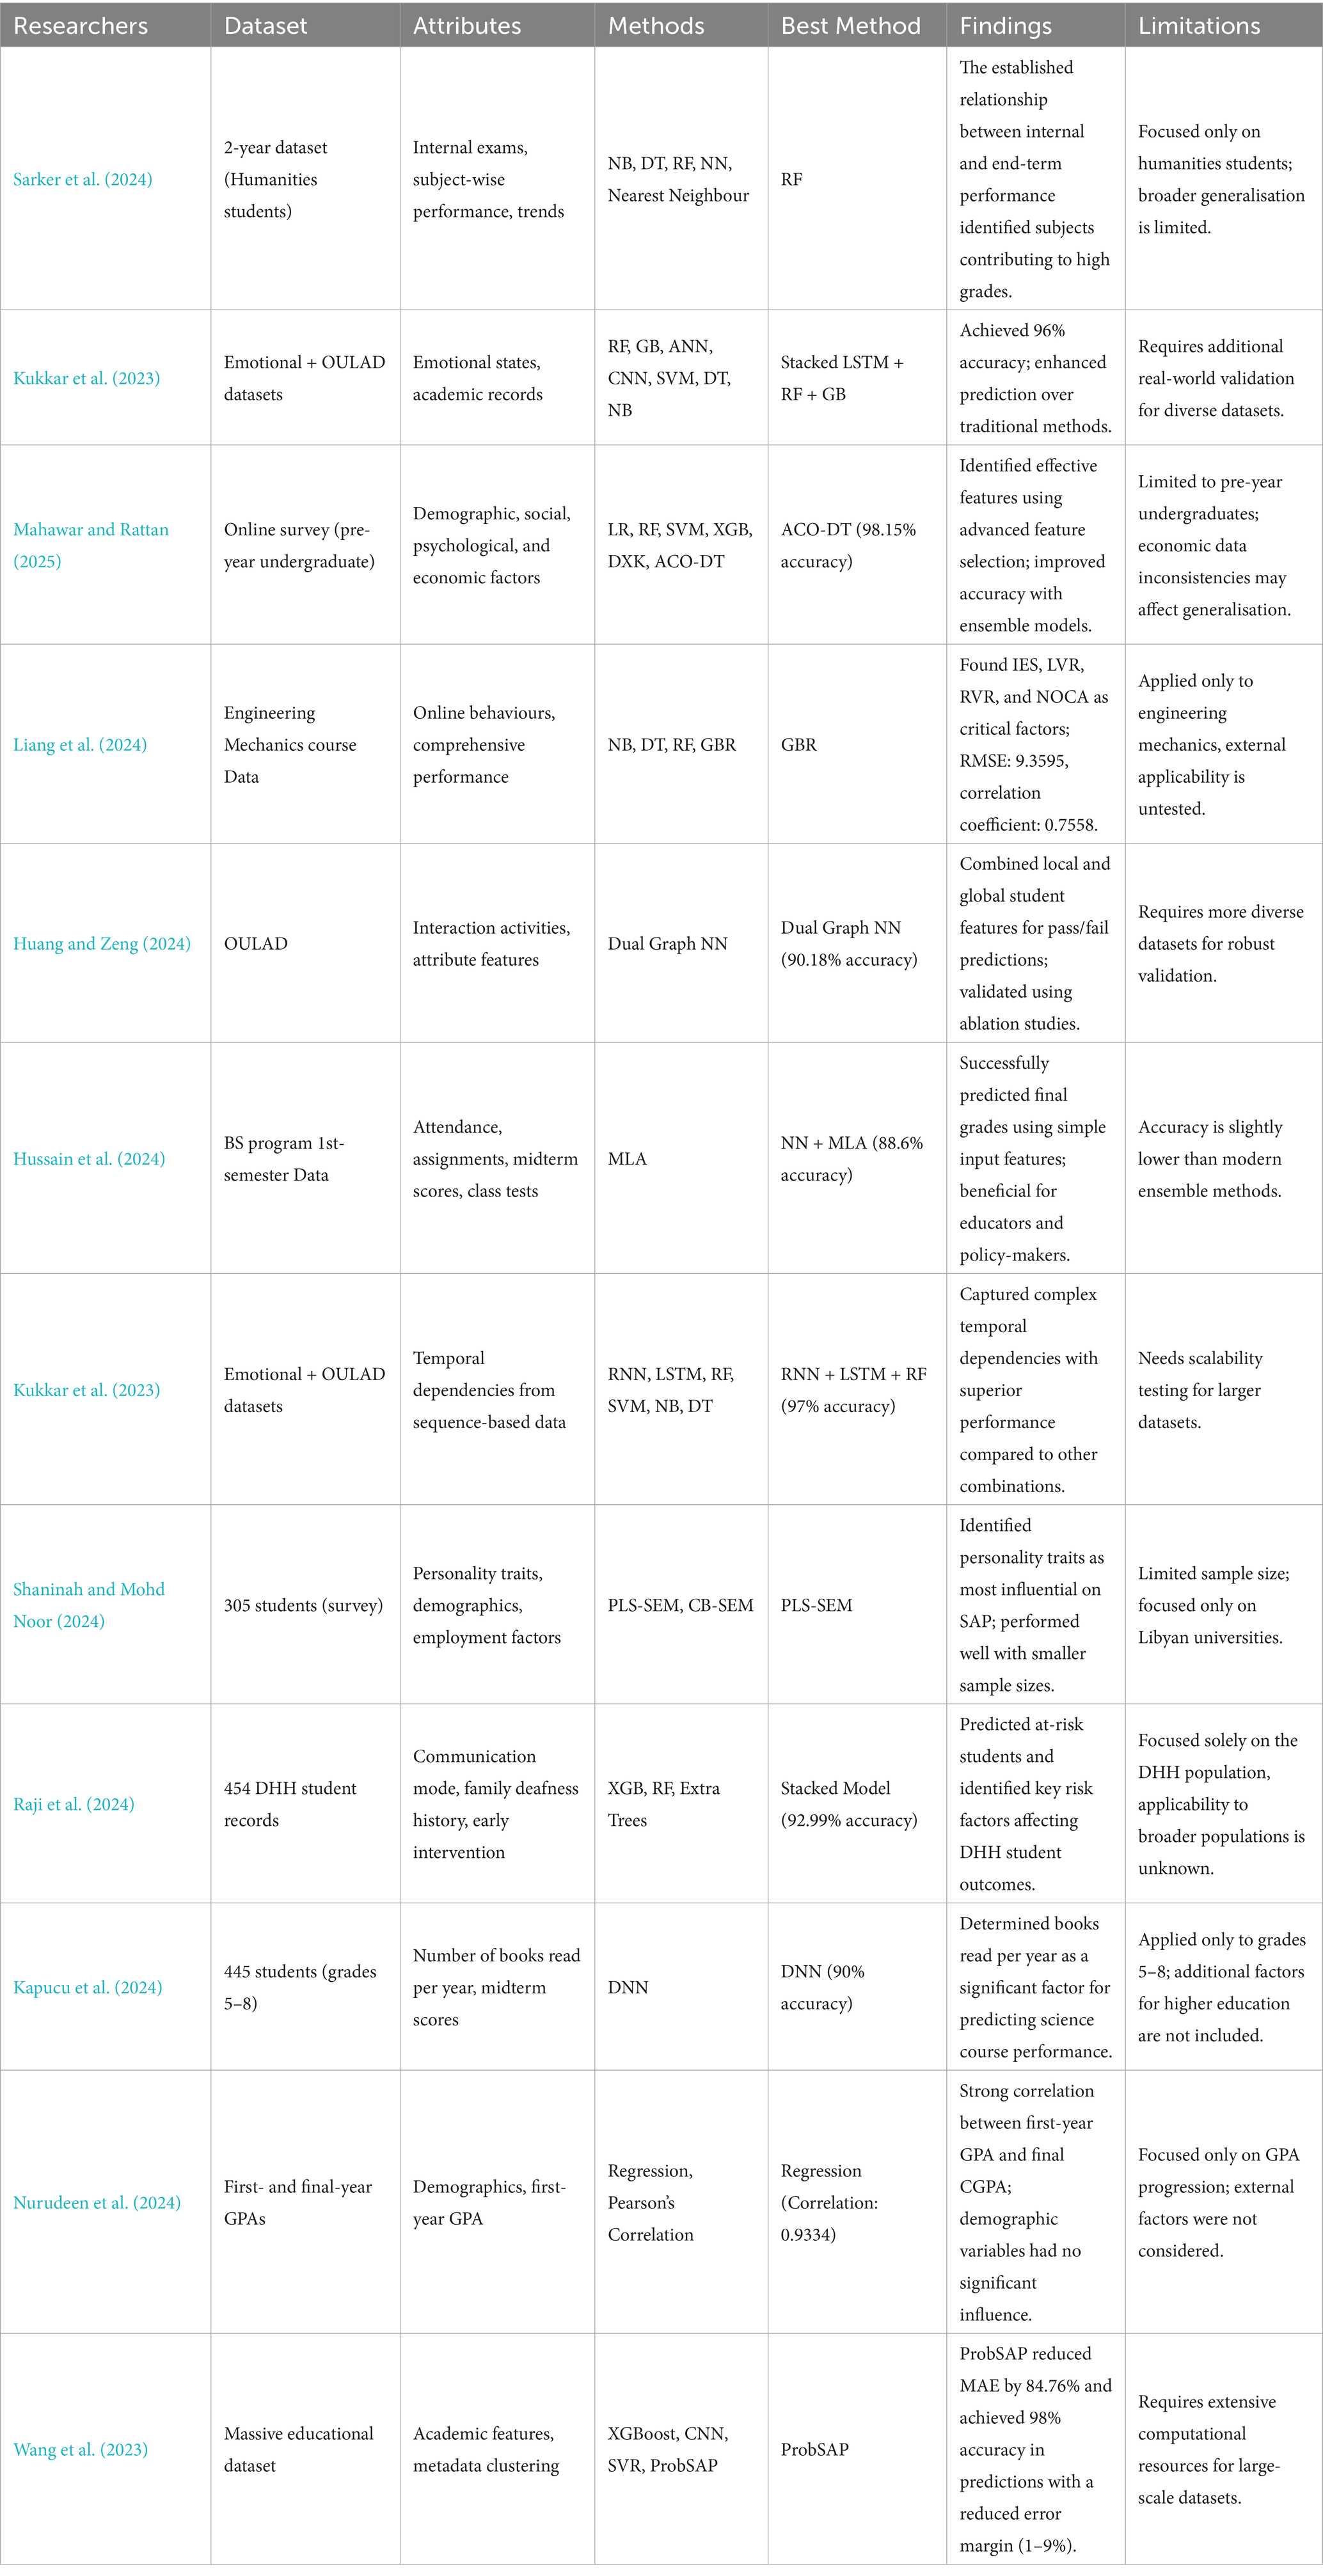
Table 1. Some of the state-of-the-art studies with their findings and limitations.
3 Methodology
In this section, the different methods used in this study for second-term GPA prediction are explained in detail. The design, implementation, and evaluation of the proposed methodologies and their comparison with the conventional machine learning approaches are also explained as follows.
3.1 Different methods utilised in the study
This section provides a detailed analysis of seven methods, examining their architecture, functionality, and effectiveness in predicting second-term GPA. Following this, we discuss the advantages and disadvantages of each method in the context of academic performance prediction.
3.1.1 XGBoost
E-Xtreme gradient Boosting is a Machine learning technique known for its exceptional predictive performance. It is also renowned for its high accuracy, efficiency and speed. It creates a sequence of weak learners, and based on this sequence, it develops an accurate predictive model. XGBoost minimises the overfitting problem by improving generalisation. Mostly, it works on classification and regression problems. It can handle missing values, which allows the model to handle real-world data with missing values without requiring pre-processing. Boost has key features; it uses a decision tree as the base learner. To enhance its performance, this approach supports parallel processing for improved efficiency and scalability and utilises regularisation to avoid overfitting. Its advantages are High accuracy, efficiency, handling large datasets and interpretability (Chen and Guestrin, 2016).
3.1.2 CatBoost
Yandex develops CatBoost to handle categorical and numerical data. CatBoost, or categorical boosting, is an open-source library to solve the problem of regression and classification with many independent features. It uses Symmetric Weighted Quantile Sketch (SWQS) to handle missing values in the dataset and reduce the overfitting problem, which improves the performance of the dataset. It also applies Ordered Boosting to handle difficulties like large cardinality faced by categorical data. CatBoost utilises random permutations and gradient-based optimisation, which leads to improved performance on large and complex datasets. In each iteration of the algorithm, CatBoost define the loss function by calculating the negative gradient from the current prediction then, this gradient is used to update the prediction by adding a scaled gradient to the current prediction. CatBoost uses gradient-based optimisation to build decision trees to achieve accurate predictions. It then employs Ordered Boosting for faster model convergence and improved accuracy, which is particularly beneficial for datasets with numerous features. Categorial feature handling, reduced overfitting, high performance, interpretability and scalability are the advantages of Cat Boost (Prokhorenkova et al., 2018).
Mathematically, CatBoost can be calculated as follows:
N is the samples of a Training data set and M features, where each sample is defined as (), where is a vector of M features and is the corresponding target variablе, CatBoost try to learn a function that predicts the target variable y (see Equation 1).
Here,
is the overall prediction function that CatBoost try to learn. It selects an input vector x and predicts the variable y.
is the initial prediction. It is the mean of the target variable in the training dataset.
defines the summation over the ensemble of trees. M is the total number of trees in the ensemble.
is the summation over the training samples? N is the total number of training samples.
denotes the prediction of the mth tree for the ith training sample. In the overall prediction process, each tree within the ensemble contributes by leveraging its training sample predictions.
The equation represents that the total prediction is summing up the initial guess with thе predictions of each tree for each training sample. This summation is done for all trees (m) and all training samples (i).
3.1.3 Histogram based gradient boosting
Traditional Gradient Boosting is an ensemble decision tree algorithm; it is slow to train the model, to minimise this problem, Hist Gradient Boosting or Histogram Based Gradient Boosting (HGB) concept is introduced. Hist Gradient Boosting is an effective implementation of traditional gradient boosting. This boosting technique divides data into bins and histograms, reducing the computational complexity and memory usage. These bins or histograms are used to find the gradient of the loss function and then update the model using the calculated gradients. It is an iterative process until it reaches the stopping criteria or convergence. Hist Gradient Boosting offers advantages such as accelerated gradient computation, scalability for large datasets and high-dimensional features, and resilience to outliers and noisy data. The common application of Hist Gradient Boosting is classification, regression and recommendation systems (Si et al., 2017).
3.1.4 LightGBM
Microsoft’s LightGBM is a fast and efficient gradient-boosting framework for high performance. It tackles classification, regression, and ranking problems through a tree-structured approach, combining weak models into a strong predictor. LightGBM’s focus on large and small gradient instances contributes to its accuracy. It is a flexible model because it can support various objective functions. Due to its support for sparse data, LightGBM is highly memory-efficient. Its operation involves initialising a basic model and then calculating gradients. LightGBM applies some efficient algorithms to get an efficient model by searching the optimal split point in each feature.it is an iterative process and updates the model prediction based on split point and calculated gradients, continuously adding new decision trees until a stopping criterion is met, which may be either a maximum no. of trees or minimum improvement in performance. The high accuracy, speed, scalability, efficient histogram construction, and low memory usage are the advantages of LightGBM (Ke et al., 2017).
The selection of the methodologies depends on the problems, datasets and performance matrices because the following methodologies also have some demerits. XGBoost gives high accuracy but can suffer from overfitting. CatBoost can handle categorical features, but it is resilient to outliers. Hist GB is fast and memory-efficient, but it gives minimum accuracy. LightGBM is also fast and memory-efficient and gives more accuracy but can be less robust to outliers.
3.1.5 BiLSTM
Bi-directional Long Short-Term Memory, commonly known as Bi-LSTM, belongs to the recurrent neural networks (RNNs) category. It is called a sequence model because it processes sequential data. It has two LSTM layers, so it is Bi-directional. The first one is Forward LSTM, and the other one is Backward LSTM. Simultaneously, these two LSTM layers process the input sequence in forward and backward directions. Finally, it combines forward and backward passes to capture past and future context. In the forward pass, it can process the input from starting to ending and from ending to starting in the backward pass.
In Figure 2, the input sequence represents some data like characters in a text or words in a sentence, etc., these data points are transformed into dense vectors. The Bi-LSTM layer applies its parameter to the vector sequence. In the forward pass, information is collected from the past (prior time steps), and in the backward pass, information is recorded from the future (following time steps). The output of the BiLSTM is the combination of the hidden steps from forward and backward directions (Graves and Schmidhuber, 2005) (Equation 2).
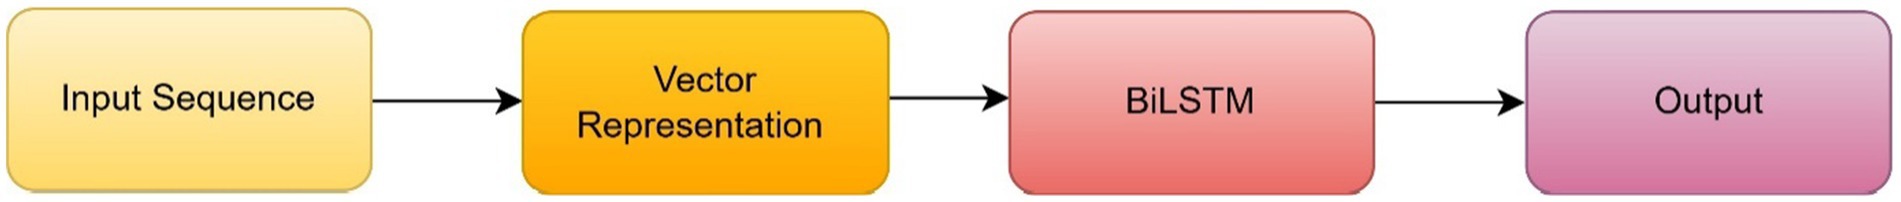
Figure 2. Structure of BiLSTM.
Where.
is the probability record from both the forward and backward LSTM network, i.e., the final probability vector;
probability vector found from the forward LSTM network.
probability vector found from the backward LSTM network.
3.1.6 SHAP (Shaply additive explanations)
The concept of cooperative game theory and sharply values is the foundation of SHAP (Lundberg and Lee, 2017). The output of the ML model is interpreted and explained using the Shapley Additive Explanations (SHAP) framework. SHAP values help to understand the contribution of each feature in model prediction. SHAP values explain the significance of each feature and how it affects the output and interaction between features. The positive SHAP value of a feature gives a positive impact on model prediction, and the negative value gives a negative impact on model prediction. The magnitude represents the strength of the effect. SHAP uses the training data to measure the contribution of each feature, and then a reference value is calculated. This reference value helps to represent the average prediction for the dataset. SHAP value defines the difference between the predicted value and reference value for each SHAP value and is calculated by considering all possible feature coalitions. Under considering all potential feature coalitions, the SHAP value defines the difference between predicted and reference values for each. Finally, SHAP values are used to determine how each feature affects the outcome and to understand and interpret the result. However, gaining insight helps the model to make decisions. Interpretability, model explainability and feature selection are the advantages of SHAP.
3.1.7 SMOTE
Synthetic Minority Over Sampling Technique (SMOTE) is known to handle imbalanced datasets of machine learning models (Chawla et al., 2002). SMOTE helps solve oversampling, undersampling and threshold moving issues. The underrepresented minority class causes the majority class to dominate the class distribution. Therefore, SMOTE handles these imbalanced issues by generating a sample of minority classes. SMOTE identifies some minority class instances from the imbalanced dataset. Once minority instances are identified, find their K-nearest neighbours and generate synthetic samples by interpolating between each minority instance and its K-nearest neighbours. SMOTE repeats these steps to get a more balanced dataset.
3.2 Data pre-processing to model evaluation
In this work, we followed a systematic methodology starting with data pre-processing, which involved data preparation, transformation, and oversampling to address class imbalance issues. The raw dataset was cleaned and transformed into a suitable format, and oversampling techniques were applied to balance the data. This resulted in a refined new dataset, which was then used for model development and evaluation to assess the performance and accuracy of the proposed approach. Figure 3 describes the steps of our model.
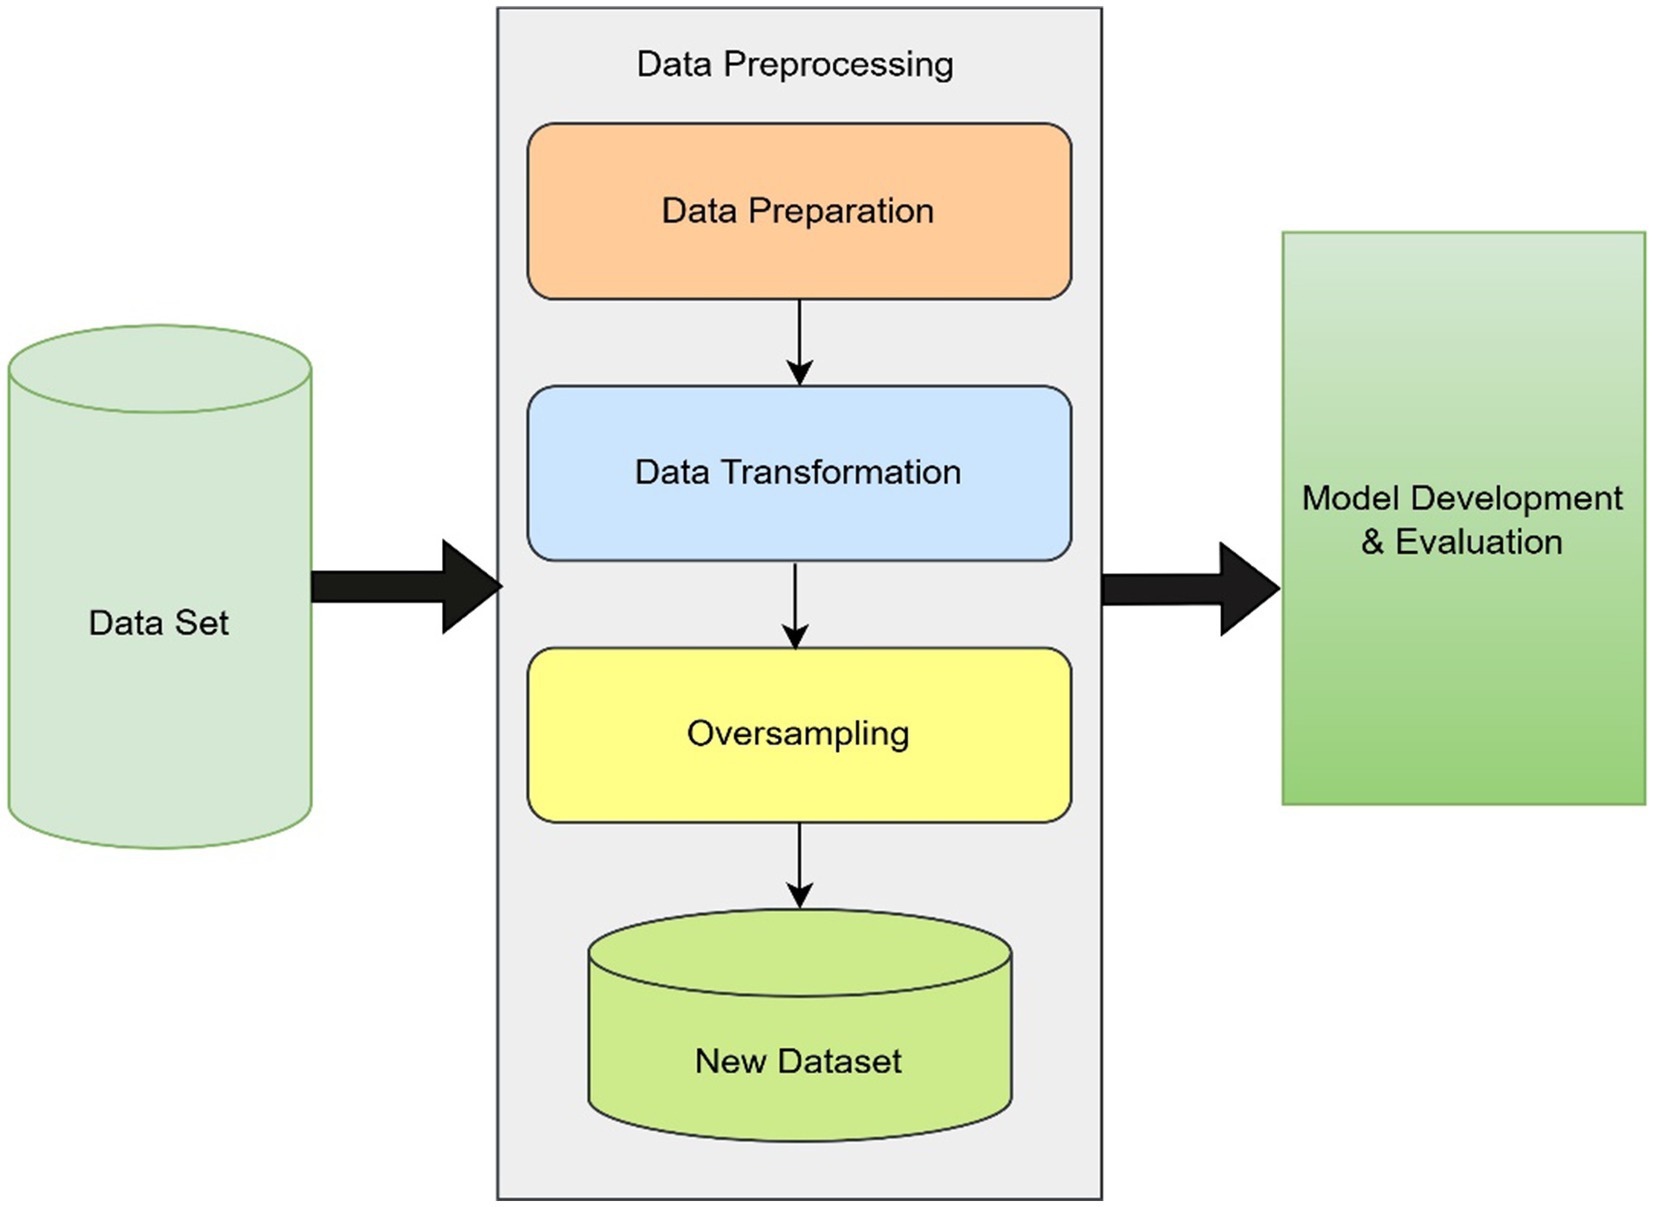
Figure 3. Structure of proposed model.
3.2.1 Dataset description
The dataset was collected from a Middle Western University, USA. The dataset comprised sex, age, high school grade point average (HSGPA), American College Testing (ACT) composite score, and grade point averages for the first (FTGPA) and second terms (STGPA). STGPA is our target variable. The dataset consisted of three cohorts of students’ records (N = 6,500) on six variables (features).
3.2.2 Data pre-processing
The dataset underwent a systematic preparation process to ensure its reliability and accuracy. Data cleaning was a critical step involving the identification and removal of missing values, as well as the elimination of duplicate records to maintain data consistency. These measures were essential to produce a clean and error-free dataset, providing a robust foundation for subsequent analytical tasks.
In addition to data cleaning, data augmentation was applied to enhance the dataset. This process involved generating new data points by introducing small random perturbations to key features, such as HSGPA, ACT, and FTGPA. Adding subtle variations to the data increased its diversity, better reflecting real-world variability. This data augmentation expanded the dataset and enhanced the model’s general ability, leading to more robust analyses. Figure 4 shows the distribution of classes before the data augmentation process.
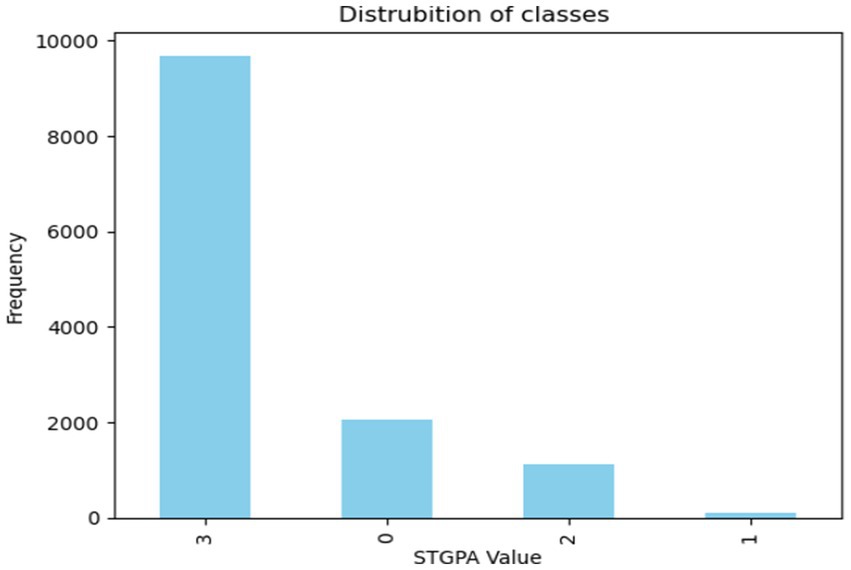
Figure 4. Distribution of classes before the data augmentation process.
To further address the class imbalance, SMOTE (Synthetic Minority Over-Sampling Technique) was applied. SMOTE generates synthetic data points for the minority classes, ensuring a more balanced data distribution across all classes. This balance is critical for training machine learning models, as it prevents bias toward any particular class and ensures that the model is equally exposed to all possible outcomes, improving its overall performance and generalisation ability. The final balanced distribution is shown in Figure 5.
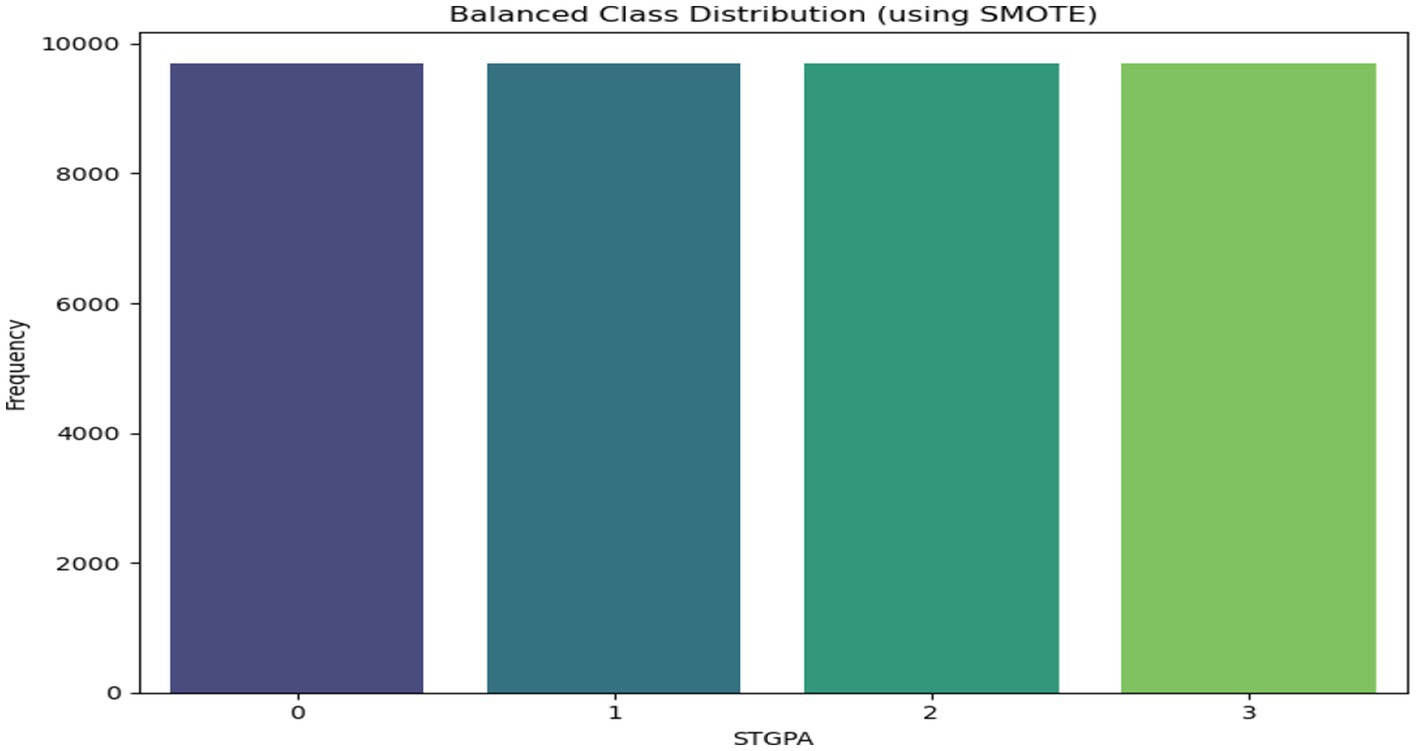
Figure 5. Distribution of classes after the data augmentation process.
3.2.3 Model architecture
The model implemented is a Recurrent Neural Network (RNN) architecture utilising Bidirectional Long Short-Term Memory (Bi-LSTM) and Bidirectional Gated Recurrent Units (Bi-GRU) layers to capture sequential patterns in the data (Figure 6 shows the proposed model architecture).
• Input Pre-processing:
• The input features are reshaped to a 3D tensor of shape (samples, time steps, features). Here:
• samples correspond to the number of training/testing samples.
• time steps are set to 1, signifying a single time step.
• features represent the number of input features.
• Recurrent Layers:
• The core of the model leverages a combination of BiLSTM and BiGRU layers:
• 1st Layer: A Bidirectional LSTM layer with 512 units and return_sequences = True, allowing the output sequence to be passed to the next layer.
• 2nd Layer: A Bidirectional GRU layer with 256 units configured to output sequences for further processing.
• 3rd Layer: Another Bidirectional LSTM layer with 256 units, reducing the sequence to a single vector representation.
• Dense Layers:
• A stack of fully connected layers captures complex, high-level representations of the processed sequential data:
• Dense(64) → Dense(32) → BatchNormalization → Dense(16) → Dense(8) layers refine the feature space.
• Batch normalisation ensures stability and mitigates the risk of vanishing/exploding gradients.
• Dropout:
• Dropout layers introduce regularisation, preventing overfitting by randomly setting a fraction of units to zero during training.
• Output Layer:
• A Dense layer with four units and a sigmoid activation function outputs class probabilities for the four classes.
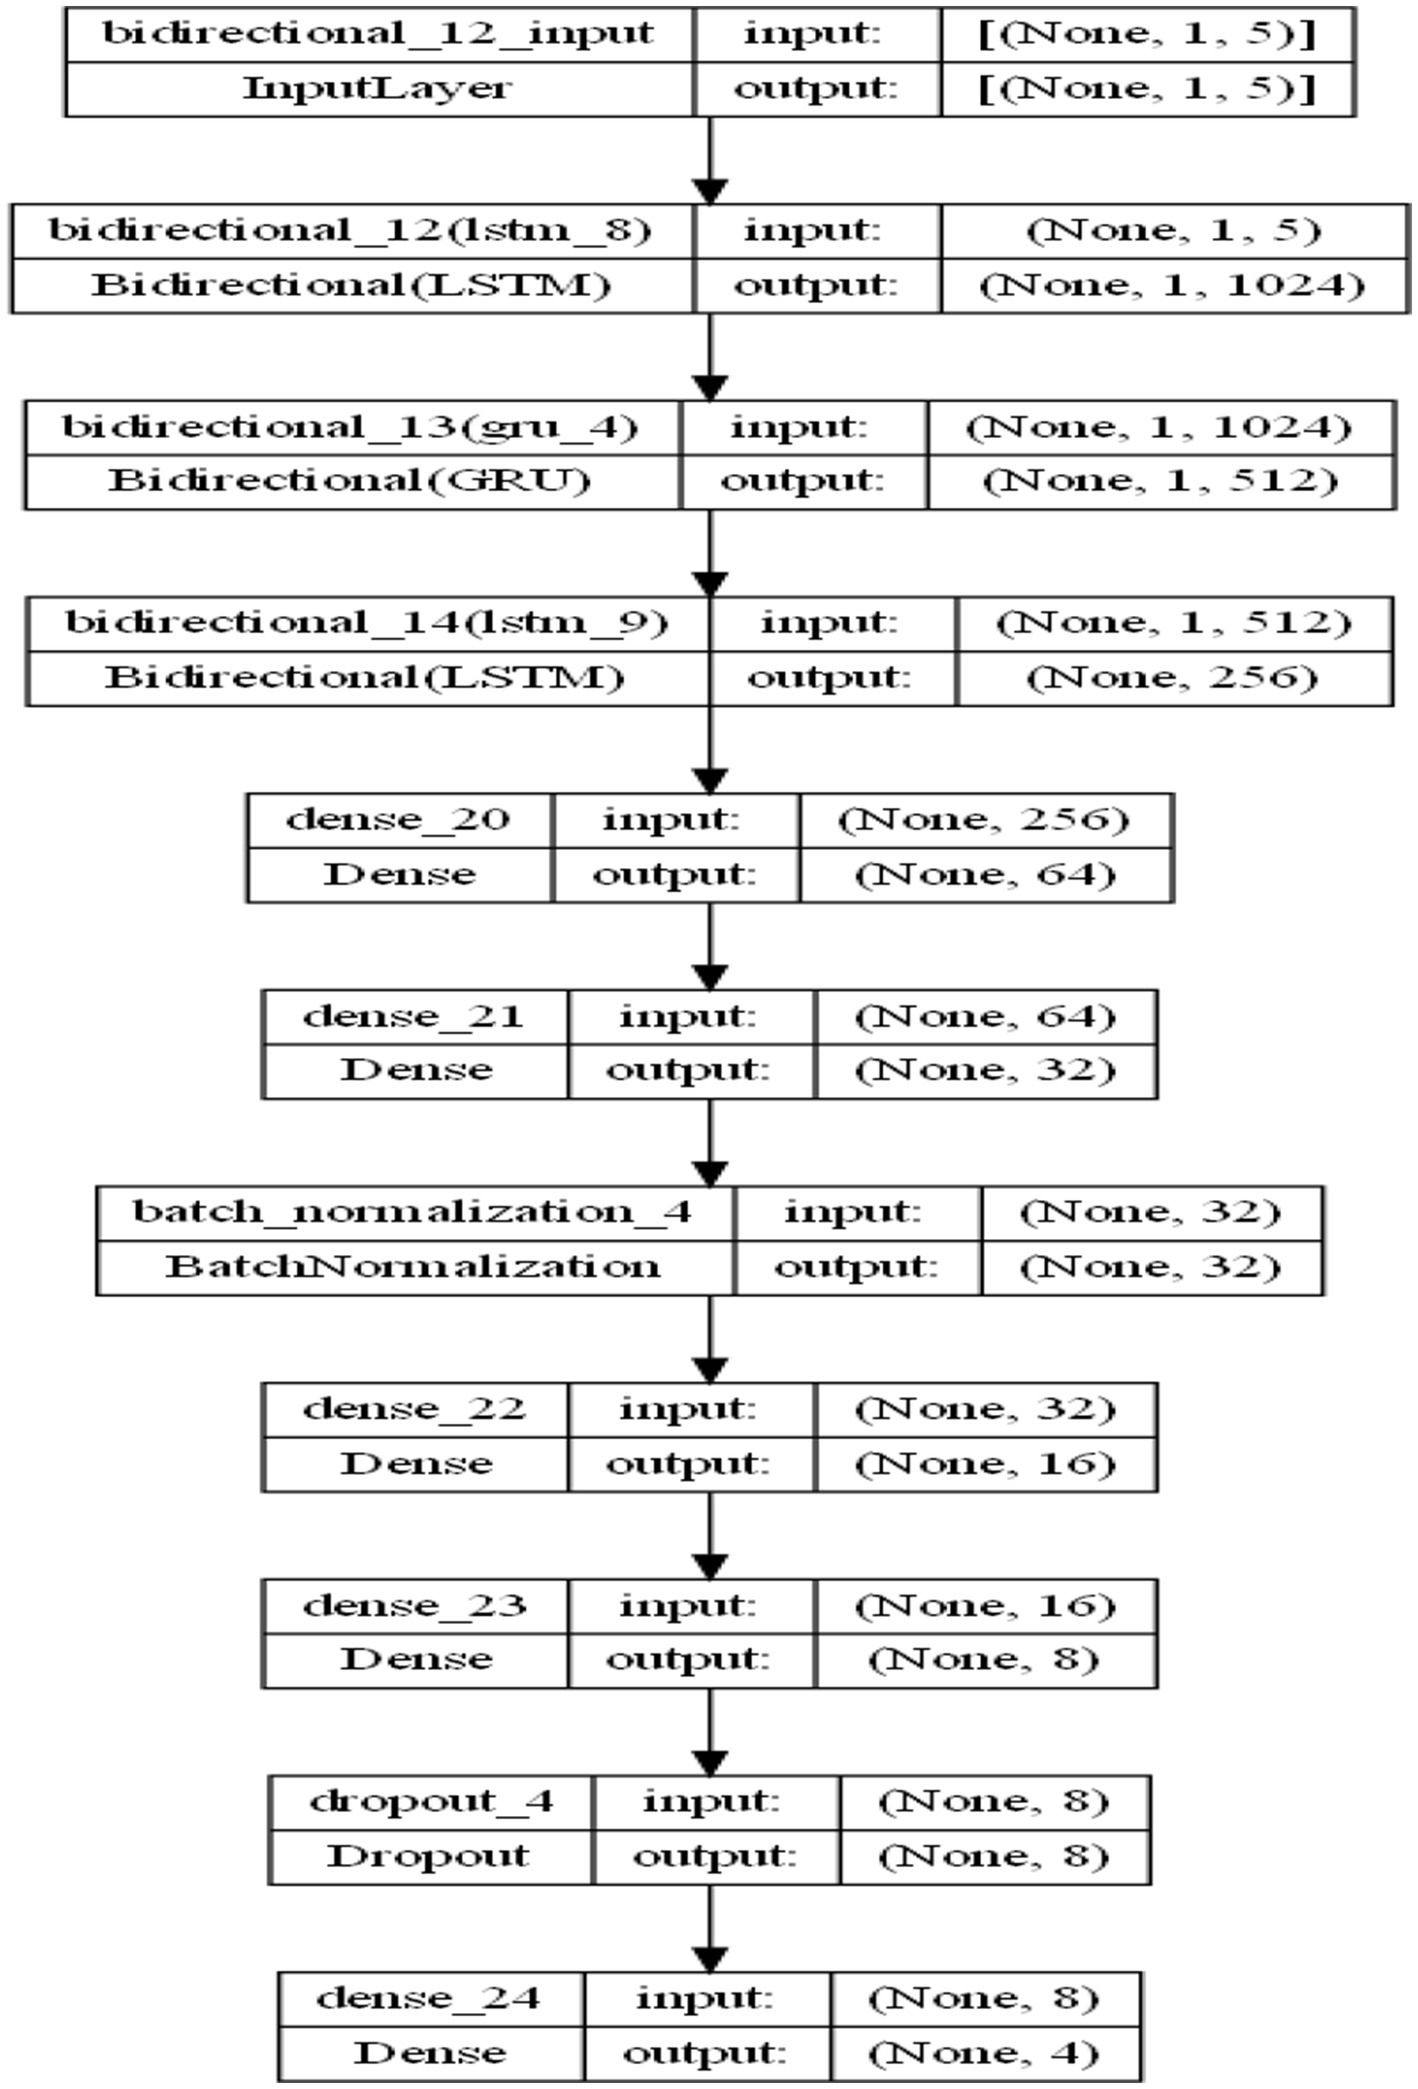
Figure 6. Model architecture.
The model was trained for up to 200 epochs with a batch size of 128, while early stopping was applied to prevent overfitting. Early stopping monitored the validation loss and halted training if no improvement was observed for 15 consecutive epochs, restoring the best model weights to ensure optimal performance. Dropout was applied with a rate of 0.2 in the fully connected layers to reduce overfitting by randomly deactivating some units during training. The model was compiled using the Adam optimiser, which is efficient and adaptive, and the categorical cross-entropy loss function, suitable for multi-class classification tasks. The accuracy metric was used to evaluate the model’s performance during training and validation (Figure 7).
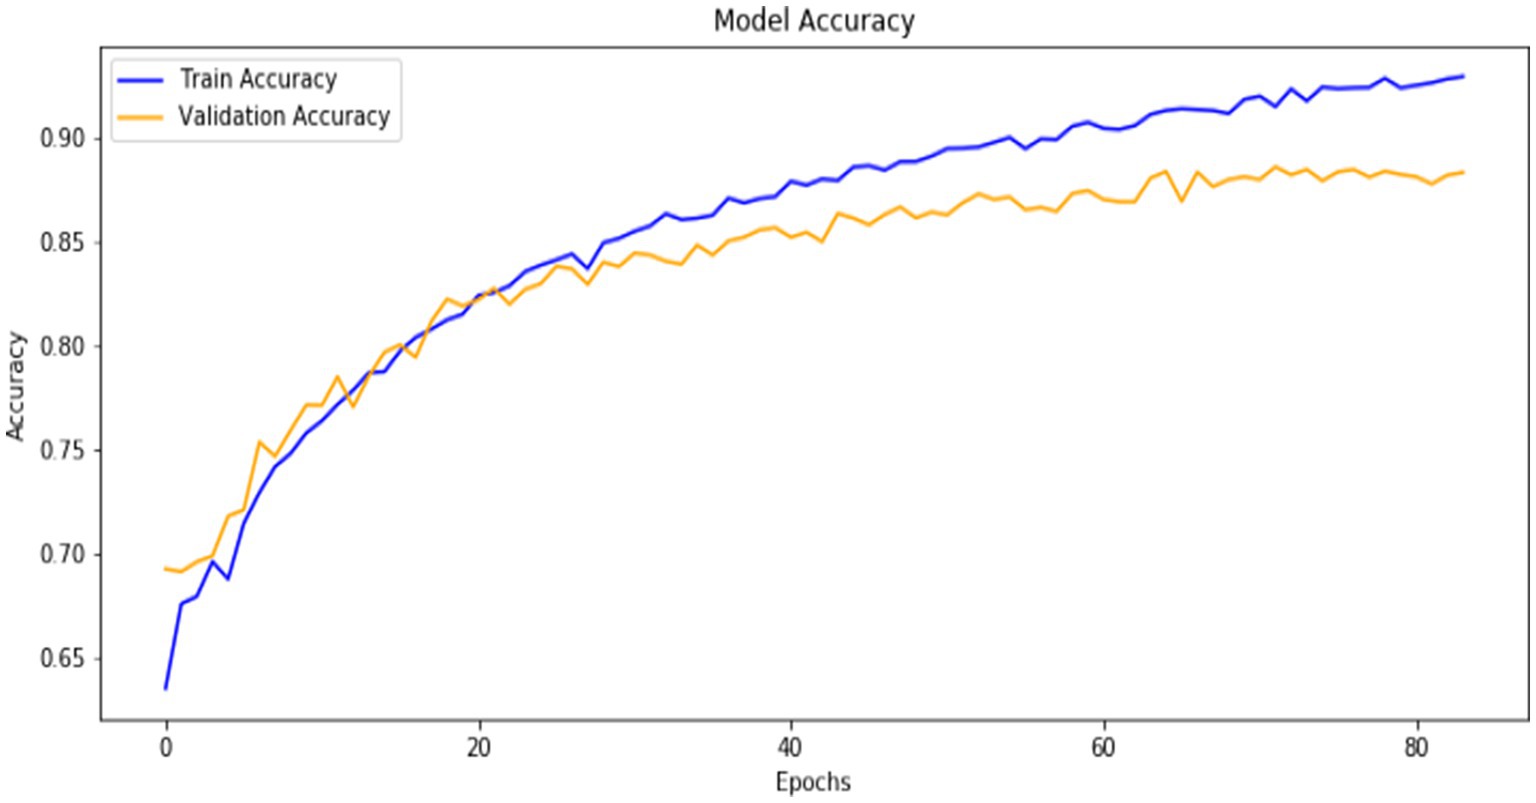
Figure 7. Training and validation accuracy over epochs.
4 Results and discussion
In this section, we will describe the results obtained from comparing the performance of various machine learning algorithms. The evaluation was based on several key metrics, including accuracy, precision, recall, and F1-score, which help assess the performance of the models in predicting the target variable, STGPA. The algorithms used in the comparison include CatBoost, XGBoost, HistGradientBoosting, and LightGBM (Figure 8).
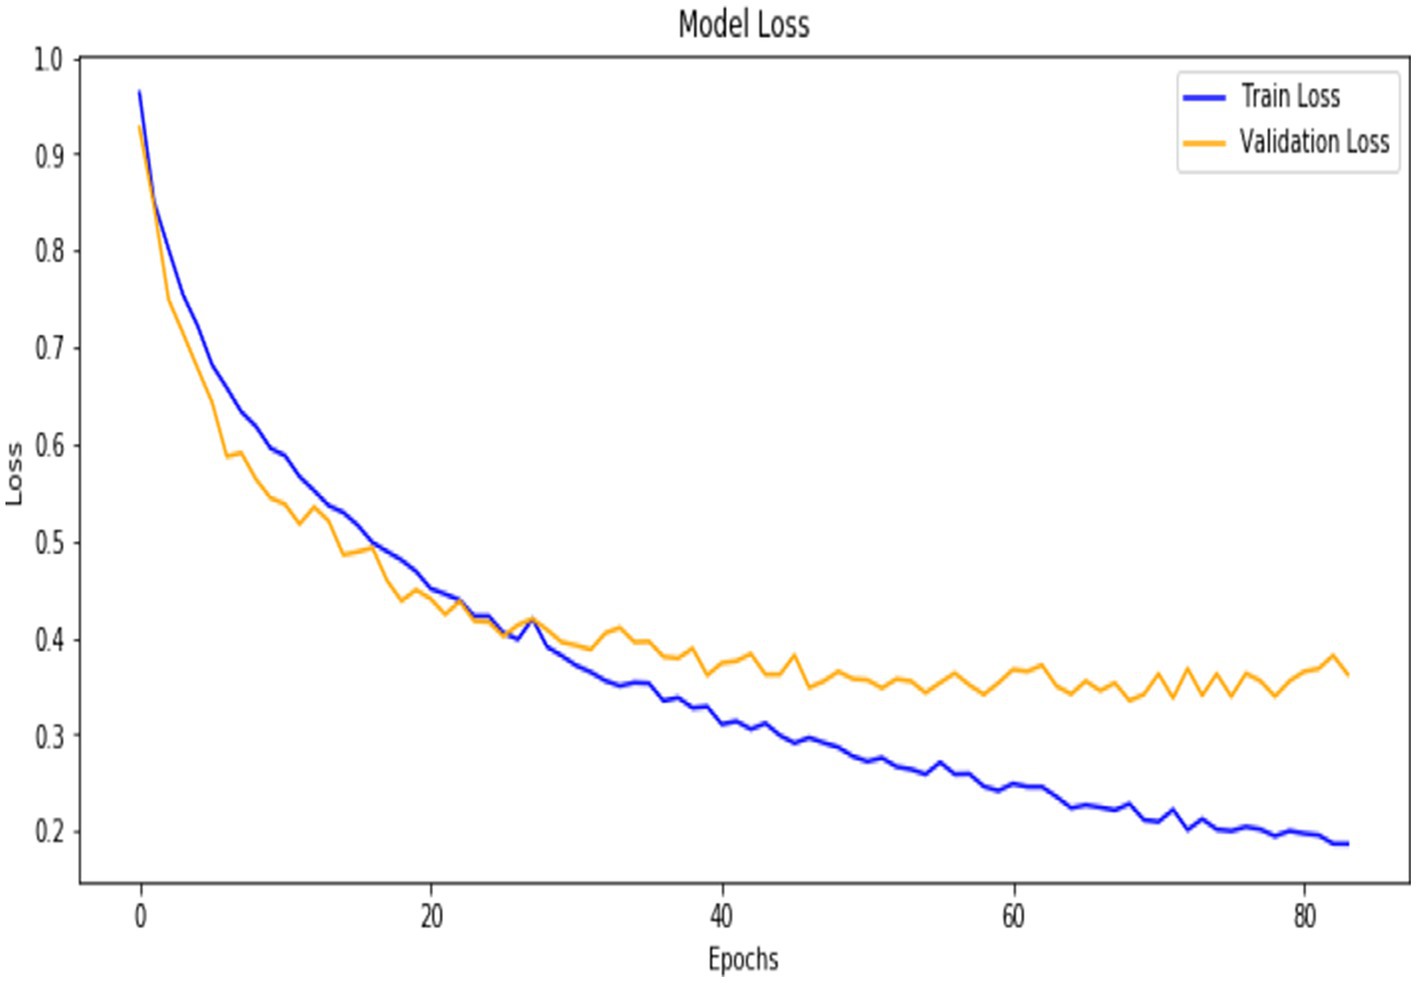
Figure 8. Training and validation loss over epochs.
For each algorithm, the following metrics were calculated based on the values of True Positives (TP), False Positives (FP), True Negatives (TN), and False Negatives (FN)
1 Accuracy: This metric measures the proportion of correct predictions made by the model relative to the total number of predictions (see Equation 3). Higher accuracy indicates better overall performance.
2 Precision: This metric measures the proportion of true positive predictions among all positive predictions made by the model (see Equation 4). This is particularly crucial when incorrect positive predictions have significant negative consequences.
3 Recall: This metric indicates how well the model identifies all relevant instances of the positive class (see Equation 5). It is critical when false negatives are costly.
4 F1-score: This is the harmonic mean of precision and recall, offering a balance between the two (see Equation 6). A high F1 score indicates that the model performs well in precision and recall.
4.1 Model performance
The training process consisted of 200 epochs, and throughout this period, the model exhibited a significant increase in performance. Starting with a training accuracy of 63%, it gradually increases to 91%, while validation accuracy stabilises above 87%, demonstrating strong generalisation. The cross-entropy loss decreases consistently for training and validation sets, indicating effective optimisation. Early stopping is applied to monitor the validation loss and prevent overfitting; the training halts when the validation loss ceases to improve for a predefined number of epochs. This approach ensures the model achieves optimal performance without overfitting the training data.
4.2 Model evaluation
The research developed a deep learning approach with Bi-LSTM for predicting academic performance of students by using GPA as the main metric. The proposed model underwent an evaluation test where it competed with CatBoost, XGBoost, HistGradientBoosting, and LightGBM through a classification methodology based on accuracy, precision, recall, and F1-score metrics. The Bi-LSTM model receives SHAP (SHapley Additive Explanations) interpretation to achieve transparency and trustworthiness for its global and local output.
4.2.1 Comparative model performance
Table 2 paired with Figure 9 showed that the Bi-LSTM model outperformed other models in all performance metrics. Among the ML models, XGBoost achieves the highest accuracy (87.14%), precision (86.94%), recall (87.18%), and F1-score (86.98%), demonstrating its superior performance. The deep learning model, Bi-LSTM, outperforms all others with the highest accuracy (88%) and significantly higher precision (92.02%), recall (92.11%), and F1-score (91.98%), indicating its effectiveness in capturing complex patterns and achieving better overall results. The performance metrics from Figure 9 demonstrated Bi-LSTM exceeds all other models particularly with respect to precision and recall levels where it displays substantial superiority over baseline evaluations. For instance, the higher precision means Bi-LSTM is more accurate in identifying students who are truly at risk of underperforming, reducing false interventions. The recall mechanism protected the identification of most students who need attention. The F1-score demonstrated that Bi-LSTM achieves better overall performance through its single balanced metric reflecting both precision gains and recall enhancement. The information presented here becomes vital for educators who need systems that perform detection and intervention activities without making errors. The significant margin demonstrated an important increase in the trustworthiness of models particularly when applied to real-world academic tasks.

Table 2. Models’ performance comparison.
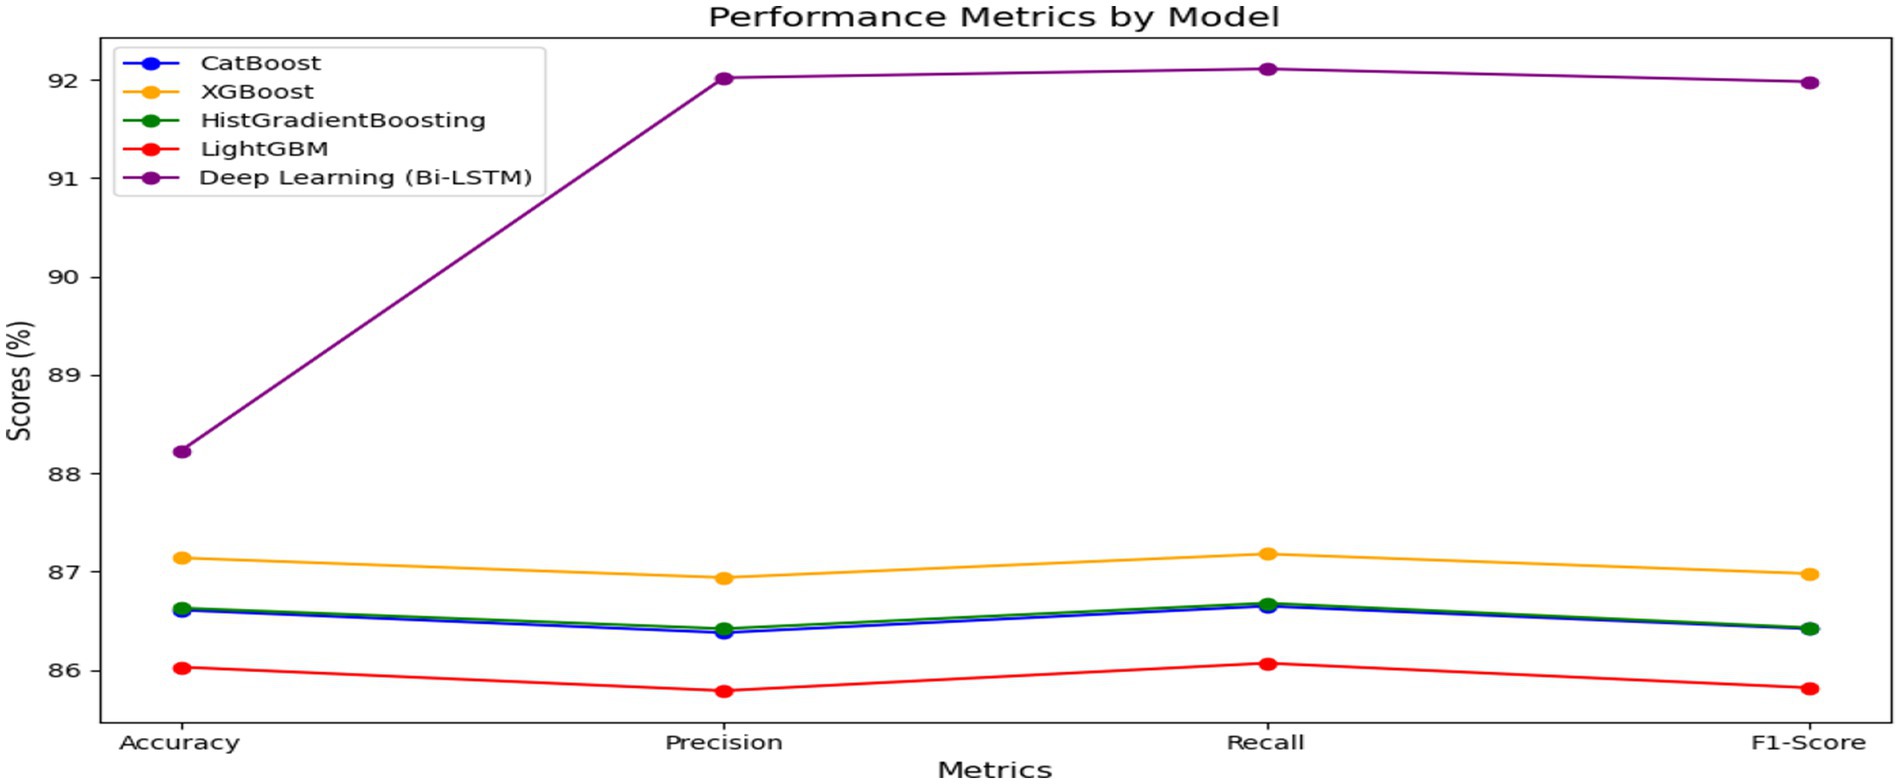
Figure 9. Performance models by metrics.
4.2.2 Feature importance via SHAP values
The opacity of DL models required the use of SHAP to explain Bi-LSTM output and validate its predictions. SHAP attributes numerical values to each attribute to identify how much they impact prediction results. The obtained insights from SHAP evaluations can be seen in Figure 10 of the SHAP Violin Summary Plot and Figure 11 of the SHAP Heatmap Plot.
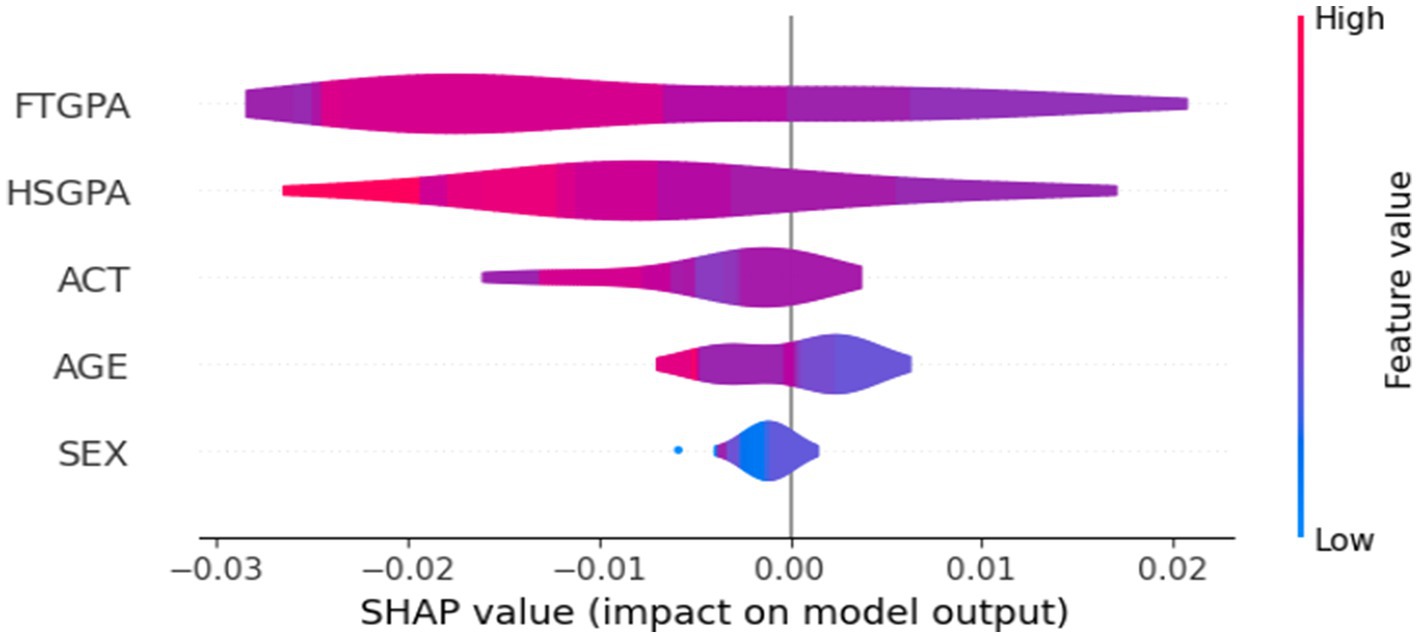
Figure 10. Violin summary plot based on SHAP values.
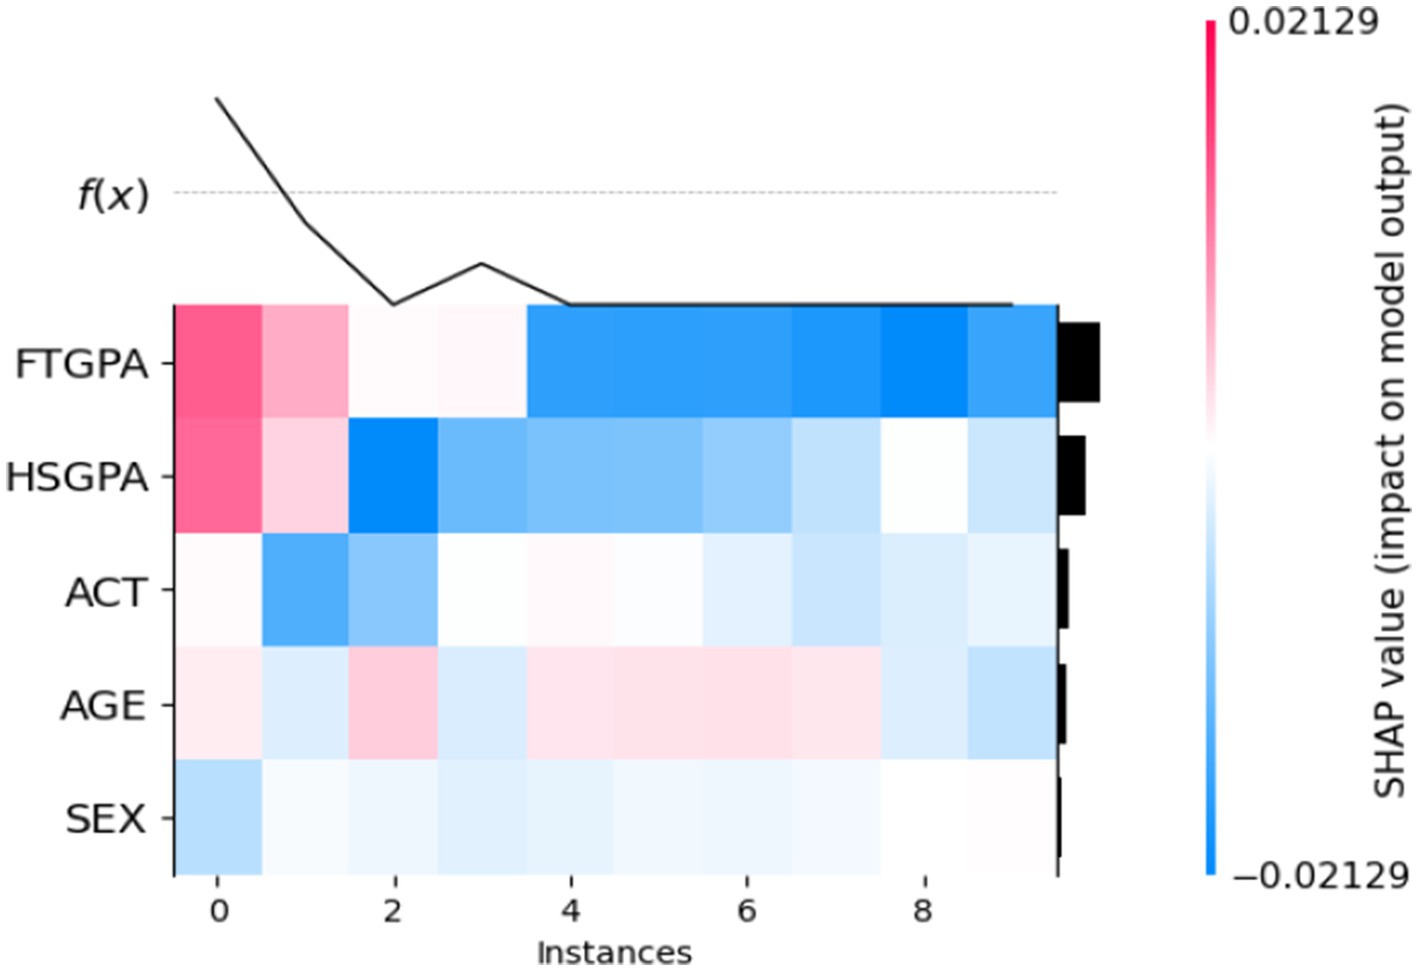
Figure 11. Heatmap plot based on SHAP values.
4.2.2.1 SHAP violin plot
Figure 9 revealed that: Among all predictive factors, FTGPA (First Term GPA) showed the greatest impact because its data distribution extends the furthest toward zero from the x-axis. Student performance in first term and high school together with ACT scores demonstrated similar importance levels which capture their academic development and standardised testing abilities. Data from the model indicated that AGE and SEX variables had only small predictive power due to their negligible impact. The graphical representation proved academic historical data supersedes demographic characteristics in predicting GPA which strengthens the model’s application relevance for educational purposes.
4.2.2.2 SHAP Heatmap
Figure 11 demonstrated local explanation through visual presentation of how individual student predictions relate to each feature. A positive SHAP contribution appears as red while negative SHAP influence shows up as blue. For instance: Predicted GPA values are consistently higher when the students demonstrate high FTGPA and HSGPA levels which appear as red in color. The model uses blue color to identify instances when variables have lower values which results in predicted outcomes that decrease. The model’s predictions received confidence through this approach allowing advisors to identify explanation reasons for each prediction so they can deliver tailored guidance.
The stakeholders can identify the students at risk early and deliver appropriate exhortation in an auspicious manner. This can help prevent students from dropping out of the institution and improve the institution’s overall performance.
4.3 Statistical analysis
In this section, the performance of selected ML and DL models are compared using the mean, median, standard deviation, t-test–test, bootstrap confidence levels, Friedman test, Effect Sizes (Cohen’s d) and Tukey’s HSD Test (Penick and Brewer, 1972; Liu and Xu, 2022; Carpenter and Bithell, 2000). These statistical measures provide crucial information for assessing both the operational efficiency and the overall credibility of the models. This section provides further insight into evaluating the performance metrics of various models using statistical measures such as accuracy, precision, recall, F1-score and statistical tests at varying thresholds.
4.3.1 Descriptive statistics
Descriptive statistics provide an overview of the performance of each model in terms of the key metrics: accuracy, Precision, Recall, and F1-score. The following table summarises the descriptive statistics for each metric across all models (Table 3):
• Mean: the average performance across all models.
• Standard Deviation: indicates the variability of each model’s performance.
• Min/Max: represents the lowest and highest performance, respectively.
• Percentiles (25, 50, 75%): provide insights into the distribution of performance scores.
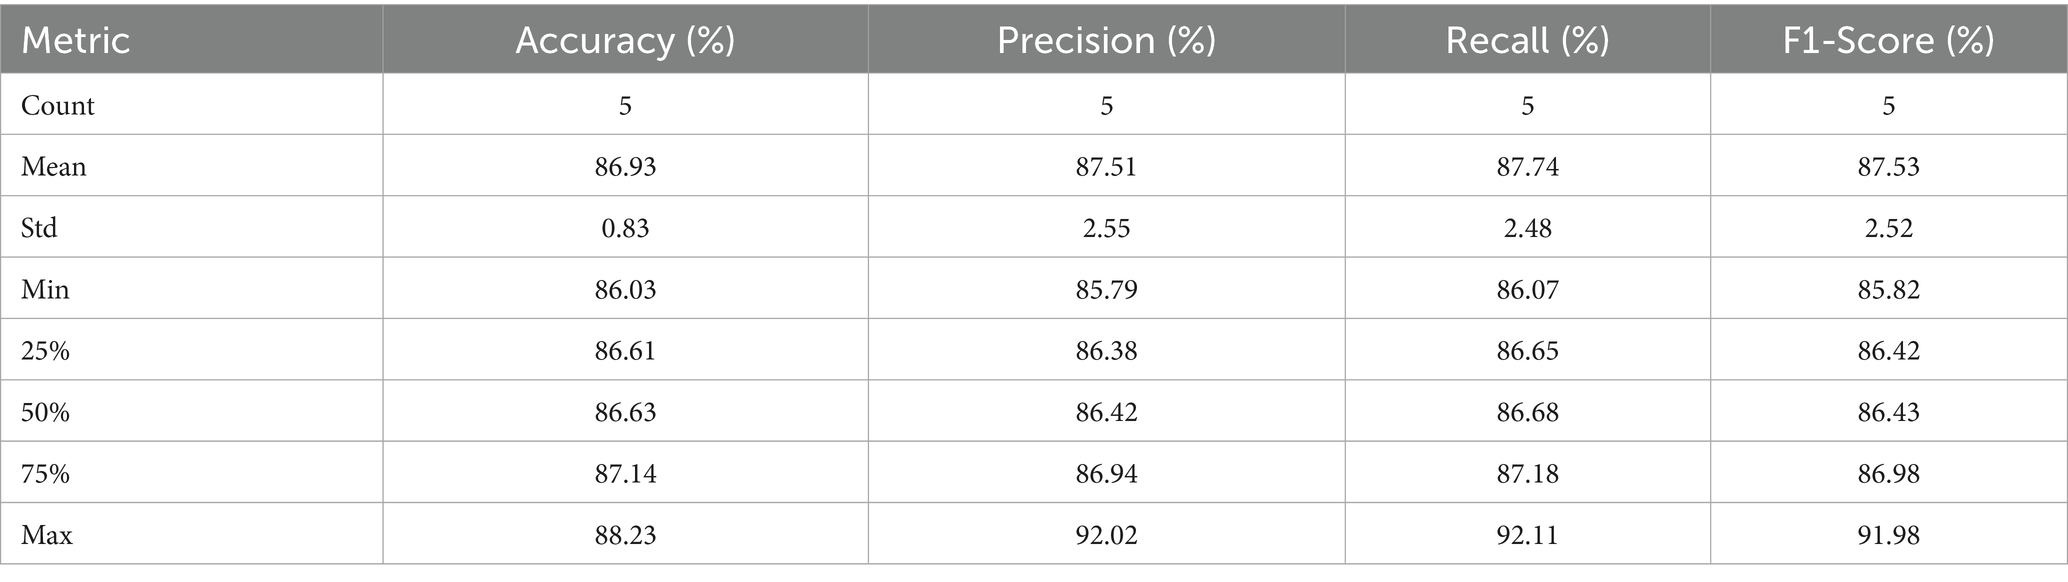
Table 3. Results of the descriptive statics test.
These descriptive statistics reveal that Bi-LSTM consistently outperforms other models in accuracy and F1-score, with a notable difference in precision and recall.
4.3.2 Friedman test
The Friedman test for repeated measures is applied to compare the models and identify any significant differences in their performance across the four metrics. The results are:
• Chi-squared: 11.1600
• p-value: 0.0109
Thus, a p-value of 0.0109 gives a sign of difference between the models, meaning that Bi-LSTM is statistically different from the others when comparing the mean value for the complete combination of all aspects.
4.3.3 Bootstrap confidence intervals
To evaluate the uncertainty of the differences between the models, the bootstrap 95% confidence intervals are calculated for the comparisons of each model against Bi-LSTM. The intervals for the difference in performance metrics (e.g., accuracy, precision, recall, and F1-score) are as follows:
• CatBoost vs. Bi-LSTM: (−5.6125, −2.6625)
• XGBoost vs. Bi-LSTM: (−5.0625, −2.1175)
• HistGradientBoosting vs. Bi-LSTM: (−5.5900, −2.6400)
• LightGBM vs. Bi-LSTM: (−6.2075, −3.2475)
The negative values in these intervals support the authors’ conclusion that Bi-LSTM performs better than these models in accuracy and other measures. The confidence intervals show statistically significant differences where Bi-LSTM performs higher than other models.
4.3.4 Effect sizes (Cohen’s d)
Cohen’s d is used to measure the difference in performance between the models and Bi-LSTM. The following results are obtained:
• CatBoost vs. Bi-LSTM: −3.9095
• XGBoost vs. Bi-LSTM: −3.4453
• HistGradientBoosting vs. Bi-LSTM: −3.8882
• LightGBM vs. Bi-LSTM: −4.4107
Cohen’s d values indicate large effect sizes and show that the Bi-LSTM model was significantly better than the other models. A negative Cohen’s d value suggests that Bi-LSTM is more accurate than the others.
4.3.5 Tukey’s HSD test
Finally, Tukey’s Honestly Significant Difference (HSD) test is used to compare all the models. The proposed model achieves the best performance of all the models and is statistically significantly different from CatBoost, XGBoost, HistGradientBoosting, and LightGBM with a p-value <0.05. From Table 4, it is observed that Bi-LSTM is statistically superior in predicting student performance than traditional models.
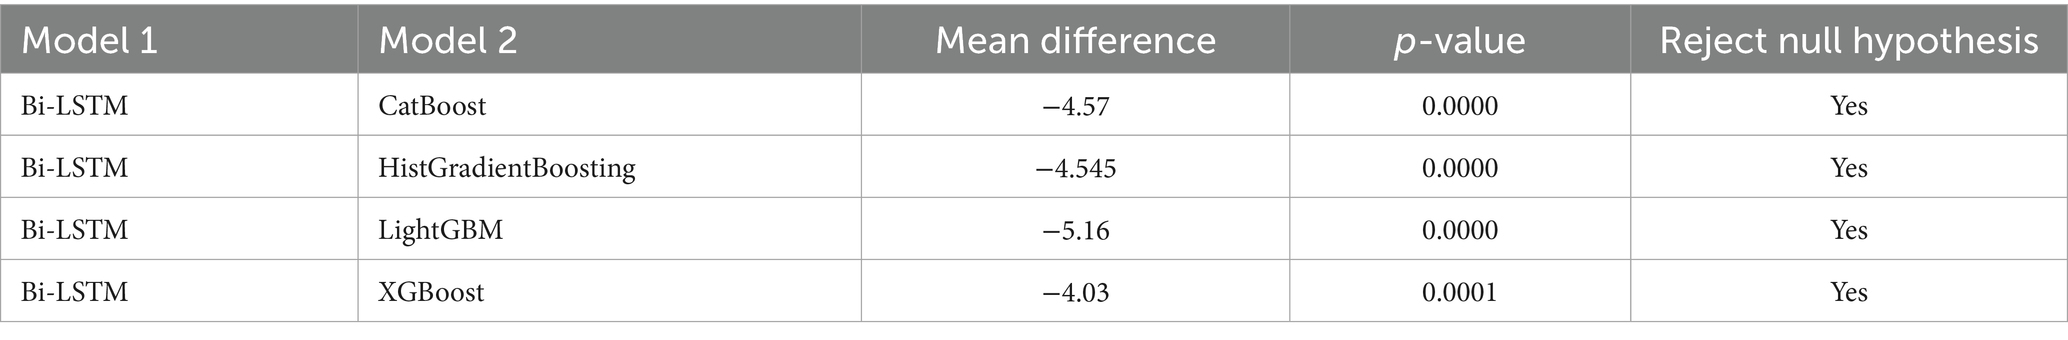
Table 4. Tukey’s HSD test results.
4.4 Discussion
The research objective focused on creating a DL model (using Bi-LSTM) to predict academic performance of students based on GPA through an interpretable approach. The model is tested against four competitive ML algorithms namely CatBoost, XGBoost, HistGradientBoosting, and LightGBM. This research utilised comprehensive evaluation standards together with extensive statistical examinations that ensured strong model performance assessment.
4.4.1 Comparative performance of models
All performance evaluation metrics from Table 2 demonstrate a clear superiority of Bi-LSTM compared to ML approaches for all precision, recall, accuracy and F1-score measures. In particular:
• Bi-LSTM achieved 88.23% accuracy, outperforming the next-best model, XGBoost, which reached 87.14%.
• Precision and Recall, both critical for identifying at-risk students, reached 92.02 and 92.11%, respectively, for Bi-LSTM. These values are significantly higher than those of all ML counterparts (which ranged from 85.79 to 87.18%).
• The F1-score of Bi-LSTM (91.98%) reflects an excellent balance between precision and recall, signifying that the model effectively minimises both false positives and false negatives.
The research demonstrated that deep learning algorithms such as Bi-LSTM exceed traditional ML models when processing educational data through sequential and contextual dependency modelling. The model employed bidirectional memory to access past and future temporal data which proved crucial for understanding academic trajectories.
4.4.2 Interpretation of evaluation metrics in context
Statistical metrics generate quantitative comparisons yet educators need to interpret these metrics in actual educational scenarios.
• High accuracy ensures the model is generally correct in its predictions.
• High precision reduces false alarms, meaning fewer students are incorrectly flagged as at-risk.
• High recall ensures that truly at-risk students are not overlooked, which is critical for timely interventions.
• High F1-score indicates a balanced and reliable predictive system that can be trusted in operational settings.
Academic institutions deploying the Bi-LSTM model can predict underperforming students in advance and deploy focused resources to prevent failure through early intervention.
4.4.3 Model interpretability and feature relevance
Black-box deep learning methods historically lacked transparency which makes explainability vital when student decisions are at stake in any educational context. This research uses SHAP as an interpretation tool for model predictive output. Through SHAP explanation stakeholders can learn about standard influences from features while simultaneously gaining case-by-case interpretation ability for specialised interventions. The most influential features, as shown in the SHAP summary and heatmap plots, include:
• First-Term GPA (FTGPA): Reflects initial academic performance and is a strong early indicator.
• High School GPA (HSGPA): Captures foundational academic preparedness.
• Standardised Test Scores (ACT): Signifies cognitive aptitude and readiness for college-level curriculum.
Research in educational data mining supports a clear connection between previous academic performance and future student achievement levels. Understanding the connection between data points and student outcomes through SHAP analysis makes model transparency possible which leads to better adoption by HEIs top management and administrators of non-technical backgrounds.
4.4.4 Statistical validation of performance superiority
The following statistical techniques were used to validate the findings along with their generalizability and credibility levels:
• The Friedman test, a non-parametric test for comparing multiple models over multiple datasets or metrics, revealed a statistically significant difference (χ2 = 11.16, p = 0.0109) among the models. This confirms that the observed performance differences are not due to random variation.
• Bootstrap confidence intervals were calculated to assess the uncertainty around the performance gaps. All intervals comparing Bi-LSTM with other models (e.g., CatBoost, LightGBM) had negative lower and upper bounds, indicating Bi-LSTM consistently outperformed its counterparts with 95% confidence.
• Cohen’s d effect size provided further confirmation. The magnitude of the effect sizes ranged from −3.4 to −4.4, representing very large effects. This statistically supports the assertion that Bi-LSTM is meaningfully better, not just marginally.
• Tukey’s HSD (Honestly Significant Difference) test confirmed pairwise statistical superiority of Bi-LSTM over each individual model (p < 0.0001 in all cases), providing robust post-hoc evidence to the Friedman results.
Our analysis utilised multiple approaches for validation to enhance the credibility of our study’s findings. These evaluations create confidence in decision-makers who typically need empirical validation to feel comfortable adopting AI-based systems.
4.4.5 Relevance for non-technical stakeholders
The technical aspects of this study produce significant practical benefits for educational institutions. This statistical model generated results which serve practical strategic purposes:
• HEIs top management and academic advisors can use the predictive results, along with SHAP explanations, to engage students in informed discussions and recommend tailored support plans.
• Administrators can incorporate the model into early alert systems to drive data-informed policies aimed at reducing dropout rates and improving overall institutional performance.
• Policymakers can explore this model as a blueprint for scalable national or state-level educational interventions, especially in systems that are resource-constrained but rich in historical academic data.
The Bi-LSTM model provided a unique combination between outstanding predictive capabilities and easy interpretability which makes it essential for education domains requiring both technical brilliance and ethical clarity.
4.4.6 Limitations and future directions
Despite the encouraging results, this study also has several limitations such as:
• Dataset Size: The current dataset worked well for analysis yet it may fail to show differences between student populations across various institutions and geographic areas. Future research should develop a larger research dataset which encompasses multiple institutions.
• Temporal Dynamics: Real-time updates and time-series changes have not been included into the present model framework. The predictive capabilities and applicability of the model will improve by implementing longitudinal tracking systems.
• Holistic Feature Space: Additional metadata about mental health and financial stress as well as engagement levels is missing from the current model assessment. Future versions of the model must incorporate socio-emotional and behavioural information to build a predictive instrument with a broader scope.
5 Conclusion
In this work, we proposed a deep learning-based model, specifically a Bi-LSTM (Bidirectional Long Short-Term Memory) network, to predict the second-term GPA. Our model was evaluated against several other algorithms, including CatBoost, XGBoost, HistGradientBoosting, and LightGBM, using key performance metrics such as accuracy, precision, recall, and F1-score. The results demonstrated that our proposed Bi-LSTM model outperforms the traditional machine learning algorithms in terms of predictive accuracy, highlighting the potential of deep learning techniques for academic performance prediction. This type of model can be utilised to mitigate student dropout and enhance the performance of the students. One of the limitations of the study is the size of the dataset. In future, we shall try to collect more data to boost the performance of the deep learning model. The integration of deep learning strategies and SHAP values in a single framework could overcome the challenges of the trade-off between the student academic performance model’s explainability and intricacy and augment model accuracy and transparency. The performance of selected ML and DL models are also compared using the mean, median, standard deviation, t-test–test, bootstrap confidence levels, Friedman test, Effect Sizes (Cohen’s d) and Tukey’s HSD Test. The results demonstrate that BI-LSTM performance is significantly different from other models. This study could open horizons for other researchers to conduct analogous studies in the domain.
Data availability statement
The data analyzed in this study is subject to the following licenses/restrictions: data will be provided on a request. Requests to access these datasets should be directed to c2FkaXFAZGlicnUuYWMuaW4=.
Author contributions
EK: Writing – original draft, Writing – review & editing. AA: Writing – original draft, Writing – review & editing. HE: Writing – original draft, Writing – review & editing. AK: Writing – original draft, Writing – review & editing. SH: Writing – original draft, Writing – review & editing. TA: Writing – original draft, Writing – review & editing. SG: Writing – original draft, Writing – review & editing.
Funding
The author(s) declare that financial support was received for the research and/or publication of this article. This paper is financed by the European Union-NextGenerationEU, through the National Recovery and Resilience Plan of the Republic of Bulgaria, project No BG-RRP-2.004-0001-C01.
Conflict of interest
The authors declare that the research was conducted in the absence of any commercial or financial relationships that could be construed as a potential conflict of interest.
Generative AI statement
The authors declare that no Gen AI was used in the creation of this manuscript.
Publisher’s note
All claims expressed in this article are solely those of the authors and do not necessarily represent those of their affiliated organizations, or those of the publisher, the editors and the reviewers. Any product that may be evaluated in this article, or claim that may be made by its manufacturer, is not guaranteed or endorsed by the publisher.
References
Ajibade, S. S. M., Dayupay, J., Ngo-Hoang, D. L., Oyebode, O. J., and Sasan, J. M. (2022). Utilization of ensemble techniques for prediction of the academic performance of students. J. Optoelectron. Laser 41, 48–54.
Alam, A., and Mohanty, A. (2022). Predicting students’ performance employing educational data mining techniques, machine learning, and learning analytics. In International conference on communication, networks and computing (166–177). Cham: Springer Nature Switzerland.
Alamri, R., and Alharbi, B. (2021). Explainable student performance prediction models: a systematic review. IEEE Access 9, 33132–33143. doi: 10.1109/ACCESS.2021.3061368
Al-Azazi, F. A., and Ghurab, M. (2023). ANN-LSTM: a deep learning model for early student performance prediction in MOOC. Heliyon 9:e15382. doi: 10.1016/j.heliyon.2023.e15382
Albreiki, B., Zaki, N., and Alashwal, H. (2021). A systematic literature review of student performance prediction using machine learning techniques. Educ. Sci. 11:552. doi: 10.3390/educsci11090552
Bravo-Agapito, J., Romero, S. J., and Pamplona, S. (2021). Early prediction of undergraduate student's academic performance in completely online learning: a five-year study. Comput. Human Behav. 115:106595. doi: 10.1016/j.chb.2020.106595
Carpenter, J., and Bithell, J. (2000). Bootstrap confidence intervals: when, which, what? A practical guide for medical statisticians. Stat. Med. 19, 1141–1164. doi: 10.1002/(SICI)1097-0258(20000515)19:9<1141::AID-SIM479>3.0.CO;2-F
Chawla, N. V., Bowyer, K. W., Hall, L. O., and Kegelmeyer, W. P. (2002). SMOTE: synthetic minority over-sampling technique. J. Artif. Intell. Res. 16, 321–357. doi: 10.1613/jair.953
Chen, T., and Guestrin, C. (2016). XGBoost: a scalable tree boosting system. Proceedings of the 22nd ACM SIGKDD international conference on knowledge discovery and data mining, 785–794
Dabhade, P., Agarwal, R., Alameen, K. P., Fathima, A. T., Sridharan, R., and Gopakumar, G. (2021). Educational data mining for predicting students’ academic performance using machine learning algorithms. Mater. Today Proc. 47, 5260–5267. doi: 10.1016/j.matpr.2021.05.646
Graves, A., and Schmidhuber, J. (2005). Framewise phoneme classification with bidirectional LSTM and other neural network architectures. Neural Netw. 18, 602–610. doi: 10.1016/j.neunet.2005.06.042
Hamsa, H., Indiradevi, S., and Kizhakkethottam, J. J. (2016). Student academic performance prediction model using decision tree and fuzzy genetic algorithm. Procedia Technol. 25, 326–332. doi: 10.1016/j.protcy.2016.08.114
Huang, Q., and Zeng, Y. (2024). Improving academic performance predictions with dual graph neural networks. Complex Intell. Syst. 10, 3557–3575. doi: 10.1007/s40747-024-01344-z
Hussain, M. M., Akbar, S., Hassan, S. A., Aziz, M. W., and Urooj, F. (2024). Prediction of student’s academic performance through data mining approach. J. Inform. Web Eng. 3, 241–251. doi: 10.33093/jiwe.2024.3.1.16
Hussain, S., and Khan, M. Q. (2023). Student-performulator: predicting students’ academic performance at secondary and intermediate level using machine learning. Ann. Data Sci. 10, 637–655. doi: 10.1007/s40745-021-00341-0
Kapucu, M. S., Özcan, H., and Aypay, A. (2024). Predicting secondary school students' academic performance in science course by machine learning. Int. J. Technol. Educ. Sci. 8, 41–62. doi: 10.46328/ijtes.518
Kaunang, F. J., and Rotikan, R. (2018). Students' academic performance prediction using data mining. In 2018 third international conference on informatics and computing (ICIC) (1–5).
Ke, G., Meng, Q., Finley, T., Wang, T., Chen, W., Ma, W., et al. (2017). LightGBM: a highly efficient gradient boosting decision tree. Adv. Neural Inf. Proces. Syst. 30, 3149–3157.
Kukkar, A., Mohana, R., Sharma, A., and Nayyar, A. (2023). Prediction of student academic performance based on their emotional wellbeing and interaction on various e-learning platforms. Educ. Inf. Technol. 28, 9655–9684. doi: 10.1007/s10639-022-11573-9
Kukkar, A., Mohana, R., Sharma, A., and Nayyar, A. (2024). A novel methodology using RNN+ LSTM+ ML for predicting student’s academic performance. Educ. Inf. Technol. 29, 14365–14401. doi: 10.1007/s10639-023-12394-0
Lee, C. A., Tzeng, J. W., Huang, N. F., and Su, Y. S. (2021). Prediction of student performance in massive open online courses using deep learning system based on learning behaviors. Educ. Technol. Soc. 24, 130–146.
Liang, G., Jiang, C., Ping, Q., and Jiang, X. (2024). Academic performance prediction associated with synchronous online interactive learning behaviours based on the machine learning approach. Interact. Learn. Environ. 32, 3092–3107. doi: 10.1080/10494820.2023.2167836
Liu, J., and Xu, Y. (2022). T-friedman test: a new statistical test for multiple comparison with an adjustable conservativeness measure. Int. J. Comput. Intell. Syst. 15:29. doi: 10.1007/s44196-022-00083-8
Lundberg, S. M., and Lee, S.-I. (2017). A unified approach to interpreting model predictions. Adv. Neural Inform. Proces. Syst. 30, 4765–4774.
Mahawar, K., and Rattan, P. (2025). Empowering education: harnessing ensemble machine learning approach and ACO-DT classifier for early student academic performance prediction. Educ. Inf. Technol. 30, 4639–4667. doi: 10.1007/s10639-024-12976-6
Manigandan, E., Anispremkoilraj, P., Kumar, B. S., Satre, S. M., Chauhan, A., and Jeyaganthan, C. (2024). An effective BiLSTM-CRF based approach to predict student achievement: an experimental evaluation. In 2024 2nd international conference on intelligent data communication technologies and internet of things (IDCIoT) (pp. 779–784). IEEE.
Nabil, A., Seyam, M., and Abou-Elfetouh, A. (2021). Prediction of students’ academic performance based on courses’ grades using deep neural networks. IEEE Access 9, 140731–140746. doi: 10.1109/ACCESS.2021.3119596
Nurudeen, A. H., Fakhrou, A., Lawal, N., and Ghareeb, S. (2024). Academic performance of engineering students: a predictive validity study of first-year GPA and final-year CGPA. Eng. Rep. 6:e12766. doi: 10.1002/eng2.12766
Penick, J. E., and Brewer, J. K. (1972). The power of statistical tests in science teachnig research. J. Res. Sci. Teach. 9, 377–381. doi: 10.1002/tea.3660090410
Prokhorenkova, L., Gusev, G., and Vorobev, A. (2018). CatBoost: gradient boosting on decision trees with categorical features support. Proceedings of the 2nd ACM SIGKDD international conference on knowledge discovery and data mining, 1125–1134.
Raji, N. R., Kumar, R. M. S., and Biji, C. L. (2024). Explainable machine learning prediction for the academic performance of deaf scholars. IEEE Access 12, 23595–23612.
Rodríguez-Hernández, C. F., Musso, M., Kyndt, E., and Cascallar, E. (2021). Artificial neural networks in academic performance prediction: systematic implementation and predictor evaluation. Comput. Educ. Artif. Intell. 2:100018. doi: 10.1016/j.caeai.2021.100018
Sarker, S., Paul, M. K., Thasin, S. T. H., and Hasan, M. A. M. (2024). Analyzing students' academic performance using educational data mining. Comput. Educ. Artif. Intell. 7:100263. doi: 10.1016/j.caeai.2024.100263
Sateesh, N., Rao, P. S., and Lakshmi, D. R. (2023). Deep belief bi-directional LSTM network-based intelligent student's performance prediction model with entropy weighted fuzzy rough set mining. Int. J. Intell. Inf. Database Syst. 16, 107–142. doi: 10.1504/IJIIDS.2023.131411
Shaninah, F. S. E., and Mohd Noor, M. H. (2024). The impact of big five personality trait in predicting student academic performance. J. Appl. Res. High. Educ. 16, 523–539. doi: 10.1108/JARHE-08-2022-0274
Shen, Y. (2024). Using long short-term memory networks (LSTM) to predict student academic achievement: dynamic learning path adjustment. In Proceedings of the 2024 international conference on machine intelligence and digital applications (627–634).
Si, S., Zhang, S., and Keerthi, S. S. (2017). Histogram-based gradient boosting for categorical and numerical features. Proceedings of the 23rd ACM SIGKDD international conference on knowledge discovery and data mining, 765–774
Waheed, H., Hassan, S. U., Aljohani, N. R., Hardman, J., Alelyani, S., and Nawaz, R. (2020). Predicting academic performance of students from VLE big data using deep learning models. Comput. Human Behav. 104:106189. doi: 10.1016/j.chb.2019.106189
Wang, X., Zhao, Y., Li, C., and Ren, P. (2023). ProbSAP: a comprehensive and high-performance system for student academic performance prediction. Pattern Recogn. 137:109309. doi: 10.1016/j.patcog.2023.109309
Keywords: student academic outcome, XAI, SHAP, Bi-LSTM, student dropout, statistical test
Citation: Kalita E, Alfarwan AM, El Aouifi H, Kukkar A, Hussain S, Ali T and Gaftandzhieva S (2025) Predicting student academic performance using Bi-LSTM: a deep learning framework with SHAP-based interpretability and statistical validation. Front. Educ. 10:1581247. doi: 10.3389/feduc.2025.1581247
Edited by:
Antonino Ferraro, Pegaso University, ItalyReviewed by:
Mostafa Aboulnour Salem, King Faisal University, Saudi ArabiaGail Augustine, Walden University, United States
Copyright © 2025 Kalita, Alfarwan, El Aouifi, Kukkar, Hussain, Ali and Gaftandzhieva. This is an open-access article distributed under the terms of the Creative Commons Attribution License (CC BY). The use, distribution or reproduction in other forums is permitted, provided the original author(s) and the copyright owner(s) are credited and that the original publication in this journal is cited, in accordance with accepted academic practice. No use, distribution or reproduction is permitted which does not comply with these terms.
*Correspondence: Silvia Gaftandzhieva, c2lzc2l5ODhAdW5pLXBsb3ZkaXYuYmc=