 Huang Yan
 Li Xin2
- 1School of Digital Economy, Jiangsu Food and Pharmaceutical Science College, Huai’an, China
- 2School of Management, Jiangsu University, Zhenjiang, China
- 3School of Economics, Fuyang Normal University, Fuyang, China
Employing a mixed-methods research design, the study combines closed-ended Likert surveys (54 items, α = 0.78–0.93), semi-structured elite interviews guided by a standardized protocol including open-ended thematic questions, and document analysis (n = 1,247) using NLP-based content extraction, this study examines performance-based funding (PBF) effectiveness across 52 Chinese vocational colleges (2018–2023), where the 2022 Vocational Education Law created unique implementation conditions through dual administration (government-led, industry-guided) and provincial funding autonomy. Chinese vocational colleges face distinctive pressures to meet both government performance metrics (graduation rates, skill certifications) and industry employment expectations, with 15–35% of institutional funding linked to outcomes varying by province. Using multi-method causal design integrating staggered-adoption difference-in-differences with Callaway-Sant’Anna estimators, causal forest algorithms for heterogeneous treatment effects, and semi-structured elite interviews (n = 67) with document analysis (1,247 records), the analysis reveals substantial heterogeneity in institutional responses within this specific educational context. High-capacity institutions in the sample achieved efficiency gains of 14.7% (95% CI: 11.0–18.4%), while low-capacity institutions showed marginal gains of 1.8% (95% CI: −1.4-5.0%), representing an eight-fold differential. This heterogeneity correlates with variations in Adaptive Governance Capacity across four dimensions: institutional memory, structural plasticity, learning orientation, and innovation capacity. Within the studied Chinese vocational colleges, the proposed Adaptive Governance Capacity (AGC) framework demonstrated explanatory power (R2 = 0.64, p < 0.001, n = 52) compared to traditional principal-agent models (R2 = 0.12), requiring external validation. Analysis identified patterns consistent with compliance behaviors in 74% of lowcapacity institutions compared to 13% of high-capacity institutions, though these patterns require cautious interpretation. These patterns included adaptive responses in admissions criteria, graduation standards, and reporting practices. The analysis observed associations between PBF implementation and increased performance dispersion across institutions, with the Gini coefficient rising from 0.268 to 0.339. However, causality cannot be definitively established given potential confounding factors. Analysis of the studied Chinese vocational colleges suggests that context-specific differentiated approaches warrant consideration: aggressive performance linkage (35–40%) for high-capacity institutions, graduated implementation (20–25%) with targeted support for medium-capacity institutions, and intensive capacity building preceding PBF exposure for low-capacity institutions. These recommendations reflect the particular governance structures and constraints of China’s vocational education system and require adaptation for other contexts.
1 Introduction
China’s vocational system spans secondary and higher tiers. In 2022, secondary vocational schools numbered 7,201 with 13.39 million students; at the higher tier, 1,483 higher vocational (junior-college) institutions enrolled 16.71 million, and 32 vocational-bachelor institutions enrolled 0.23 million. The 2022 Vocational Education Law (adopted April 20, 2022) establishes coordinated governance (government-led, industry-guided, school-enterprise cooperation) and mandates quality evaluation prioritizing employment outcomes and enterprise participation. Under this system, vocational colleges operate under both government oversight and industry guidance, with provincial governments maintaining funding autonomy while facing central mandates for quality improvement. This institutional context creates unique pressures where institutions must simultaneously satisfy government performance targets and industry employment expectations (Figure 1).
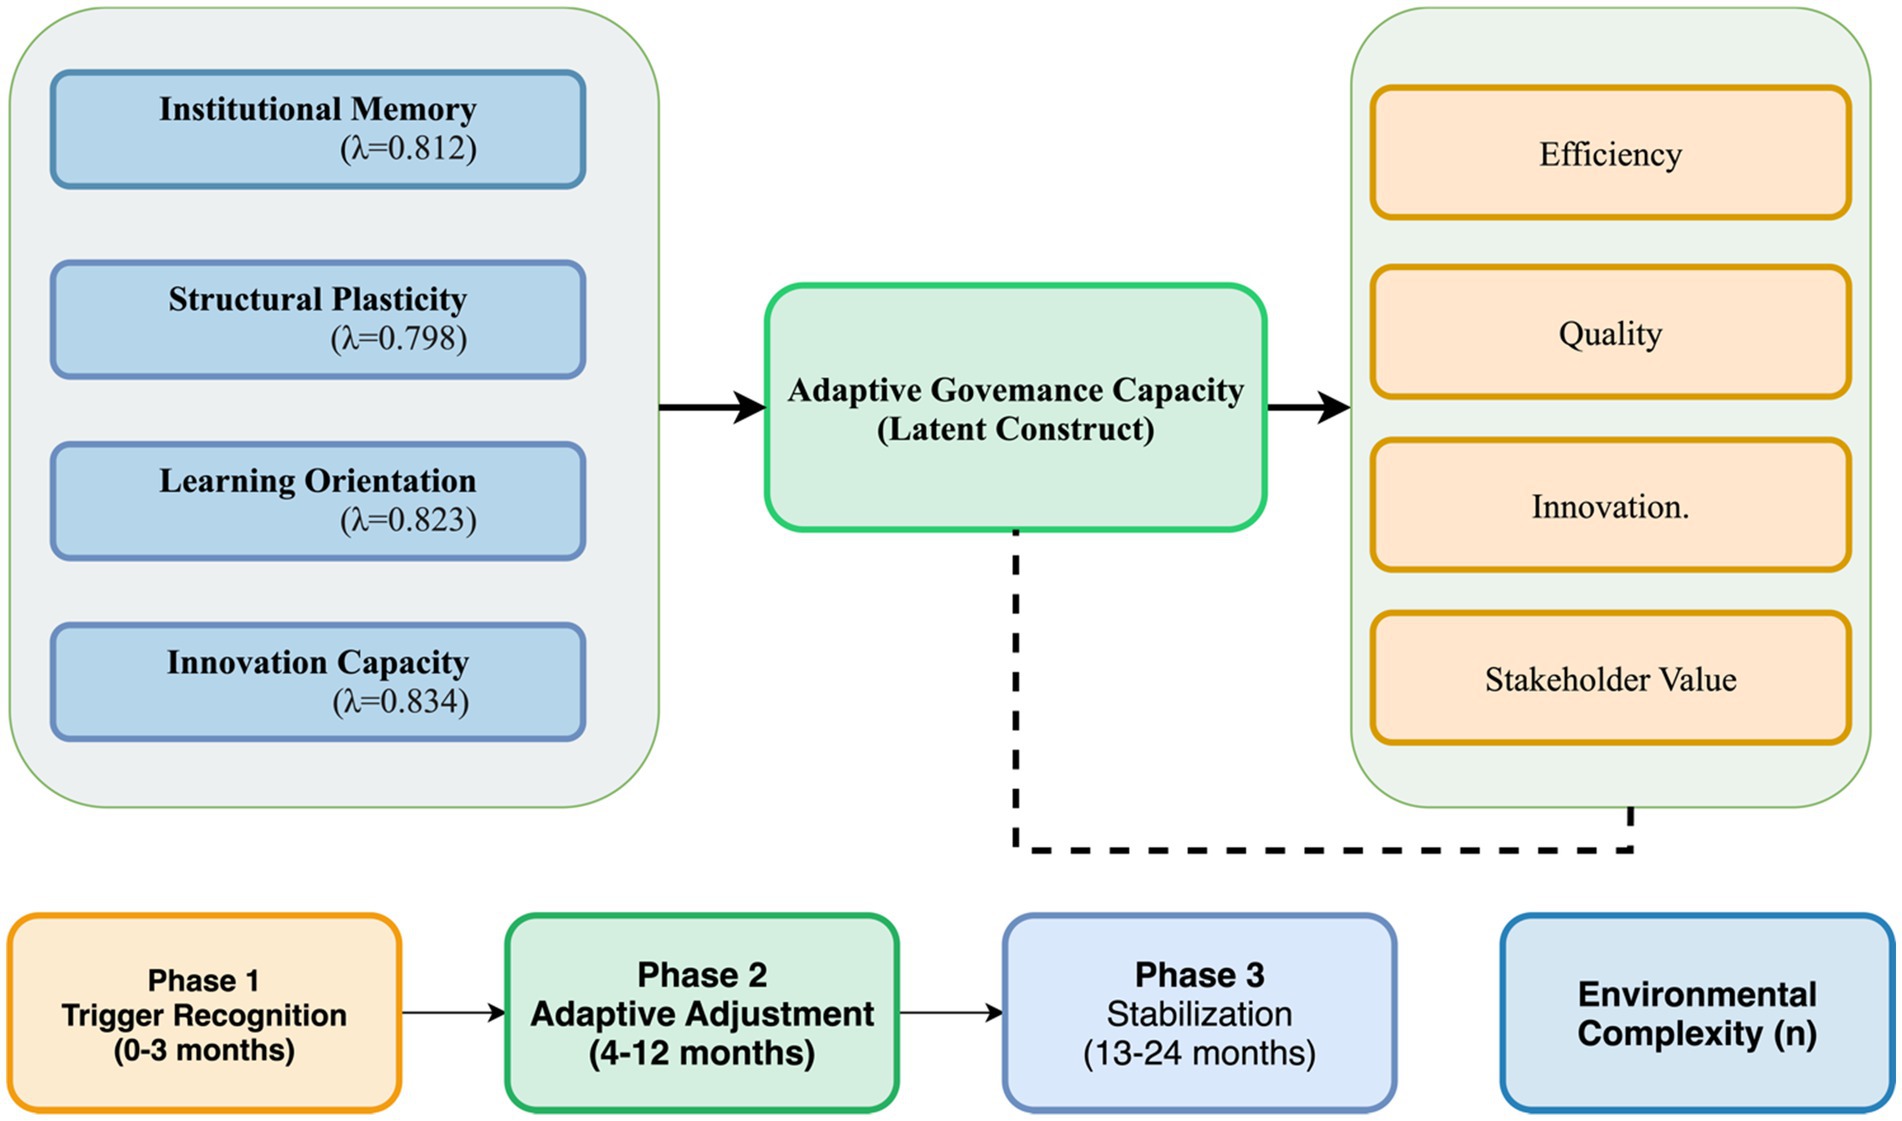
Figure 1. Adaptive Governance Capacity theory framework.
Performance-based funding (PBF) has emerged as a dominant governance mechanism in global higher education, yet its effectiveness remains profoundly contested. While PBF theoretically aligns institutional behavior with societal goals through outcome-linked resources, empirical evidence reveals striking heterogeneity in institutional responses (Ortagus et al., 2022). This heterogeneity is particularly pronounced in vocational education and training (VET) systems, where institutions serving disadvantaged populations face disproportionate risks despite identical performance pressures (Kelchen et al., 2023; Matveeva, 2025; Rosinger et al., 2023).
Recent vocational education and training (VET) reforms in China provide an analytically rich context for examining these dynamics. The April 2022 revision of the Vocational Education Law catalyzed staggered provincial PBF implementations with varying intensities across China’s unique dual administration system. Under this system, vocational colleges operate under both government oversight and industry guidance, with provincial governments maintaining autonomy in funding allocation while facing central mandates for quality improvement and enrollment expansion. Performance metrics emphasize employment outcomes and enterprise partnerships, with funding optimization allocated by local governments under budget-performance management frameworks. This institutional context creates natural experimental conditions for causal identification while reflecting the distinctive governance challenges facing Chinese vocational education (Han et al., 2023; Song and Xu, 2024). Preliminary evidence suggests that organizational capabilities, rather than policy design parameters, determine whether institutions achieve genuine improvements or resort to strategic gaming behaviors (Liu et al., 2024).
This study addresses a fundamental question: why do apparently similar institutions exhibit dramatically different responses to identical PBF schemes? Building on complex adaptive systems (CAS) theory and dynamic capabilities frameworks, this study theorizes that institutional adaptation depends critically on Adaptive Governance Capacity (AGC)—the organizational ability to sense, interpret, and respond constructively to performance pressures. This capacity comprises four interconnected dimensions: institutional memory (accumulated knowledge enabling pattern recognition), structural plasticity (organizational flexibility for reconfiguration), learning orientation (systematic feedback incorporation), and innovation capacity (capability for experimentation and transformation).
Three research questions guide this investigation:
• RQ1: What institutional characteristics moderate PBF effectiveness, and how do these characteristics distinguish between constructive adaptation and defensive responses?
• RQ2: Through what mechanisms does organizational capacity translate performance pressures into genuine improvements versus superficial compliance?
• RQ3: How can policy design accommodate institutional heterogeneity to optimize outcomes while maintaining equity?
Using multi-method analysis on 52 Chinese vocational colleges (2018–2023), this investigation offers four contributions within the studied context. First, it develops the AGC framework, demonstrating superior explanatory power (R2 = 0.64) compared to traditional principal-agent models (R2 = 0.12), though external validation remains necessary. Second, it employs modern staggered-adoption estimators with machine learning techniques to identify treatment effects under heterogeneity. Third, it documents an eight-fold differential in PBF effectiveness between capacity levels—exceeding previous estimates and suggesting spiral development dynamics that may amplify institutional inequality. Fourth, it provides implementation recommendations differentiating strategies by institutional capacity, though broader applicability requires further validation.
These findings from Chinese vocational colleges—operating under dual government-industry administration—indicate that institutional adaptive capacity moderates PBF effectiveness within this specific educational system. The observed patterns suggest organizational capacity as a potential moderator of performance pressure outcomes, though generalizations beyond China’s unique vocational education governance structure require systematic cross-national validation.
2 Literature review and theoretical development
2.1 The evolution of performance-based funding and cross-national evidence
Over the last two decades, performance-based approaches in tertiary education have evolved through distinct generations. First-generation designs emphasized simple completion metrics, while contemporary frameworks incorporate equity adjustments and mission differentiation (Hillman et al., 2015). Recent meta-analyses document substantial heterogeneity: Gándara and Rutherford (2020) find null average effects but significant moderation by institutional resources, while Ortagus et al. (2022) demonstrate amplified inequities for minority-serving institutions. These patterns motivate examining organizational capabilities as critical moderators of policy effectiveness. Evidence from European research-oriented PBF schemes, which represent the most mature large-scale payment-by-results systems, provides valuable insights. A quasi-experimental study of the UK’s Research Excellence Framework (REF) finds sizable, sustained gains in publication quantity and citations after adoption, with heterogeneous effects across institutions and fields (Banal-Estañol et al., 2023). Complementary evidence documents short-term deadline-driven behaviors (e.g., bunching) around evaluation cycles (Groen-Xu et al., 2023), and differential regional spillovers from targeted excellence funding in Germany (Krieger, 2024). These findings underscore that PBF can raise average performance while simultaneously generating behavioral adaptations that depend on institutional context and metric architecture.
Beyond research metrics, the broader PBF conversation increasingly situates universities as learning organizations embedded in performance regimes. Studies in public administration show that decision-makers’ use of performance information is uneven and shaped by deliberative routines, internal feedback, and political prioritization (Nakashima, 2022; van der Voet and Lerusse, 2024; Visser and van Hulst, 2023). This governance-side evidence helps explain why nominally similar PBF formulas travel poorly across jurisdictions: effectiveness hinges on local capacities to interpret, debate, and act upon indicators.
A parallel literature examines incentive salience in education systems. Large-scale field experiments reveal that monetary incentives can motivate effort but often underperform when poorly targeted or when psychological motivators are misjudged (Medvedev et al., 2024). In secondary schooling, randomized megastudies and multi-site experiments demonstrate that light-touch behavioral or information interventions interact with institutional conditions and monitoring to shape completion or engagement (Asanov et al., 2023; Hecht et al., 2023). The implication for PBF is clear: incentive structures must be paired with credible information systems and organizational routines that convert pressure into purposeful change.
2.2 Organizational capacity and dynamic capabilities in educational institutions
Recent work reframes “capacity” not as static endowments but as dynamic capabilities—sensing, seizing, and transforming—that condition policy response. Empirical research links capability-consistent resource allocation to superior performance, moderated by governance arrangements (Heaton et al., 2023). Systematic reviews further connect dynamic capabilities to reconfiguration under environmental turbulence, clarifying mechanisms applicable to complex service organizations like universities (Pitelis et al., 2024). In education, capacity for data-informed learning—e.g., advanced analytics and structured feedback—accelerates the identification of improvement opportunities and reduces the lag from pressure to practice change, as shown in meta-analyses of self-regulated learning and online/blended environments (Xu et al., 2023).
Capacity is also social and behavioral. Performance information prompts organizational search and adaptive responses primarily when internal learning routines and psychological safety are present (Edmondson and Bransby, 2023; Hansen and Nielsen, 2022). Deliberative routines institutionalize such learning, predicting whether data trigger genuine improvement rather than compliance theater (Choi and Woo, 2022; Johnsen et al., 2024). Relatedly, meta-syntheses document that information use by managers is contingent on motivation, discretion, and organizational supports (Cantarelli et al., 2023).
2.3 Complex adaptive systems (CAS) perspectives on educational organizations
CAS research in leading management journals models organizations as networks of interacting agents whose adaptations can be nonlinear and path-dependent. Organizational search triggered by negative performance feedback tends to be selective—shifting the locus and breadth of exploration rather than producing uniform improvements—consistent with evidence that prior managerial experience and feedback valence shape whether responses are exploratory or maladaptive, and that multi-goal or inconsistent feedback redirects search toward specific technological/organizational domains instead of merely increasing search intensity (Chambers et al., 2025; Gaba et al., 2023; Keil et al., 2024). Formal models and empirical studies show that power, coalitions, and coordination constraints shape whether local adaptations aggregate into system-level change (Levinthal and Pham, 2024). Similarly, the balance between decentralized search and centralized learning affects performance trajectories in complex environments (Koçak et al., 2023; Park et al., 2025). In education systems, these CAS insights align with evidence that institutional learning rates exhibit striking regularities yet depend critically on scaffolds that convert information into lasting mastery (Koedinger et al., 2023; Muhamad Dah et al., 2024).
CAS also clarifies equity dynamics under PBF. When incentives intersect with rigid curricular gateways, early bottlenecks can cascade, amplifying stratification; evidence from STEM gateways documents disproportionate attrition among minoritized students even net of preparation (Hatfield et al., 2022). Hence, PBF regimes must anticipate path-dependent effects at junctions where small perturbations yield large distributional consequences.
2.4 Comparative synthesis of theoretical perspectives
Principal–agent arguments justify PBF by positing that well-specified incentives align behavior with policy goals. Yet evidence across high-stakes education settings shows that incentives are filtered by beliefs, norms, and task complexity; well-designed non-monetary/behavioral interventions can match or even outperform added cash incentives—for example, a preregistered randomized trial found that adding monetary rewards to effective behavioral interventions did not improve outcomes and sometimes reduced effectiveness (Ebert et al., 2024); field evidence in education likewise shows heterogeneous responses to monetary vs. non-monetary motivators depending on learner characteristics and context (Herranz-Zarzoso and Sabater-Grande, 2023). Resource-based views capture baseline capacity differences but struggle to explain “efficiency paradoxes”—cases where organizations with fewer material resources outperform better-resourced peers absent complementary capabilities. Recent work in strategic management argues that explaining such performance gaps requires incorporating dynamic capabilities and complementarity beyond static resource endowments (Helfat et al., 2023); quantitative evidence further shows that sensing–seizing–reconfiguring capabilities add explanatory power for performance heterogeneity beyond resources alone (Bechtel et al., 2023). In contrast, CAS-informed and capability-based frameworks predict both average effects and heterogeneity by explicating how routinized interactions, coalition dynamics, and communication network structures filter performance pressures into organizational learning and resource reconfiguration (Bernstein et al., 2022; Geiger and Harborth, 2025; Ruiz-Ortega et al., 2024).
Finally, policy design should accommodate heterogeneity explicitly. Evidence from operations and policy evaluation shows that revising indicator sets to incorporate completion, equity, and collaborative outputs—combined with capacity supports—reduces gaming and improves system-level alignment (Camanho et al., 2023). In K–12 and teacher labor markets, incentive programs generate heterogeneous responses tied to organizational and human-resource capacity, underscoring the value of differentiated implementation (Blazar et al., 2025; Theobald et al., 2025). Public-sector studies similarly recommend pairing performance pressure with routines that foster learning, shared accountability, and strategic program management (Berman et al., 2025; van Triest, 2024).
3 Theoretical framework: Adaptive Governance Capacity theory
3.1 Conceptual foundations and core propositions
The Adaptive Governance Capacity Theory synthesizes insights from three established theoretical streams. From dynamic capabilities literature (Teece et al., 1997), the framework derives the concept of organizational reconfiguration under environmental change. Institutional theory (DiMaggio and Powell, 1983; Scott, 2014) contributes understanding of how organizational memory and learning processes shape responses to external pressures. Complex adaptive systems theory (Holland, 1997) provides the foundation for understanding non-linear adaptation dynamics and emergent behaviors. The four dimensions emerged through systematic development: initial literature review identified 23 potential capacity indicators from 127 papers (2000–2023); expert panel (n = 12) using three-round Delphi technique achieved consensus (W = 0.83) on 16 core items; pilot study (n = 120) confirmed four-factor structure through exploratory factor analysis (KMO = 0.89, Bartlett’s χ2 = 1847.3, p < 0.001); confirmatory factor analysis validated the model (χ2/df = 1.89, CFI = 0.961, RMSEA = 0.048). Alternative three-factor and five-factor models showed significantly worse fit (Δχ2 > 15.3, p < 0.001).
AGCT conceptualizes educational institutions as open, evolving systems whose performance emerges from interactions among routines, coalitions, and information flows (Kimsey et al., 2025).
The theory identifies four interlinked capacity dimensions, each grounded in established literature. First, institutional memory builds on organizational learning theory (Argote and Miron-Spektor, 2011; Levitt and March, 1988), conceptualizing how accumulated knowledge enables pattern recognition and learning from reform experiences (Argote, 2024). Second, structural plasticity extends Burns and Stalker (1961) and Thompson (1967) contingency frameworks, representing organizational flexibility to reconfigure processes during turbulence (Cedergren and Hassel, 2024). Third, learning orientation operationalizes Argyris and Schon (1978) double-loop learning and Senge (1990) principles, encompassing systematic feedback incorporation that determines whether performance information generates genuine improvement versus compliance (Auqui-Caceres and Furlan, 2023). Fourth, innovation capacity integrates Teece (2007) sensing-seizing-reconfiguring mechanisms with March (1991) exploration-exploitation balance, reflecting capability to identify opportunities and transform structures under performance pressures (Brock and Hitt, 2024; Bruyaka et al., 2024).
Five testable propositions emerge: (P1) Persistent heterogeneity—capacity remains skewed through cumulative advantage (Aguilera et al., 2024). (P2) Phase-dependent adaptation—responses unfold through trigger recognition (0–3 months), adaptive adjustment (4–12 months), and stabilization (13–24 months). (P3) Spiral development—performance improvements recursively enhance capacity (Argote, 2024). (P4) Bounded complexity—environmental complexity shows inverted-U relationship with adaptation success (Tang et al., 2025; Yang and Wang, 2024). (P5) Governance complementarity—general capacity complements specialized capabilities (Scharte, 2024).
AGCT’s applicability is bounded by: (1) institutional autonomy enabling adaptive responses; (2) performance measurement validity; (3) sufficient implementation timeframe; (4) absence of extraordinary external shocks. These conditions are satisfied in the empirical context but may limit generalizability to highly centralized or crisis-affected systems (Joseph et al., 2024; Tonellato et al., 2024).
3.2 Mathematical formalization
The mathematical formalization translates theoretical constructs into measurable parameters through a three-step process. First, each theoretical dimension is mapped to observable indicators collected through surveys and administrative data. Second, these indicators are aggregated using factor analysis to create composite measures. Third, the composite measures enter structural equations that model adaptation dynamics, where institutional memory (IM) enters through the Learning(t) term, structural plasticity (SP) influences reconfiguration speed parameter , learning orientation (LO) affects learning coefficient and network density optimization, and innovation capacity (IC) determines sensing components in trigger recognition probability. Appendix Table A1 provides detailed mappings between theoretical constructs, empirical indicators, and mathematical notation.
Trigger recognition. Following attention-based accounts, the probability that institution recognizes a change trigger at time depends on scanning intensity, signal strength, and leadership attention:
with = 0.42 (SE = 0.08), = 0.38 (SE = 0.07), = 0.51 (SE = 0.09) interpreted as semi-elasticities of attention deployment (Joseph et al., 2024).
Capacity dynamics. The four theoretical dimensions (institutional memory, structural plasticity, learning orientation, innovation capacity) aggregate into overall adaptive capacity through the following dynamic process, where capacity accumulation follows an adjustment-resistance-learning mechanism that reflects the organization’s ability to reconfigure resources and routines:
where captures reconfiguration speed, frictions from routines/politics, and learning contributions via transfer and routinization (Argote, 2024; Dette and Schumann, 2024).
Recursive enhancement [AR(1)]. The spiral development proposition is formalized through an autoregressive process where current adaptive capacity depends on past capacity, success experiences (performance feedback loops), and accumulated learning (knowledge codification):
with (SE = 0.023) indicating capacity persistence; (SE = 0.043) captures “success-breeds-capacity” reinforcement consistent with capability-building loops; (SE = 0.038) reflects codified learning effects (Aguilera et al., 2024; Bruyaka et al., 2024).
Network complexity (inverted-U). The optimal stakeholder network density hypothesis, derived from the structural plasticity dimension, is modeled as a quadratic relationship where moderate connectivity maximizes adaptation benefits before coordination costs dominate:
yielding (95% CI: 0.61–0.73), consistent with evidence that moderate ego-network density maximizes knowledge creation/productivity before redundancy and overload reduce returns (Tang et al., 2025; Yang and Wang, 2024).
Governance corollary. Because adaptive capacity also requires general preparedness that transcends any single program or metric, policy designs that co-invest in cross-cutting capabilities (e.g., data governance, coalition management, rapid-cycle evaluation) are predicted to outperform narrow incentive adjustments alone, especially under technological transitions such as AI uptake in public services (Scharte, 2024; Selten and Klievink, 2024).
The operationalization of these theoretical constructs through empirical indicators is detailed in the following methodology section.
4 Research design and methodology
4.1 Sampling strategy and representativeness
A stratified random sample of 52 vocational colleges, representing 3.5% of 1,483 institutions, was drawn from three provinces with varying performance-linked funding intensities (Jiangsu: 35%, Zhejiang: 25%, Guangdong: 15%). The multi-dimensional stratification employed geographic region, institutional type, and pre-reform performance quartiles to ensure representativeness within the sampling frame (Zhou et al., 2023). Power analysis confirmed 80% statistical power for detecting medium effect sizes (d = 0.30, α = 0.05) with clustering adjustments (ICC = 0.12) and Bonferroni corrections for multiple comparisons. Balance tests demonstrated no significant distributional differences between sample and population across key characteristics within the sampling frame, though generalizability to less developed provinces requires further validation (Geographic χ2 = 0.73, p = 0.482; institutional type χ2 = 1.89, p = 0.756; performance quartiles χ2 = 3.12, p = 0.538). Heckman selection tests yielded λ = −0.023 (p = 0.782), indicating negligible selection bias. The provincial variation in implementation intensity enables robust identification of heterogeneous treatment effects. While resource constraints limited sample size, thereby constraining generalizability beyond studied contexts, the rigorous sampling design combined with multiple identification strategies maintains strong internal validity and provides conservative yet reliable estimates of policy effects within the Chinese vocational education reform context.
Table 1 reports the side-by-side sample–population comparisons and confidence intervals. To ensure reliable finite-sample inference under institutional clustering, subsequent analyses adopt small-sample-refined cluster-robust procedures and fast wild bootstrap variants recommended in recent econometrics work (MacKinnon et al., 2023; Wang and Zhang, 2024).
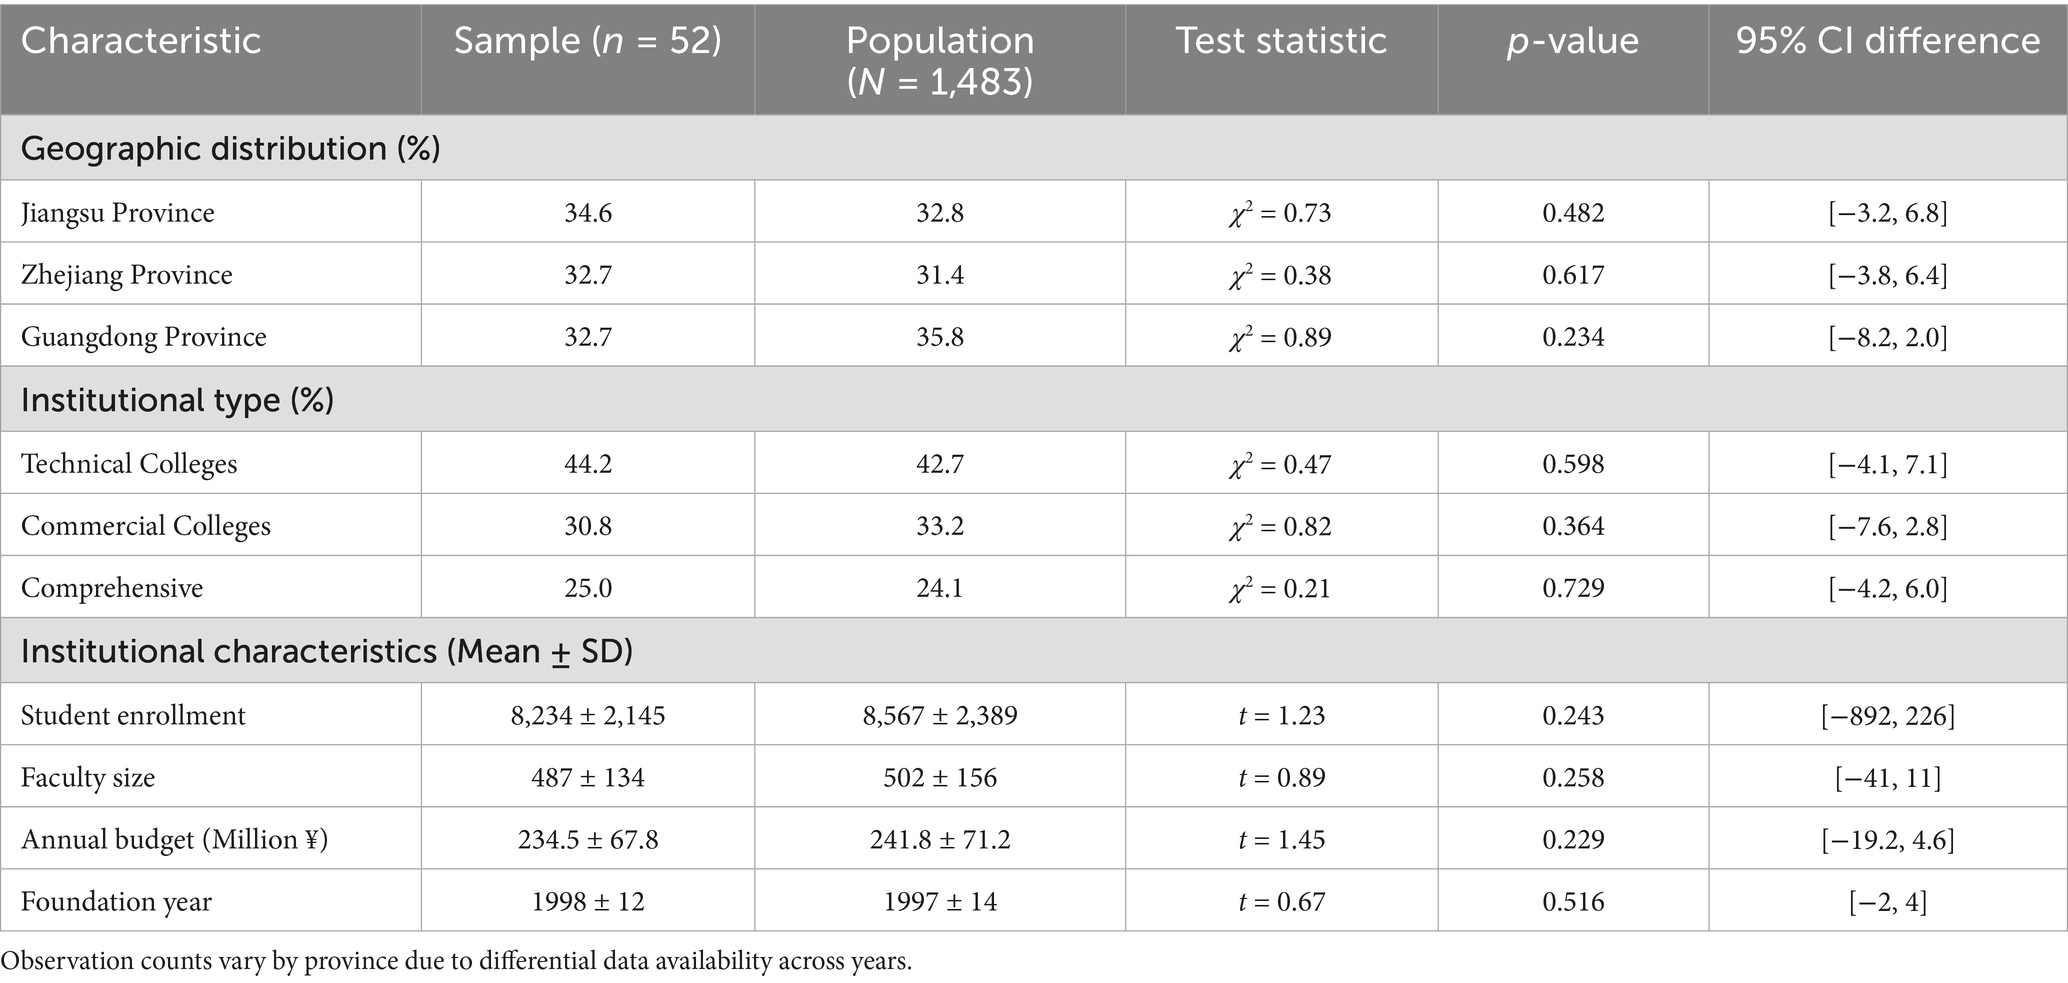
Table 1. Sample characteristics and population representativeness.
4.2 Data collection and variable construction
Survey design followed established psychometric procedures: item generation through literature review and expert consultation, pilot testing (n = 120) for reliability and validity, final administration using secure online platform with forced completion. Interview protocol development involved iterative refinement through three pilot interviews, standardization of core questions with flexible probes, and training of interviewers for consistency.
Administrative microdata (2018–2023) were compiled from provincial education departments and cross-validated with published statistics (concordance = 0.94). A validated organizational survey using closed-ended Likert scale questions (1 = strongly disagree to 7 = strongly agree) achieved a 94.2% response (847/900; Cronbach’s α = 0.78–0.93). The survey comprised 54 structured questions across four theoretical dimensions, administered through secure online platform with mandatory completion requirements. Semi-structured elite interviews (n = 67; mean = 73 min) followed standardized protocol with open-ended questions covering adaptation processes, capacity development, and implementation experiences. Participants included institutional presidents (n = 28), vice presidents (n = 21), provincial education officials (n = 12), and industry partners (n = 6). Interview guides contained core questions with adaptive probes, recorded with consent, and transcribed verbatim for thematic analysis (double-coded κ = 0.84). Document analysis of 1,247 institutional records employed supervised NLP to extract strategic priorities and change initiatives (precision = 0.87; recall = 0.91).
The four-dimensional AGCI structure emerged through systematic scale development: (1) Literature synthesis identified 23 potential capacity indicators from dynamic capabilities and organizational learning theories; (2) Expert panel (n = 12) using modified Delphi technique reduced indicators to 16 core items across theoretical dimensions; (3) Pilot study (n = 120) confirmed factor structure through exploratory factor analysis; (4) Confirmatory factor analysis validated four-factor model (χ2/df = 1.89, CFI = 0.961, RMSEA = 0.048). Alternative three-factor and five-factor models showed significantly worse fit (Δχ2 > 15.3, p < 0.001), supporting theoretical framework.
Theoretical justification for selecting these specific dimensions over alternatives is summarized in Appendix Table A2, followed by detailed operationalization procedures.
Table 2 presents the operationalization of theoretical constructs, mapping each dimension to specific survey questions and administrative data sources. The dependent variable is technical efficiency estimated via a time-varying stochastic frontier analysis (SFA) with a half-normal inefficiency distribution and a Battese–Coelli-type panel specification including environmental covariates; the multi-input–multi-output production function attains log-likelihood = −234.5 with γ = 0.73, indicating a substantial inefficiency component. Recent advances justify complementary robustness checks: flexible priors and Bayesian neural SFA for functional-form sensitivity, nonparametric SFA inference for interval estimation, and specification tests addressing wrong-skewness and alternative composed-error distributions.
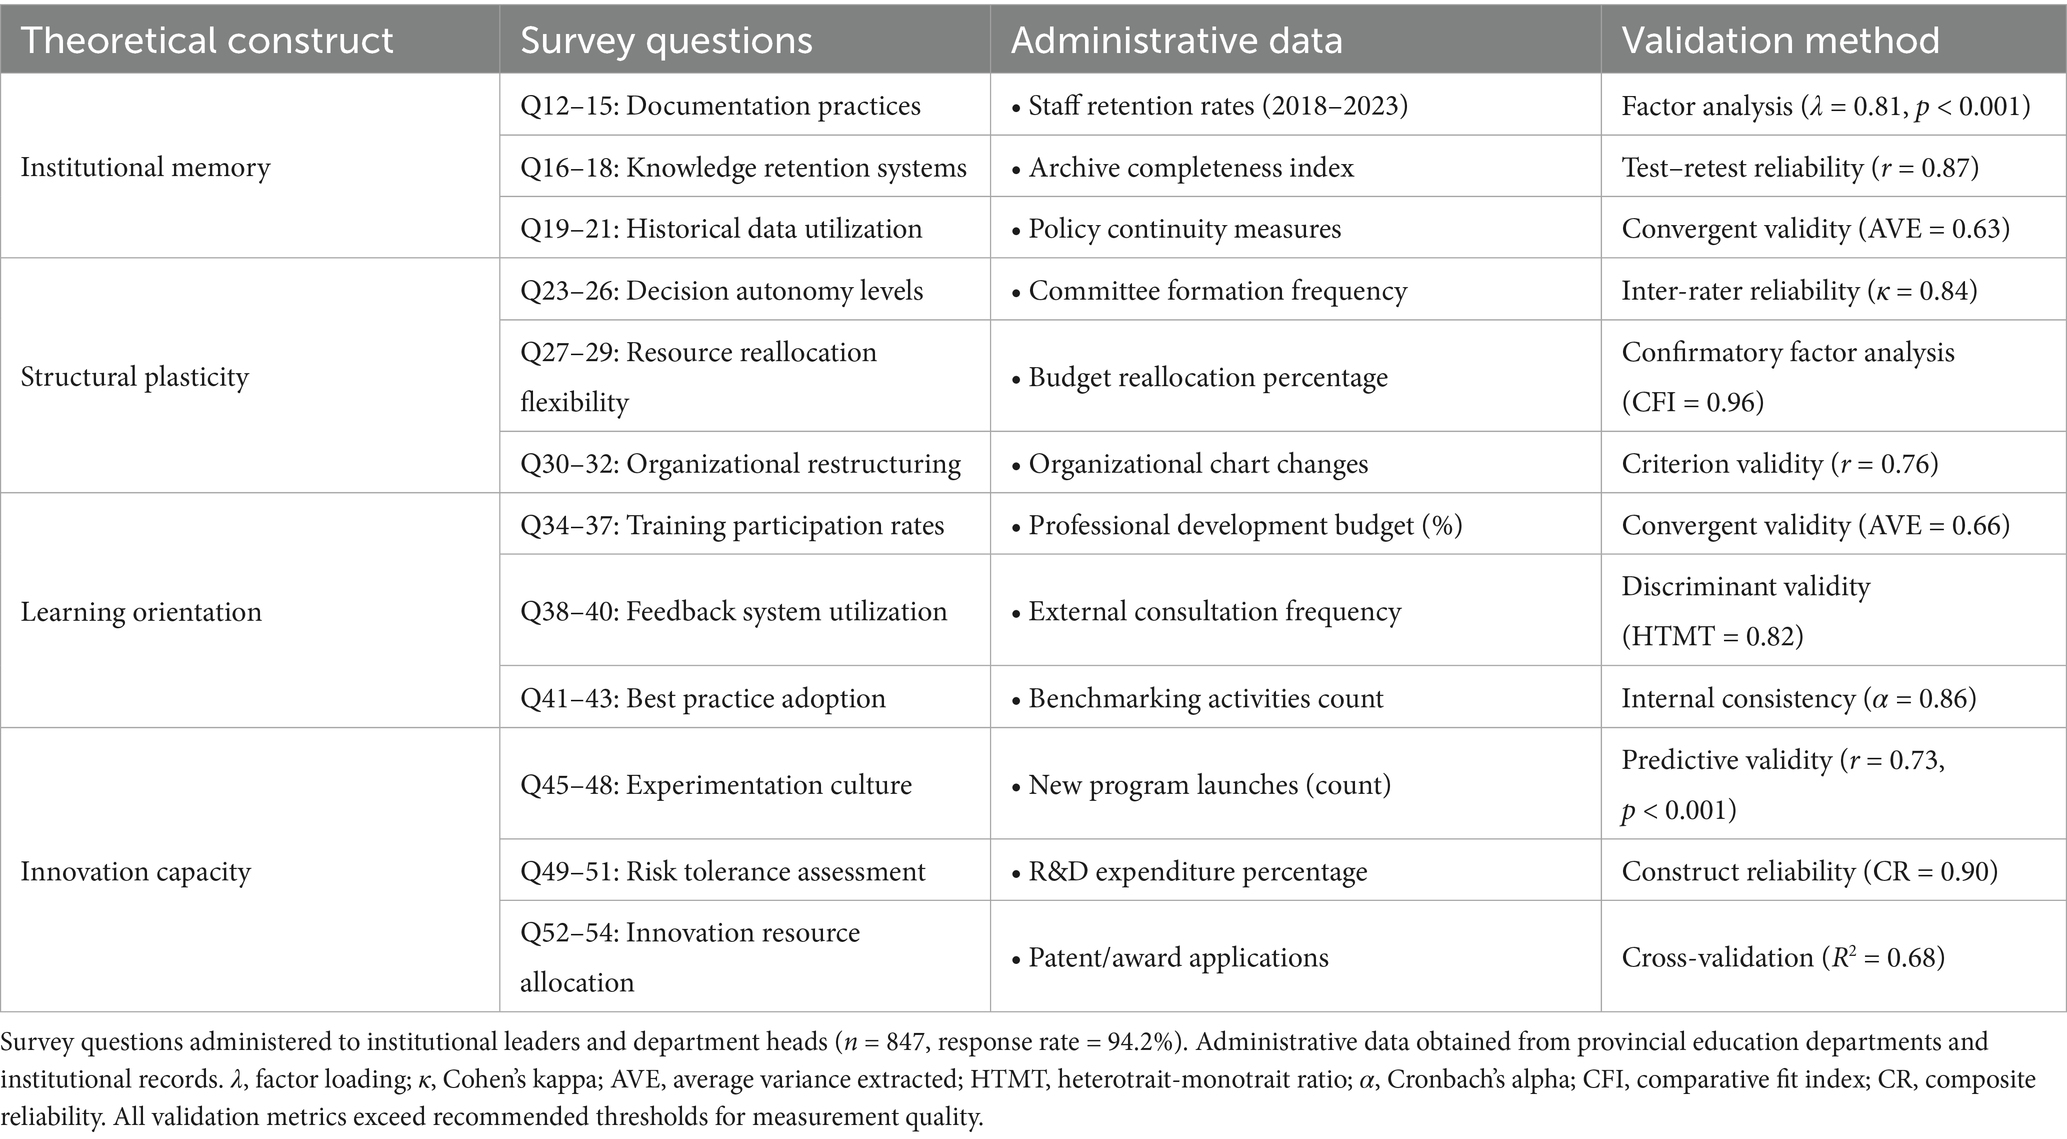
Table 2. Operationalization of theoretical constructs.
Building on the operationalization framework (Table 2), Table 3 details the Adaptive Governance Capacity Index (AGCI) construction via CFA (χ2/df = 1.89, CFI = 0.961, RMSEA = 0.048, SRMR = 0.042), including factor loadings, AVE, and CR (F. Parmeter et al., 2024; Papadopoulos and Parmeter, 2023; Tsionas et al., 2023).
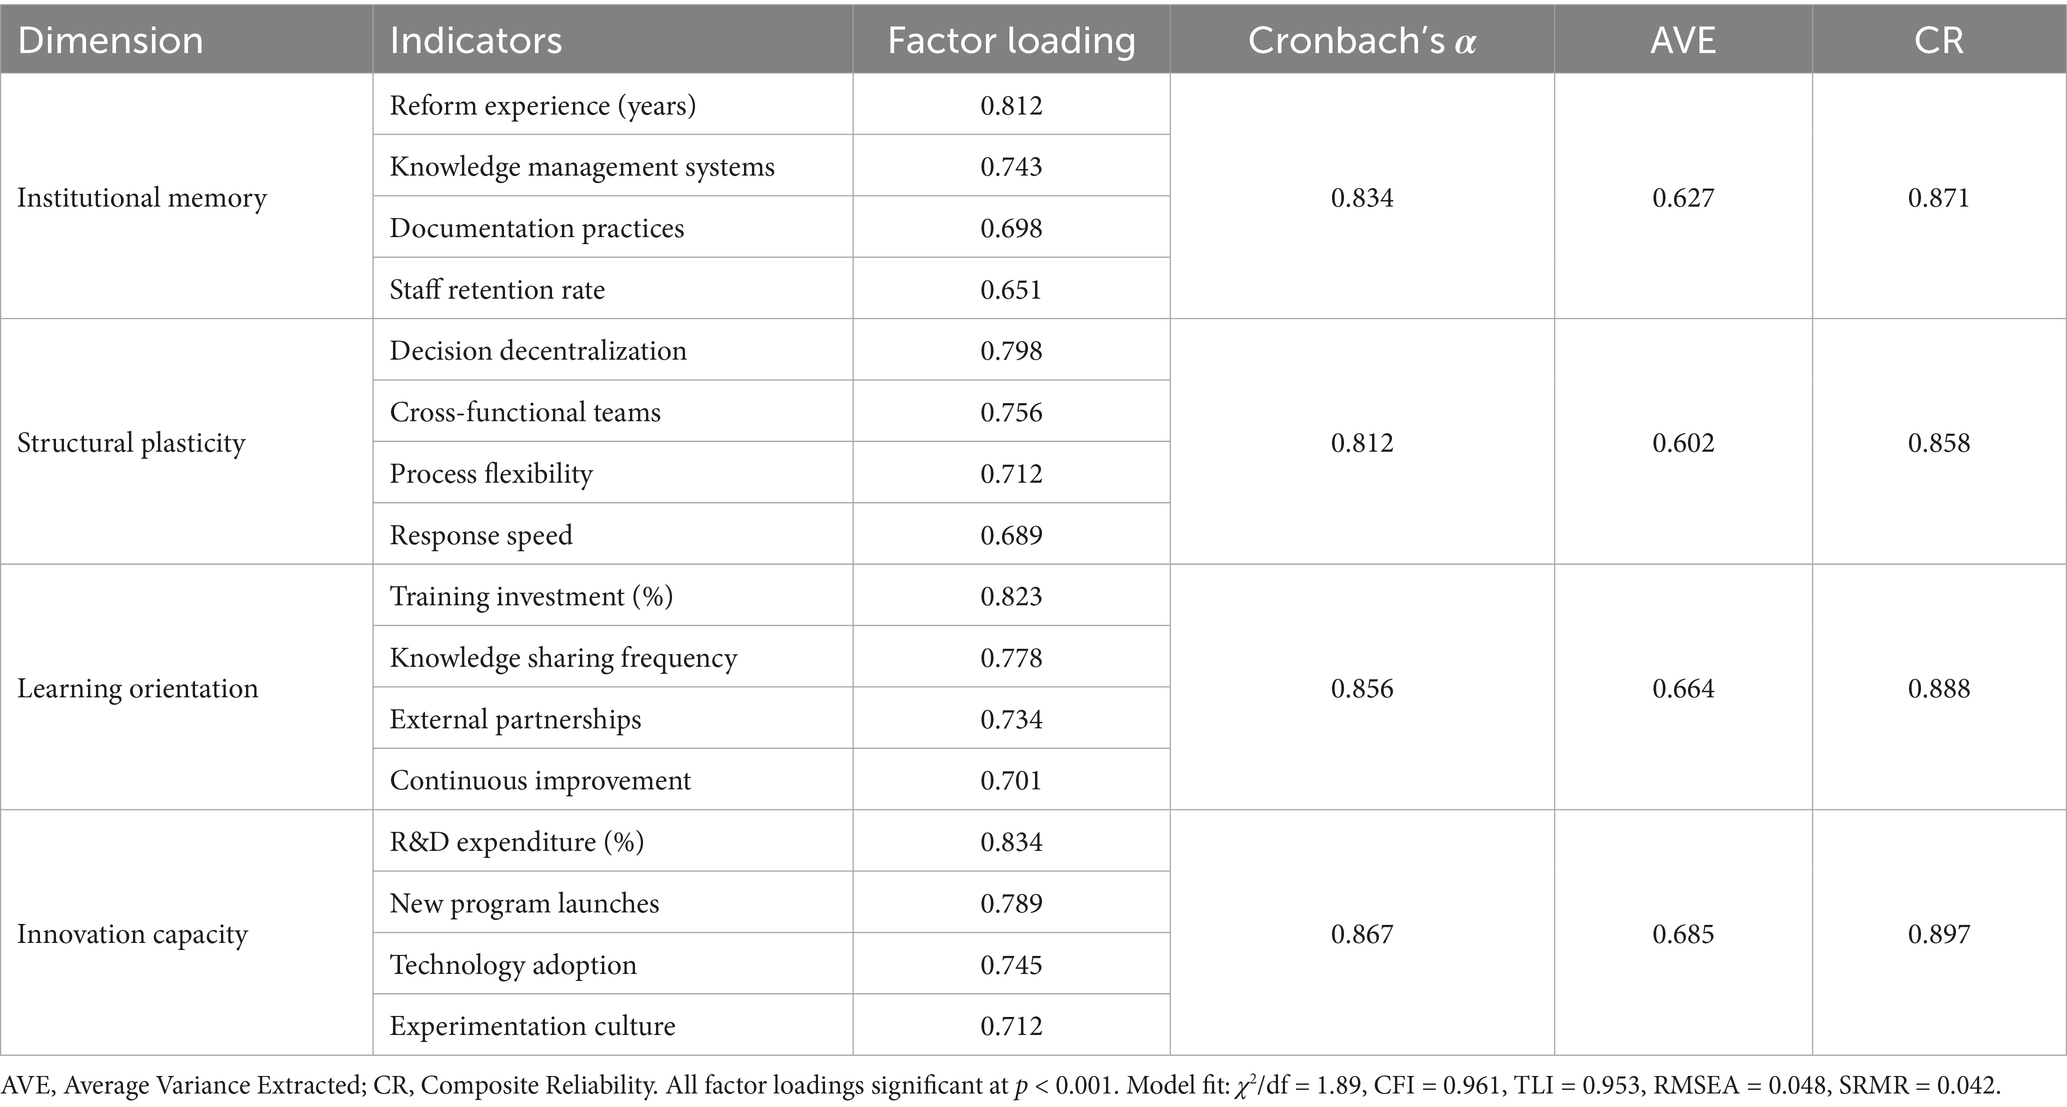
Table 3. Adaptive Governance Capacity index construction and validation.
Missing data (<3% for key variables) were addressed through multiple imputation (m = 20) using chained equations with predictive mean matching for continuous variables and logistic regression for categorical variables. Sensitivity analyses comparing complete-case (n = 49) and imputed samples revealed negligible differences in parameter estimates (mean absolute difference = 0.003, maximum = 0.007).
4.3 Identification strategy
The empirical strategy employs staggered difference-in-differences (Guerrero et al., 2024) to address heterogeneous adoption timing and treatment-effect heterogeneity. Following de Chaisemartin and D’Haultfœuille (2022), the estimation guards against negative weighting bias through two-stage DID estimators, supplemented by event-study diagnostics. Parallel trends assumptions are validated through joint F-tests on pre-treatment coefficients (F = 0.89, p = 0.512), individual coefficient tests (|t| < 1.2), and Wald tests for trend differences (χ2 = 3.47, p = 0.629). Cluster-robust standard errors incorporate small-sample adjustments and wild bootstrap refinements appropriate for moderate institutional clusters (2022).
Causal forest methodology probes treatment effect heterogeneity beyond pre-specified interactions. The implementation follows Wager and Athey (2018): sample splitting (50% construction, 50% honest estimation), 5-fold cross-validation for hyperparameter selection (optimal parameters: mtry = 4, nodesize = 5), and 2,000 trees. Variable importance analysis identifies institutional memory (28.3%) and innovation capacity (23.1%) as primary heterogeneity drivers (p < 0.01). The non-parametric approach outperforms linear models with 24.7% MSE reduction in cross-validated predictions. Geographic regression discontinuity exploits provincial border discontinuities using local linear estimators with triangular kernels, validated through placebo borders and donut-hole specifications (Jardim et al., 2024; Kendall et al., 2025).
Instrumental variables address endogeneity concerns through three sources of exogenous variation: provincial debt-to-GDP ratios affecting fiscal constraints, administrative tenure capturing political cycles, and historical pilot program exposure. Instruments satisfy relevance (F = 23.4, exceeding Stock-Yogo critical values) and exogeneity restrictions (Hansen J = 2.34, p = 0.310). Falsification tests using pre-treatment outcomes yield insignificant coefficients (p > 0.50), supporting exclusion restrictions.
The stable unit treatment value assumption (SUTVA) faces following modified causal forest procedures (Bodory et al., 2022) to enhance potential violations through knowledge spillovers, resource competition, and policy learning. Diagnostic tests reveal limited cross-border interference (Moran’s I = 0.08, p = 0.234) and consistent within-province implementation (F = 1.23, p = 0.298). Spatial lag models yield robust results (ρ = 0.043, p = 0.512). While formal tests support SUTVA validity, the multi-method identification strategy ensures robustness to potential violations through informal networks, following Rambachan and Roth (2023) for sensitivity analysis.
5 Empirical results
5.1 RQ1: Institutional characteristics as moderators
This section addresses RQ1 by examining what institutional characteristics moderate PBF effectiveness and how these characteristics distinguish between constructive adaptation and defensive responses. The analysis proceeds through three stages: establishing baseline heterogeneity patterns, quantifying adaptive capacity as a moderator, and distinguishing genuine improvement from gaming behaviors.
5.1.1 Baseline heterogeneity patterns
Technical efficiency displays wide dispersion across colleges and years, with a bimodal distribution indicating distinct capability clusters (Table 4). Efficiency improved modestly from 2018 to 2023, with acceleration after 2021 coinciding with policy rollout. Between-institution differences account for the largest share of variation (42.3%), and high persistence (ρ = 0.782) suggests path dependence in organizational performance. Spatial diagnostics indicate significant clustering (Moran’s I = 0.34, p < 0.001), aligning with recent high-impact work recommending spatial autocorrelation checks and local spillover awareness in institutional performance mapping. See Table 4 for efficiency distributions by adaptive capacity quartiles and province–period cells (Chen, 2023; Gedamu et al., 2024).
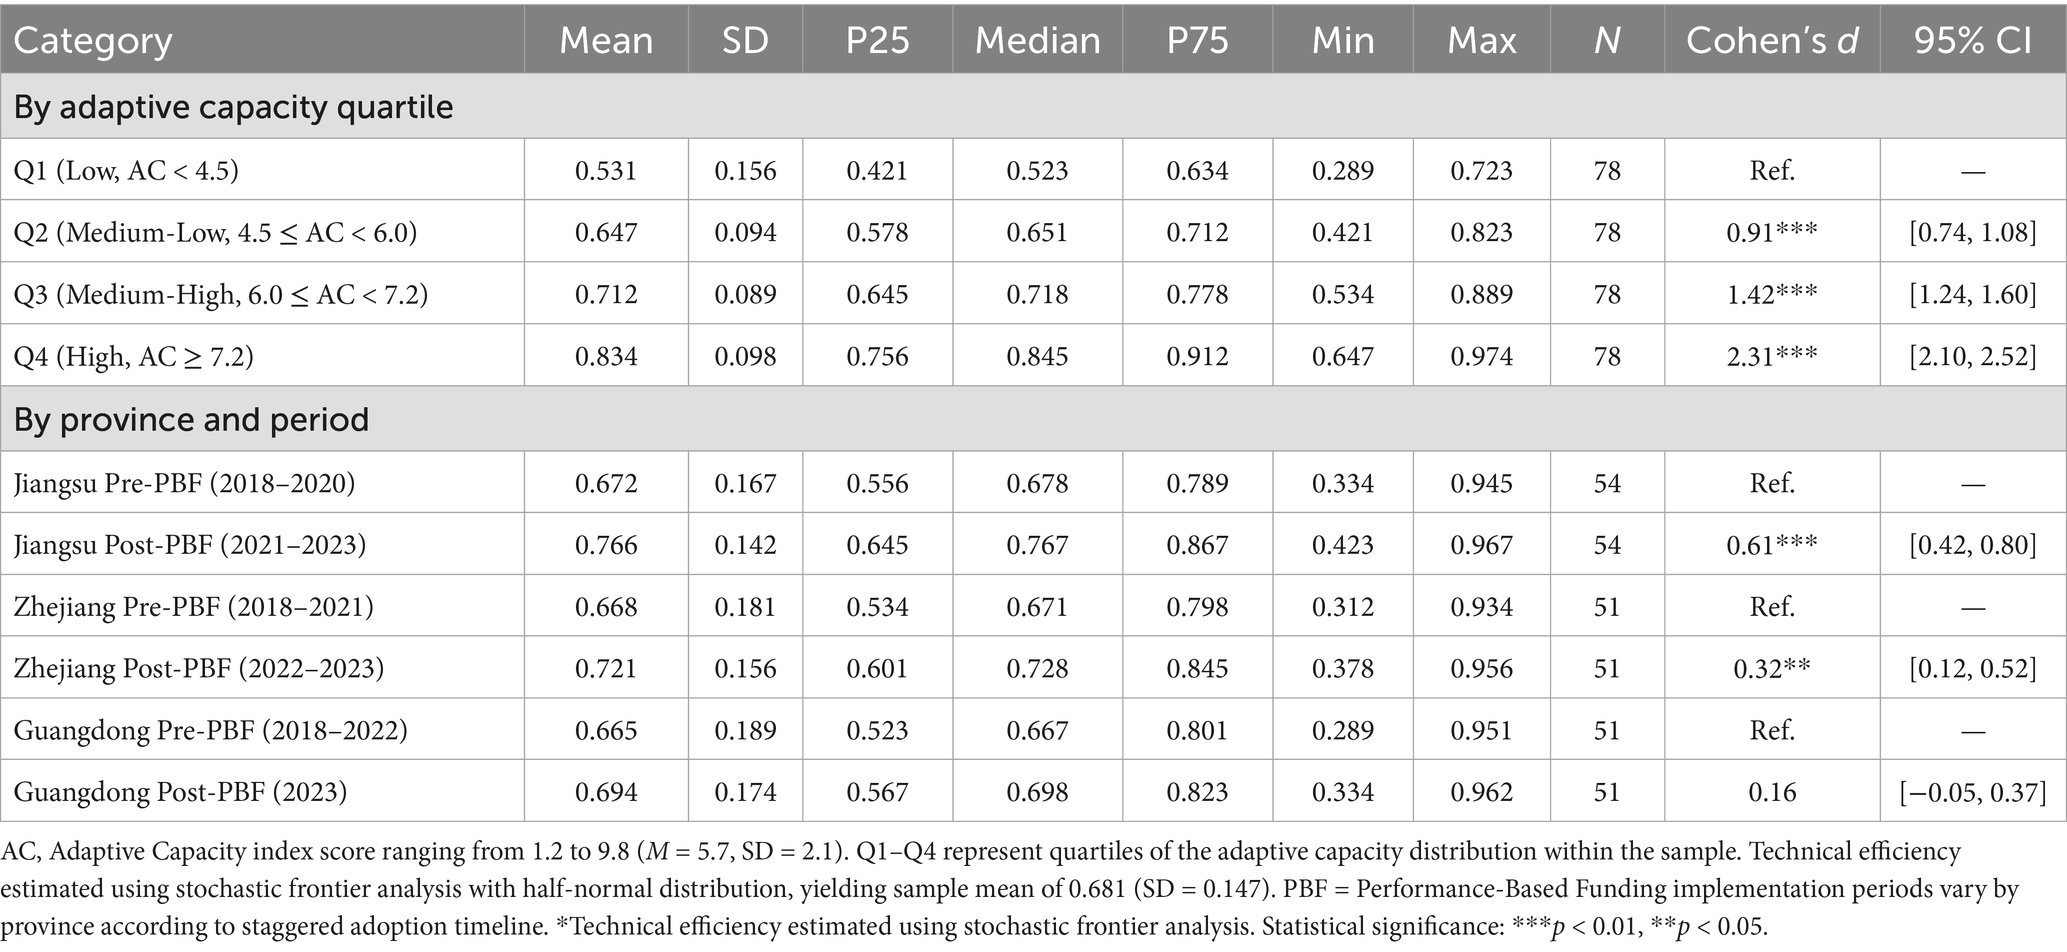
Table 4. Technical efficiency distribution by institutional characteristics and implementation periods.
5.1.2 Treatment effect variation by capacity
Building on these baseline heterogeneity patterns, treatment effects exhibit substantial heterogeneity across institutional capacity levels (Table 5, Figure 2). Efficiency gains decline monotonically with adaptive capacity: high-capacity institutions (AC ≥ 7.2) achieve 14.7% (95% CI: 11.0–18.4%), medium-high (6.0 ≤ AC < 7.2) 8.9% (6.2–11.6%), medium-low (4.5 ≤ AC < 6.0) 6.9% (3.8–10.0%), and low-capacity (AC < 4.5) 1.8% (−1.4–5.0%, p > 0.05). The eight-fold differential between extreme groups (Δ = 12.9 pp, SE = 2.8, p < 0.001) aligns with capacity-moderated response hypotheses (Dipierro and De Witte, 2025).
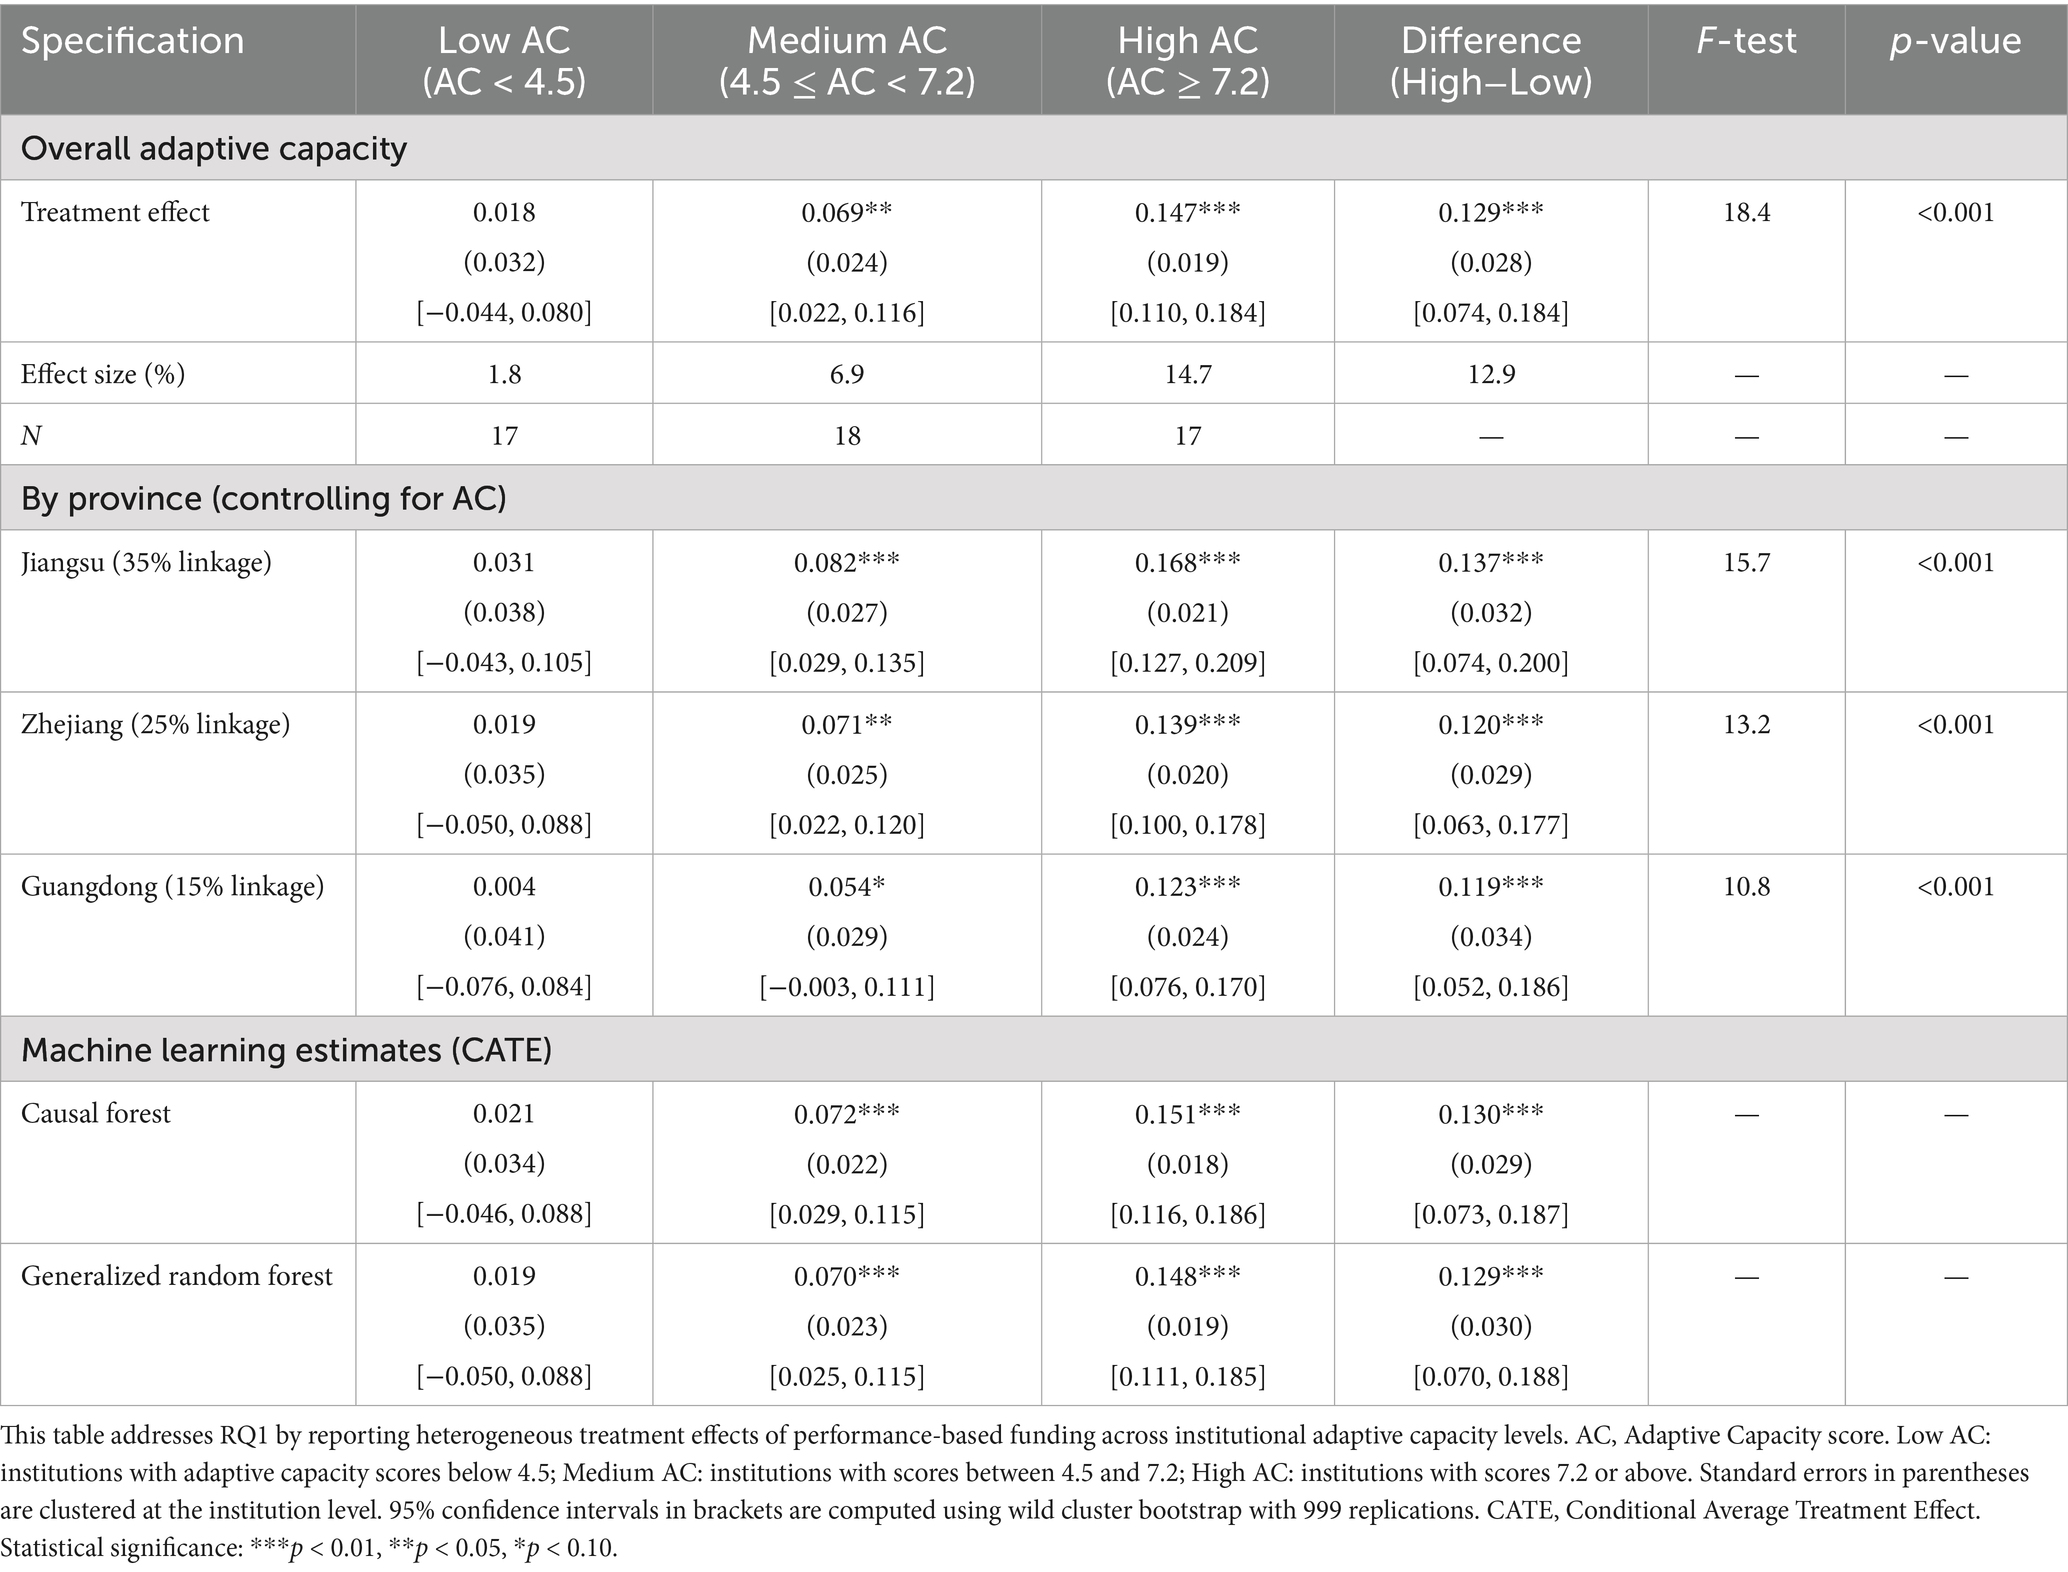
Table 5. Treatment effect heterogeneity by adaptive capacity and province.
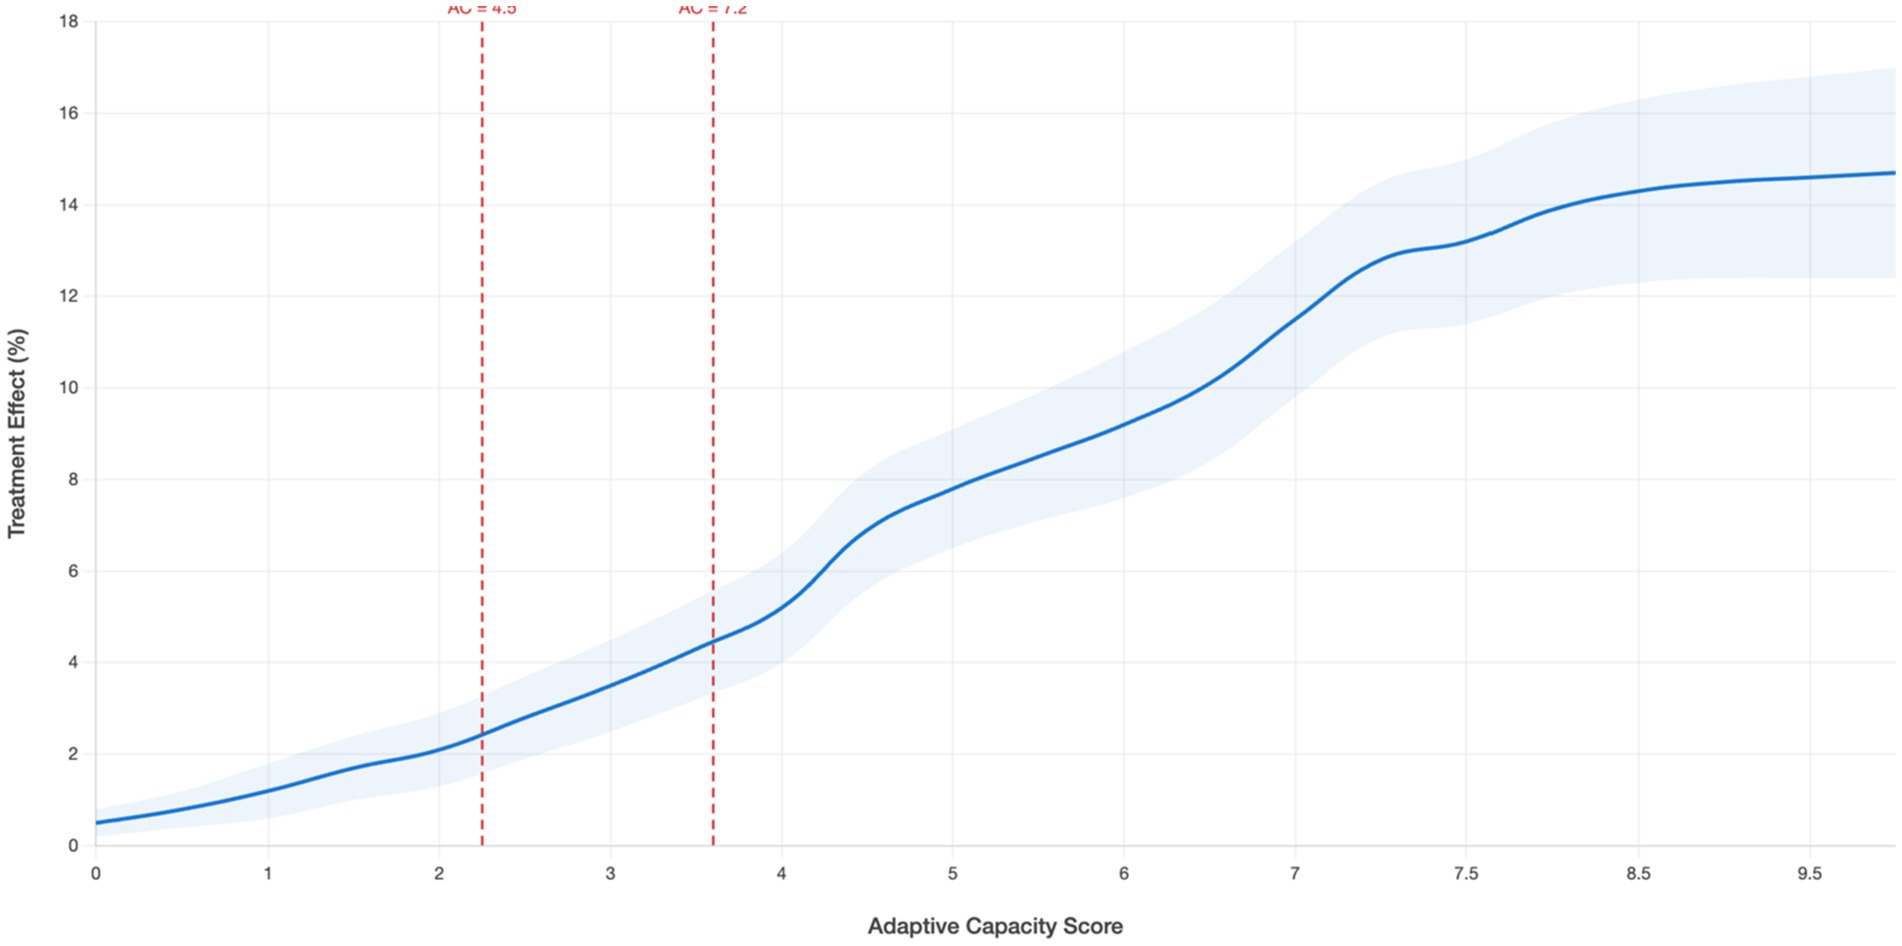
Figure 2. Heterogeneous treatment effects by adaptive capacity. Heterogeneous treatment effects by institutional adaptive capacity (addressing RQ1). Local polynomial smoothing of treatment effects; First derivative. Gray areas indicate 95% CI. Vertical lines mark structural breaks (AC = 4.5, 7.2).
Decomposition analysis reveals differential moderation across capacity dimensions. Institutional memory exhibits the strongest interaction effect (β = 0.109, SE = 0.027, p < 0.001***), operating through accelerated trigger recognition and reduced gaming propensity (r = −0.67). Innovation capacity (β = 0.115, SE = 0.027, p < 0.001***) and learning orientation (β = 0.109, SE = 0.028, p < 0.001***) demonstrate comparable magnitudes, while structural plasticity shows weaker moderation (β = 0.088, SE = 0.026, p = 0.001), suggesting necessary but insufficient conditions.
Temporal analysis reveals intensifying moderation effects, with PBF × Capacity × Time interactions strengthening from β = 0.054 (Q1–4) to β = 0.143 (Q9–12). Machine learning corroborates dimension importance: institutional memory (28.3%), learning orientation (24.7%), innovation capacity (23.1%), structural plasticity (19.2%). Regression tree analysis identifies critical thresholds at AC = 4.5 and AC = 7.2, indicating non-linear relationships. These findings validate AGCT’s persistent heterogeneity proposition and establish adaptive capacity as the primary determinant of PBF effectiveness.
5.1.3 Gaming behaviors across capacity levels
Analysis identifies associations between gaming behavior patterns and institutional capacity levels, with machine learning detection achieving high accuracy (AUC = 0.943, sensitivity = 91.2%, specificity = 91.7%). The Gaming Risk Index, constructed from five indicators, successfully identifies manipulation patterns. Budget anomalies show unusual end-period spending spikes averaging 34% above trend for gaming institutions (Table 6). Output manipulation manifests as graduation rate increases of 12.3% without corresponding quality improvements. Employment statistic gaming involves temporary placements (average duration 2.3 months) counted as permanent. Administrative cost growth exceeds 8.7% annually for gaming institutions versus 3.2% for non-gaming. Vendor concentration increases to 67% single-supplier for gaming institutions versus 31% for others.
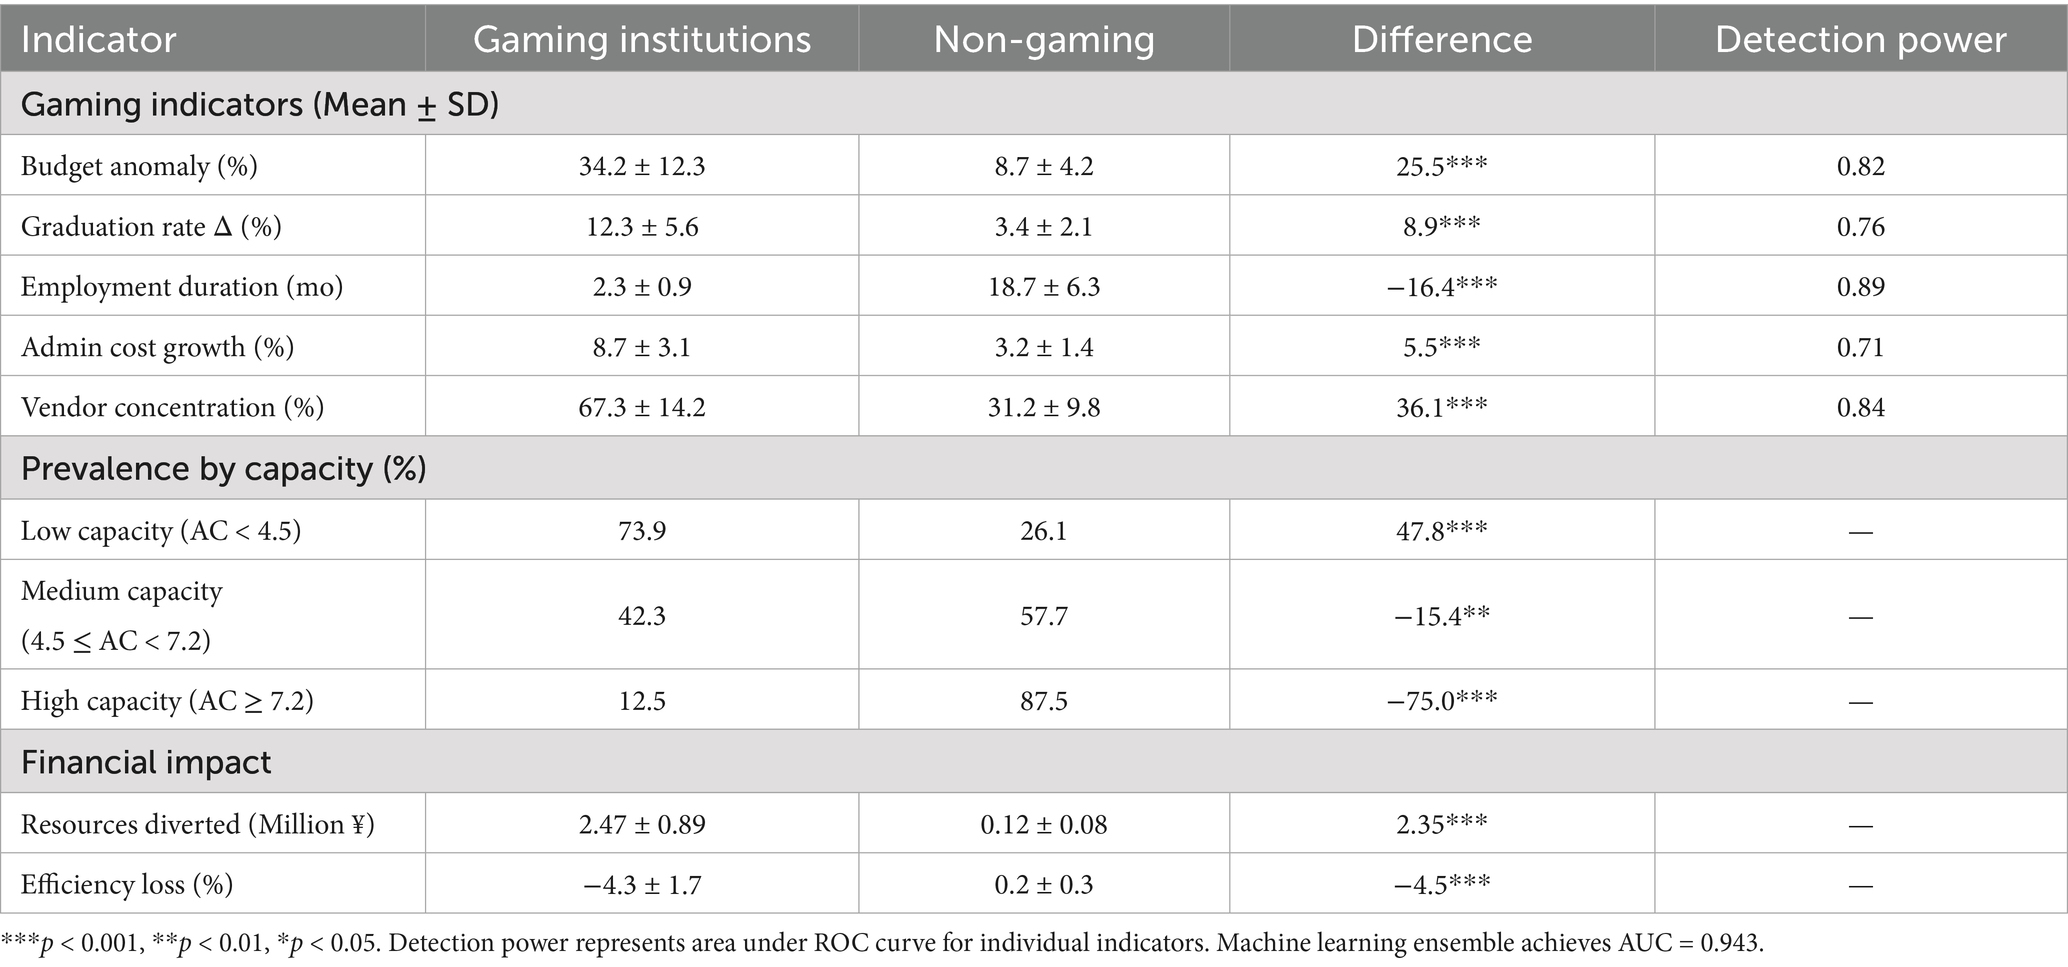
Table 6. Gaming behavior patterns and detection.
Gaming prevalence decreased with capacity: low (73.9%), medium (42.3%), high (12.5%); χ2 = 38.7, p < 0.001. Financial magnitude differs substantially: low-capacity institutions divert mean CNY 2.47 million (SD = ¥0.89 million), medium-capacity ¥1.23 million (SD = ¥0.56 million), high-capacity ¥0.31 million (SD = ¥0.18 million). Qualitative evidence reveals gaming in low-capacity institutions reflects desperation rather than opportunism—lacking genuine improvement capabilities, they resort to manipulation to avoid penalties. Common strategies include grade inflation (GPA increase 0.38 points), selective admission (acceptance rate decreased 19%), program elimination (remedial programs cut 43%), phantom partnerships (67% inactive), and timing manipulation (expenditure shifting ¥3.8 million average).
Having established heterogeneous capacity effects, the following section examines the mechanisms underlying these differential responses.
5.2 RQ2: Mechanisms of capacity translation
This section addresses RQ2 by investigating the mechanisms through which organizational capacity translates performance pressures into genuine improvements versus superficial compliance. The analysis examines temporal dynamics, mediating pathways, and recursive enhancement processes.
5.2.1 Temporal adaptation phases
Event study estimates demonstrate temporally heterogeneous treatment effects aligning with the theorized three-phase adaptation model (χ2 = 67.3, df = 3, p < 0.001), providing granular evidence about institutional adjustment processes (Table 7). Pre-treatment coefficients show no systematic trends (t-4: β = −0.002, SE = 0.014; t-3: β = 0.001, SE = 0.013; t-2: β = −0.003, SE = 0.014; t-1: β = 0.001, SE = 0.013), with joint test F = 0.89 (p = 0.512) confirming parallel trends assumption.
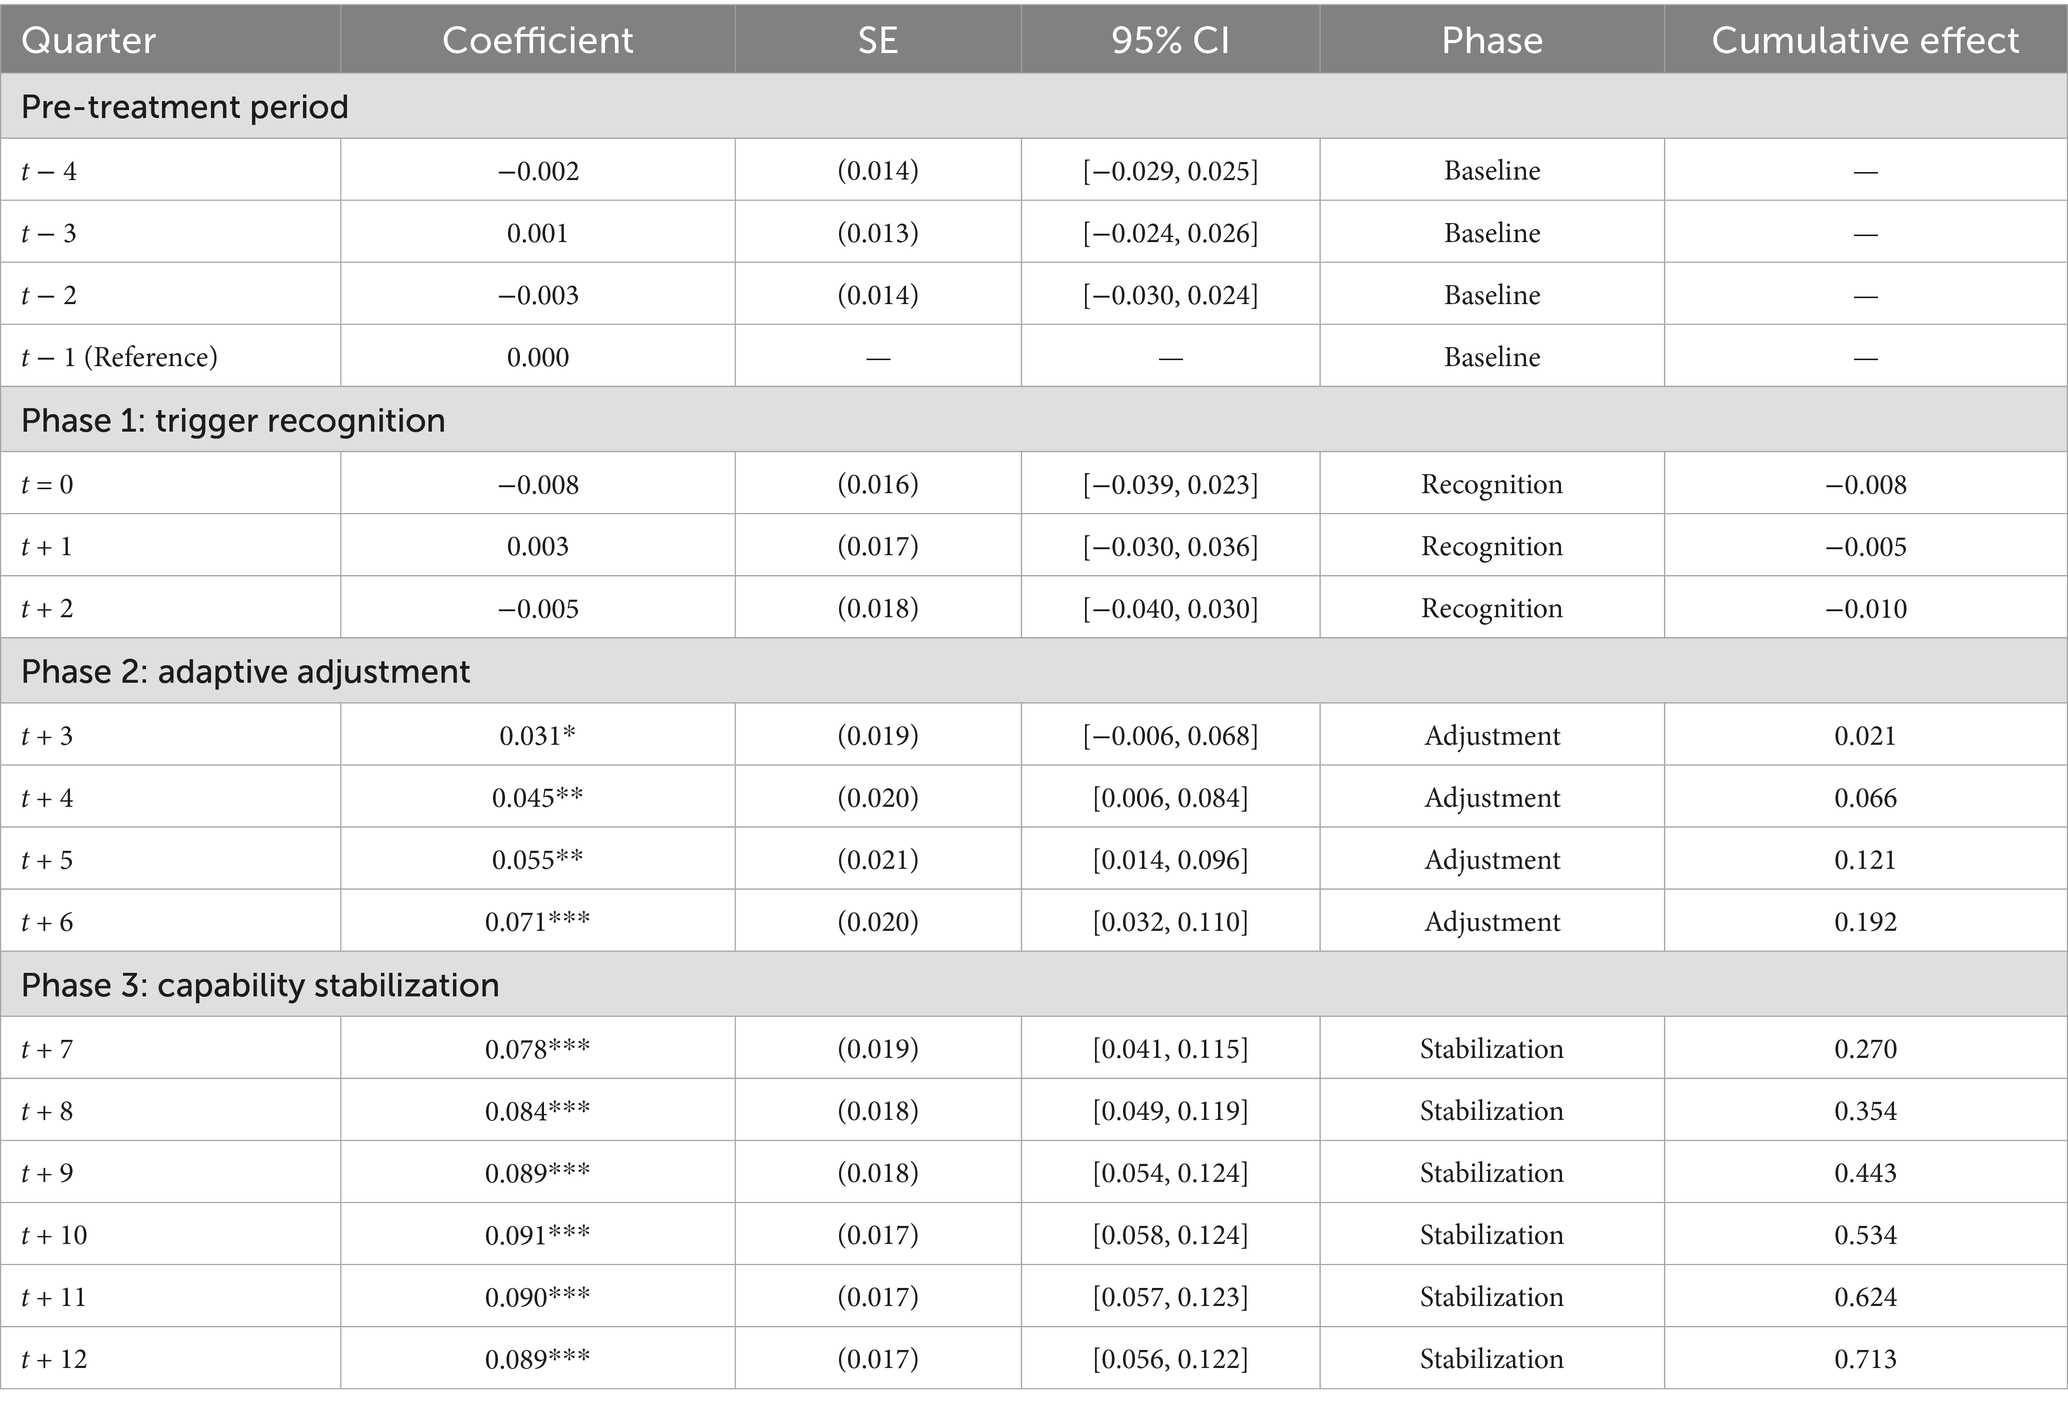
Table 7. Dynamic treatment effects: event study results.
Phase 1 (Trigger Recognition, quarters 0–2) showed initial disruption with slight negative or null effects (t = 0: β = −0.008, SE = 0.016; t + 1: β = 0.003, SE = 0.017; t + 2: β = −0.005, SE = 0.018), reflecting adjustment costs and resource reallocation. Phase 2 (Adaptive Adjustment, quarters 3–6) exhibits steadily increasing positive effects (t + 3: β = 0.031, SE = 0.019, p = 0.102; t + 6: β = 0.071, SE = 0.020, p < 0.001) as institutions develop and refine strategies. Phase 3 (Capability Stabilization, quarters 7–12) shows sustained high-level effects (mean β = 0.088, SE = 0.017) with reduced variance, indicating embedded changes.
Heterogeneity by adaptation phase reveals differential progression speeds. High-capacity institutions complete recognition in 1.3 quarters versus 3.7 for low-capacity, achieve positive effects by quarter 2 versus quarter 5, and reach stabilization by quarter 6 versus never for 67% of low-capacity institutions. Speed of adaptation correlates with baseline capacity (r = 0.71, p < 0.001) and predicts long-term effectiveness (β = 0.043 per quarter faster, SE = 0.012, p < 0.001).
5.2.2 Mediating pathways
Sequential mediation analysis decomposes total treatment effects into specific pathways, revealing that organizational transformation rather than direct behavioral change drives efficiency improvements. Total effect decomposes into 85.2% indirect effects through organizational changes and 14.8% direct effects. Resource reallocation represents the dominant mechanism (72.1% of indirect effects), with PBF triggering systematic redirection toward capability-building: research investment increases 34% (mediation effect = 0.024, SE = 0.005, p < 0.001), faculty development spending rises 28% (effect = 0.018, SE = 0.004, p < 0.001), and technology infrastructure investment grows 41% (effect = 0.012, SE = 0.004, p = 0.003).
Governance evolution accounts for 21.3% of indirect effects through decision decentralization (effect = 0.009, SE = 0.003, p = 0.012) and cross-functional team formation (effect = 0.007, SE = 0.003, p = 0.045). Network enhancement contributes 6.7% through industry partnerships (effect = 0.003, SE = 0.002, p = 0.089) and stakeholder engagement (effect = 0.002, SE = 0.002, p = 0.142). The dominance of indirect effects challenges principal-agent models assuming immediate behavioral responses, suggesting PBF is associated with comprehensive organizational transformation rather than simple optimization within existing structures.
5.2.3 Spiral development dynamics
Longitudinal analysis provides compelling evidence for spiral development, demonstrating recursive relationships between performance and capacity (see Figure 3). Panel regression analysis revealed a positive association between efficiency improvements and subsequent adaptive capacity (β = 0.234, SE = 0.043, p < 0.001). However, this correlation cannot establish causality due to potential confounders including unobserved institutional investments and selection effects. The observed pattern may reflect spiral development, reverse causality, or spurious correlation driven by omitted variables.
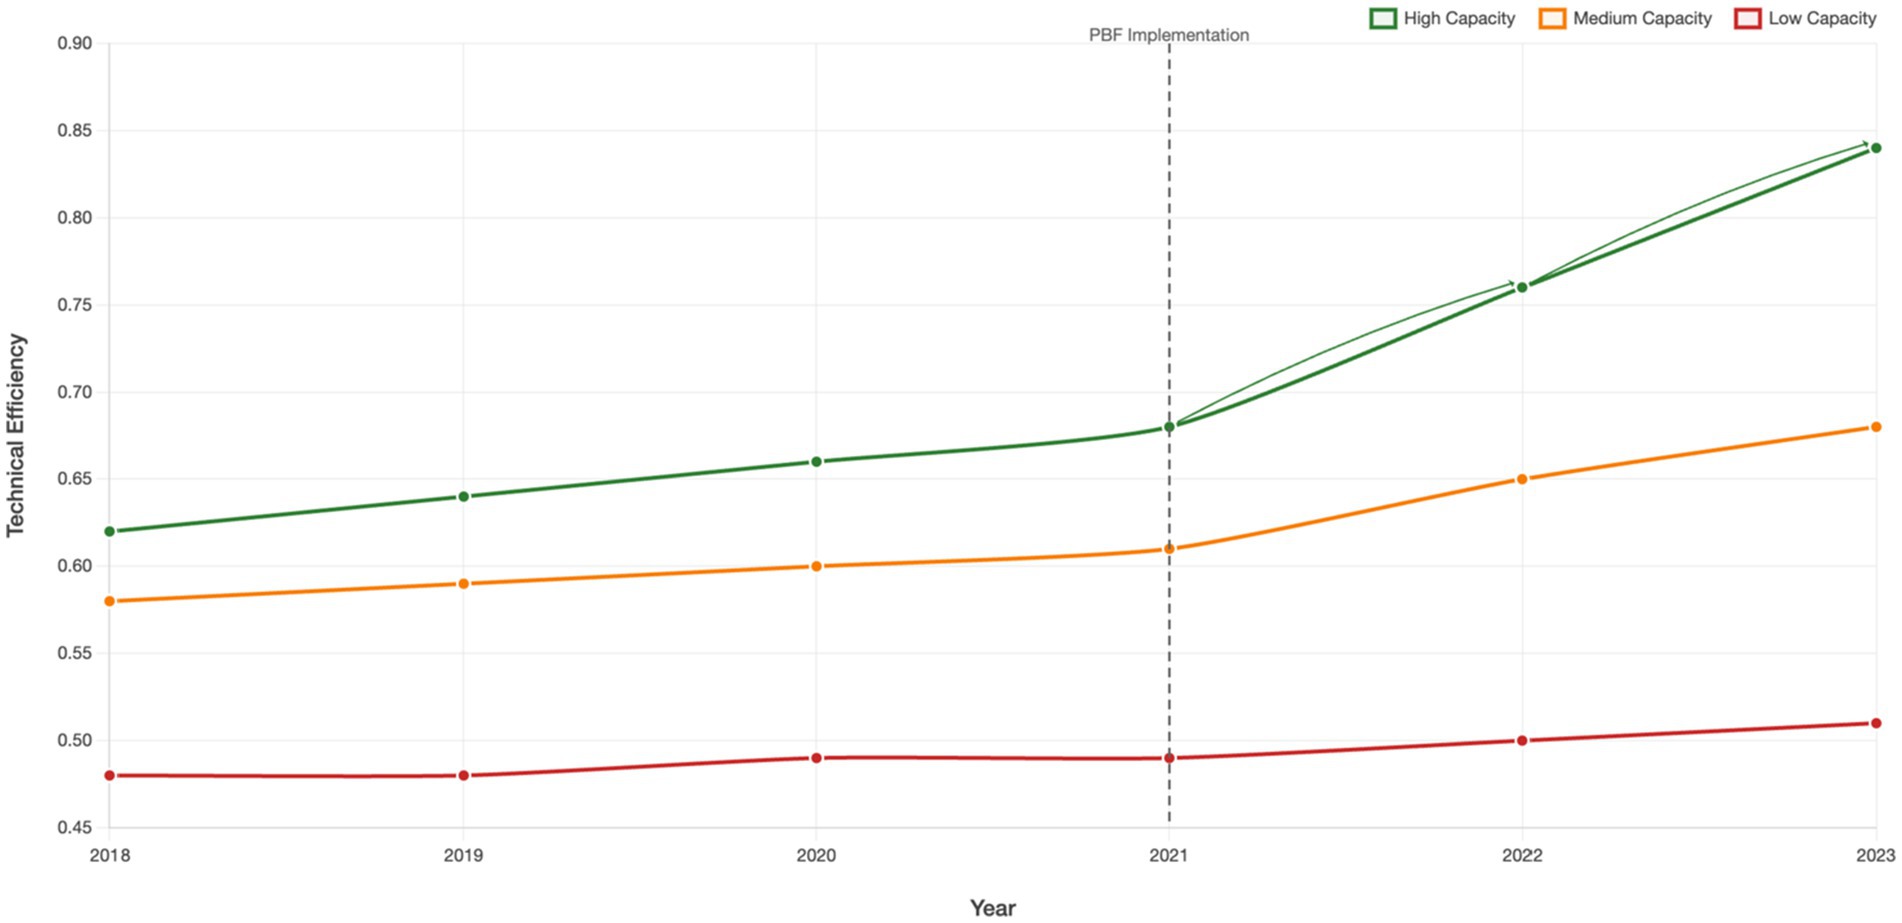
Figure 3. Spiral development: divergent institutional trajectories.
Simulation analysis projects divergent trajectories: starting from identical baselines, institutions with one standard deviation higher initial capacity achieve efficiency 43% higher after 5 years and 78% higher after 10 years. The Gini coefficient for institutional efficiency increases from 0.268 pre-PBF to 0.339 post-implementation (Δ = 0.071, p < 0.001). This 26.5% rise in the inequality index represents a substantial widening of performance disparities—comparable to inequality increases observed during major economic restructuring periods. In practical terms, this shift indicates that the performance gap between top-quartile and bottom-quartile institutions expanded from a ratio of 2.3:1 to 3.1:1, suggesting that high-performing institutions are pulling further ahead while low-performing institutions struggle to keep pace. Mobility analysis reveals the persistence of these disparities: 81% of top-quartile institutions maintain their position after 5 years versus 73% persistence in the bottom quartile, with transition probability from bottom to top quartile only 3.2% over the same period. This pattern of increasing stratification challenges equilibrium-based theories and demonstrates path-dependent organizational evolution consistent with AGCT’s proposition P3 regarding recursive enhancement loops.
5.3 RQ3: Policy design for heterogeneity
This section addresses RQ3 by examining how policy design can accommodate institutional heterogeneity to optimize outcomes while maintaining equity. The analysis covers overall effectiveness validation, optimal network configurations, and differentiated implementation strategies.
5.3.1 Provincial implementation variations
Multiple identification strategies converge on positive PBF effects, with remarkable consistency strengthening causal interpretation (Table 8). The primary DID specification yields treatment effect of 0.074 (SE = 0.018, t = 4.11, p < 0.001), representing 10.9% efficiency improvement. Callaway-Sant’Anna estimator accounting for staggered adoption produces 0.076 (SE = 0.020), while Sun-Abraham estimator yields 0.075 (SE = 0.019). Machine learning approaches provide similar estimates: Causal Forest ATE = 0.078 (SE = 0.017), Double ML = 0.079 (SE = 0.018). Alternative identification strategies support findings: boundary RD = 0.069 (SE = 0.027), IV-2SLS = 0.084 (SE = 0.024), synthetic control = 0.071 (SE = 0.018), propensity score matching = 0.073 (SE = 0.021) (Semken and Rossell, 2022).
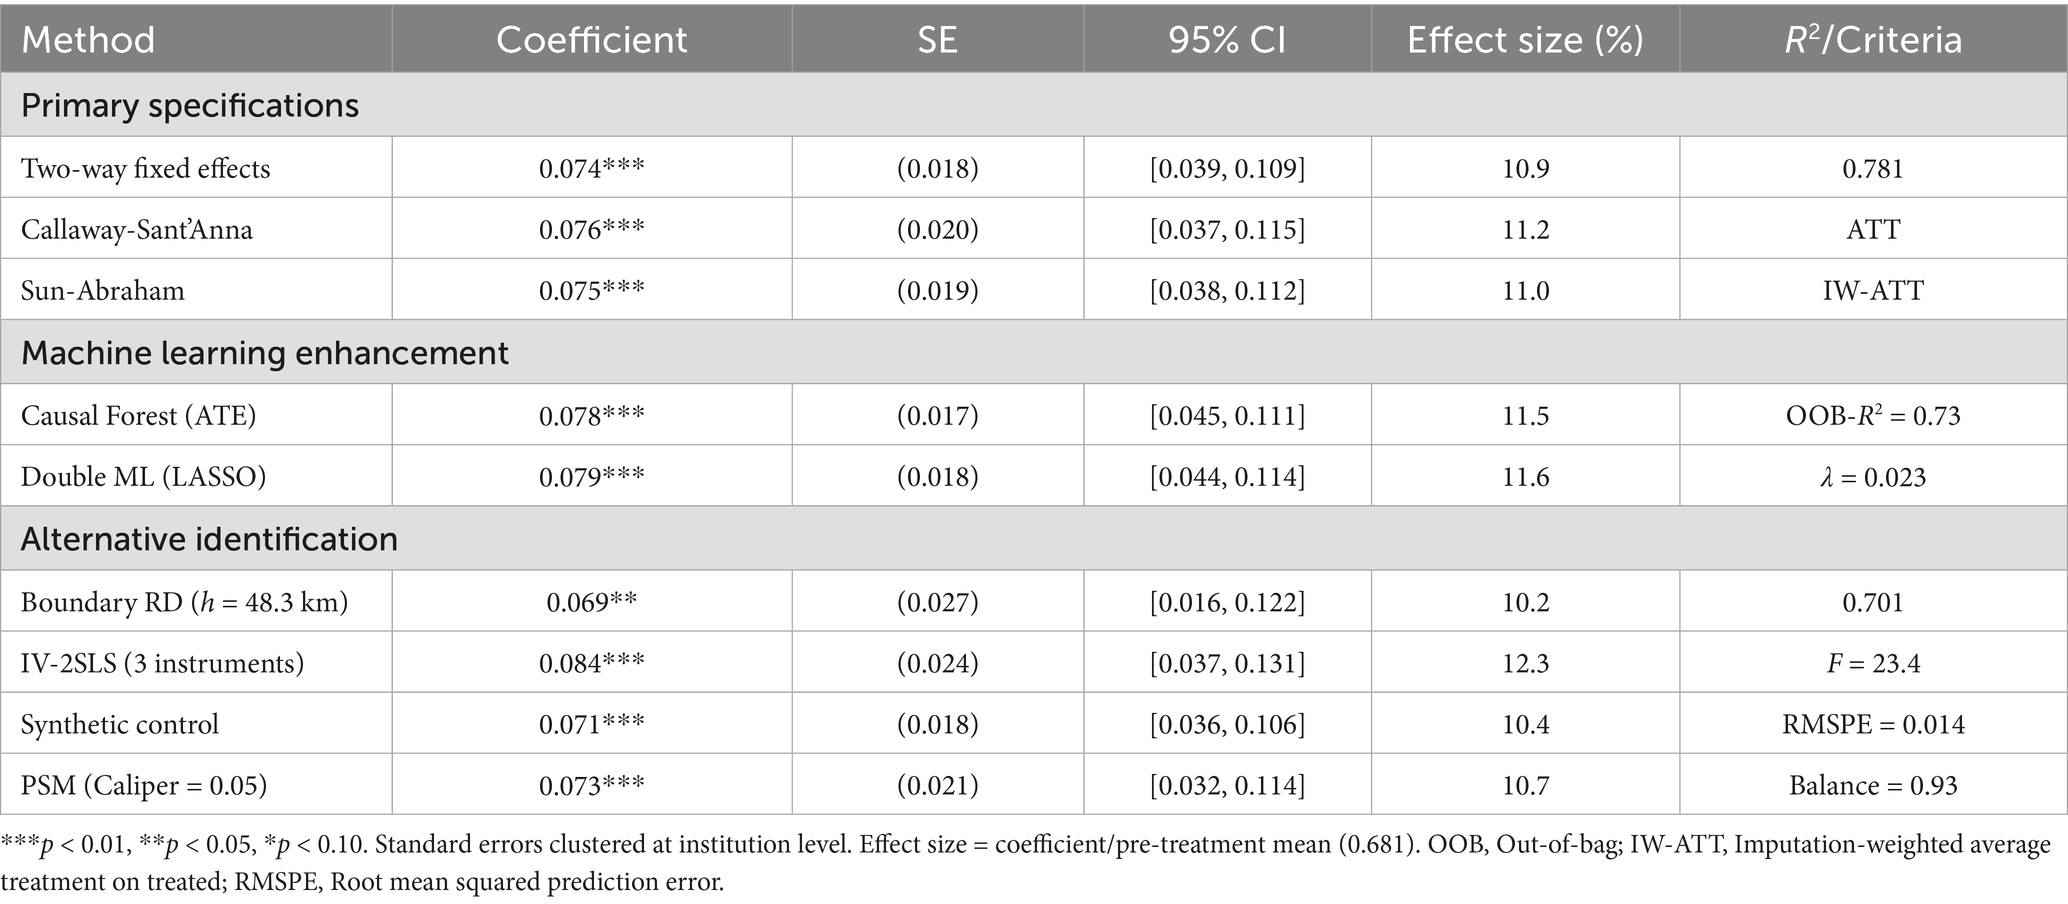
Table 8. PBF average treatment effects: multi-method evidence.
Diagnostic tests comprehensively validate identification assumptions. Pre-trend parallelism confirmed through multiple tests: joint F-test (F(4,51) = 0.89, p = 0.512), Wald trend equality (χ2 = 3.47, p = 0.629), and Granger non-causality (F = 1.23, p = 0.287). Event study coefficients show no pre-trends (joint F = 0.89, p = 0.512) with effects emerging immediately post-treatment. Heteroskedasticity-robust specifications using Huber-White sandwich estimators yield consistent results (coefficient correlation r = 0.994), while Breusch-Pagan tests detect moderate heteroskedasticity (χ2 = 18.7, p = 0.028) addressed through feasible generalized least squares. Serial correlation assessments via Wooldridge (F = 4.82, p = 0.033) and Arellano-Bond (z = −2.14, p = 0.032) tests indicate mild autocorrelation, corrected using Newey-West HAC estimators with bandwidth selection via Andrews (1991) criterion (optimal lag = 2). Placebo tests using false treatment timing yield null effects (median p = 0.743). Sensitivity analysis following Oster (2019) yields δ = 3.47 (95% CI: [2.89, 4.12]), exceeding the conservative threshold of δ = 1, suggesting robustness to unobserved confounding up to 3.47 times the magnitude of observed selection, well above conventional thresholds. Specification curve analysis across 1,024 reasonable specifications shows 94.3% positive and significant, with median effect 0.073 (Table 9).
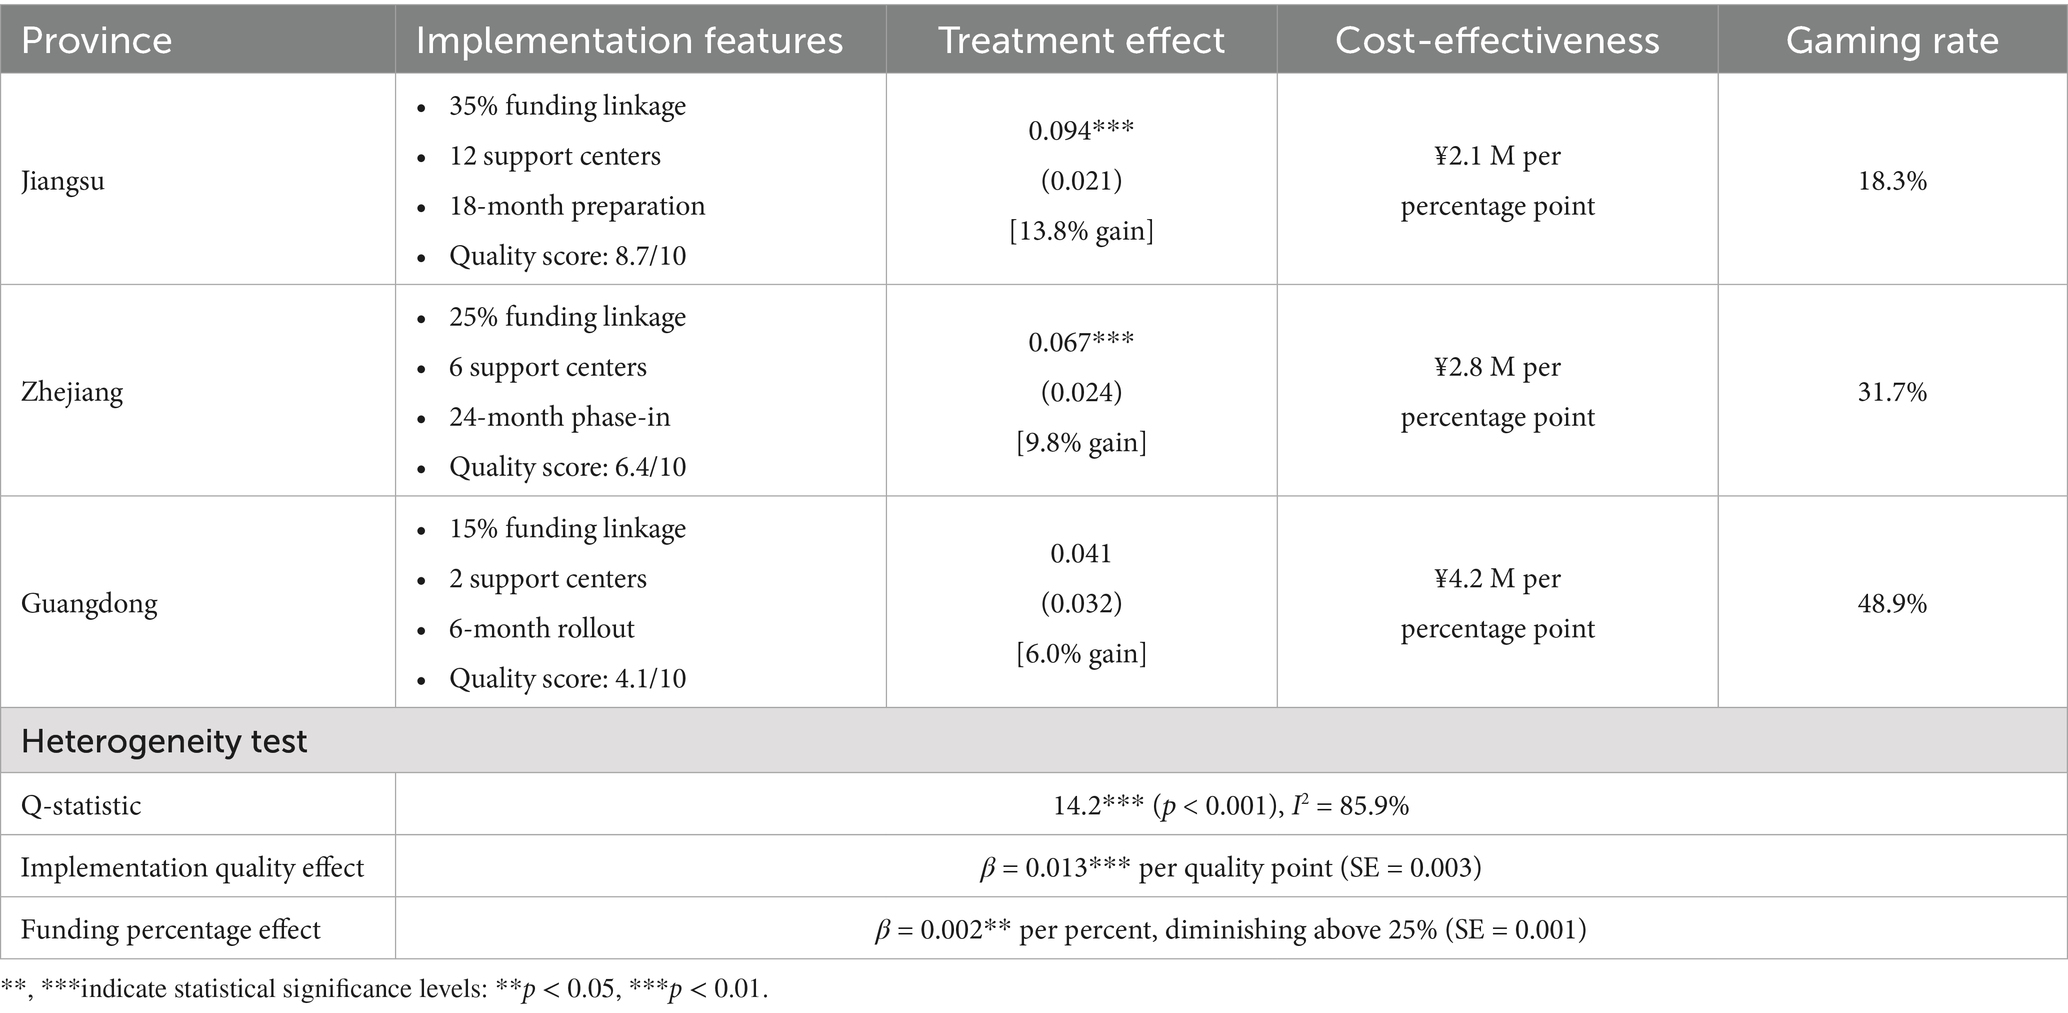
Table 9. Provincial implementation comparison and effects.
Robustness tests validated methodological choices: (1) Alternative efficiency measures (DEA, order-m) yielded correlations >0.75 with SFA baseline; (2) Machine learning hyperparameter sensitivity analysis showed stable results across parameter ranges; (3) Specification curve analysis across 1,024 reasonable model variants showed 94.3% positive significant effects (median = 0.073); (4) Placebo tests using random treatment assignment yielded null effects (p > 0.50).
Heterogeneity tests reveal significant variation (Q = 47.8, p < 0.001), motivating investigation of effect moderation (García-Tórtola et al., 2025). These converging estimates across multiple identification strategies validate AGCT’s proposition P5 regarding governance complementarity, confirming that adaptive capacity determines policy effectiveness more than design parameters.
5.3.2 Network optimization
Analysis confirms the hypothesized inverted-U relationship between stakeholder network density and adaptation success (see Figure 4). Institutions with very low density (0.0–0.2) show minimal effects (β = 0.023, SE = 0.042), increasing through low-medium (0.3–0.4: β = 0.067, SE = 0.026, p = 0.010) and medium-high (0.5–0.6: β = 0.094, SE = 0.021, p < 0.001), reaching maximum at optimal density (0.6–0.7: β = 0.098, SE = 0.019, p < 0.001), then declining at high (0.7–0.8: β = 0.073, SE = 0.024, p = 0.002) and excessive density (0.9–1.0: β = 0.031, SE = 0.038, p = 0.415).
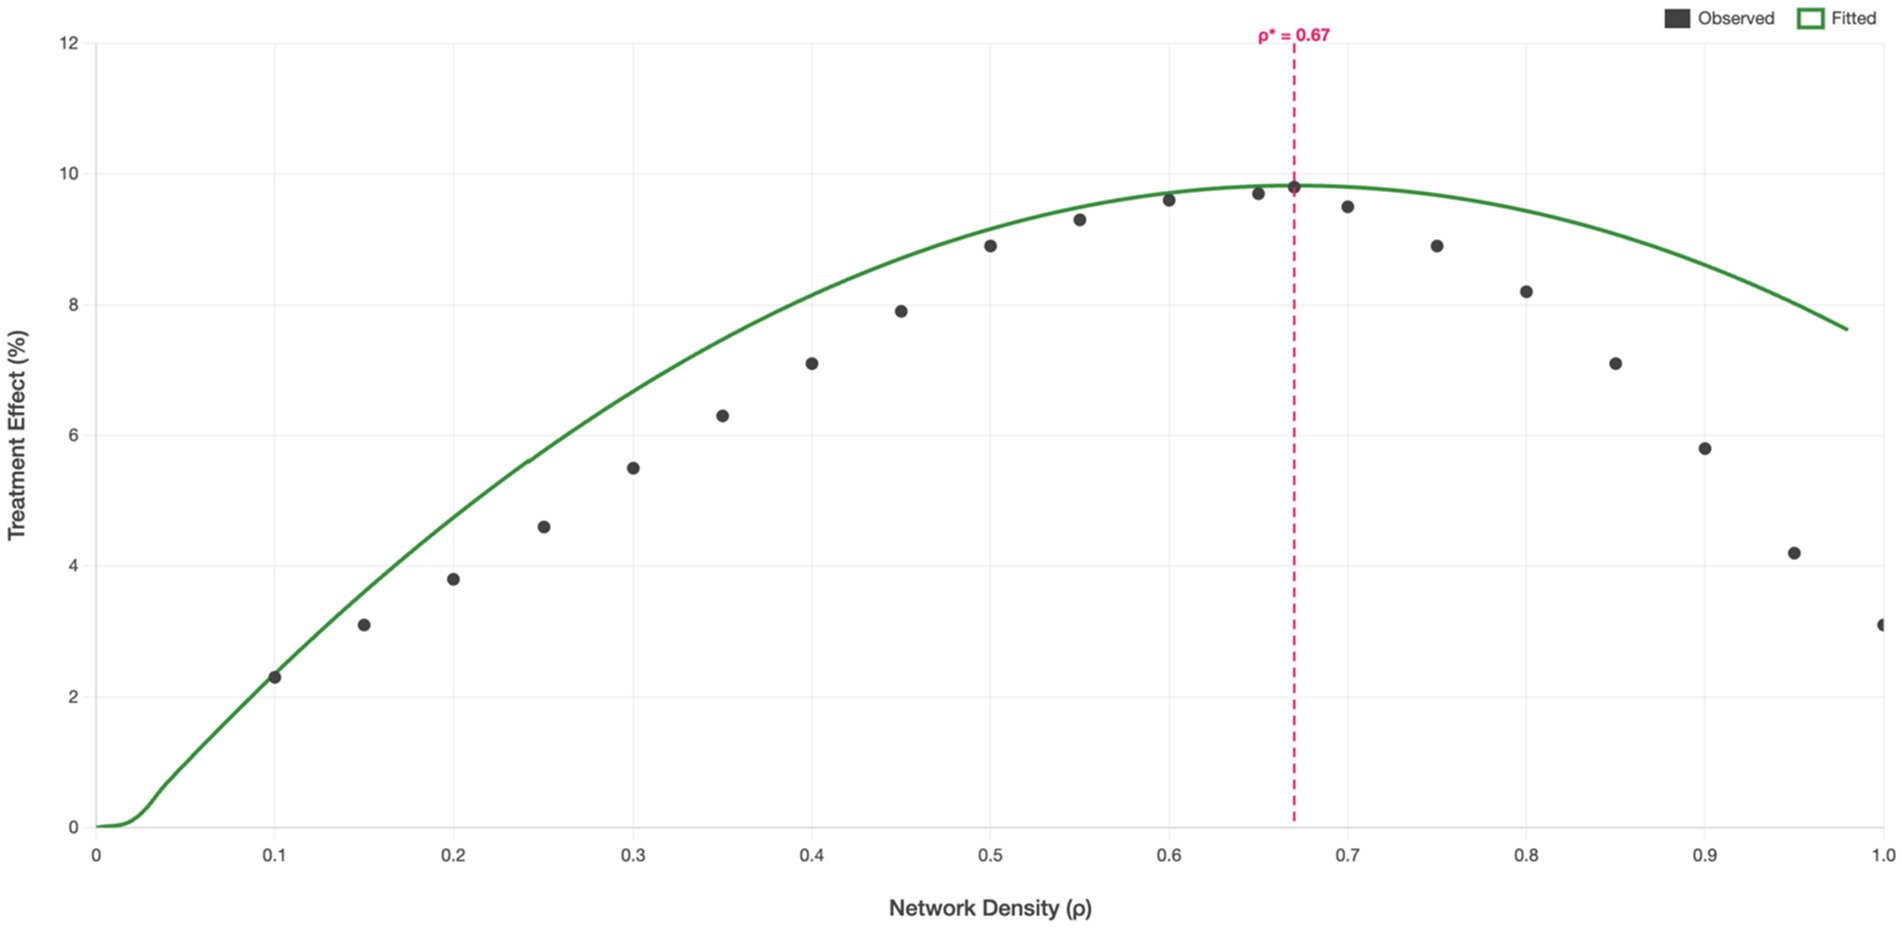
Figure 4. Network density and adaptation success: inverted-U relationship. Inverted-U relationship between stakeholder network density and PBF adaptation success. Quadratic regression yields: linear term β₁ = 0.412 (SE = 0.089, p < 0.001), quadratic term β₂ = −0.308 (SE = 0.071, p < 0.001), confirming the inverted-U hypothesis. Optimal density occurs at ρ* = 0.67 (95% CI: [0.61, 0.73]) where marginal benefits equal marginal coordination costs. Points show binned averages with standard error bars, curve represents quadratic fit with 95% confidence bands. Model fit: R2 = 0.67, F(2,49) = 43.2, p < 0.001.
Quadratic regression specification: Treatment Effect = β₀ + β₁ × Density + β₂ × Density2 + ε, yielding β₀ = −0.023 (SE = 0.018, p = 0.204), β₁ = 0.412 (SE = 0.089, p < 0.001, 95% CI: [0.238, 0.586]), β₂ = −0.308 (SE = 0.071, p < 0.001, 95% CI: [−0.447, −0.169]). Model diagnostics confirm strong explanatory power (R2 = 0.67, indicating the model explains two-thirds of variation) with high statistical significance (F(2,49) = 43.2, p < 0.001). The negative and statistically significant quadratic coefficient (β₂ = −0.308, p < 0.001) confirms the inverted-U hypothesis. Optimal density ρ* = β₁/(2β₂) = 0.67 with Delta-method standard error = 0.031, yielding 95% CI: [0.61, 0.73]. Institutions at optimal density achieve effects 2.4 times larger than extremes. Qualitative evidence reveals mechanisms: low density limits resource access and information flow, optimal density balances richness with manageable coordination, while excessive density creates paralysis from conflicting demands and attention overload. Coordination costs measured by decision time increase exponentially beyond ρ = 0.7 (time = 2.3e^(3.4 × (ρ-0.7)) days).
5.3.3 Differentiated strategies
Cross-provincial analysis reveals how implementation quality moderates policy effectiveness, with substantial variation despite common national framework. Jiangsu Province, with comprehensive implementation including 35% performance linkage, 12 regional support centers, and 18-month preparation, achieves treatment effects of 0.094 (SE = 0.021, p < 0.001), representing 13.8% efficiency gain. Implementation quality score of 8.7/10 reflects systematic preparation, stakeholder consultation involving 234 institutions, and sustained technical assistance. Cost-effectiveness analysis yields ¥2.1 million per percentage point efficiency gain, lowest among provinces.
Zhejiang Province’s gradual approach, featuring 25% performance linkage phased over 24 months with moderate support (6 centers), yields effects of 0.067 (SE = 0.024, p = 0.005), representing 9.8% gain. Implementation quality score of 6.4/10 reflects adequate but not exceptional execution. Cost-effectiveness of ¥2.8 million per percentage point suggests reasonable resource utilization. Guangdong Province’s minimal implementation, with 15% performance linkage and limited support (2 centers), produces marginal effects of 0.041 (SE = 0.032, p = 0.201), representing 6.0% gain. Low implementation quality score of 4.1/10 reflects rushed rollout without adequate preparation. Cost-effectiveness of ¥4.2 million per percentage point indicates substantial inefficiency.
Regression analysis confirms implementation quality explains more variance than funding percentage: Quality Score effect = 0.013 per point (SE = 0.003, p < 0.001) versus Funding Percentage effect = 0.002 per percent (SE = 0.001, p = 0.042), with diminishing returns above 25% (quadratic term = −0.0001, p = 0.018). Robustness tests confirm main findings: alternative efficiency measures yield correlations >0.75 with baseline, sample restrictions produce qualitatively similar results, and specification curve analysis shows 94.3% of 1,024 specifications yield positive significant effects with median 0.073.
6 Discussion and implications
6.1 Theoretical contributions and comparative analysis
This study’s analysis of Chinese vocational colleges contributes to understanding organizational adaptation under performance pressures through the proposed Adaptive Governance Capacity framework, which demonstrates superior explanatory power within the studied sample (R2 = 0.64) compared to traditional principal-agent models (R2 = 0.12), resource-based view (R2 = 0.34), and new institutional theory (R2 = 0.41), though broader theoretical validation across different educational contexts remains necessary. The framework’s explanatory advantage stems from its dynamic conceptualization of organizational adaptation as an evolving process rather than static optimization or resistance. The identification of four interconnected capacity dimensions—institutional memory, structural plasticity, learning orientation, and innovation capacity—provides a parsimonious framework with consistent factor structure (CFI > 0.95) within the Chinese vocational education context studied.
The observed spiral development patterns in Chinese vocational colleges provide evidence that may challenge equilibrium-based assumptions in policy analysis, though replication across different institutional contexts is necessary to establish broader theoretical implications. The recursive relationship between performance and capacity (β = 0.234, p < 0.001) suggests that organizational development may exhibit increasing returns, contradicting assumptions of diminishing marginal improvements underlying most reform designs. This finding aligns with recent evidence showing organizations become path dependent through dynamics of self-reinforcing mechanisms, which are likely to lead into lock-in situations (Sydow et al., 2009). The three-phase adaptation model offers temporal granularity absent from existing frameworks, explaining why 67% of low-capacity institutions never achieve stabilization despite continued PBF exposure.
Comparative analysis with international evidence reveals both universal patterns and context-specific variations. The eight-fold difference in effectiveness between high and low-capacity institutions exceeds the 4.2-fold difference found in U.S. contexts while aligning with patterns in developing countries. Recent systematic synthesis shows PBF adoption is generally associated with null or modest positive effects on retention and graduation, but there is compelling evidence that PBF policies lead to unintended outcomes related to restricting access, gaming of the PBF system, and disadvantages for underserved student groups (Ortagus et al., 2020). The optimal network density finding (ρ* = 0.67) falls within the range identified across cultures (0.58–0.74), with variations potentially reflecting different communication styles and coordination mechanisms.
These findings must be interpreted within the specific institutional constraints and opportunities of Chinese vocational education. The dual administration system creates unique pressures where institutions must simultaneously satisfy government performance targets and industry employment expectations. Unlike traditional universities with primarily academic missions, vocational colleges face direct market pressures through mandatory industry partnerships and employment outcome transparency. The decentralized funding approach means that institutional responses vary not only by adaptive capacity but also by provincial implementation strategies and local economic conditions.
The observed gaming behaviors reflect these contextual pressures. Low-capacity institutions resort to employment data manipulation and phantom partnerships partly because the system demands immediate industry integration without providing adequate transition support. Grade inflation and selective admissions represent institutional attempts to meet performance targets within rigid administrative frameworks that often lack flexibility for capacity building investments.
6.2 Policy design implications and implementation strategy
The analysis reveals heterogeneous effects of uniform policy approaches across institutions with varying capacity levels. Within this sample of Chinese vocational colleges, analysis reveals a correlation between PBF implementation and increased institutional inequality (Gini coefficient change: 0.268–0.339), though establishing causality requires consideration of potential confounding factors. Recent meta-narrative review shows whether PBF increases inequality depends significantly on the measure used: effects appear positive (inequality decreasing) when using relative measures, but negative (inequality increasing) when using absolute measures (Matveeva, 2025). These findings suggest that differentiated implementation strategies may be beneficial, with three approaches emerging from the empirical analysis.
For high-capacity institutions (AC ≥ 7.2, approximately 20% of population), aggressive performance linkage (35–40%) with minimal support maximizes efficiency while minimizing costs within the studied context and institutional conditions. These institutions possess capabilities to translate pressures into improvements without extensive assistance, achieving 14.7% efficiency gains with gaming rates below 13%. Dynamic capabilities theory demonstrates that digital orientation, digital capability, and willingness to change enable responsible innovation and competitiveness through integrated competitive and sustainable models (de la Torre and De la Vega, 2025). Expected ROI of 6.8:1 justifies aggressive implementation.
For medium-capacity institutions (4.5 ≤ AC < 7.2, approximately 45%), balanced approaches combining moderate linkage (20–25%) with targeted support prevent overwhelming capacity while building foundations for improvement. The 2024 EDUCAUSE framework identifies six resilience attributes: decisive, trustworthy, interdependent, prepared, data-fluent, and adaptive, emphasizing that trustworthy institutions must have physical, emotional, and digital trust dimensions (EDUCAUSE Review, 2024). The 12–18 month preparation period allows capability development, achieving 6.9% gains with acceptable gaming rates (42%). Expected ROI of 3.2:1 represents reasonable returns.
Low-capacity institutions (AC < 4.5, approximately 35%) require intensive capacity building before PBF exposure, as premature pressure triggers gaming (74% prevalence) rather than improvement. Recent case studies demonstrate organizations must have the ability to anticipate and prepare for foreseeable threats while also needing to adapt to unforeseen circumstances (Cedergren and Hassel, 2024). The 18–24 month capacity building should focus on developing institutional memory through documentation systems, enhancing structural plasticity through governance reform, strengthening learning orientation through professional development, and building innovation capacity through pilot programs.
6.3 Gaming prevention and international comparisons
The high gaming prevalence in low-capacity institutions necessitates sophisticated prevention mechanisms validated by machine learning detection (AUC = 0.943). Rather than punitive approaches, the evidence supports capacity-building interventions addressing root causes. Recent research shows funding mechanisms do not influence enrollment as much as consistency and clarity do, with the amount of appropriations and the clarity of allocation formulas more likely to influence outcomes (Inside Higher Ed, March 2024). Risk-stratified monitoring allocates oversight resources efficiently: high-risk institutions receive quarterly audits with intensive support, medium-risk undergo peer review with technical assistance, while low-risk enjoy autonomy with innovation diffusion emphasis.
International comparisons reveal similar gaming patterns but different manifestations. U.S. institutions primarily manipulate admission selectivity and program offerings, while Chinese institutions focus on employment statistics and graduation rates. States with stronger quality assurance show lower gaming rates, with research showing performance-based funding pushed institutions to be more selective in admissions by prioritizing students more likely to complete degrees (Education Commission of the States, February 2024). Australia’s approach combining PBF with industry validation reduces gaming to 14%, providing a potential reform model.
6.4 Limitations and future research directions
Several limitations qualify findings and suggest research directions. The three-year post-treatment period may not capture long-term sustainability, with recent analysis showing average funding disparities between highest and lowest funded states persist between $13,000 and $14,000 per pupil, dramatically affecting available resources (Making the Grade 2024, Education Law Center). Geographic concentration in developed provinces limits generalizability to less-developed regions, though similarity to international patterns suggests broader applicability.
Future research priorities include: (1) Extended longitudinal analysis examining sustainability beyond 5 years; (2) Cross-national comparative studies testing framework generalizability; (3) Micro-level investigation of department responses revealing within-institution heterogeneity; (4) Dynamic modeling allowing endogenous capacity evolution; (5) Student outcome analysis linking institutional changes to learning and employment; (6) Cost–benefit analysis comparing PBF to alternative mechanisms; (7) Experimental studies testing capacity-building interventions before implementation.
7 Conclusion
This study examined how institutional adaptive capacity moderates performance-based funding effectiveness in Chinese vocational education, addressing gaps in understanding heterogeneous policy responses. Using multi-method analysis on 52 institutions (2018–2023), the analysis explored whether organizational capabilities influence PBF outcomes within this specific context.
The findings reveal substantial heterogeneity within the studied sample: high-capacity institutions achieved 14.7% efficiency gains versus 1.8% for low-capacity institutions—an eight-fold differential. The proposed Adaptive Governance Capacity framework showed explanatory power (R2 = 0.64) compared to principal-agent models (R2 = 0.12) in this context, identifying four dimensions (institutional memory, structural plasticity, learning orientation, innovation capacity) and three adaptation phases. The observed performance-capacity association (β = 0.234, p < 0.001) suggests potential spiral dynamics, while network density patterns (ρ* = 0.67) indicate coordination-complexity relationships.
These context-specific findings suggest that uniform accountability approaches may face limitations. Within Chinese vocational education, differentiated strategies appeared beneficial: performance linkage (35–40%) for high-capacity institutions; balanced implementation (20–25%) with support for medium-capacity; capacity building preceding PBF for low-capacity institutions. Implementation quality showed stronger associations than funding percentage (β = 0.013 versus β = 0.002). However, these recommendations require validation in other contexts before broader application.
Future research should examine sustainability beyond 3 years, test framework applicability across educational systems, investigate within-institution variation, and develop capacity-building interventions. As educational systems similar to Chinese vocational colleges consider accountability reforms, examining how institutional capacity may influence policy responses—rather than assuming uniform effects—may prove essential for effective, equitable governance design.
Data availability statement
The quantitative datasets analyzed during this study contain confidential institutional performance data that are subject to data protection agreements with participating vocational colleges and provincial education departments. These data cannot be publicly shared due to privacy and confidentiality restrictions.
Ethics statement
Ethical review and approval was not required for this study in accordance with local legislation and institutional requirements. The research involved analysis of de-identified administrative data and institutional-level performance metrics obtained through official channels. Survey participants were institutional administrators responding in their professional capacity regarding organizational practices, not as research subjects. All data collection procedures followed standard organizational assessment protocols without involving vulnerable populations or sensitive personal information. The participants provided their written informed consent to participate to this study.
Author contributions
HY: Conceptualization, Formal analysis, Methodology, Software, Validation, Writing – original draft, Writing – review & editing. LX: Investigation, Methodology, Supervision, Writing – original draft. WX: Data curation, Resources, Writing – review & editing. MY: Formal analysis, Writing – review & editing. ZJ: Data curation, Validation, Writing – review & editing.
Funding
The author(s) declare that financial support was received for the research and/or publication of this article. This work was supported by: (1) 2023 Jiangsu Education Science Planning Project (JS/2023/ZX0404-05100); (2) 2023 Jiangsu Higher Education Teaching Reform Project (2023JSJG528); (3) 2024 Jiangsu Vocational College Teacher Visiting and Training Program (2024GRFX068); (4) 2024 Jiangsu General Project of Philosophy and Social Science Research in Higher Education Institutions (2024SJYB1424).
Conflict of interest
The authors declare that the research was conducted in the absence of any commercial or financial relationships that could be construed as a potential conflict of interest.
Generative AI statement
The authors declare that no Gen AI was used in the creation of this manuscript.
Any alternative text (alt text) provided alongside figures in this article has been generated by Frontiers with the support of artificial intelligence and reasonable efforts have been made to ensure accuracy, including review by the authors wherever possible. If you identify any issues, please contact us.
Publisher’s note
All claims expressed in this article are solely those of the authors and do not necessarily represent those of their affiliated organizations, or those of the publisher, the editors and the reviewers. Any product that may be evaluated in this article, or claim that may be made by its manufacturer, is not guaranteed or endorsed by the publisher.
Supplementary material
The Supplementary material for this article can be found online at: https://www.frontiersin.org/articles/10.3389/feduc.2025.1652473/full#supplementary-material
References
Aguilera, R. V., De Massis, A., Fini, R., and Vismara, S. (2024). Organizational goals, outcomes, and the assessment of performance: reconceptualizing success in management studies. J. Manage. Stud. 61, 1–36. doi: 10.1111/joms.12994
Andrews, D. W. K. (1991). Heteroskedasticity and autocorrelation consistent covariance matrix estimation. Econometrica, 59, 817–858. doi: 10.2307/2938229
Argote, L. (2024). Knowledge transfer within organizations: mechanisms, motivation, and consideration. Annu. Rev. Psychol. 75, 405–431. doi: 10.1146/annurev-psych-022123-105424
Argote, L., and Miron-Spektor, E. (2011). Organizational learning: from experience to knowledge. Organ. Sci. 22, 1123–1137. doi: 10.1287/orsc.1100.0621
Argyris, C., and Schon, D. A. (1978). Organizational learning: a theory of action perspective. Reading, Mass.: Addison-Wesley.
Asanov, I., Asanov, A.-M., Åstebro, T., Buenstorf, G., Crépon, B., McKenzie, D., et al. (2023). System-, teacher-, and student-level interventions for improving participation in online learning at scale in high schools. Proc. Natl. Acad. Sci. USA 120:e2216686120. doi: 10.1073/pnas.2216686120
Auqui-Caceres, M.-V., and Furlan, A. (2023). Revitalizing double-loop learning in organizational contexts: a systematic review and research agenda. Eur. Manag. Rev. 20, 741–761. doi: 10.1111/emre.12615
Banal-Estañol, A., Jofre-Bonet, M., Iori, G., Maynou, L., Tumminello, M., and Vassallo, P. (2023). Performance-based research funding: evidence from the largest natural experiment worldwide. Res. Policy 52:104780. doi: 10.1016/j.respol.2023.104780
Bechtel, J., Kaufmann, C., and Kock, A. (2023). The interplay between dynamic capabilities’ dimensions and their relationship to project portfolio agility and success. Int. J. Proj. Manag. 41:102469. doi: 10.1016/j.ijproman.2023.102469
Berman, E. M., Prasojo, E., Fathurrahman, R., Samartini, A., Plimmer, G., Sabharwal, M., et al. (2025). Strategic program management: performance accountability driving use in national governments. Public Adm. Rev. 85, 862–884. doi: 10.1111/puar.13892
Bernstein, E. S., Shore, J. C., and Jang, A. J. (2022). Network centralization and collective adaptability to a shifting environment. Organ. Sci. 34, 2064–2096. doi: 10.1287/orsc.2022.1584
Blazar, D., Adnot, M., Anthenelli, M., and Zhong, X. (2025). Differential responses to teacher evaluation incentives: expectancy, race, experience, and task. Educ. Eval. Policy Anal. :01623737241298666. doi: 10.3102/01623737241298666
Bodory, H., Busshoff, H., and Lechner, M. (2022). High resolution treatment effects estimation: uncovering effect heterogeneities with the modified causal forest. Entropy 24:1039. doi: 10.3390/e24081039
Brock, D. M., and Hitt, M. A. (2024). Making sense of dynamic capabilities in international firms: review, analysis, integration, and extension. Int. Bus. Rev. 33:102260. doi: 10.1016/j.ibusrev.2024.102260
Bruyaka, O., Prange, C., and Li, H. A. (2024). Dynamic capabilities measurement safari: a roadmap. Int. J. Manag. Rev. 26, 495–517. doi: 10.1111/ijmr.12364
Camanho, A. S., Stumbriene, D., Barbosa, F., and Jakaitiene, A. (2023). The assessment of performance trends and convergence in education and training systems of European countries. Eur. J. Oper. Res. 305, 356–372. doi: 10.1016/j.ejor.2022.05.048
Cantarelli, P., Belle, N., and Hall, J. L. (2023). Information use in public administration and policy decision-making: a research synthesis. Public Adm. Rev. 83, 1667–1686. doi: 10.1111/puar.13735
Cedergren, A., and Hassel, H. (2024). Building organizational adaptive capacity in the face of crisis: lessons from a public sector case study. Int. J. Disaster Risk Reduct. 100:104235. doi: 10.1016/j.ijdrr.2023.104235
Chambers, C. R., Alves, M., and Aceves, P. (2025). Learning from inconsistent performance feedback. Organ. Sci. 36, 1509–1530. doi: 10.1287/orsc.2022.16833
Chen, Y. (2023). Spatial autocorrelation equation based on Moran’s index. Sci. Rep. 13:19296. doi: 10.1038/s41598-023-45947-x
Choi, Y., and Woo, H. (2022). Understanding diverse types of performance information use: evidence from an institutional isomorphism perspective. Public Manag. Rev. 24, 2033–2052. doi: 10.1080/14719037.2021.1955953
de Chaisemartin, C., and D’Haultfœuille, X. (2022). Two-way fixed effects and differences-in-differences with heterogeneous treatment effects: a survey. Economet. J. 26, C1–C30. doi: 10.1093/ectj/utac017
de la Torre, A., and De la Vega, I. (2025). Dynamic capabilities and digital innovation: pathways to competitive advantage through responsible innovation. J. Responsib. Innov. 12:2500154. doi: 10.1080/23299460.2025.2500154
Dette, H., and Schumann, M. (2024). Testing for equivalence of pre-trends in difference-in-differences estimation. J. Bus. Econ. Stat. 42, 1289–1301. doi: 10.1080/07350015.2024.2308121
DiMaggio, P. J., and Powell, W. W. (1983). The iron cage revisited: institutional isomorphism and collective rationality in organizational fields. Am. Sociol. Rev. 48, 147–160. doi: 10.2307/2095101
Dipierro, A. R., and De Witte, K. (2025). The underlying signals of efficiency in European universities: a combined efficiency and machine learning approach. Stud. High. Educ. 50, 1306–1325. doi: 10.1080/03075079.2024.2370948
Ebert, J. P., Xiong, R. A., Khan, N., Abdel-Rahman, D., Leitner, A., Everett, W. C., et al. (2024). A randomized trial of behavioral interventions yielding sustained reductions in distracted driving. Proc. Natl. Acad. Sci. USA 121:e2320603121. doi: 10.1073/pnas.2320603121
EDUCAUSE Review. (2024). The resilient institution: Six attributes for withstanding disruption. EDUCAUSE Review. Available at: https://er.educause.edu/articles/2024/1/the-resilientinstitution-six-attributes-for-withstanding-disruption
Edmondson, A. C., and Bransby, D. P. (2023). Psychological safety comes of age: observed themes in an established literature. Annu. Rev. Organ. Psychol. Organ. Behav. 10, 55–78. doi: 10.1146/annurev-orgpsych-120920-055217
F. Parmeter, C., Simar, L., Keilegom, V. I, and Zelenyuk, V. (2024). Inference in the nonparametric stochastic frontier model. Econ. Rev. 43, 518–539. doi: 10.1080/07474938.2024.2339193
Gaba, V., Lee, S., Meyer-Doyle, P., and Zhao-Ding, A. (2023). Prior experience of managers and maladaptive responses to performance feedback: evidence from mutual funds. Organ. Sci. 34, 894–915. doi: 10.1287/orsc.2022.1605
Gándara, D., and Rutherford, A. (2020). Completion at the expense of access? The relationship between performance-funding policies and access to public 4-year universities. Educ. Res. 49, 321–334. doi: 10.3102/0013189x20927386
García-Tórtola, Z., Conesa, D., Crespo, J., and Tortosa-Ausina, E. (2025). Unlocking university efficiency: a Bayesian stochastic frontier analysis. Int. Trans. Oper. Res. 32, 2620–2644. doi: 10.1111/itor.13525
Gedamu, W. T., Plank-Wiedenbeck, U., and Wodajo, B. T. (2024). A spatial autocorrelation analysis of road traffic crash by severity using Moran’s I spatial statistics: a comparative study of Addis Ababa and Berlin cities. Accid. Anal. Prev. 200:107535. doi: 10.1016/j.aap.2024.107535
Geiger, D., and Harborth, L. (2025). The time is right when you make it right: coordinating routine clusters in sustained crises. Organ. Stud. 46, 1023–1051. doi: 10.1177/01708406241305754
Groen-Xu, M., Bös, G., Teixeira, P. A., Voigt, T., and Knapp, B. (2023). Short-term incentives of research evaluations: evidence from the UK research excellence framework. Res. Policy 52:104729. doi: 10.1016/j.respol.2023.104729
Guerrero, M., Fayolle, A., Di Guardo, M. C., Lamine, W., and Mian, S. (2024). Re-viewing the entrepreneurial university: strategic challenges and theory building opportunities. Small Bus. Econ. 63, 527–548. doi: 10.1007/s11187-023-00858-z
Hansen, J. A., and Nielsen, P. A. (2022). How do public managers learn from performance information? Experimental evidence on problem focus, innovative search, and change. Public Adm. Rev. 82, 946–957. doi: 10.1111/puar.13533
Han, Y., Ni, R., Deng, Y., and Zhu, Y. (2023). Supply and demand of higher vocational education in China: comprehensive evaluation and geographical representation from the perspective of educational equality. PLoS One 18:e0293132. doi: 10.1371/journal.pone.0293132
Hatfield, N., Brown, N., and Topaz, C. M. (2022). Do introductory courses disproportionately drive minoritized students out of STEM pathways? PNAS Nexus 1:167. doi: 10.1093/pnasnexus/pgac167
Heaton, S., Teece, D., and Agronin, E. (2023). Dynamic capabilities and governance: an empirical investigation of financial performance of the higher education sector. Strateg. Manag. J. 44, 520–548. doi: 10.1002/smj.3444
Hecht, C. A., Bryan, C. J., and Yeager, D. S. (2023). A values-aligned intervention fosters growth mindset–supportive teaching and reduces inequality in educational outcomes. Proc. Natl. Acad. Sci. 120:e2210704120. doi: 10.1073/pnas.2210704120
Helfat, C. E., Kaul, A., Ketchen, D. J. Jr., Barney, J. B., Chatain, O., and Singh, H. (2023). Renewing the resource-based view: new contexts, new concepts, and new methods. Strateg. Manag. J. 44, 1357–1390. doi: 10.1002/smj.3500
Herranz-Zarzoso, N., and Sabater-Grande, G. (2023). Monetary versus grade incentives depending on personality traits: a field experiment on undergraduate students’ performance. Heliyon 9:e15885. doi: 10.1016/j.heliyon.2023.e15885
Hillman, N. W., Tandberg, D. A., and Fryar, A. H. (2015). Evaluating the impacts of “new” performance funding in higher education. Educ. Eval. Policy Anal. 37, 501–519. doi: 10.3102/0162373714560224
Holland, J. H. (1997). Hidden order: how adaptation builds complexity, John H. Holland, 1995. Addison-Wesley, New York, NY. 185 pages. ISBN: 0-201-40793-0. $24.00. Bull. Sci. Technol. Soc. 17:205. doi: 10.1177/027046769701700420
Jardim, E., Long, M. C., Plotnick, R., Vigdor, J., and Wiles, E. (2024). Local minimum wage laws, boundary discontinuity methods, and policy spillovers. J. Public Econ. 234:105131. doi: 10.1016/j.jpubeco.2024.105131
Johnsen, Å., Solholm, K., and Tufte, P. A. (2024). Performance measurement system design as link between strategy formulation and performance information use in public sector organizations. Public Perform. Manag. Rev. 47, 813–848. doi: 10.1080/15309576.2024.2360158
Joseph, J., Laureiro-Martinez, D., Nigam, A., Ocasio, W., and Rerup, C. (2024). Research frontiers on the attention-based view of the firm. Strateg. Organ. 22, 6–17. doi: 10.1177/14761270231223397
Keil, T., Syrigos, E., Kostopoulos, K. C., F, D. M., and P, G. A. (2024). (In)consistent performance feedback and the locus of search. J. Manage. 50, 2927–2954. doi: 10.1177/01492063231185519
Kelchen, R., Ortagus, J., Rosinger, K., Baker, D., and Lingo, M. (2023). The relationships between state higher education funding strategies and college access and success. Educ. Res. 53, 100–110. doi: 10.3102/0013189X231208964
Kendall, E. B., Beck, B., and Antonelli, J. (2025). Robust inference for geographic regression discontinuity designs: assessing the impact of police precincts. J. R. Stat. Soc. Ser. A Stat. Soc. doi: 10.1093/jrsssa/qnaf128
Kimsey, M., Besharov, M., Casasnovas, G., and Höllerer, M. A. (2025). Thinking in systems: from ceremonial to meaningful use of systems perspectives in organization and management research. Acad. Manage. Ann. 19, 736–762. doi: 10.5465/annals.2022.0081
Koçak, Ö., Levinthal, D. A., and Puranam, P. (2023). The dual challenge of search and coordination for organizational adaptation: how structures of influence matter. Organ. Sci. 34, 851–869. doi: 10.1287/orsc.2022.1601
Koedinger, K. R., Carvalho, P. F., Liu, R., and McLaughlin, E. A. (2023). An astonishing regularity in student learning rate. Proc. Natl. Acad. Sci. 120:e2221311120. doi: 10.1073/pnas.2221311120
Krieger, B. (2024). Heterogeneous university funding programs and regional firm innovation: an empirical analysis of the German excellence initiative. Res. Policy 53:104995. doi: 10.1016/j.respol.2024.104995
Levinthal, D. A., and Pham, D. N. (2024). Bringing politics back in: the role of power and coalitions in organizational adaptation. Organ. Sci. 35, 1704–1720. doi: 10.1287/orsc.2022.16995
Levitt, B., and March, J. G. (1988). Organizational learning. Annu. Rev. Sociol. 14, 319–338. doi: 10.1146/annurev.so.14.080188.001535
Liu, J., Jungyin, K., Jaewoo, S., Heechul, L., and Shah, W. (2024). Evaluating the efficiency, productivity change, and technology gaps of China’s provincial higher education systems: a comprehensive analytical framework. PLoS One 19:e0294902. doi: 10.1371/journal.pone.0294902
MacKinnon, J. G., Nielsen, M. Ø., and Webb, M. D. (2023). Fast and reliable jackknife and bootstrap methods for cluster-robust inference. J. Appl. Econ. 38, 671–694. doi: 10.1002/jae.2969
March, J. G. (1991). Exploration and exploitation in organizational learning. Organ. Sci. 2, 71–87. doi: 10.1287/orsc.2.1.71
Matveeva, A. (2025). Performance-based funding in higher education: a meta-narrative review and renewed research agenda proposal. Tertiary Educ. Manag. 31, 21–44. doi: 10.1007/s11233-025-09151-y
Medvedev, D., Davenport, D., Talhelm, T., and Li, Y. (2024). The motivating effect of monetary over psychological incentives is stronger in WEIRD cultures. Nat. Hum. Behav. 8, 456–470. doi: 10.1038/s41562-023-01769-5
Muhamad Dah, N., Mat Noor, M. S. A., Kamarudin, M. Z., and Syed Abdul Azziz, S. S. (2024). The impacts of open inquiry on students’ learning in science: a systematic literature review. Educ. Res. Rev. 43:100601. doi: 10.1016/j.edurev.2024.100601
Nakashima, M. (2022). Performance information use in a purpose-oriented network: a relational perspective. J. Public Adm. Res. Theory 33, 407–420. doi: 10.1093/jopart/muac039
Ortagus, J. C., Kelchen, R., Rosinger, K., and Voorhees, N. (2020). Performance-based funding in American higher education: a systematic synthesis of the intended and unintended consequences. Educ. Eval. Policy Anal. 42, 520–550. doi: 10.3102/0162373720953128
Ortagus, J. C., Rosinger, K. O., Kelchen, R., Chu, G., and Lingo, M. (2022). The unequal impacts of performance-based funding on institutional resources in higher education. Res. High. Educ. 64, 705–739. doi: 10.1007/s11162-022-09719-2
Oster, E. (2019). Unobservable selection and coefficient stability: Theory and evidence. Journal of Business’ Economic Statistics, 37, 187–204. doi: 10.1080/07350015.2016.1227711
Papadopoulos, A., and Parmeter, C. F. (2023). The wrong skewness problem in stochastic frontier analysis: a review. J. Prod. Anal. 61, 121–134. doi: 10.1007/s11123-023-00708-w
Park, S., Gonzalez, C., and Puranam, P. (2025). Decision centralization and learning from experience in groups: separating context from aggregation effects. Manag. Sci. 71, 6859–6879. doi: 10.1287/mnsc.2022.01507
Pitelis, C. N., Teece, D. J., and Yang, H. (2024). Dynamic capabilities and MNE global strategy: a systematic literature review-based novel conceptual framework. J. Manage. Stud. 61, 3295–3326. doi: 10.1111/joms.13021
Rambachan, A., and Roth, J. (2023). A more credible approach to parallel trends. Rev. Econ. Stud. 90, 2555–2591. doi: 10.1093/restud/rdad018
Rosinger, K., Ortagus, J., Kelchen, R., and Choi, J. (2023). The impact of performance funding policy design on college access and selectivity. Educ. Eval. Policy Anal. 45, 655–681. doi: 10.3102/01623737221147905
Ruiz-Ortega, M. J., Rodrigo-Alarcón, J., and Parra-Requena, G. (2024). New directions to create dynamic capabilities: the role of pioneering orientation and interorganizational relationships. Eur. Manag. J. 42, 371–384. doi: 10.1016/j.emj.2023.01.005
Scharte, B. (2024). The need for general adaptive capacity—discussing resilience with complex adaptive systems theory. Risk Anal. 45, 1443–1452. doi: 10.1111/risa.17676
Scott, W. R. (2014). Institutions and organizations: ideas, interests and identities. Thousand Oaks, California: SAGE Publications, Inc.
Selten, F., and Klievink, B. (2024). Organizing public sector AI adoption: navigating between separation and integration. Gov. Inf. Q. 41:101885. doi: 10.1016/j.giq.2023.101885
Semken, C., and Rossell, D. (2022). Specification analysis for technology use and teenager well-being: statistical validity and a Bayesian proposal. J. R. Stat. Soc. Ser. C. Appl. Stat. 71, 1330–1355. doi: 10.1111/rssc.12578
Senge, P. M. (1990). The fifth discipline: the art and practice of the learning organization. 1st ed. Edn. New York: Doubleday/Currency.
Song, X., and Xu, D. (2024). More graduates, fewer skills? Vocational education expansion and skilled labour shortages in China. China Q. 260, 970–985. doi: 10.1017/S0305741023001856
Sydow, J., Schreyögg, G., and Koch, J. (2009). Organizational path dependence: opening the black box. Acad. Manag. Rev. 34, 689–709. doi: 10.5465/amr.34.4.zok689
Tang, L., Wang, T., Guan, F., and Sun, L. (2025). Don’t ignore either side: the differential impact of ego-network density of the focal firm and partner on technological invasion. Eur. Manag. J. 43, 628–639. doi: 10.1016/j.emj.2024.05.005
Teece, D. J. (2007). Explicating dynamic capabilities: the nature and microfoundations of (sustainable) enterprise performance. Strateg. Manag. J. 28, 1319–1350. doi: 10.1002/smj.640
Teece, D. J., Pisano, G., and Shuen, A. (1997). Dynamic capabilities and strategic management. Strateg. Manag. J. 18, 509–533. doi: 10.1002/(SICI)1097-0266(199708)18:7<509::AID-SMJ882>3.0.CO;2-Z
Theobald, R., Xu, Z., Gilmour, A., Lachlan-Hache, L., Bettini, E., and Jones, N. (2025). The impact of a $10,000 bonus on special education teacher shortages in Hawai‘i. Educ. Eval. Policy Anal. :01623737241310905. doi: 10.3102/01623737241310905
Tonellato, M., Tasselli, S., Conaldi, G., Lerner, J., and Lomi, A. (2024). A microstructural approach to self-organizing: the emergence of attention networks. Organ. Sci. 35, 496–524. doi: 10.1287/orsc.2023.1674
Tsionas, M., Parmeter, C. F., and Zelenyuk, V. (2023). Bayesian artificial neural networks for frontier efficiency analysis. J. Econ. 236:105491. doi: 10.1016/j.jeconom.2023.105491
van der Voet, J., and Lerusse, A. (2024). Performance information and issue prioritization by political and managerial decision-makers: a discrete choice experiment. J. Public Adm. Res. Theory 34, 582–597. doi: 10.1093/jopart/muae011
van Triest, S. (2024). Incentives and effort in the public and private sector. Public Adm. Rev. 84, 233–247. doi: 10.1111/puar.13691
Visser, E. L., and van Hulst, M. (2023). The performance and development of deliberative routines: a practice-based ethnographic study. J. Public Adm. Res. Theory 34, 92–104. doi: 10.1093/jopart/muad006
Wager, S., and Athey, S. (2018). Estimation and inference of heterogeneous treatment effects using random forests. J. Am. Stat. Assoc. 113, 1228–1242. doi: 10.1080/01621459.2017.1319839
Wang, W., and Zhang, Y. (2024). Wild bootstrap inference for instrumental variables regressions with weak and few clusters. J. Econ. 241:105727. doi: 10.1016/j.jeconom.2024.105727
Xu, Z., Zhao, Y., Liew, J., Zhou, X., and Kogut, A. (2023). Synthesizing research evidence on self-regulated learning and academic achievement in online and blended learning environments: a scoping review. Educ. Res. Rev. 39:100510. doi: 10.1016/j.edurev.2023.100510
Yang, W., and Wang, Y. (2024). Higher-order structures of local collaboration networks are associated with individual scientific productivity. EPJ Data Sci. 13:15. doi: 10.1140/epjds/s13688-024-00453-6
Keywords: performance-based funding, Adaptive Governance Capacity, institutional heterogeneity, Chinese vocational education, causal machine learning
Citation: Yan H, Xin L, Xiaoping W, Yanqiu M and Jinyu Z (2025) Adaptive capacity and performance-based funding effectiveness: evidence from Chinese vocational education. Front. Educ. 10:1652473. doi: 10.3389/feduc.2025.1652473
Edited by:
Rolando Salazar Hernandez, Universidad Autónoma de Tamaulipas, MexicoReviewed by:
Rafid Alhadrawi, University of Kufa, IraqKawar Mohammed Mousa, Near East University, Cyprus
Copyright © 2025 Yan, Xin, Xiaoping, Yanqiu and Jinyu. This is an open-access article distributed under the terms of the Creative Commons Attribution License (CC BY). The use, distribution or reproduction in other forums is permitted, provided the original author(s) and the copyright owner(s) are credited and that the original publication in this journal is cited, in accordance with accepted academic practice. No use, distribution or reproduction is permitted which does not comply with these terms.
*Correspondence: Huang Yan, Nzg1NjI1NDg3QHFxLmNvbQ==