 Qiang Li
 Feijie Zhou2
 Fulin Fan
- 1School of Electrical Engineering, Chongqing University, Chongqing, China
- 2Key Laboratory of Modern Power System Simulation and Control and Renewable Energy Technology, Ministry of Education (Northeast Electric Power University), Jilin, China
- 3Department of Electronic and Electrical Engineering, University of Strathclyde, Glasgow, United Kingdom
With the large-scale integration of renewable energy such as wind power and PV, it is necessary to maintain the voltage stability of power systems while increasing the use of intermittent renewable energy sources. The rapid development of energy storage technologies permits the deployment of energy storage systems (ESS) for voltage regulation support. This paper develops an ESS optimization method to estimate the optimal capacity and locations of distributed ESS supporting the voltage regulation of a distribution network. The electrical elements of the network integrated with PV and ESS are first modelled to simulate the voltage profile of the network. Then an improved multi-objective particle swarm optimization (PSO) algorithm is employed to minimise a weighted sum of the overall nodal voltage deviation from the nominal level across the network and across the time horizon and the energy capacity of ESS reflecting the associated investment. The improved PSO algorithm adaptively adjusts the inertia weight associated with each particle based on its distance from the best known particle of the population and introduces the cross-mutation operation for a small distance to avoid falling into local optimal solutions. Then the dynamic dense distance arrangement is taken to update the non-inferior solution set and indicate potential global optimal solutions so as to keep the scale and uniformity of the optimal Pareto solution set. To mitigate the impact of decision makers’ preference, the information entropy based technique for order of preference by similarity to ideal solution is used to select the optimal combination of the ESS access scheme and capacity from the Pareto solution set. The proposed ESS optimization method is tested based on the IEEE 24-bus system with additional imports from high-voltage power supply. The voltage profile of the network simulated without the ESS or with the random or optimized ESS placement is compared to illustrate the effectiveness of the optimized ESS in performing voltage regulation under normal operation and supporting emergency power supply during high-voltage transmission failures.
Introduction
Due to the continuous consumption of fossil fuels and the resulting aggravation of environmental pollution, the utilization of renewable energy sources (RES) has developed rapidly in recent years. A high proportion of RES integrated within distribution networks separately features the superposition of the output randomness and volatility which may cause violent fluctuations of the node voltage (Jung et al., 2014; Watson et al., 2016; Hasheminamin et al., 2018) and thus seriously affect the power quality of networks. Therefore, it is of great significance to study the problem of voltage limit exceedance given the large-scale integration of RES.
With the rapid development of electrochemical energy storage technologies, the technical and economic maturity of battery energy storage technology have been greatly improved. The energy storage systems (ESS) installed within electrical grids can effectively improve the grid’s ability to absorb renewable energy and deal with integration problems such as the voltage limit violation caused by the high penetration of renewable energy. Meanwhile, it can provide emergency power supply when a short-circuit fault occurs, mitigating the system impacts caused by serious failures.
The voltage regulation of active distribution networks have been investigated in considerable research which can be divided into three main aspects: 1) changing electric power distribution; 2) adjusting transformer taps; and 3) installing reactive power compensation devices. References (Zhou and Bialek, 2007; Tonkoski and Lopes, 2011; Yap et al., 2014) have proposed strategies to reduce the PV power output to improve the voltage level at the cost of a decreased efficiency of solar energy conversion. References (Jashfar and Esmaeili, 2014; Collins and Ward, 2015; Zad et al., 2015) put forward voltage regulation approaches by using PV system inverters for reactive power compensation. In addition, references (Esslinger and Witzmann, 2012; El Moursi et al., 2014) improved voltage levels based on the on-load regulating transformer. From the perspective of model predictions, Zhao et al. (Zhao et al., 2016) developed a method for voltage regulation through installing reactive power compensation devices and adjusting wind turbine outputs. In (Yoshida et al., 2000), voltage regulation was implemented by adjusting generator outputs, transformer taps, and the capacity of reactive power compensation devices. A coordinated control method for on-load voltage regulation and reactive power compensation was proposed in (Salih and Chen, 2016; Kulmala et al., 2014) for distribution systems with RES. Similarly, reference (Brenna et al., 2013) developed a distributed voltage control method to automatically regulate the voltage and reactive power of substations. Reference (Senjyu et al., 2008) optimized the control of distribution voltage with the coordination of distributed installations including the load ratio control transformer, step voltage regulator, shunt capacitor, shunt reactor, and static var compensator (SVC). In (Bakir and Kulaksiz, 2019), four proportional-integral controllers in STATCOM were optimized to reduce the voltage fluctuation and improve the voltage stability. Dong et al. (Dong et al., 2005) made full use of the reactive power margin of the generator for voltage regulation. In (Azzouz et al., 2015), the vehicle-to-grid technology, distributed power supply, and transformer tap were coordinated to regulate the voltage in real time. Daratha et al. (Daratha et al., 2014) proposed a two-stage control strategy comprising transformer tap adjustment and SVC compensation. In (Alam et al., 2012), a local charge and discharge controller was designed for distributed ESS to deal with the over-voltage problem at the point of common coupling caused by PV generation. Based on the consistency algorithm, a distributed coordinated control method was developed in (Mokhtari et al., 2012) which, however, did not consider the differences of state of charge (SOC) and constraints on charge and discharge rates between distributed ESS. A mathematical model of the ESS within power system was described in (Bachurin et al., 2018). In addition, Sugihara et al. (Sugihara et al., 2013) assessed the feasibility of employing the user-side ESS to suppress voltage fluctuations from the economic point of view. In (Mehmood et al., 2017), the ESS location within the system was optimised to improve the service life and voltage regulation of ESS. Liu et al. (Liu et al., 2012) proposed a coordinated control of distributed ESS with traditional voltage regulators including on-load tap changer transformers and step voltage regulators to alleviate the voltage rise problem caused by the high PV penetration in the low-voltage distribution network. In (Nara et al., 2005), voltage control effects of distributed generators (DGs) were discussed based on a simplified radial distribution network. A voltage control method performing the partial generation rejection of PV systems was proposed in (Lin et al., 2012), based on which the installed capacity of PV systems was optimized to maximize the net present value of the systems. Muttaqi et al. (Muttaqi et al., 2013) proposed a control coordination technique which exploited the DG ability as a voltage regulator and minimized the interaction with other active devices. Li et al. (Yang et al., 2018) proposed a two-stage optimization method for the optimal distributed generation planning with the ESS integration. Mehmood et al. (Mehmood et al., 2017) optimised the location and size of ESS considering the battery life and the voltage quality of distribution network. Jannesar et al. (Jannesar et al., 2018) optimised the location and capacity of a battery ESS as well as day-ahead schedules based on a cost function including energy arbitrage, environmental emission, energy losses, transmission access fee, as well as capital and operating costs of the battery ESS.
To alleviate the voltage limit violation caused by the increased use of RES, many literatures regulate the node voltage from the perspective of conventional generator outputs and reactive power compensation devices but rarely consider the optimization of ESS locations and sizes for voltage regulation. Therefore, this paper will propose an ESS optimization method to estimate the best capacity and locations of distributed ESS that support the voltage regulation and ensure the voltage stability of a distribution network. An improved multi-objective particle swarm optimization algorithm (PSO) is first used to minimize a weighted sum of the ESS energy capacity and the overall node voltage deviation from the nominal level simulated across the network and across the time horizon, producing the Pareto solution set which comprises potential global optimal solutions. Then the information entropy based technique for order of preference by similarity to ideal solution (TOPSIS) is used to determine the best combination of ESS capacity and locations from the Pareto solution set in order to mitigate the impact of decision-makers’ preference. The effectiveness of the proposed ESS optimization method is examined based on the IEEE 24-bus system through a comparison between the voltage profiles of the network without the ESS deployment or with the random or optimized ESS placement. In addition to the voltage regulation under normal operating conditions, the ESS performance in the emergency power supply is assessed when the network fails to import from additional high-voltage power supply.
This paper is structured as follows: describes the Modeling of Distribution Network Integrated With ESS and PV; establishes a multi-objective Optimization Model of ESS Capacity and Locations for Voltage Regulation; develops an Improved Multi-Objective Particle Swarm Optimization Algorithm for the ESS access scheme optimization based on the TOPSIS; Case Study implements simulation experiments based on the IEEE 24-bus system to validate the performance of the optimized ESS in the voltage regulation and emergency power supply; and presents Conclusion and Recommendations for Future Work.
Modeling of Distribution Network Integrated With ESS and PV
This section presents the modelling of distribution network, ESS and PV system. The distribution network model includes the network structure, load component and voltage distribution across the network without or with the connection of the ESS which is represented by an equivalent circuit of battery in combination with associated parameters.
Distribution Network Model
Most of the distribution networks in China have radial chain structures. The active and reactive power of the load within a distribution network are changing over time. A constant power static model is employed here for each instant to facilitate the simulation of voltage regulation. Supplementary Figure A1 shows a specific distribution network structure where a particular feeder is adopted for the ESS access.
Without the connection of the ESS, the voltage Um at the mth node (m = 1, … ,N) can be calculated as the difference between the voltage U0 at the node zero (i.e., a local substation) and the aggregate of the voltage drop ΔUp along each distribution line (p = 1, … ,m) that transfers electricity from the node zero to the mth node:
where ΔUp along the pth distirbution line that supports active Pn and reactive power Qn of the load at the downstream nth node (n = p, … ,N) is determined based on its resistance Rp and inductance Xp combined with the voltage Up at the pth node.
When the ESS accesses to the ith node, the voltage Um of the mth node located upstream of the ith node is formulated by:
where Pess and Qess denote active and reactive power outputs of the ESS. When the mth node is located downstream of the ith node, the voltage of the mth node can be determined as the difference between the voltage Ui at the ith node and the voltage drop ΔUi, m along distribution lines connecting the ith node to the mth node:
ESS Model
The widely employed lithium battery ESS is modelled in this study. The lithium battery is an electrochemical energy storage device which realizes the conversion between chemical and electric energy through its charging and discharging processes. In addition, it has high storage energy density and does not produce harmful heavy metal elements and substances, showing the characteristics of lightweight and green environmental protection. The terminal voltage of the battery generally changes with its current, i.e., the higher the battery current, the smaller the terminal voltage. Given a particular current level, the terminal voltage remains the same when the SOC is between 20 and 80% where a battery ESS mostly operates in practice. The SOC is an important basis for charging and discharging control and requires to be updated in real time (Fan et al., 2021). Given the battery ESS with energy capacity of Ahnom starting to operate from a full SOC, its SOC at a particular time t is calculated from the integral of its discharge and charge currents I over time:
A more detailed equivalent circuit of the battery (Rosewater et al., 2019) is shown in Figure 2. The open-circuit voltage VOCV is a function of the SOC and the internal resistance R0 of the battery in combination with additional impedance parameters (R1, C1, R2, and C2) that are used to describe dynamic characteristics of the battery. The terminal voltage V of the battery can be formulated by Eq. 6 where only VOCV is related to I and SOC. Supplementary Table S1 lists typical values of model parameters in Eq. 6 based on A123-M1 LiFePO4 battery (Cheng et al., 2016).
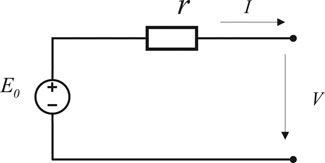
FIGURE 1. Simplified equivalent circuit diagram of the energy storage battery.
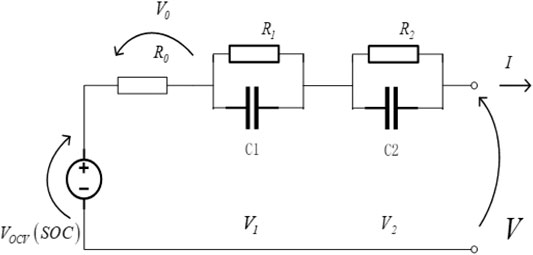
FIGURE 2. Detailed equivalent circuit diagram of the energy storage battery.
PV System Model
A PV system is composed of several PV panels that are combined according to certain rules. The aggregate power output of a PV system fluctuates with the change of light intensity which also has uncertainties. A particular model of the grid-connected PV system co-located with a battery ESS is shown in Supplementary Figure A2.
According to (Atwa et al., 2010; Teng et al., 2013), power outputs of a PV system could be modelled by the beta probability density function based on PV module parameters. Part of the electricity produced by the PV system during peak sunshine hours can be absorbed by the ESS through “peak shaving and valley filling”; when the PV system output is small or at night, then the ESS will put the electric energy onto the network for power supply, helping match the PV-ESS system output curve with the load profile in daily operation.
Optimization Model of ESS Capacity and Locations for Voltage Regulation
When a distribution network connects large-scale RES via ultra-high-voltage (UHV) transmission channels, its node voltage fluctuations will increase due to the randomness and volatility of renewable generation. In general, the ESS can be introduced to regulate the voltage profile of the main network and suppress the voltage fluctuations caused by groups of Distributed Generation Integration. Therefore, the selection of ESS locations is important for an optimal ESS configuration. It determines the efficiency of voltage regulation support from ESS to the greatest extent and helps the main network to maintain stable and reliable operation. This section will establish a multi-objective optimization model including the ESS capacity and locations for an efficient voltage regulation. The effective control of charging and discharging of the ESS placed at more suitable access points can better reduce the node power fluctuation and improve the voltage stability of the network.
Objective Function
The access locations of ESS within the distribution network are optimized here taking into account a trade-off between the voltage regulation performance and the total energy capacity of ESS which are described by the normalised functions f1* and f2*, respectively. The weight coefficients α and β are introduced to transform the functions f1* and f2* into a single objective function f in Eq. 7. The voltage regulation performance f1 of ESS is inversely quantified based on the overall deviation between the node voltage Ui (i = 1, … ,N) and the nominal level U0 across the network and across the time horizon (t = 1, … ,T) in Eq. 8. The total ESS energy capacity ETC representing f2 in Eq. 9 and f1 are normalised by Eq. 10 based on their respective minimum fimin and maximum fimax values such that f1* and f2* range from 0 to 1.
Constraints
Operation Constraints of Distribution Network
(1) Power balance constraints of distribution network:
where subscripts Gi, RESi, Li, and Ei in Eq. 11 represent the conventional generating unit, RES, load and ESS connected to the ith node; terms ΔPi(t) and ΔQi(t) are the active and reactive power flowing into the ith node; terms Gij and Bij in Eq. 12 denote the real and imaginary parts of the element in the bus admittance matrix corresponding to the ith and jth nodes and θij is the difference in voltage angle between the ith and jth nodes.
(2) Node voltage constraints where
(3) Constraints on distribution network branch power where
(4) Ramp rate constraints of conventional generating units where RDi or RUi is the limit on ramping down or up:
(5) Export limits of conventional generating units where subscript Gimin or Gimax denotes the minimum or maximum limit:
ESS Configuration Constraints
(1) The constraints of ESS access points:
where EBC denotes the energy capacity of a single ESS, and given the limit of the total energy capacity ETC, Nmax is the maximum number of ESS that could be installed within the network which in turn limits the number NESS(i) of ESS connected to each node.
(2) ESS capacity and power constraints:
where Esto is the total ESS energy capacity at a particular node and superscripts D and C denote discharging and charging phases of ESS, respectively, which must not violate the maximum allowable discharge rate
(3) The constraints of ESS operation:
where Ei(t) is the total energy stored in ESS at the ith node at time step t which is determined based on their charge and discharge rates over previous time steps in combination with charging and discharging efficiencies denoted by ηc and ηd, respectively, and is maintained between 20 and 100% of Esto(i).
Improved Multi-Objective Particle Swarm Optimization Algorithm
Particle Swarm Optimization
The particle swarm optimization (PSO) is a stochastic optimization algorithm that minimizes an objective function starting from a group of randomly produced particles which travel in the problem space until convergence is reached (Kennedy and Eberhart, 1995). The particles jointly adjust speeds and directions of their motion based on their own and group information and search for the optimal solution through iteration. In the kth iteration, each particle updates its speed
where ω is an inertia weight associated with the present particle speed
The conventional PSO-based method dealing with a multi-objective problem combines the Pareto sorting mechanism with the basic PSO algorithm to determine the best known solution of the particle and update the non-inferior solution set based on the dominating relationship between particles. The conventional multi-objective PSO algorithm has the following problems in the solution process: 1) lack of guidance on the value of ω; 2) poor diversity and distribution of the Pareto solution set due to the improper update and maintenance strategy of the non-inferior solution set; 3) lack of guidance on the selection of the global optimal solution; and that 4) the loss of population diversity is fast and the PSO is likely to fall into local optima. Therefore, the paper makes the following improvements on the basis of the Pareto sorting based multi-objective PSO algorithm.
Improved Multi-Objective Particle Swarm Optimization
Adaptive Inertia Weight
The inertia weight ω has a significant impact on the convergence performance of the PSO algorithm. Most of the commonly used methods linearly or non-linearly reduce the ω value with the increasing number of iterations without considering the particle characteristics in the iterative process, and thus lack guidance on the adjustment of ω. The difference between the particle position vector and the best known solution of the population can reflect the distance from a particular particle to the best known particle of the population. When there is a larger gap between the current particle and the best known particle of the population, a greater ω should be used to permit the particle having better global searchability. When the distance from the best known particle of the population is reduced, a smaller ω will be adopted for better local searchability. In this study, the gap
Cross-Mutations
The PSO algorithm suffering from a premature convergence problem in iterative optimization may produce a local optimal solution. In order to increase the diversity of the population, the paper incorporates the cross-mutation operation of the genetic algorithm (Senjyu et al., 2006) into the PSO to cross-mutate the position vector of particles based on the difference X between the position vector of the particle and the best known position of the population. The specific steps are as follows:
(1) specify the threshold Xmin = 0.1 for X, mutation rate pm = 0.05, and crossover rate pc = 0.1;
(2) determine Xi for the particle i, and for Xi < Xmin, carry out crossover mutation on the particle; otherwise, go to step 5;
(3) select a random number rid within [0,1] for the position component of the particle i along each dimension, and for rid < pm, initialize the d-dimensional position component by Eq. 29;
(4) after the mutation, for rid < pc, cross the d-dimensional position component with the best known position of the population (i.e., the crossover object
(5) the cross-mutation is completed.
Non-Inferior Solution Set Update Based on Dynamic Dense Distance
When solving a multi-objective problem, the non-inferior solution set is updated in each iteration. To keep the scale of the Pareto solution set and the uniformity of solution distribution, it is necessary to select the best Pareto solution. The dense distance is used here to describe the density between particles and their surrounding particles as well as the uniformity of solutions. For a multi-objective optimization problem consisting of three objective functions f1, f2, and f3 as shown in Supplementary Figure A5, the dense distance I(xi) of the particle i is calculated by:
If the number of objective functions is n, then the dense distance of the particle i can be written as:
Once the dense distance of each Pareto solution is solved, it is sorted in a descending order and then screened. The common method is to select N solutions with large dense distances in sequence. Although this method is fast and only needs to calculate the dense distance of Pareto solution once in each iteration, it may result in the poor diversity and uniformity of Pareto solutions. The “one by one removal” method is used here to update the non-inferior solution, that is, the solution with the smallest dense distance is removed after sorting by cluster density, followed by calculating the dense distance of the remaining Pareto solutions until there are N Pareto solutions left.
Selection of Global Optimal Solution of Population
The PSO algorithm needs to track the best known positions of the particles and the population when updating the population. In a single-objective PSO process, the best known positions can be obtained directly by comparing the size of the particle fitness function. When the PSO deals with a multi-objective optimization problem, the result of each iteration is a group of independent Pareto solutions. This requires determining the global optimal solution from the Pareto solution set. To ensure the diversity and uniformity of Pareto solutions, the potential global optimal solution of the population could be randomly selected from the first 20% of Pareto solutions with larger dense distances based on their dense distance ranking.
Multi-Attribute Decision Making Based on TOPSIS
The final optimization result of the improved multi-object PSO algorithm is a set of Pareto solutions from which decision-makers need to select the optimal solution according to the preference information, which is essentially a multi-attribute decision-making problem. Instead of randomly selecting the potential global optimal solution from the Pareto solution set, the paper uses the technique for order of preference by similarity to ideal solution (TOPSIS) to choose the optimal solution based on information entropy. The TOPSIS assists in decision-making by calculating distances between alternative schemes and positive or negative ideal schemes and then determining the alternative that minimizes the distances from positive ideal schemes and maximizes the distances from negative ideal schemes. Given N schemes x1, x2, … , xN composed of non-inferior solutions in the Pareto solution set, each scheme xi (i = 1, … , N) comprises n attributes (i.e., the number of objective functions) with the mth attribute value denoted by
Then the relative distance d (xi) of the scheme xi is calculated based on the differences in normalized attribute values between xi and positive and negative ideal schemes by Eqs 33–35:
The TOPSIS method will assign weight to each objective in the calculation process where the selection of the weight has higher requirements on the experience and knowledge of decision-makers. To mitigate the influence of the decision-maker on the final decisions, the paper uses the information entropy method to determine the weight assigned to each objective by judging the value deviation of each objective within a Pareto solution set. Given a particular objective having a smaller value deviation within the solution set, the influence of the objective value on the final decision-making or the associated weight should be small.
Optimization of ESS Locations and Operation
When the number and capacity of distributed ESS are determined, their locations and import/export require to be optimized. Given
To restore the SOC of each ESS back to its initial SOC level at the end of the time horizon, the active power of a particular ESS at the final time step T is corrected by:
A flowchart describing the process of the improved multi-objective PSO algorithm for the combined estimation of location and capacity of distributed ESS is shown in Supplementary Figure A6.
Case Study
Simulation Case
The proposed improved multi-objective PSO based approach to optimizing ESS capacity and locations within a 12.66 kV distribution network is tested here based on the IEEE 24-bus system (see Supplementary Figure A7) with associated network parameters tabulated in Table 1. For detailed network topology parameters (e.g., line parameters and node load), the reader is referred to the standard calculation example in (Chang, 2012). Supplementary Figure A8 shows a typical daily curve of 15 min average total network demand with a maximum of 2.85 GW and 0.58 GVar. In addition to the local generating units supplying a maximum of 3.075 GW, the distribution network can import from the 200 MW UHV AC supply and the 400 MW UHV DC supply through nodes 17 and 6, respectively, as shown in Supplementary Figure A7. The daily profile of the normalized 15 min average power transfer across UHV transmission lines is shown in Figure 3 where UHV transmission line failures are presumed to occur around the middle of the day. The total energy capacity of ESS connected to each node is limited to 100 MWh, permitting an installation of up to five 20 MWh ESS. The proposed optimization method requires around 9.26 s to compute the optimal combination of ESS capacity and locations within the network.

TABLE 1. IEEE 24-bus based network parameters.
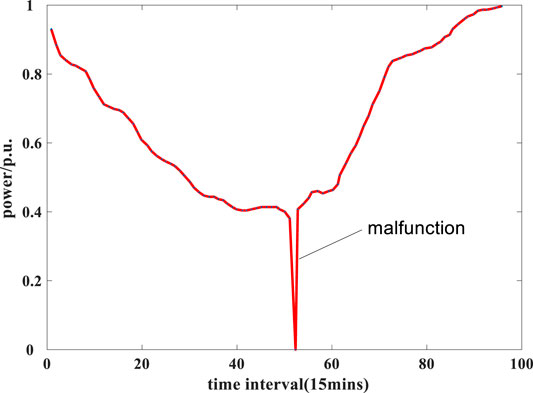
FIGURE 3. A particular daily profile of the normalized power transfer (p.u.) across UHV transmission lines.
Impacts of PV Access on Voltage Stability
To investigate the impacts of distributed generation on the voltage profile of the distribution network, four particular nodes, e.g., nodes 2, 9, 17, and 21 in Supplementary Figure A7, are selected here as the potential access points for distributed PV plants with a total installed capacity of 1 GW. Presuming that distributed PV plants export at their rated power, Figures 4, 5 compare the node voltage levels simulated without or with the PV access at two particular network load levels (i.e., the demand trough at time step 22 and the peak demand at time step 72), respectively, showing that the integration of PV plants aggravates the voltage deviation between nodes and reduces the overall voltage stability of the distribution network.
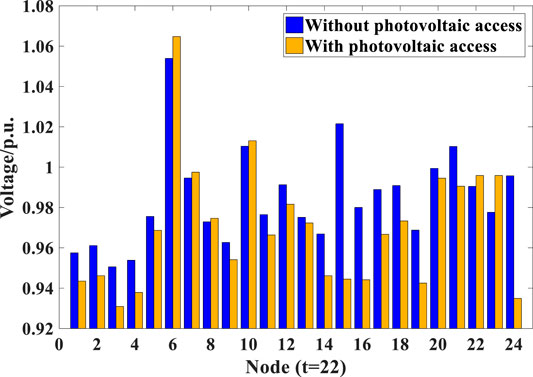
FIGURE 4. Node voltage levels (p.u.) simulated without or with the PV access at off-peak time (t = 22).
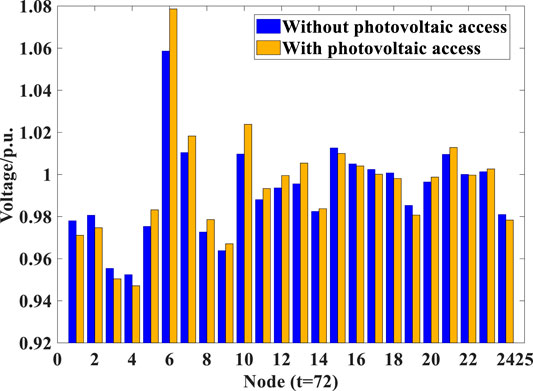
FIGURE 5. Node voltage levels (p.u.) simulated without or with the PV access at peak time (t = 72).
The impact of the PV access on voltage stability is additionally investigated based on the modelled PV power outputs on a typical sunny day. The resulting daily voltage profiles of the four PV access nodes are shown in Figure 6. Without the use of any voltage control method, the voltage levels at the PV access nodes 17 and 21 would experience larger variations within a day and exceed the upper and lower limits at some particular time steps. The significant exceedance over the upper voltage limit at the relevant PV access points is mainly caused by the reverse power flow of the PV system which results in a voltage rise. Therefore, when the voltage regulation is not performed, the DG access point is prone to the voltage limit violation which threatens the safe and reliable system operation.
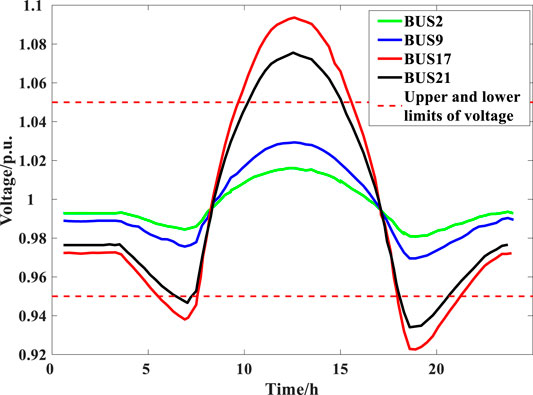
FIGURE 6. Daily voltage profiles of the four PV access nodes on a typical sunny day.
Simulation Scenarios Design
To verify the effectiveness of the proposed ESS optimization method, the following four scenarios are simulated to compare the voltage profile of the network without the ESS support or under the voltage regulation performed by distributed ESS which are randomly configurated or optimised by the proposed method:
Scenario 1: The distribution network with the PV integration but without the ESS deployment;
Scenario 2: The ESS capacity is optimized but with randomly selected locations within the network;
Scenario 3: The ESS capacity and locations within the network are optimized by the proposed method;
Scenario 4: The operation of the optimized ESS given short-circuit faults on UHV transmission lines.
Simulation Results
Impacts of ESS Deployment on Voltage Stability
The node voltage levels simulated in Scenarios 1 and 3 are compared here to investigate the impacts of the ESS deployment on voltage stability. Table 2 lists the optimal ESS locations and sizes determined by the improved multi-objective PSO algorithm. The distributed ESS with a total capacity of around 95 MW, 220 MWh are located at three access nodes 4, 6, and 10. The ESS connected to node 4 has a capacity of 8.62 MW, 20 MWh while the ESS connected to nodes 6 and 19 both have a total capacity of 43.08 MW, 100 MWh. As shown in Supplementary Figure A7, these ESS access nodes are concentrated around the distribution area of the UHV DC supply point.
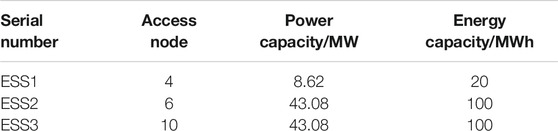
TABLE 2. Optimization results of ESS capacity and locations in Scenario 3.
The maximum and minimum node voltage levels across the network without or with the ESS placement at each time step are plotted in Figure 7. Without the ESS support in Scenario 1, the upper and lower node voltage limits are violated for the majority of the time. When the optimized ESS is placed on the network in Scenario 3, the difference between the maximum and minimum node voltage levels at each time step as well as the voltage fluctuations within the day are reduced. In addition, the node voltage levels across the network are well maintained within the upper and lower limits. Figure 8 compares histograms of node voltage levels across the network and across 96 15 min time steps between Scenarios 1 and 3. The node voltage levels in Scenario 3 are shown to be more concentrated around the nominal value than those in Scenario 1. The overall characteristics of node voltage levels in the two Scenarios are summarized in Table 3. The deployment of the optimised ESS is shown to not only reduce the overall voltage deviation from the nominal level by about 30.3% but also help to keep the node voltage within the limits, avoiding the voltage limit violation in around 17.4% of the voltage samples. The improvement of voltage stability in Scenario 3 illustrates the effective voltage regulation performed by the optimized ESS.
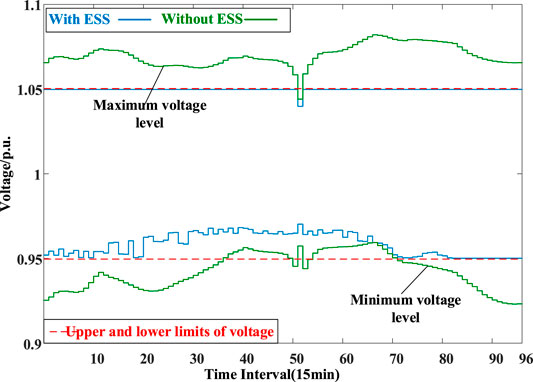
FIGURE 7. The maximum and minimum voltage levels (p.u.) across the network without or with the ESS deployment in a day.
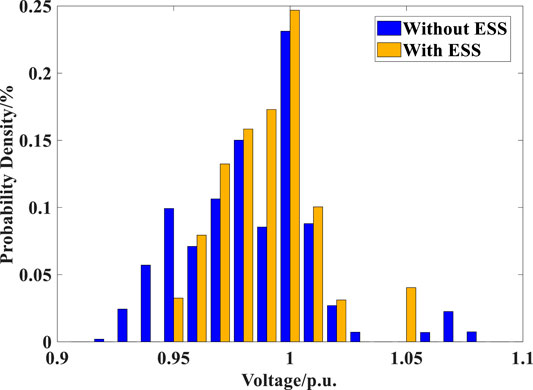
FIGURE 8. Histograms of node voltage (p.u.) across the network without or with the ESS deployment in a day.
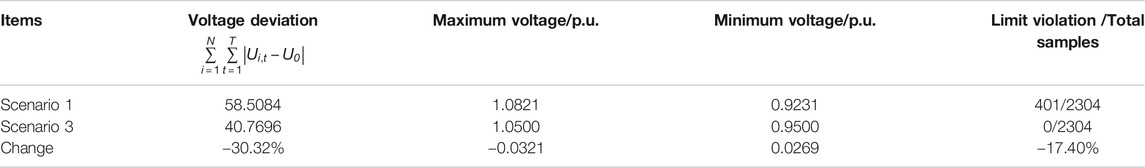
TABLE 3. Overall characteristics of node voltage in Scenarios 1 and 3.
The voltage profiles of the network simulated in Scenarios 1 and 3 during off-peak and peak periods (e.g., time steps 22 and 72) are compared in Figures 9, 10, respectively. Though conventional generators can support voltage regulation, their regulation capability is constrained by the ramp rate and export limits. In addition, the conventional generators distributed at some particular nodes cannot effectively deal with the fluctuations of the network load and the UHV power supply. When the network load is at a low level at time step 22, nodes 1–4, 6, 14–16, 19, and 24 suffer from large voltage deviations (see Figure 9) which cannot meet the network voltage requirements. Though the lower voltage limit violation is alleviated at peak time, the rise above the upper voltage limit at node 6 increases (see Figure 10). The operation of the optimized ESS can provide active support to the network and alleviate the power fluctuations at UHV transmission access nodes, improving the voltage stability of the network as shown in Figures 9, 10.
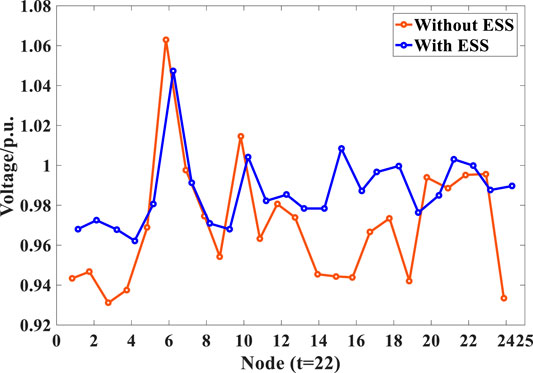
FIGURE 9. The voltage profile (p.u.) of the network without or with the ESS deployment at off-peak time (time step 22).
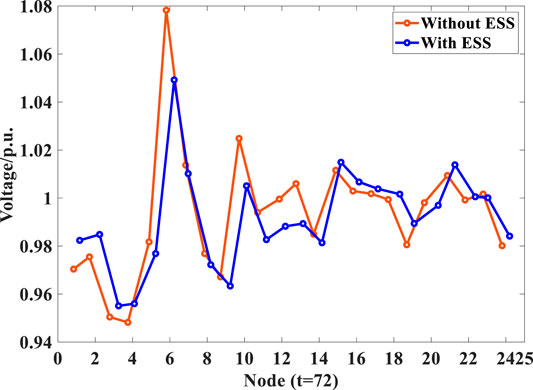
FIGURE 10. The voltage profile (p.u.) of the network without or with the ESS deployment at peak time (time step 72).
Impacts of ESS Optimization on Voltage Stability
The node voltage levels simulated in Scenarios 2 and 3 are compared here to analyze the advantages of the proposed ESS optimization method in voltage regulation over the unoptimized ESS placement. Though considering the same number of ESS access nodes and the same ESS capacity as those obtained by the ESS optimization method in Table 2, the unoptimized method randomly determines the ESS access nodes within the network, e.g., nodes 3, 20, and 21 in Supplementary Figure A7, rather than the optimized access nodes 4, 6, and 10. Table 4 summarizes the overall characteristics of node voltage levels in Scenarios 2 and 3. Though the ESS placed at randomly selected access nodes in Scenario 2 slightly reduce the overall voltage deviation compared to Scenario 1, the maximum/minimum node voltage level still exceeds the upper/lower limit. (In total, 357 out of 2,304 voltage samples violate the voltage limits in Scenario 2). When the ESS are connected to the optimal access nodes in Scenario 3, the overall voltage deviation is further reduced without any voltage limit violation, showing more effective voltage regulation than the random ESS placement.

TABLE 4. Overall characteristics of node voltage in Scenarios 2 and 3.
The daily variations of the maximum and minimum node voltage levels across the network with the optimized or random placement of ESS are plotted in Figure 11 where the random placement results in the voltage limit violation for most of the time while the optimized placement maintains the node voltage within the upper and lower limits. Figure 12 compares histograms of the node voltage simulated based on the unoptimized or optimized ESS placement. The node voltage based on the unoptimized ESS placement shows a more spread distribution than those based on the optimized placement. Therefore, the voltage stability of the network cannot be effectively improved when the ESS are randomly connected to the network without the location optimization.
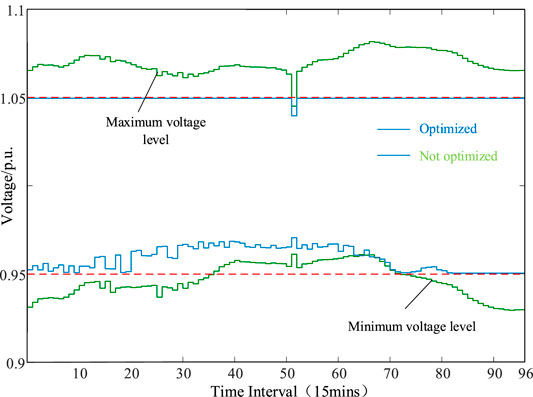
FIGURE 11. The maximum and minimum voltage levels (p.u.) across the network with the random or optimized ESS placement in a particular day.
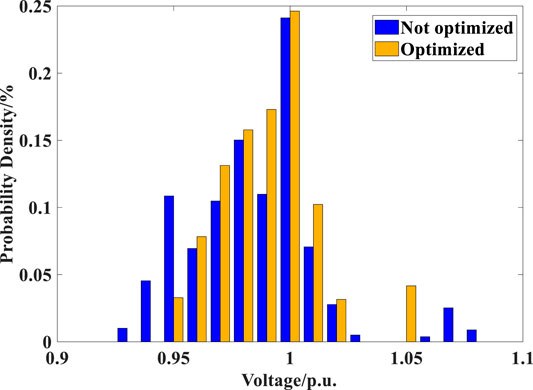
FIGURE 12. Histograms of node voltage (p.u.) across the network with the random or optimized ESS placement in a particular day.
The voltage profiles of the network simulated in Scenarios 2 and 3 at two particular time steps 22 and 72 with different load levels are compared in Figures 13, 14, respectively. The ESS connected to different nodes have various regulation effects on the power flow within the network. When the site selection is not optimized, though imports/exports of access nodes can be adjusted by the ESS, the regulation effect of the ESS is not consistent with the direction of improving the voltage regulation of the network due to the influence of their locations within the network. Therefore, the proposed ESS optimization method with its advantages of access location optimization plays a significant role in voltage regulation.
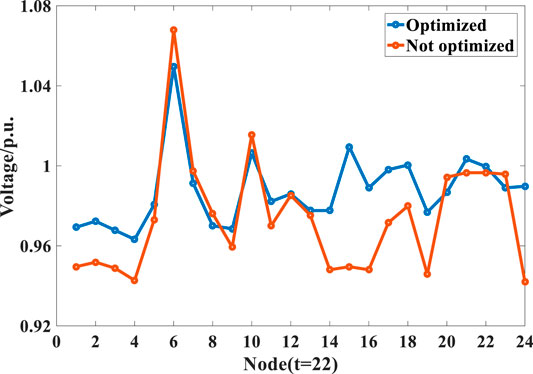
FIGURE 13. The voltage profile (p.u.) of the network with the random or optimized ESS placement at off-peak time (time step 22).

FIGURE 14. The voltage profile (p.u.) of the network with the random or optimized ESS placement at peak time (time step 72).
Emergency Power Supply by ESS Under Fault Conditions
To examine the ESS role in voltage regulation and power support under fault conditions, the ESS operation and the resulting voltage profile of the network are simulated when short-circuit faults are assumed to occur on the UHV transmission at time step 52 in Scenario 4. The fault occurrence forces the total UHV transmission power which would otherwise supply 240.6 MW to zero (see Figure 3). The power outputs of generating units on the network before UHV transmission failures and the ESS operation during fault occurrences are shown in Figure 15. To maintain the normal system operation before fault occurrences, the generating unit export is kept at such a high level that the generating unit sets at nodes 1, 2, 15, 16, and 18 reach their respective maximum allowable export limits and have no spare regulation capacity to deal with a power shortage. When the UHV transmission failures happen, the significant drops in the power injections of nodes 6 and 17 have certain impacts on power transfers across the lines connected to them. Since the generating unit sets with certain headroom in the regulation capacity are located at specific nodes, they cannot completely support the voltage regulation while the voltage profile of the network without the ESS operation would suffer from large variations as shown in Figure 16. To assist in the emergency power supply and the stable network operation during the fault period, Figure 15 shows that the ESS at nodes 6 and 10 export at their rated power to mitigate the impacts of UHV transmission failures on the power flow distribution within the network while the ESS at node 4 imports at its rated power to reduce the power fluctuation of the associated line, both helping to improve the voltage stability of the network (see Figure 16).
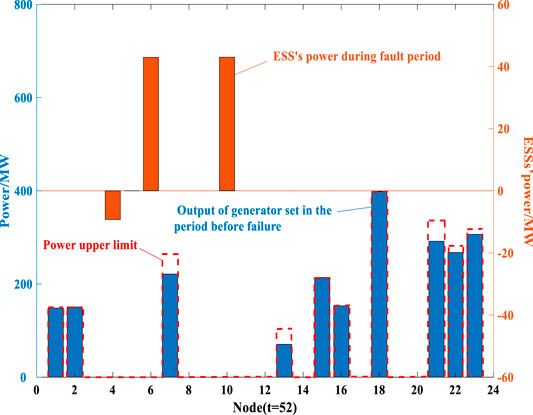
FIGURE 15. Power outputs (MW) of generating units before UHV transmission failures and discharge (+ve) and charge (−ve) rates (MW) of ESS during fault occurrences.
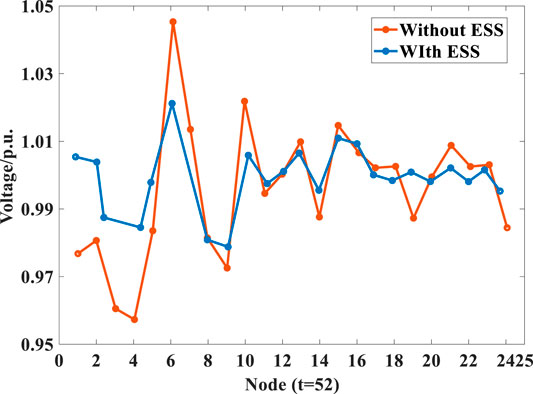
FIGURE 16. The voltage profile (p.u.) of the network without or with the ESS operation during UHV transmission failures (time step 52).
Conclusion and Future Work
This paper has proposed an improved multi-objective particle swarm optimization (PSO) based method to estimate the best combination of sizes and locations of distributed energy storage systems (ESS) that effectively support the voltage regulation of a distribution network with PV access. The improved multi-objective PSO algorithm produces an optimal Pareto solution set by minimising a weighted sum of the overall deviation between the voltage profile of the network and the nominal level across the time horizon and the energy capacity of ESS reflecting their investment. The adaptive adjustment of inertia weight and the cross-mutation operation have been introduced into the improved PSO algorithm to avoid falling into local optimal solutions while the dynamic dense distance of the particle has been employed to update the Pareto solution set in each iteration. Compared with the traditional PSO algorithm, the improvements have shown superiority in computation speed and permitted considering the voltage offset. Then the information entropy based technique for order of preference by similarity to ideal solution is used to determine the optimal access scheme of distributed ESS from the Pareto solution set, reducing the impact of decision-makers’ preference.
The effectiveness of the proposed ESS optimization method has been assessed by comparing voltage profiles of the modified IEEE 24-bus network without the ESS deployment or with the random or optimized ESS placement. Though the randomly placed ESS can slightly reduce the overall node voltage deviation from the nominal level, the upper and lower limits on the node voltage are still violated. When the ESS are connected to the optimized nodes around the access point of the ultra-high-voltage DC power supply, the overall node voltage deviation is largely reduced while the voltage limit violation is completely avoided in this work. The optimized deployment of distributed ESS has effectively coped with nodal power fluctuations caused by variations of local demand and PV generation and also supported the voltage regulation of the network to the maximum extent and the emergency power supply during ultra-high-voltage transmission failures.
Building on the present work, the proposed ESS optimization method will be applied to an expanded power system with more nodes and lines, finding the most suitable capacity and installation locations of distributed ESS for the system. Furthermore, the proposed method will be further examined based on the practical network operation of cities or provinces with high renewable energy penetration rates (e.g., “Three North regions” in China). Moreover, the follow-on research will address the location and capacity determination for grid-side ESS with high proportion of wind power connected to the distribution network.
Data Availability Statement
The original contributions presented in the study are included in the article/Supplementary Material, further inquiries can be directed to the corresponding author.
Author Contributions
QL performed the experiment and simulation; FZ and FG performed analysis and prepared the manuscript; FF revised the manuscript; and ZH contributed to the conception and supervision of the work.
Conflict of Interest
The authors declare that the research was conducted in the absence of any commercial or financial relationships that could be construed as a potential conflict of interest.
Supplementary Material
The Supplementary Material for this article can be found online at: https://www.frontiersin.org/articles/10.3389/fenrg.2021.641518/full#supplementary-material.
References
Alam, M. J. E., Muttaqi, K. M., and Sutanto, D. (2012). “Distributed energy storage for mitigation of voltage-rise impact caused by rooftop solar PV,” in Power and energy society general meeting, San Diego, CA, July 22–26, 2012 (San Diego, CA: IEEE), 1–8.
Atwa, Y. M., El-Saadany, E. F., Salama, M. M. A., and Seethapathy, R. (2010). Optimal renewable resources mix for distribution system energy loss minimization. IEEE Trans. Power Syst. 25 (1), 360–370. doi:10.1109/tpwrs.2009.2030276
Azzouz, M. A., Shaaban, M. F., and El-Saadany, E. F. (2015). Real-time optimal voltage regulation for distribution networks incorporating high penetration of PEVs. IEEE Trans. Power Syst. 30 (6), 3234–3245. doi:10.1109/tpwrs.2014.2385834
Bachurin, P. A., Zyryanov, V. M., Kiryanova, N. G., Kuchak, S., Metalnikov, D. G., Nesterenko, G. B., et al. (2018). “Mathematical model of the ESS in the power system,” in 2018 XIV international scientific-technical conference on actual problems of electronics instrument engineering, Novosibirsk, Russia, October 14, 2018 (Novosibirsk, Russia: APEIE), 41–47.
Bakir, H., and Kulaksiz, A. A. (2019). “Modelling and voltage control of the solar-wind hybrid micro-grid with optimized STATCOM,” in 2019 23rd international conference electronics, Palanga, Lithuania, June 17–19, 2019 (Palanga, Lithuania: IEEE), 1–6.
Brenna, M., Berardinis, E. D., Carpini, L. D., Foiadelli, F., Pietro, P., Paulon, P., et al. (2013). Automatic distributed voltage control algorithm in smart grids applications. IEEE Trans. Smart Grid 4 (2), 877–885. doi:10.1109/TSG.2012.2206412
Chang, Y. C. (2012). Multi-objective optimal SVC installation for power system loading margin improvement. IEEE Trans. Power Syst. 27 (2), 984–992. doi:10.1109/tpwrs.2011.2176517
Cheng, P., Zhou, Y., Song, Z., and Qu, Y. (2016). “Modeling and SOC estimation of LiFePO4 battery,” in International conference on robotics and biomimetics (ROBIO), Qingdao, China, December 3–7, 2016 (Qingdao, China: IEEE), 2140–2144.
Collins, L., and Ward, J. K. (2015). Real and reactive power control of distributed PV inverters for overvoltage prevention and increased renewable generation hosting capacity. Renew. Energ. 81, 464–471. doi:10.1016/j.renene.2015.03.012
Daratha, N., Das, B., and Sharma, J. (2014). Coordination between OLTC and SVC for voltage regulation in unbalanced distribution system distributed generation. IEEE Trans. Power Syst. 29 (1), 289–299. doi:10.1109/tpwrs.2013.2280022
Dong, F., Chowdhury, B. H., Crow, M. L., and Acar, L. (2005). Improving voltage stability by reactive power reserve management. IEEE Trans. Power Syst. 20 (1), 338–345. doi:10.1109/tpwrs.2004.841241
El Moursi, M. S., Zeineldin, H. H., Kirtley, J. L., and Alobeidli, K. (2014). A dynamic master/slave reactive power-management scheme for smart grids with distributed generation. IEEE Trans. Power Deliv. 29 (3), 1157–1167. doi:10.1109/tpwrd.2013.2294793
Esslinger, P., and Witzmann, R. (2012). “Regulated distribution transformers in low-voltage networks with a high degree of distributed generation,” in PES innovative smart grid technologies Europe (ISGT Europe), Berlin, Germany, October 14–17, 2012 (Berlin, Germany: IEEE), 1–7.
Fan, F., Zorzi, G., Campos-Gaona, D., Burt, G., Anaya-Lara, O., Nwobu, J., et al. (2021). Sizing and coordination strategies of battery energy storage system co-located with wind farm: the UK perspective. Energies 14 (5), 1439. doi:10.3390/en14051439
Hasheminamin, M., Agelidis, V. G., Ahmadi, A., Siano, P., and Teodorescu, R. (2018). Single-point reactive power control method on voltage rise mitigation in residential networks with high PV penetration. Renew. Energy 119, 504–512. doi:10.1016/j.renene.2017.12.029
Jannesar, M. R., Sedighi, A., Savaghebi, M., and Guerrero, J. M. (2018). Optimal placement, sizing, and daily charge/discharge of battery energy storage in low voltage distribution network with high photovoltaic penetration. Appl. Energy 226, 957–966. doi:10.1016/j.apenergy.2018.06.036
Jashfar, S., and Esmaeili, S. (2014). Volt/var/THD control in distribution networks considering reactive power capability of solar energy conversion. Int. J. Electr. Power Energy Syst. 60, 221–233. doi:10.1016/j.ijepes.2014.02.038
Jung, J., Onen, A., Arghandeh, R., and Broadwater, R. P. (2014). Coordinated control of automated devices and photovoltaic generators for voltage rise mitigation in power distribution circuits. Renew. Energy 66, 532–540. doi:10.1016/j.renene.2013.12.039
Kennedy, J., and Eberhart, R. (1995). “Particle swarm optimization,” in Proceeding international conference on neural networks, Perth, Australia, Novovember–December 1–27, 1995 (Perth, Australia: IEEE), 1942–1948.
Kulmala, A., Repo, S., and Jarventausta, P. (2014). Coordinated voltage control in distribution networks including several distributed energy resources. IEEE Trans. Smart Grid 5 (4), 2010–2020. doi:10.1109/tsg.2014.2297971
Lin, C.-H., Hsieh, W.-L., Chen, C.-S., Hsu, C.-T., and Ku, T.-T. (2012). Optimization of photovoltaic penetration in distribution systems considering annual duration curve of solar irradiation. IEEE Trans. Power Syst. 27 (2), 1090–1097. doi:10.1109/tpwrs.2011.2178619
Liu, X., Aichhorn, A., Liu, L., and Li, H. (2012). Coordinated control of distributed energy storage system with tap changer transformers for voltage rise mitigation under high photovoltaic penetration. IEEE Trans. Smart Grid 3 (2), 897–906. doi:10.1109/tsg.2011.2177501
Mehmood, K. K., Khan, S. U., Lee, S., Haider, Z. M., Rafique, M. K., and Kim, C. (2017). Optimal sizing and allocation of battery ESSs with wind and solar power DGs in a distribution network for voltage regulation considering the lifespan of batteries. IET Renew. Power Gener. 11 (10), 1305–1315. doi:10.1049/iet-rpg.2016.0938
Mokhtari, G., Nourbakhsh, G., and Ghosh, A. (2012). Smart coordination of energy storage units(ESUs) for voltage and loading management in distribution networks. IEEE Trans. Power Syst. 28 (4), 4812–4820. doi:10.1109/TPWRS.2013.2272092
Muttaqi, K. M., Le, A. D., Negnevitsky, M., and Ledwich, G. (2013). A coordinated voltage control approach for coordination of OLTC voltage regulator and DG to regulate voltage in a distribution feeder. IEEE Trans. Ind. Appl. 51 (2), 1073–1081. doi:10.1109/TIA.2014.2354738
Nara, K., Ishizu, S., and Mishima, Y. (2005). “Voltage control availability of distributed generators in power distribution system,” in Russia power tech, St. Petersburg, Russia, June 27–30 2005 (Petersburg, Russia: IEEE), 1–6.
Rosewater, D. M., Copp, D. A., Nguyen, T. A., Byrne, R. H., and Santoso, S. (2019). Battery energy storage models for optimal control. IEEE Access 7, 178357–178391. doi:10.1109/access.2019.2957698
Salih, S. N., and Chen, P. (2016). On coordinated control of OLTC and reactive power compensation for voltage regulation in distribution systems with wind power. IEEE Trans. Power Syst. 31 (5), 4026–4035. doi:10.1109/tpwrs.2015.2501433
Senjyu, T., Hayashi, D., Urasaki, N., and Funabashi, T. (2006). Optimum configuration for renewable generating systems in residence using genetic algorithm. IEEE Trans. Energy Convers. 21 (2), 459–466. doi:10.1109/tec.2006.874250
Senjyu, T., Miyazato, Y., Yona, A., Urasaki, N., and Funabashi, T. (2008). Optimal distribution voltage control and coordination with distributed generation. IEEE Trans. Power Deliv. 23 (2), 1236–1242. doi:10.1109/tpwrd.2007.908816
Sugihara, H., Yokoyama, K., Saeki, O., Tsuji, K., and Funaki, T. (2013). Economic and efficient voltage management using customer-owned energy storage systems in a distribution network with high penetration of photovoltaic systems. IEEE Trans. Power Syst. 28 (1), 102–111. doi:10.1109/tpwrs.2012.2196529
Teng, J.-H., Luan, S.-W., Lee, D.-J., and Huang, Y.-Q. (2013). Optimal charging/discharging scheduling of battery storage systems for distribution systems interconnected with sizeable PV generation systems. IEEE Trans. Power Syst. 28 (2), 1425–1433. doi:10.1109/tpwrs.2012.2230276
Tonkoski, R., and Lopes, L. A. C. (2011). Impact of active power curtailment on overvoltage prevention and energy production of PV inverters connected to low voltage residential feeders. Renew. Energy 36 (12), 3566–3574. doi:10.1016/j.renene.2011.05.031
Watson, J. D., Watson, N. R., Santos‐Martin, D., Wood, A. R., Lemon, S., and Miller, A. J. V. (2016). Impact of solar photovoltaics on the low‐voltage distribution network in New Zealand. IET Gener. Transm. Distrib. 10 (1), 1–9. doi:10.1049/iet-gtd.2014.1076
Yang, L., Feng, B., Li, G., Qi, J., Zhao, D., and Mu, Y. (2018). Optimal distributed generation planning in active distribution networks considering integration of energy storage. Appl. Energy 210, 1073–1081. doi:10.1016/j.apenergy.2017.08.008
Yap, W. K., Havas, L., Overend, E., and Karri, V. (2014). Neural network-based active power curtailment for overvoltage prevention in low voltage feeders. Expert Syst. Appl. 41 (4), 1063–1070. doi:10.1016/j.eswa.2013.07.103
Yoshida, H., Kawata, K., Fukuyama, Y., Takayama, S., and Nakanishi, Y. (2000). A particle swarm optimization for reactive power and voltage control considering voltage security assessment. IEEE Trans. Power Syst. 15 (4), 1232–1239. doi:10.1109/59.898095
Zad, B. B., Lobry, J., Vallee, F., and Hasanvand, H. (2015). Optimal reactive power control of DGs for voltage regulation of MV distribution systems using sensitivity analysis method and PSO algorithm. Int. J. Electr. Power Energy syst. 68, 52–60. doi:10.1016/j.ijepes.2014.12.046
Zhao, H., Wu, Q., Guo, Q., Sun, H., Huang, S., and Xue, Y. (2016). Coordinated voltage control of a wind farm based on model predictive control. IEEE Trans. Sustain. Energy 7 (4), 1440–1451. doi:10.1109/tste.2016.2555398
Keywords: distribution network, energy storage system, particle swarm optimization, photovoltaic energy, voltage regulation
Citation: Li Q, Zhou F, Guo F, Fan F and Huang Z (2021) Optimized Energy Storage System Configuration for Voltage Regulation of Distribution Network With PV Access. Front. Energy Res. 9:641518. doi: 10.3389/fenrg.2021.641518
Received: 14 December 2020; Accepted: 08 February 2021;
Published: 22 April 2021.
Edited by:
Yang Li, Northeast Electric Power University, ChinaReviewed by:
Liang Chen, Nanjing University of Information Science and Technology, ChinaShaoyan Li, North China Electric Power University, China
Copyright © 2021 Li, Zhou, Guo, Fan and Huang. This is an open-access article distributed under the terms of the Creative Commons Attribution License (CC BY). The use, distribution or reproduction in other forums is permitted, provided the original author(s) and the copyright owner(s) are credited and that the original publication in this journal is cited, in accordance with accepted academic practice. No use, distribution or reproduction is permitted which does not comply with these terms.
*Correspondence: Qiang Li, MTM4NDQyMzA5NjVAMTYzLmNvbQ==