 Xingbo Xu1,2*
 Haicheng Xu1,2
- 1School of Economics and Management, Chang’an University, Xi’an Shaanxi, China
- 2Traffic Economics Institute, Chang’an University, Xi’an Shaanxi, China
Studies on the CO2 emissions from the transportation sector in China are increasing, but their findings are inconclusive. The main reason is that the spatial correlation of CO2 emissions from the regional transportation sector has been ignored in examinations of the driving factors of CO2 emissions from this sector. In this paper, new emission factors are adopted to calculate the CO2 emission levels from the transportation sector in Chinese provinces. By fully considering the spatial correlation of regional CO2 emissions and based on a two-way Durbin model incorporating both spatial and temporal fixed effects, the driving factors of CO2 emissions from the transportation sector in China are studied. The CO2 and spatial regression results for the transportation sector in China suggest the following: 1) Most of the regions with the highest CO2 emissions from the Chinese transportation sector are located on the east coast; they have gradually expanded over time to include the central and western regions. 2) The CO2 emissions from the transportation sector are higher in South China than in North China, and the regions with higher CO2 emissions have gradually shifted from north to south. 3) Transportation activity intensity, urbanization level, technological level, industrial structure and per capita GDP greatly impact CO2 emissions from the transportation sector in each province of China. Among these factors, transportation activity intensity, urbanization level, and per capita GDP exert not only direct effects but also indirect effects, whereas technological level and industrial structure exert only direct effects.
Introduction
Forty years after the reform and opening up, the economic development of China has achieved world-renowned achievements. The advancement of the transportation industry has played a substantial role in promoting economic development. China has the world's largest transportation infrastructure, including highway and railway networks, which facilitates urbanization and industrialization. However, while the demand for transportation services is strengthening, the CO2 emissions from the transportation sector are increasing, resulting in increasingly serious environmental pollution. In 2017, China’s transportation sector contributed 4.4% of the country’s GDP, but its energy consumption accounted for 9.8% of its total energy consumption (Yearbook, 2018). The rapid growth of energy consumption in China’s transportation sector over the past forty years has exacerbated its CO2 emissions, and the CO2 emissions growth rate of its transportation sector is much higher than that of other industry sectors (Xie et al., 2019).
The high CO2 emissions and pollution generated by the transportation sector have attracted the attention of scholars in China and abroad. As a major contributor to global CO2 emissions, the CO2 emissions from the global transportation sector accounted for 24.34% of the total CO2 emissions in 2016, increasing by 4.34% from the level in 2012 (IEA, 2018). Although the energy consumption and CO2 emissions from the transportation sector in China are lower than 10%, with the strong development of China’s economy and the continuous improvement of its infrastructure, the demand for services in the transportation sector is growing rapidly, which may exacerbate the energy consumption of this sector and increase the overall CO2 emission level.
Many scholars have investigated the increasing CO2 emissions and energy consumption of the transportation sector both worldwide and in China. Applied ridge regression to assess the substitutability of the energy consumption of China’s transportation industry. Their results revealed that all energy inputs could be substituted, but they noted that oil and natural gas had a higher possibility of substitution than the other energy inputs (Xie and Hawkes, 2015). Performed scenario analysis and predicted the CO2 emissions from the Indian transportation sector (Paladugula et al., 2018). Evaluated the impacts of CO2 emissions-reduction policies or legal regulations on the CO2 emissions from small- and medium-sized transportation companies in France and found that they had little effect (Touratier-Muller et al., 2019). The above-described studies were focused on the overall CO2 emissions from the transportation industry. Furthermore, many researchers have conducted in-depth research on CO2 emissions from subsystems of the transportation sector, such as highway transportation (Yan and Crookes, 2009; Gambhir et al., 2015; Peng et al., 2018; Zuo et al., 2018; Zhang et al., 2019) and water transport and shipping systems (Andreoni and Galmarini, 2012; Chèze et al., 2013; Bo et al., 2019). Furthermore, due to their different organizational systems, the freight and passenger transportation subsectors differ in CO2 emissions performance. Scholars have analyzed the emissions from both subsectors to identify these differences (He et al., 2013; Hao et al., 2014; Hao et al., 2015; Luo et al., 2016; Wang et al., 2018; Lv et al., 2019).
At the Copenhagen Climate Change Conference in 2009, the Chinese government pledged to reduce its CO2 intensity by 40–45% from its 2005 level by 2020 (Yang et al., 2019). Facing high pressure to achieve emissions reduction, the Chinese government has implemented a series of environmental and low-carbon policies and measures; however, its overall CO2 emission levels remain very high. Therefore, it is necessary to formulate specific energy conservation and CO2 emissions-reduction measures for different industries and analyze the distribution and other characteristics of CO2 emissions from different industries and the driving factors. Especially in industries with high CO2 emissions, such as the transportation industry, emissions-reduction measures targeting the transportation sector are of great significance for realizing China’s emissions-reduction goals. Many scholars have examined the factors driving CO2 emissions from the transportation sector by considering the characteristics of CO2 emissions and the importance of energy conservation and emissions-reduction measures. At present, the main methods used to identify the factors influencing CO2 emissions in the transportation sector include the following: the logarithmic mean Divisia index (LMDI) method (Wang et al., 2011; Guo et al., 2014; Liu et al., 2015; Zheng et al., 2019), the structural decomposition analysis (SDA) method (Cansino et al., 2016; Dong et al., 2018), and the generalized Divisia index method (GDIM).
Determining the spatial correlation of CO2 emissions is one focus of research (Li and Li, 2020), and some studies have provided preliminary discussions of the spatial correlation of CO2 emissions in the transportation sector (Guo et al., 2014; Feng and Wang, 2018). However, analyses of the mechanisms underlying the spatial correlation of CO2 emissions in the transportation sector are limited and have not been analyzed using econometric methods. CO2, as a major component of greenhouse gases, has a typical transboundary effect; that is, CO2 emissions from one region can be transferred to neighboring regions through natural factors such as atmospheric circulation. With the extensive implementation of China’s regional integration policy and deepening market integration, China’s regional economic development shows strong spatial correlation (Bai et al., 2012). The occurrence of economic activity in a regional system necessarily depends on transportation, and activities such as inter-regional merchandise trade, technology diffusion and factor flow are all realized through transportation. As a result, CO2 emissions from the transportation sector in one region are transferred to neighboring regions along with economic activity. Furthermore, China is a vast country with widely varying topographic and geographic conditions. The plains areas have a more developed transportation infrastructure, which attracts a greater concentration of transportation activities. Therefore, the spatial correlation of transportation CO2 emissions is reflected in geographical factors.
Based on the above analysis, it is apparent that the drivers of CO2 emissions in a local transportation sector may affect the CO2 emissions of the transportation sector in neighboring regions through spatial correlation and may feedback to the local sector through spatial correlation. Therefore, when using regression methods to analyze the drivers of CO2 emissions in the transportation sector, ignoring the spatial correlation of the dependent variable is equivalent to omitting variables and can lead to biased model results (Elhorst, 2014a). The spatial econometric model, a new method, has been applied to many areas (Zhang et al., 2018; Bo et al., 2019; Li and Wang, 2019; Yang et al., 2019). Unlike the traditional regression model, the spatial econometric model fully considers regional spatial correlation, which can solve the above problems and thus allows more robust conclusions. Different from the existing literature, this paper adopts new emission factors to measure the CO2 emissions of China’s transportation sector. Based on the full consideration of the spatial correlation of CO2 emissions in the transportation sector, a geographic distance weight matrix and an economic geospatial weight matrix are constructed. Then, a two-way spatial Durbin model (SDM) is used to explore the CO2 emission level of China’s transportation sector and identify the influencing factors in the regional transportation sector. This approach can allow scientifically supported and reasonable energy-saving and emission reduction policies to be formulated for the Chinese transportation sector.
The next section introduces the methods, including the CO2 emissions calculation methods, spatial weight matrix, basic regression model construction and spatial correlation detection methods for the regional transportation sector. Moreover, the data sources are introduced in this section. Results presents the results, and Conclusions and Recommendations provides the conclusions and recommendations.
Methods and Data Sources
CO2 Emissions of the Transportation Sector
The CO2 emissions from the transportation sector are calculated based on the combustion of fossil fuels in the sector. Due to limitations in data sources, the smallest basic unit that can be used is the province. The CO2 emissions from the transportation sector in each province are calculated from the energy consumed for its transportation activities. Equation 1 describes the specific calculation method (Shan et al., 2018):
where
By summing the CO2 emissions of the different types of fossil fuels in the various transportation activities, Eq. 2 can be used to obtain the CO2 emissions from the provincial transportation sector:
The amount of fossil fuel consumed in the provincial transportation sector is derived from the fossil fuel consumed in the transportation, storage, and shipping industries based on the provincial terminal energy consumption in the China Energy Statistics Yearbook; it includes raw coal, cleaned coal, other washed coal, briquettes, gangue, coke, coke oven gas, blast furnace gas, converter gas, other gas, other coking products, crude oil, gasoline, kerosene, diesel, fuel oil, naphtha, lubricants, paraffin waxes and white spirit. (Supplementary Table S1 lists the fossil fuels consumed by the transportation sector in each province in 2016.)
Although the Intergovernmental Panel on Climate Change (IPCC) and the National Development and Reform Commission of China (NDRC) have defined specific values of
Spatial Weight Matrix
The traditional spatial weight matrix follows the ROOK adjacency rule (that is, the adjacency relationship between two adjacent regions is 1, and the adjacency relationship between two nonadjacent regions is 0), which cannot fully reflect the mutual influence of transportation activities between regions. In addition, the spatial interaction between different areas is not the same. Although the impact of transportation activities in underdeveloped areas on developed areas is weak, the transportation activities in developed areas may spread to neighboring underdeveloped areas. Therefore, based on comprehensive consideration of the spatial distance between regions and economic activity factors, the spatial weight matrix is constructed as follows:
According to the first law of geography, the spatial correlation between units gradually decreases with increasing distance. However, the straight-line distance between provinces in terms of latitude and longitude cannot accurately reflect the traffic correlation between provinces. Therefore, we construct a geographic distance weight matrix with the nearest interprovincial highway mileage using Eq. 3:
where
In addition, because transportation activities may be spatially related through the division of labor in the economic activities of two provinces or may be generated through the internal division of labor in economic activities, geographical factors are not the same as the spatial effects of transportation activities. One factor, such as socioeconomic attributes, can be the cause of the spatial correlation between transportation activities. Therefore, in this paper, an economic geospatial weight matrix combining geographic location and economic connection is constructed using Eq. 4:
where
Spatial Correlation
In this paper, to accurately identify the spatial correlation between transportation activities, spatial data are analyzed based on the global Moran’s I index via exploratory sequential data analysis (ESDA) with two spatial weight matrices, namely, a geographic distance weight matrix and an economic geospatial weight matrix. The calculation equation is as follows:
where
Spatial Econometric Model
The IPAT model proposed by American economists Holdren and Ehrlich in the 1970s is considered the main model used to explain the impacts of human activities on the ecological environment (Holdren and Ehrlich, 1974). They proposed that population size, per capita wealth and technological level are the main factors influencing the ecological environment. The standard IPAT model Eq. 6 is as follows:
where
In existing research, the indicators used to explore the driving factors of CO2 emissions include regional population, regional economic development level, urbanization level, industrial structure changes, transportation activity and the number of patents in specific regions, etc. (Lakshmanan and Han, 1997; Dong et al., 2018; Li et al., 2019; Ma et al., 2020). However, the number of regionally held patents varies by industry, and it is not clear how they relate to CO2 emissions from transportation (Albino et al., 2014). Therefore, in this article, the CO2 emissions stemming from fossil fuel combustion per unit GDP is used to characterize the level of technological progress in the transportation industry (Li et al., 2011). In addition, because CO2 emissions from road transportation account for the highest proportion of the transportation industry, representing more than 70% (Zhu and Du, 2019), and considering the availability of data, we use road transport turnover to reflect the intensity of transportation activity in each region.
By adding the indicators in Eq. 6, which are selected based on existing research and the above analysis, and taking the natural logarithm of the variables in Eqs. 6, 7 is obtained:
where:
Considering the possible spatial correlation of CO2 emissions from the transportation sector, it is necessary to compile a spatial econometric model reflecting spatial factors. The spatial Durbin model (SDM) is a general model that addresses spatial correlation and can be transformed into a spatial autoregressive model (SAR) and a spatial error model (SEM) under different coefficient settings. Therefore, in this paper, a two-way Durbin model with both fixed space and time effects is chosen to fit the data. The equation is as follows:
where:
In addition, the results of (Lesage, 2008) revealed that the use of the point estimation method to evaluate whether a spatial spillover effect existed in the spatial regression model would lead to deviations and possibly wrong conclusions. They believed that the direct and indirect effects of variables should be decomposed via partial differentiation. A change in an explanatory variable in a province will affect not only the CO2 emissions from the transportation sector in that province but also those from nearby provinces, and the effect will be transmitted back to the province via the feedback effect between provinces. Therefore, in this paper, partial differential decomposition of the regression results, including the control variables, is conducted based on the benchmark regression results, and the direct and indirect effects of each explanatory variable are obtained to measure the influence of each influencing factor on each region and its surrounding regions.
All the data on the above explanatory variables are retrieved from the China Statistical Yearbook 1997–2016. Due to the lack of data on Hong Kong, Macao, Taiwan and Tibet in the aforementioned statistical yearbook, the above model does not include any data on these four provinces, leaving only 30 provinces in China.
Results
CO2 Emissions Calculation
To reveal the CO2 emissions from the Chinese transportation sector in a more intuitive manner, Figures 1, 2 were constructed, which depict the spatial changes in the CO2 emissions from the transportation sector of China from 1997 to 2016 and those from the various provincial transportation sectors, respectively. Figure 2 shows that the CO2 emissions from the provincial transportation sectors in China have generally increased from 1997 to 2016. The transportation sector has high CO2 emissions, especially in the more economically developed coastal areas, such as Shanghai, Guangdong, and Jiangsu. The high emissions in these coastal areas may be related to the economic development there and the improvement of transportation infrastructure. Internal and external economic activities are more frequent in these regions. Since regional economic exchanges and interactions are intensive in these regions and demand for the transportation sector is higher in these regions than others, their CO2 emissions are high. Figure 3 reveals that with the rapid economic and social development, the demand for transportation, the energy consumption of the transportation sector and its CO2 emissions are all increasing.
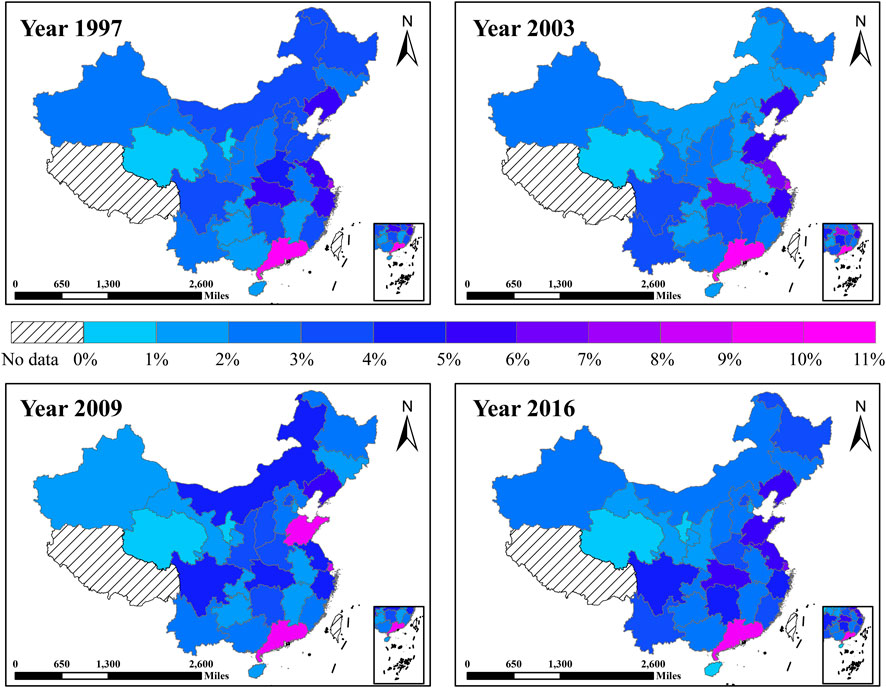
FIGURE 1. Spatial change in the CO2 emissions from the Chinese transportation sector from 1997 to 2016.
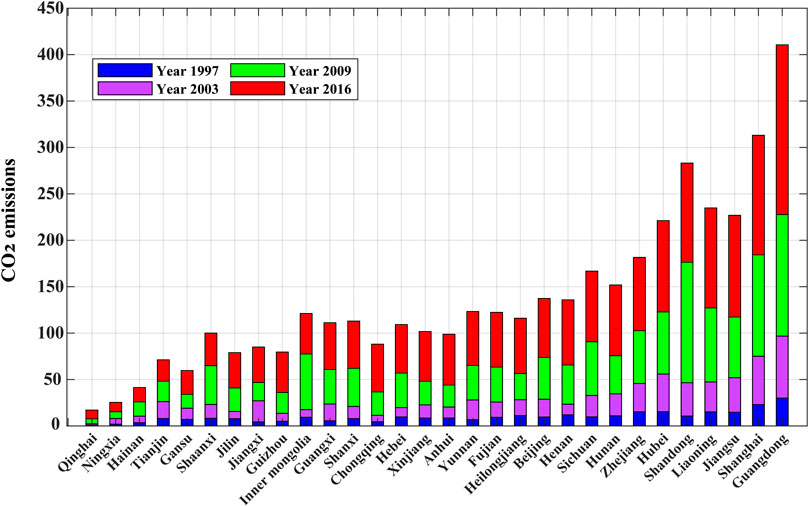
FIGURE 2. CO2 emissions from the transportation sector of Chinese provinces in 1997, 2003, 2009, and 2016.
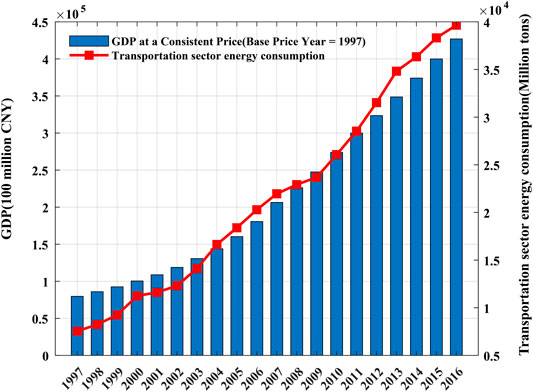
FIGURE 3. Relationship between the energy consumption and economic development of the Chinese transportation sector.
Figure 1 shows the spatial changes in the CO2 emissions from the Chinese transportation sector from 1997 to 2016. The CO2 emissions from the transportation sector in the provinces of China are generally increasing. Therefore, to more clearly characterize the spatial CO2 emissions changes, the CO2 emissions data of each province are normalized and mapped using ArcGIS software. Figure 1 reveals that among the provinces, those in the coastal areas have the highest CO2 emissions from the transportation sector; these levels have remained largely stable over time, with high emissions tending to spread inland. Figure 1 also shows that the overall CO2 emissions from the transportation sector in China are low. High-emission areas are gradually moving south; i.e., the number of southern areas with high CO2 emissions from the transportation sector is gradually increasing. Forty years after the reform and opening up, the economic development of the southern provinces has gradually surpassed that of the northern provinces. This rapid economic development has also driven the rapid development of the transportation sector, and its CO2 emissions have increased. In particular, within the central provinces, Wuhan has consistently had high CO2 emissions, which may be related to its advantageous geographical location. The CO2 emissions from the Sichuan transportation sector in the western transport hub province are also high, which may be associated with national major strategies, such as the development of the western region and the implementation of major strategies such as the Belt and Road Initiative. Hence, the demand of the transportation sector has also increased.
Spatial Correlation Test
As shown in Table 1, the global Moran’s I index is significantly higher than 0 (with values of 0.3149 and 0.3528) at a significance level of 1% (both p values = 0) regardless of whether the geographic distance weight matrix
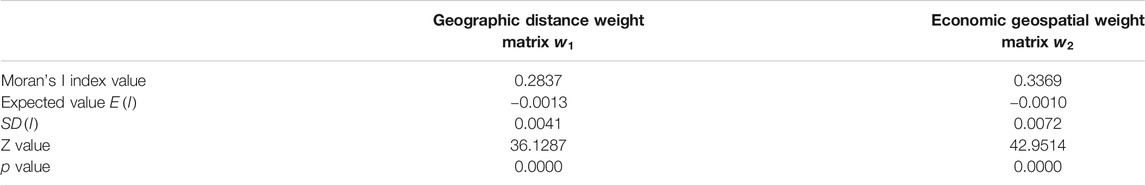
TABLE 1. Spatial correlation test of the transportation sector carbon emissions.
Spatial Econometric Model
Here, we test the applicability of the spatial panel model. According to (Elhorst, 2014b), two dimensions, from specific to general and from general to specific, are adopted to determine the adaptability of the data to the spatial econometric model. We take the forms of Lagrangian multipliers (LM-lag and LM-error) and robust Lagrangian multiplier variants (R-LM-lag and R-LM-error) to test for spatial autocorrelation using the base model that assumes no spatial dependence. The results are listed in Table 2.
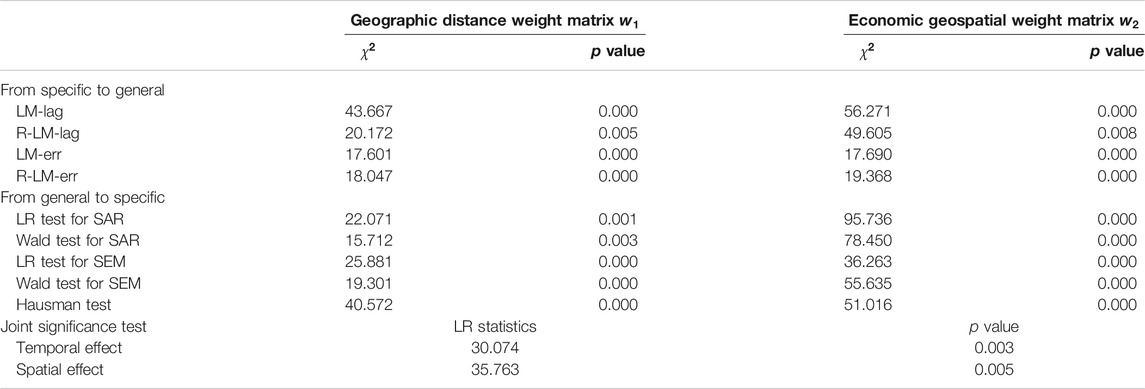
TABLE 2. Applicability test of the spatial panel model.
As shown in Table 2, the Hausman test results of the geographic distance and economic geospatial weight matrices are both significant at the 1% level, indicating that random effects can be rejected. Thus, a fixed effects model is appropriate. Furthermore, the joint significance test of the time and spatial effects reveals significant likelihood ratio (LR) statistics at the 1% significance level, indicating two-way fixed time and spatial effects.
In the test applying the specific-to-general concept, the model reveals both time and spatial effects. Both the LM and robust LM test results reject the null hypothesis of no spatial lag effect or spatial error effect, which indicates the existence of both spatial lag effect and spatial error characteristics. The LR and Wald tests of the general-to-specific concept yield p values less than 0.05, indicating that the SDM cannot be simplified into the spatial lag model or the SEM and that the SDM best fits the data.
Based on Eq. 9, the panel data of 30 provinces in China from 1997 to 2016 were analyzed to estimate the maximum likelihood function, and the regression results are summarized in Table 3. The regression results were subjected to partial differential decomposition to obtain the explanatory variables. The direct and indirect effects are listed in Table 4.
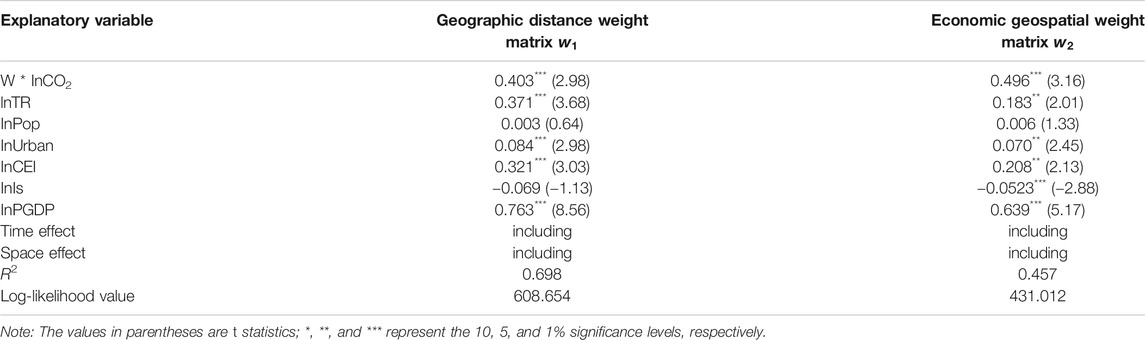
TABLE 3. Spatial econometric regression results.
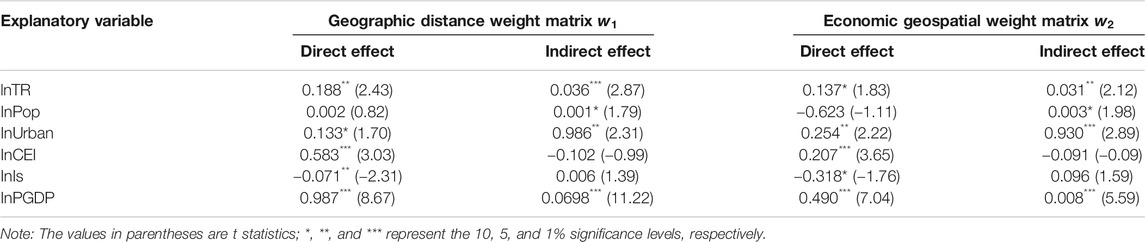
TABLE 4. Direct and indirect effects obtained via partial differential regression.
As shown in Table 3, the coefficient estimates of the endogenous interaction effect W* InCO2 of both the geographic distance weight matrix and the economic geospatial weight matrix are positive at a significance level of 1%, which indicates that the CO2 emissions from the provincial transportation sector have a significant positive spatial spillover effect. This is consistent with the conclusions from Table 1. The transmission and diffusion effects of the CO2 emissions of the regional transportation sector are clear. The robustness of the regression results is evidenced by lack of significant differences in the magnitude, negative sign and significance level of the coefficients of the explanatory variables under the
From the results in Table 4, we can draw the following conclusions:
(1) The direct and indirect effects of transportation activity intensity on the CO2 emissions of the transportation sector are both significantly positive. Specifically, in the model, a 1% increase in the intensity of transport activities corresponds to increases in CO2 emissions from the transportation sector in the local region and neighboring regions of 0.137 and 0.031%, respectively. This finding indicates that an increase in the intensity of transportation activities will not only increase the level of CO2 emissions from transportation in the region but also affect the level in neighboring regions through spatial correlation. As inter-regional economic interactions strengthen, inter-regional transportation becomes more frequent. Furthermore, when transportation activities in one region reach a certain level of concentration, they spread out, affecting the CO2 emissions of neighboring regions.
(2) A direct effect of population on the CO2 emissions from the provincial transportation sector is not clear. Neither the geographic distance weight matrix nor the economic geospatial weight matrix provides significant population coefficient estimates. However, the indirect effect of population size is significantly positive at the 10% level, wherein a population increase in a given region is expected to cause the CO2 emissions from the transportation sector in the adjacent regions to increase by 0.03%. An increase in population increases the demand in the transportation sector, such as demands for travel and energy. Regional travel and energy demands disperse the impact of CO2 emissions from the transportation sector to neighboring regions.
(3) The impact of urbanization level on CO2 emissions from the transportation sector in both local regions and neighboring regions is significantly positive and is stronger in neighboring regions (with coefficients of 0.254 and 0.930%, respectively). A higher urbanization level results in higher car ownership, higher transportation needs, and a more specialized transportation market, which significantly increase transportation-related CO2 emissions. Furthermore, since regions with high urbanization levels have greater economic development, the spillover effect on neighboring regions is stronger, and traffic-related CO2 emissions in neighboring regions increase more significantly.
(4) The impact of changes in technological level on regional transportation sector CO2 emissions is measured by the composite environmental index (CEI). Clearly, reducing the CO2 emissions per unit of GDP output and improving the technological level of the transportation sector would significantly reduce the CO2 emissions from this sector. More precisely, a 1% increase in CEI decreases CO2 emissions from transportation sector in the local region. Therefore, encouraging technological progress, promoting the technological level of the transportation sector and accelerating the use of new energy in this sector would be effective emissions-reduction measures for the transportation sector in any given region. The indirect effects of technological level are not significant, indicating that the technological level of a local transportation sector has a limited impact on the CO2 emissions of this sector in neighboring areas.
(5) The change in industrial structure is measured by the proportion of the tertiary industry, which has a notable impact on the reduction in CO2 emissions from the regional transportation sector. The higher the proportion of the tertiary industry is, the lower the CO2 emissions from the regional transportation sector are. Additionally, among the coefficients of the direct and indirect effects, only the coefficient of the direct effects is significant at the 10% level; according to the model, a 1% increase in the share of the tertiary sector would reduce CO2 emissions from the transportation sector by 0.318%, which indicates that the industrial structure has a significant impact on the CO2 emissions from the transportation sector. However, this impact does not include any indirect effects, indicating that changes in the industrial structure will reduce the level of CO2 emissions from the local transportation sector but have little impact on that of the surrounding areas. A possible reason for this finding is that changes in the regional industrial structure affect CO2 emissions from the regional transportation sector through industrial agglomeration and industrial spillover effects, but there is no certain way of affecting the surrounding areas.
(6) The impact of the level of regional development and affluence, represented by the GDP per capita, on the level of CO2 emissions from the regional transportation sector is significantly positive for both the direct and indirect effects. Specifically, a 1% increase in GDP per capita can be expected to increase CO2 emissions from the transportation sector in the local region and neighboring regions by 0.490 and 0.008%, respectively. In economically developed areas, regional economic and population transportation activities are more frequent, transportation needs are higher, and CO2 emissions from the transportation section are higher. Furthermore, due to the economic exchanges between regions, the transportation activities in developed areas spread to and thus affect less developed areas; i.e., the CO2 emissions generated by the transportation activities in a specific area will affect the surrounding areas.
In summary, the above results reveal that the spatial effect is of great significance for understanding the level of CO2 emissions of the transportation sector at the regional level and the influencing factors. The similarity of the spatial regression results between the geographic distance weight matrix
Conclusions and Recommendations
In this paper, we implement new CO2 emission factors to calculate CO2 emissions from the transportation sector in each province of China and explore the factors influencing CO2 emissions from this sector based on a two-way Durbin model. The conclusions are as follows:
(1) The CO2 emissions of China’s transportation sector exhibit strong positive spatial correlation. Most of the regions with the highest CO2 emissions from the transportation sector are located on the eastern coast of China; these regions have gradually spread to include central and western regions. The CO2 emissions of transportation sector in the south have gradually exceeded those in the north, and the regions with high CO2 emissions are spreading from the north into the south.
(2) The intensity of transportation activities, urbanization level, technology level, industrial structure, and GDP per capita have strong influences on the CO2 emissions from the transportation sector in each province of China. The intensity of transportation activities, urbanization level, and GDP per capita have not only direct effects but also indirect effects. Technological level and industrial structure only have direct effects.
Based on the above findings, we can formulate some policies to reduce the level of CO2 emissions from the Chinese transportation sector. First, while the level of urbanization continues to increase, we should continue to improve the policies related to transportation and maintain a governmental role in energy conservation and emission reduction in the transportation sector, engaging in measures such as accelerating the development of rail transit and integrating road use. Formulating corresponding policies and measures can achieve a win-win scenario for transportation and environmental protection by optimizing the transportation structure.
Second, we should fully utilize the role of the government in promoting new technologies, formulating policies related to active taxation and other new technologies and improving the New Energy Vehicle Subsidy Policy to promote and apply new energy technologies in the automotive industry. When new technologies are widely applied in a province, they must also be actively promoted and implemented in the surrounding provinces where conditions permit, and the scale and spillover effects resulting from the improvement of the technological level should be fully taken advantage of to promote the coordinated development of the economy and society.
Third, we should take advantage of regional comparative advantages, vigorously develop the tertiary industry, promote the transformation of regional industrial structures, and reduce the level of the CO2 emissions from the regional transportation sector. Finally, considering the spatial correlation of CO2 emissions from transportation, regional governments should strengthen the joint management of CO2 emissions from the transportation sector and form a regional emission-reduction linkage mechanism by formulating collaborative standards and policies. Furthermore, within urban regions, residents should be encouraged to choose public transport, such as public buses and subways, to reduce travel by private cars as much as possible. Outside urban regions, the transformation of long-distance transportation from highways to railways as well as regional traffic and transportation structures should be actively promoted to reduce the overall level of CO2 emissions.
Data Availability Statement
The raw data supporting the conclusions of this article will be made available by the authors, without undue reservation.
Author Contributions
HX contributed to conception and design of the study. XX organized the database, performed the statistical analysis, and wrote the first draft of the manuscript. XX and HX wrote sections of the manuscript. All authors contributed to manuscript revision, read, and approved the submitted version.
Funding
This research was funded by The Ministry of education of Humanities and Social Science project, grant number 19YJA790097.
Conflict of Interest
The authors declare that the research was conducted in the absence of any commercial or financial relationships that could be construed as a potential conflict of interest.
Supplementary Material
The Supplementary Material for this article can be found online at: https://www.frontiersin.org/articles/10.3389/fenrg.2021.664046/full#supplementary-material
References
Albino, V., Ardito, L., Dangelico, R. M., and Messeni Petruzzelli, A. (2014). Understanding the Development Trends of Low-Carbon Energy Technologies: A Patent Analysis. Appl. Energ. 135, 836–854. doi:10.1016/j.apenergy.2014.08.012
Andreoni, V., and Galmarini, S. (2012). European CO2 Emission Trends: A Decomposition Analysis for Water and Aviation Transport Sectors. Energy 45 (1), 595–602. doi:10.1016/j.energy.2012.07.039
Bai, C.-E., Ma, H., and Pan, W. (2012). Spatial Spillover and Regional Economic Growth in China. China Econ. Rev. 23 (4), 982–990. doi:10.1016/j.chieco.2012.04.016
Bo, X., Xue, X., Xu, J., Du, X., Zhou, B., and Tang, L. (2019). Aviation’s Emissions and Contribution to the Air Quality in China. Atmos. Environ. 201, 121–131. doi:10.1016/j.atmosenv.2019.01.005
Cansino, J. M., Román, R., and Ordóñez, M. (2016). Main Drivers of Changes in CO2 Emissions in the Spanish Economy: A Structural Decomposition Analysis. Energy Policy 89, 150–159. doi:10.1016/j.enpol.2015.11.020
Chèze, B., Chevallier, J., and Gastineau, P. (2013). Will Technological Progress Be Sufficient to Stabilize CO2 Emissions from Air Transport in the Mid-term? Transportation Res. D: Transport Environ. 18, 91–96. doi:10.1016/j.trd.2012.08.008
Dong, F., Yu, B., Hadachin, T., Dai, Y., Wang, Y., Zhang, S., et al. (2018). Drivers of Carbon Emission Intensity Change in China. Resour. Conservation Recycling 129, 187–201. doi:10.1016/j.resconrec.2017.10.035
Elhorst, J. P. (2014a). Spatial Econometrics: From Cross-Sectional Data to Spatial Panels. Heidelberg, New York, Dordrecht, London: Springer. doi:10.1007/978-3-642-40340-8
Elhorst, J. P. (2014b). Matlab Software for Spatial Panels. Int. Reg. Sci. Rev. 37 (3), 389–405. doi:10.1177/0160017612452429
Feng, C., and Wang, M. (2018). Analysis of Energy Efficiency in China’s Transportation Sector. Renew. Sustain. Energ. Rev. 94, 565–575. doi:10.1016/j.rser.2018.06.037
Gambhir, A., Tse, L. K. C., Tong, D., and Martinez-Botas, R. (2015). Reducing China’s Road Transport Sector CO2 Emissions to 2050: Technologies, Costs and Decomposition Analysis. Appl. Energ. 157, 905–917. doi:10.1016/j.apenergy.2015.01.018
Guo, B., Geng, Y., Franke, B., Hao, H., Liu, Y., and Chiu, A. (2014). Uncovering China’s Transport CO2 Emission Patterns at the Regional Level. Energy Policy 74, 134–146. doi:10.1016/j.enpol.2014.08.005
Hao, H., Geng, Y., Li, W., and Guo, B. (2015). Energy Consumption and GHG Emissions from China’s Freight Transport Sector: Scenarios through 2050. Energy Policy 85, 94–101. doi:10.1016/j.enpol.2015.05.016
Hao, H., Geng, Y., Wang, H., and Ouyang, M. (2014). Regional Disparity of Urban Passenger Transport Associated GHG (Greenhouse Gas) Emissions in China: A Review. Energy 68, 783–793. doi:10.1016/j.energy.2014.01.008
He, D., Liu, H., He, K., Meng, F., Jiang, Y., Wang, M., et al. (2013). Energy Use of, and CO2 Emissions from China’s Urban Passenger Transportation Sector - Carbon Mitigation Scenarios upon the Transportation Mode Choices. Transportation Res. A: Pol. Pract. 53, 53–67. doi:10.1016/j.tra.2013.06.004
Holdren, J. P., and Ehrlich, P. R. (1974). Human population and the global environment. Am. Scient. 62 (3), 282.
IEA (2018). IEA CO2 Emissions from Fuel Combustion. Paris: International Energy Agency (IEA), 36–50.
Lakshmanan, T. R., and Han, X. (1997). Factors Underlying Transportation CO2 Emissions in the U.S.A.: A Decomposition Analysis. Transport. Res. D Transport Environ. 2, 1. doi:10.1016/S1361-9209(96)00011-9
Lesage, J. P. (2008). An Introduction to Spatial Econometrics. Revue Déconomie Industrielle 123 (123), 513–514. doi:10.4000/rei.3887
Li, H., Mu, H., Zhang, M., and Li, N. (2011). Analysis on Influence Factors of China’s CO2 Emissions Based on Path-STIRPAT Model. Energy Policy 39 (11), 6906–6911. doi:10.1016/j.enpol.2011.08.056
Li, J., and Li, S. (2020). Energy Investment, Economic Growth and Carbon Emissions in China—Empirical Analysis Based on Spatial Durbin Model. Energy Policy 140, 111425. doi:10.1016/j.enpol.2020.111425
Li, S., and Wang, S. (2019). Examining the Effects of Socioeconomic Development on China’s Carbon Productivity: A Panel Data Analysis. Sci. Total Environ. 659, 681–690. doi:10.1016/j.scitotenv.2018.12.409
Li, Y., Du, Q., Lu, X., Wu, J., and Han, X. (2019). Relationship between the Development and CO2 Emissions of Transport Sector in China. Transport. Res. Part D: Transport Environ. 74 (Sep), 1–14. doi:10.1016/j.trd.2019.07.011
Liu, Z., Guan, D., Wei, W., Davis, S. J., Ciais, P., Bai, J., et al. (2015). Reduced Carbon Emission Estimates from Fossil Fuel Combustion and Cement Production in China. Nature 524 (7565), 335–338. doi:10.1038/nature14677
Liu, Z., Li, L., and Zhang, Y.-J. (2015). Investigating the CO2 Emission Differences Among China’s Transport Sectors and Their Influencing Factors. Nat. Hazards 77 (2), 1323–1343. doi:10.1007/s11069-015-1657-2
Luo, X., Dong, L., Dou, Y., Liang, H., Ren, J., and Fang, K. (2016). Regional Disparity Analysis of Chinese Freight Transport CO2 Emissions from 1990 to 2007: Driving Forces and Policy Challenges. J. Transport Geogr. 56, 1–14. doi:10.1016/j.jtrangeo.2016.08.010
Lv, Q., Liu, H., Yang, D., and Liu, H. (2019). Effects of Urbanization on Freight Transport Carbon Emissions in China: Common Characteristics and Regional Disparity. J. Clean. Prod. 211, 481–489. doi:10.1016/j.jclepro.2018.11.182
Ma, X., Chen, S., and Yang, H. (2020). Measuring Driving Factors and Decoupling Effect of Transportation CO2 Emissions in Low-Carbon Regions: A Case Study from Liaoning, China[J]. Polish J. Environ. Stud. 29 (5), 3715. doi:10.15244/pjoes/116604
Paladugula, A. L., Kholod, N., Chaturvedi, V., Ghosh, P. P., Pal, S., Clarke, L., et al. (2018). A Multi-Model Assessment of Energy and Emissions for India’s Transportation Sector through 2050. Energy Policy 116, 10–18. doi:10.1016/j.enpol.2018.01.037
Peng, T., Ou, X., Yuan, Z., Yan, X., and Zhang, X. (2018). Development and Application of China Provincial Road Transport Energy Demand and GHG Emissions Analysis Model. Appl. Energ. 222, 313–328. doi:10.1016/j.apenergy.2018.03.139
Shan, Y., Guan, D., Zheng, H., Ou, J., Li, Y., Meng, J., et al. (2018). China CO2 Emission Accounts 1997-2015. Sci. Data 5, 170201. doi:10.1038/sdata.2017.201
Shan, Y., Liu, J., Liu, Z., Xu, X., Shao, S., Wang, P., et al. (2016). New Provincial CO2 Emission Inventories in China Based on Apparent Energy Consumption Data and Updated Emission Factors. Appl. Energ. 184, 742–750. doi:10.1016/j.apenergy.2016.03.073
Song, J.-N., Wu, Q.-Q., Sun, Q.-P., Bao, X., and Du, K. (2015). SBM-undesirable Model-Based Efficiency Evaluation for Integrated Transportation. Jiaotong Yunshu Xitong Gongcheng Yu Xinxi/Journal Transportation Syst. Eng. Inf. Tech. 15 (5), 32–38.
Touratier-Muller, N., Machat, K., and Jaussaud, J. (2019). Impact of French Governmental Policies to Reduce Freight Transportation CO2 Emissions on Small- and Medium-Sized Companies. J. Clean. Prod. 215, 721–729. doi:10.1016/j.jclepro.2019.01.052
Wang, B., Sun, Y., Chen, Q., and Wang, Z. (2018). Determinants Analysis of Carbon Dioxide Emissions in Passenger and Freight Transportation Sectors in China. Struct. Change Econ. Dyn. 47, 127–132. doi:10.1016/j.strueco.2018.08.003
Wang, W. W., Zhang, M., and Zhou, M. (2011). Using LMDI Method to Analyze Transport Sector CO2 Emissions in China. Energy 36 (10), 5909–5915. doi:10.1016/j.energy.2011.08.031
Xie, C., and Hawkes, A. D. (2015). Estimation of Inter-fuel Substitution Possibilities in Chinas Transport Industry Using Ridge Regression. Energy 88, 260–267. doi:10.1016/j.energy.2015.05.034
Xie, R., Huang, L., Tian, B., and Fang, J. (2019). Differences in Changes in Carbon Dioxide Emissions Among China’s Transportation Subsectors: A Structural Decomposition Analysis. Emerging Markets Finance and Trade 55 (6), 1294–1311. doi:10.1080/1540496x.2018.1526076
Yan, X., and Crookes, R. J. (2009). Reduction Potentials of Energy Demand and GHG Emissions in China’s Road Transport Sector. Energy Policy 37 (2), 658–668. doi:10.1016/j.enpol.2008.10.008
Yang, Y., Zhou, Y., Poon, J., and He, Z. (2019). China’s Carbon Dioxide Emission and Driving Factors: A Spatial Analysis. J. Clean. Prod. 211, 640–651. doi:10.1016/j.jclepro.2018.11.185
Yearbook, C. S. (2018). China Statistical Yearbook. Beijing: National statistics bureau of the People’s Republic of China, China Statistics Press.
Zhang, C., and Nian, J. (2013). Panel Estimation for Transport Sector CO2 Emissions and its Affecting Factors: A Regional Analysis in China. Energy Policy 63, 918–926. doi:10.1016/j.enpol.2013.07.142
Zhang, G., Zhang, N., and Liao, W. (2018). How Do Population and Land Urbanization Affect CO2 Emissions under Gravity Center Change? A Spatial Econometric Analysis. J. Clean. Prod. 202, 510–523. doi:10.1016/j.jclepro.2018.08.146
Zhang, L., Long, R., Chen, H., and Geng, J. (2019). A Review of China’s Road Traffic Carbon Emissions. J. Clean. Prod. 207, 569–581. doi:10.1016/j.jclepro.2018.10.003
Zheng, J., Mi, Z., Coffman, D. M., Milcheva, S., Shan, Y., Guan, D., et al. (2019). Regional Development and Carbon Emissions in China. Energ. Econ. 81, 25. doi:10.1016/j.eneco.2019.03.003
Zhu, C., and Du, W. (2019). A Research on Driving Factors of Carbon Emissions of Road Transportation Industry in Six Asia-Pacific Countries Based on the LMDI Decomposition Method. Energies 12 (21), 4152. doi:10.3390/en12214152
Keywords: China’s transportation sector, CO2 emissions, driving factors, direct effects, indirect effects
Citation: Xu X and Xu H (2021) The Driving Factors of Carbon Emissions in China’s Transportation Sector: A Spatial Analysis. Front. Energy Res. 9:664046. doi: 10.3389/fenrg.2021.664046
Received: 04 February 2021; Accepted: 29 April 2021;
Published: 12 May 2021.
Edited by:
Greeshma Gadikota, Cornell University, United StatesReviewed by:
Iftekhar A. Karimi, National University of Singapore, SingaporeHussein Hoteit, King Abdullah University of Science and Technology, Saudi Arabia
Copyright © 2021 Xu and Xu. This is an open-access article distributed under the terms of the Creative Commons Attribution License (CC BY). The use, distribution or reproduction in other forums is permitted, provided the original author(s) and the copyright owner(s) are credited and that the original publication in this journal is cited, in accordance with accepted academic practice. No use, distribution or reproduction is permitted which does not comply with these terms.
*Correspondence: Xingbo Xu, NDM0MzMwMTMwQHFxLmNvbQ==