 Leyang Xue1,2
 Feier Chen
 Qiliang Xia
- 1State Key Laboratory of Ocean Engineering, School of Naval Architecture, Ocean and Engineering, Shanghai Jiao Tong University, Shanghai, China
- 2Grainger College of Engineering,University of Illinois Urbana-Champaign, Champaign, IL, United States
- 3Institute of Fintech, Shanghai University of Finance and Economics, Shanghai, China
- 4Shanghai Merchant Ship Design and Research Institute, CSSC, Shanghai, China
This study investigates the dynamic trading network structure of the international crude oil and gas market from year 2012 to 2017. We employed the dynamical similarity analysis at different time scales by inducing a multiscale embedding for dimensionality reduction. This analysis quantifies the effect of a global event on the dependencies and correlation stability at both the country and world level, which covers the top 53 countries. The response of China’s trading structure toward events after the unexpected 2014 price drop is compared with other major traders. China, as the world’s largest importing country, lacks strong stability under global events and could be greatly affected by a supply shortage, especially in the gas market. The trend of multi-polarization on the market share gives a chance for China to construct closer relationships with more stable exporters and join in the trade loop of major countries to improve its position in the energy trading networks. The hidden features of trade correlation may provide a deeper understanding of the robustness of relationship and risk resistance.
1 Introduction
It has long been the interest of academy and industry to research on the world market of energy, especially the crude oil and natural gas. Literature has investigated the economic impact of oil price shocks, including the response of economic growth, inflation, and stock markets in oil-importing and -exporting countries (Zhao and Chen, 2014; An et al., 2018; Gong and Lin, 2018; Youssef and Mokni, 2019). Recent developments in the energy market have discussed the role of oil prices in determining trade balances, international risk sharing, and long-standing country policy (Filis and Chatziantoniou, 2013; Aydoğan et al., 2017; Youssef and Mokni, 2019). Many studies focus on analyzing how the rising and falling of international oil prices affect the relationship between supply and demand in the oil market (Axon and Darton, 2021; Esfahani et al., 2021). In the past decades, significant changes have occurred in the world market. The U.S. declines at a rate of 2.9% per year in terms of imports, while grows at a yearly rate of 15.1% in export. China’s oil consumption reached 13% of the world total volume in year 2017, more than 67% depending on import (BP, 2019). Consequently, literature investigating the dynamic interconnections among energy markets has emerged over the last two decades for the changing world energy market (Badel and McGillicuddy, 2015; Baumeister and Kilian, 2016a; Xue et al., 2019).
However, the energy price fluctuations affected by the global or regional events are very complex and have further motivated the evolution of the world energy trade network research by comparing and measuring the structural changes over time. For example, Hamilton (2010) reviews the connection between historical events and oil price shocks. He states that the crude oil price jump and drop in the 2008 global financial crisis present very high amplitudes in the absence of critical geopolitical events. Meanwhile, geopolitical events, such as the civil war in Syria and chronic crises in oil-producing countries have only a minor impact on oil prices. The dynamic effects of different shock types on the price of oil are partly solved by researchers (AlbertJeong and Barabási, 2000; Delvenne et al., 2015; An et al., 2018). Understanding the recent evolution of the price of oil is important in assessing the macroeconomic outlook (Baumeister and Kilian, 2016b). However, the response of energy-exporting and -importing countries to heterogeneous events varies a lot (Blanchard and Gali, 2007; Kilian et al., 2009; Inoue and Kilian, 2016; Gong and Lin, 2018). They find that the overall effect of oil demand and supply shocks on the trade balance of oil importers (and exporters) depends critically on the response of the non-oil trade balance (Kilian, 2009). Countries’ energy trade relationships are significant in analyzing trade network patterns (Zhao and Chen, 2014; Kremer et al., 2019; Mealy et al., 2019). A national energy trade network would affect a country’s GDP and its centrality on international trade significantly (Xi et al., 2019). The identification and assessment of energy security risks are also important for the behavior of exporters and importers that changed the energy industry. So the potential effect of shock estimation for a specific country and the new insights on dynamic trade relationship together remain open and need a deeper understanding.
Given this context, the energy trade relationships of big countries are of growing interest in analyzing trade network patterns. Trade dependency including trade concentration, import or export dependency, and trade volume is useful to analyze the relationship between nations. There are two different types of features, intrinsic and induced (Li et al., 2018; Comin et al., 2020). Induced features can be used to characterize the immediate neighborhood of a node and the scaled features (Frey et al., 2019; Fu et al., 2019). With the methodology development and data availability, hidden information on international trade has been deployed and sheds light on the opportunities and threats of trade dependencies (Stavroglou et al., 2019; Wang et al., 2019). However, it is hard to do a system-level analysis for its limitation in a comparison between different countries (Yuan et al., 2020; Ren et al., 2021). The intrinsic features of a node cannot be obtained from the connectivity of the network. One special feature of a node is the spacial position of a node, which is frequently represented as a vector. So we will explore the nodes in networks by distance in a feature space and try to discuss this topic both from the feature similarity of countries and structural properties of the world market over time.
To study complex systems composed of discrete elements with observed connections, complex network theory is an applicable framework (De Domenico et al., 2015; Dehmamy et al., 2018; Tushar et al., 2020; Tushar et al., 2021). The world energy market comprising a large number of interacting dynamical nodes display a rich repertoire of behaviors across different time and length scale (Hamilton, 2010; Aydoğan et al., 2017; Lang and Auer, 2019; Comin et al., 2020). However, it is unclear how such a detailed description of all elements could be interpreted (Newman, 2018; Tushar et al., 2018; Cui et al., 2019) or it is necessary to understand the phenomenon (Casadiego et al., 2017). Accordingly, many studies try to reduce the complexity of the system more only with fewer, aggregated variables to explain the behavior of interest (Pecora et al., 2014; Sorrentino et al., 2016). Davies (1989) proposed heat kernels and spectral theory to investigate spectral properties and obtain pointwise bounds on eigenfunctions by studying the heat kernel. Embedding techniques, which define the network and its nodes in a metric vector-space and allow us to use a plethora of computational techniques, have emerged in analyzing network data (Grover and Leskovec, 2016). However, it is not clear how to define an appropriate diffusion for the networks with more general dynamics than diffusion or sighed and directed edges (Newman and Clauset, 2016). Consequently, metric embedding involves finding an appropriate feature space in which the distance between objects provides a good description of the known dissimilarity between them (Abraham et al., 2006; Borg and Groenen, 2010). By extracting lower-dimensional or coarse-grained descriptions at the aggregated level of markets, an effective subspace may be sufficient for the dynamical process (Ravasz et al., 2002; Battiston et al., 2014). However, many economic characters, such as cycles and higher-order dynamical couplings cannot be captured (Banisch and Djurdjevac Conrad, 2015). A dimensionality reduction of the system in continuous space can be exploited to uncover dynamical modules in the system of the energy trade market (Lambiotte et al., 2014; Schaub, 2014; Rozemberczki et al., 2019). Recently, dynamic topology of complex networks and dimensionality reduction of multiscale systems are hot topics with the development of network theory and embedding techniques (Song et al., 2016; Schaub et al., 2019; Comin et al., 2020). It provides us with a dynamics-based and geometric representation of the system, associating similarity and distance measures. Given this context, to investigate the underlining information of the global energy market, different scales in a long time window should be considered. Here, we express the dynamical energy trading system as a function of spatial location, exploit this vector space representation, and analyze the associated similarity and dual distance measures.
The main contribution of our research reflects in the following dimensions. Different from a multivariate statistical analysis of trade volume, we focus on the structural changes and dynamic processes of the global crude oil and gas market from a macro-view over time by investigating the peak and tail areas. Not only considering the connectivity between countries, we also look into intrinsic and induced features of the individual countries in the world trade system. Firstly, to observe the evolution of the world trade network from a macro-level perspective, we construct a low-dimensional embedding of the system to provide a dimensionality reduction of the world energy trading system in continuous space. This enables us to ignore the differences in various aspects of countries and master the structural features and functions of the trade networks. Secondly, to uncover dynamical modules in the trading system, we exploit the dimensionality reduction ideas from a meso-level perspective. So importing or exporting countries that act approximately as a dynamical unit over a given time scale could be represented by groups of nodes. Thirdly, from a micro-lever view, we explore the important nodes in the network and quantify the feature of different countries, such as the United States, China, and Russia, to analyze energy security, including the changes in their energy trade structure over time, their stability under the events effect, and ability to resist risks. The dynamic structure analysis could track the movement of major traders and give insight into potential relationship development. Events’ effect on the network and nodes help in a deeper understanding of the robustness of relationship and risk resistance.
The remainder of the article is organized as follows. Section 2 describes the methodology used in this study. Section 3 introduces the data. Section 4 reports the results and discusses the balances of the energy market driven by events. Section 5 contains our conclusions.
2 Methodology
Our objective is to capture the dynamics (changes) in trading networks by examining the relationships after global or local events. When events occur, the impact will diffuse along the trading cross correlation networks. In terms of trading networks topology, this can be observed by changes in trade flow in respect of time.
We note that simple statistics on trade volume and node degree can reveal market characteristics, such as power-law (Gabaix, 2016). But it is not enough for a deeper insight for processes observation. Naturally, the world market has geographical relations between countries (Hadfield, 2008; Hu and Cheng, 2008). When geo-location is under consideration, the market becomes more complex. It is not purely economics, rather politics, security, and national relationships. So it is better to embed geographical relations into the model of the world market. It is reasonable to employ heat kernel embedding (Davies, 1989) as a fundamental framework.
The world energy trading market contains more features than node degree and adjacency relationships, more features could be added to the model to find more hidden information. Here, we consider trade volume as another dominant factor in the world energy trading market, where countries with major trading volumes have a dominant impact on energy economics. As for geographical factors, the Laplacian matrix can take geographical relations into consideration. The degree and adjacency could capture the pair-wise relation between countries. The common fact we are aware of is that the energy transportation cost is proportional to the distance (pipeline construction and freight shipping). It can be a hidden factor implied by world trading relations. Hence, it is reasonable to employ the Laplacian matrix in our network modeling.
Based on the above statement, we model and analyze the world energy trade network by an extended heat kernel embedding. The world energy trading network can be viewed as a directed graph G = ⟨V, L⟩, where the number of vertices |V| stands for the number of countries in the world, and the number of edges |L| represents the trade flow. If vertex u is an outgoing edge toward vertex v, then it represents an export from u or import by v. The degree of a vertex represents the numbers of countries which it trades with, and the vertex strength is the trade volume. The edge weight is the trade volume in a single relationship.
Hence, we construct a dynamical network modeling of the data according to Schaub et al. (2019), which is an extended model of Davies (1989).
where
The similarity between two nodes in a network can be regarded as a scalar value indicating how close the two nodes are according to some criterion. Here, we use node similarity to measure the level of dependence between variables associated to countries. This dependence can be across time, over the feature space, or both.
From Eq. 1 and Eq. 2, the dynamical network could be regard as a system where each node i has an impulse at time t = 0. We can have a mapping
where
We further employ a dynamical network modeling of the data from the general framework of multi-scale embedding (Schaub et al., 2019) to include trade volume as a factor. The resulting formula for modified heat kernel embedding is as follow:
Here, Ls is the normalized signed Laplacian matrix. S represents the strength of each node in the network, where we subtract the sum of exports by the sum of imports. The weighting matrix with form of
We aim to map the result of embedding to be more understandable. A two-dimensional Euclidean space is most commonly used to present the result of embedding. From the two-dimensional space, we can point out the correlation between the decomposition value and its meaning in trading network more easily. We consider the spectral decomposition of Ψ(t) into its eigenvectors v1(t), v2(t), …, vn(t) with associated eigenvalues μ1(t) ≥ μ2(t) ≥…≥ μn(t). Then we define the mapping i↦ϕi(t) as follows:
Particularly, we are mostly interested in the first two components of this decomposition, namely,
3 Data Description
In this study, we mainly focus on the import and export annual data of natural gas and crude oil from the year 2012 to 2017. We download detailed monthly data from the UN Comtrade database (UN, 2019) for this research. Particularly for the goods we investigate, the commodity numbers are 271111 (petroleum gases and other gaseous hydrocarbons; liquefied natural gas) and 271121 (petroleum gases and other gaseous hydrocarbons; in the gaseous state, natural gas) for natural gas and 2,709 (petroleum oils and oils obtained from bituminous minerals; crude) and 270900 (oils; petroleum oils and oils obtained from bituminous minerals, crude) for crude oil.
To be brief in the following discussion, we introduce the ISO 3166-1 alpha-3 abbreviation for country names (ISO, 2019). We are going to use the abbreviations in the following discussion and in labeling the figures. To focus on the subject of discussion, we select a major trader according to the sum of the trade value across all data. In Table 1, we list the resulting top importer and exporter of natural gas and crude oil in full names and abbreviations.
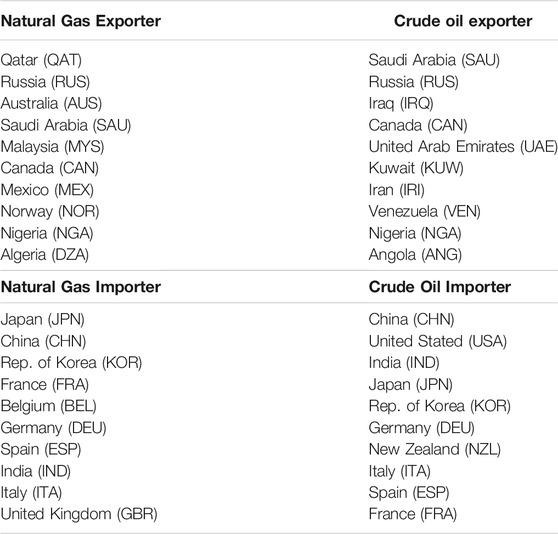
TABLE 1. Top 10 trade country by subject, for each category ranking, is presented in a descending order.
Due to the limited functionality of the UN database and its limitation in the download size, it is impossible to download full data for all countries with man power, where full data need 60 thousands times of downloads. We first use a Bash script to crawl data from the UN database with simple Linux command line tools. Since full data is split into 60 thousands files after crawl, we combine them into one dataset and aggregate data by each month, reporter, partner, and commodity number. To avoid numeric underflow or overflow in latter computation, we normalized the dataset so that its trade volume lies between 0 and 1. Since the trade volume is highly skewed among the world, we only take the top 53 countries with the largest overall trade volume, which produce around 800 edges and major hubs can be observed. As we plan to measure trade relation, we set weight of the graph to normalized trade volume.
Since the model evaluates the network impulse response after an initial input, the time unit of t must fit the time unit of the dataset. As we obtain monthly data from the database, the time unit in our modeling is month. During our analysis, we construct a trading network each year. So the impact of major events can be implied by the change of trading volume and network structures during the observed years. We analyze the impulse response after 8 months of that year since the impact of most recent large event—financial crisis has reached its peak after about 8 months. We may assume impact of events can be observed after 8 months after initial impulse.
4 Results and Discussion
In this section, we first explore the characteristics and statistics of the similarity matrix ψ, deriving from which we further investigate the networks embedding. We analyze the overall behavior of density and the dynamical structure of the market over the years by investigating the peak and tail area. The peak area refers to the area around zero, while the tail area is the small area on the right. To have a close look at the structure and behavior of major traders listed in Table 1, we visualize and analyze the two major components of network embedding.
4.1 Dynamical Structure of the Energy Market
Here, we investigate the similarity matrix derived from Eq. 6. In our setting, this similarity depends on number of countries to trade with and the import or export volume. Unlike the conventional similarity value, the similarity value after scaling exceeds the range of [0,1]. A node pair with either export or import dominant characteristics produces positive scaling, while a node pair with different characteristics produces negative scaling. The weighting matrix enhances the similarity where the hub node is involved and degrades the similarity when countries with small trading volume are involved. The density of these values can help us to uncover the pattern of trading pairs. There are three major categories we would like to examine, namely, pair among countries in Table 1 (MM-Pair), pair among countries not in Table 1 (mm-Pair), and pair among countries in Table 1 and not in that table (Mm-Pair). According to the methodology above, we expect that majority of the similarity of mm-Pair lies around zero while majority MM-Pair in the tail area.
A common pattern can be observed in the density plot from 2012 to 2017 in Figure 1 and Table 2. Each density plot has a high density around zero after the value is standardized, which means that the impulse response from the world around are quite different from each other. This phenomenon is expected since the major importers and exporters of energy are very concentrated in a few countries among approximately 200 countries. Rest countries, except for the major traders, have weaker trading relations with each other and can be more easily disturbed by an external impulse (major events). These countries are connected to major traders and regional exporters and importers. With the trading network, there surely exist some nodes with similar impulse response, such as smaller countries next to a major exporter or major traders share the same market. Our research results are in accordance with An et al. (2018), whose study show that countries such as the United States and the United Kingdom have higher ability to control the relationships among other nodes.
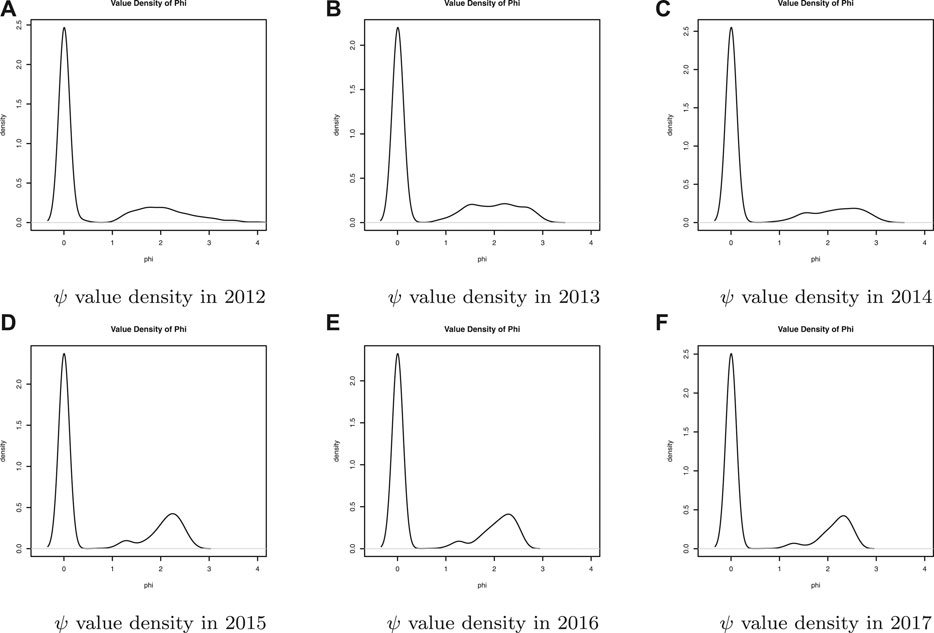
FIGURE 1. ψ value density from 2012 to 2017.
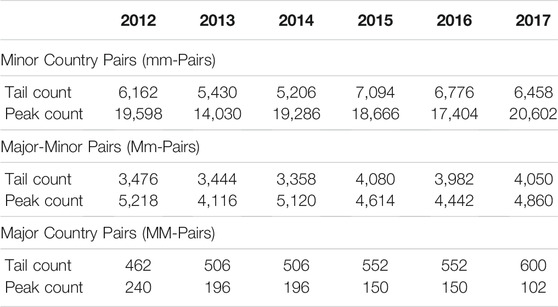
TABLE 2. Value distribution of different country type.
We can also observe a trend of concentration in the tail area of the density. The tail area is relatively flat around 2012 to 2014 (Figures 1A–C), while there are clear gathering peaks around 2015 to 2017 (Figures 1D–F). We examine three major categories of similarity during different years. The similarity of MM-Pairs is strengthened throughout the years, as more values lies in tail area. Meanwhile, mm-Pairs and Mm-pairs are rather unstable. The major proportion of mm-Pairs lie in the peak area and Mm-Pairs are roughly equal in the two areas. The major importers and exporters are acting more and more similar on both trade volume and the relationship with other minor countries, which is also stated in (Filis and Chatziantoniou, 2013; Baumeister and Kilian, 2016b). The Mm-pairs similarity has a little growth, which implies that there’s minor hub forming within countries of small trade volume. It could be the emerging of new energy exporters or the increasing energy consumption of developing countries.
4.2 Movement of Major Traders
By plotting the heat map of similarity among major traders in Figure 2, we can clearly observe a trend of concentration in the value. Here, we use accumulated data of the whole world as a reference point. So the world will always have the greatest similarity value to itself. If a country has a larger similarity value to the world, it is more likely to follow the global trend under events. We can see that these countries are either leader in great economic entities or countries geographically nearby. Notably in Figure 2, Canada and Mexico generally have a large similarity value with the world. These two countries both have simple energy trading relationships with several major traders, such as China and the United States. They also have stable trading relationships with each other, which strengthen their similarity.
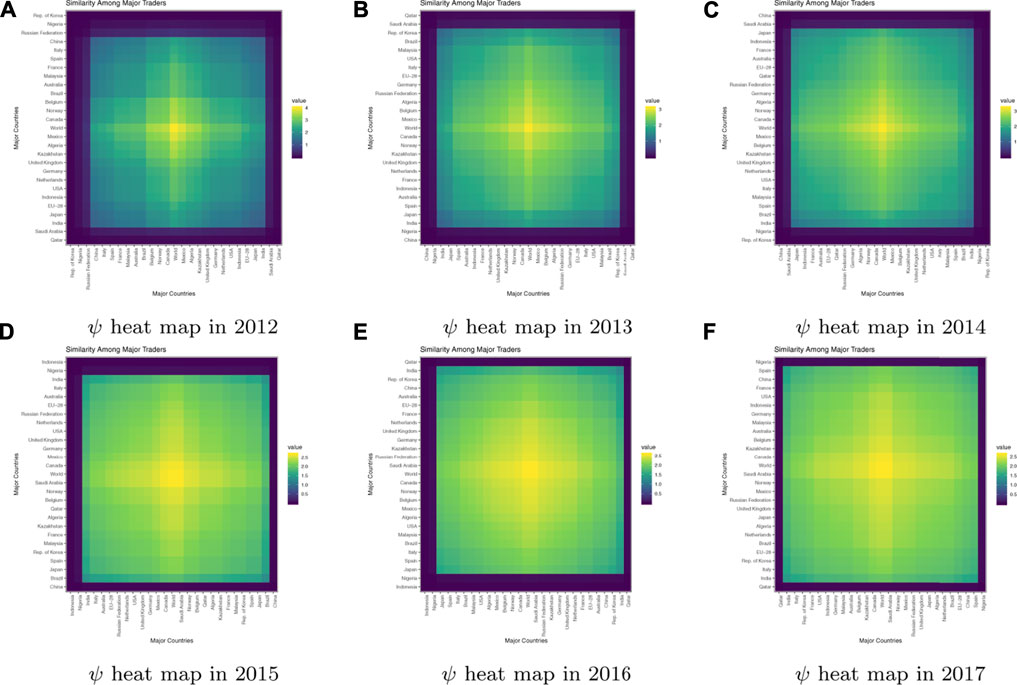
FIGURE 2. ψ heat map from year 2012 to 2017.
As major traders could be hubs in the world energy market, similarity could be brought to the neighborhood by the weight on the edge. These countries are generally unchanged in their topology position, which may indicate the stability in world energy trading relationships. The United States, Canada, Mexico, and the EU are all stable upon their relative similarity value. For huge economic entity like the EU, the similarity value is smaller due to its trade flow and risk sharing with countries which are net importers or exporters, such as Greece or Spain. This consequence is consistent with Youssef and Mokni (2019), whose research states that the response of market to oil price changes in oil-importing countries is more pronounced than that of oil-exporting countries during periods of turmoil.
The heat map becomes blurry after time to time when the region all expands. The major traders are becoming a more internally related entity. Changes in the market can also be enhanced by the increasing trade volume. When external events ever happen, those countries with large trade volume are likely to have similar responses. From the point of efficient market, any disturbance in a local region is more likely to propagate throughout the world regardless of geographical distance (Gabaix, 2016; Lang and Auer, 2019). So it always has the largest similarity with itself. We notice that most major traders have self similarity to some degree. Generally, self-similarity means a trading loop in the market as we scale self-weighting to zero for most cases. The loop means that the countries either reexport or reimport the energy, or a loop trading relation exists among countries. For instance, Canada, Spain, Mexico, and the United States can form a trade loop. Generally, these countries are major global or regional economic entities that establish both a significant import and export relationship with the entire world around. Mexico is a major energy provider for mid-south America, while it also has close import relationship with the United States and Canada.
A more clear view of this phenomenon could be observed by the density plot in Figure 3. A similar type of separation and aggregation can also be found when we zoom into the values only between the major traders. From Figure 3, we can clearly observe two peaks in each plot, while values are gathering towards the peak on the right side. Not only the global market has the enhancement of relation, this also appears among the major traders. This may suggest multi-polarization on market sharing. If the world market is emerging under single-polarization, Figure 3 would then go to unify as a whole, since the response from the market will all depend on a single entity. However, we could observe peak aggregation in the other direction. During the process of multi-polarization, system risk is also shared among all major traders. This can force them to cooperate and act in a same way after events happen. As a result, it is inevitable that the values will gather towards one peak since cooperation among large entities is the best way to make greater benefits.
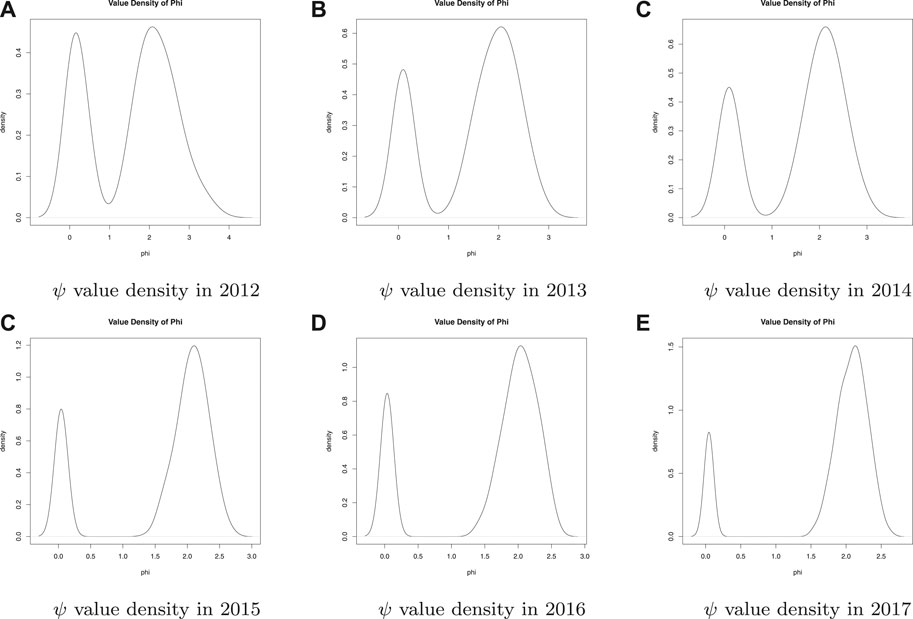
FIGURE 3. ψ value density within major traders.
4.3 Events Effects on the Network and Nodes
Besides the major traders, we consider below the events around the world that affects energy production, transportation, and consumption. Here, the events we consider are namely financial crisis, the development of shale gas, and oil technology.
4.3.1 Effects of Worldwide Events
There is a timely manner for the world to recover from the financial crisis. The time spends on recovery can be different for each country. A large economic entity can have the power and money to fill the gap and loss of the crisis in a short time. While those rather small economic entities might be more heavily damaged and wait for the proper regulation and relief to come back to the normal state (Aydoğan et al., 2017; An et al., 2018). This can be viewed as a process of flux from the most stable countries and organization to the others. This agrees with the phenomena in Figure 1 where the outliers are reduced over the years. Furthermore, the development of shale gas technology can help some developed or developing countries to find a supplement energy source, which can also help their recovery and further development.
4.3.2 Effects of the Shale Gas Technology
The change in impulse response could be observed by looking at the change in the point position. We can observe this on the plot of embedding result in Figure 4C, recalling that x-axis is proportional to the similarity value and y-axis is proportional to node strength. After the quick development of shale gas technology in year 2014, we find that RUS is brought into the picture (from eight months after 2013 in Figure 4B). This also helps the US to be an energy-independent country, and certainly changes the network structure, leading to a world-wide effecting of clustering. In Figure 4, points of countries are gathering towards the left side and stacking in the vertical direction.
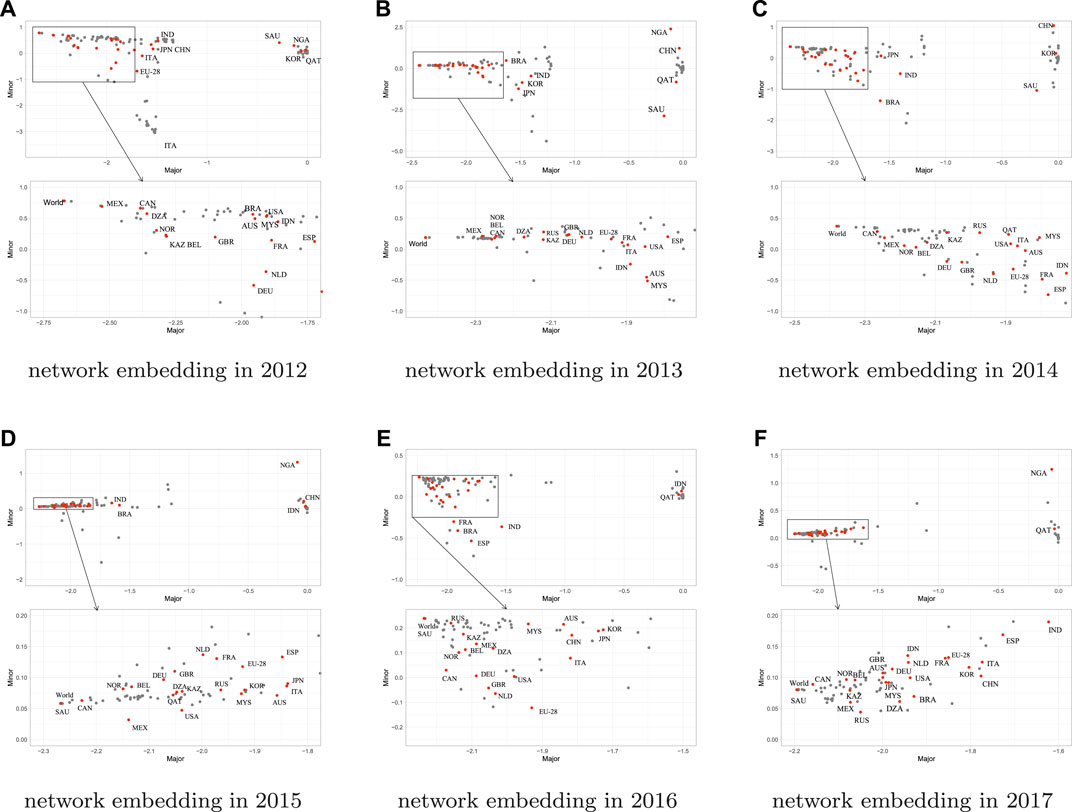
FIGURE 4. First two components of network embedding.
Meanwhile, Asian and European countries stay in the same scope in Figure 4, as Russia and Norway has long been major exporters of crude oil and natural gas. Malaysia and Indonesia are the major source area of shale gas in Asia. The energy market of these countries is as stable as those developed countries since natural gas is one of the major supplement energy other than crude oil. In recent decades, the world is not able to shift from fossil fuel to reproducible energy. As a result, one holding the major source of energy will be stable. For example, Norway is the top natural gas exporter, Germany is the second largest natural gas exporter, and Canada is the major oil exporter.
4.3.3 Effects on an Individual Country
If we look through Figure 4, we can observe that major traders (Japan and Russian) at the origin have the trend of moving towards the other end. Moreover, to examine the regional effect and overall behavior, we add two reference points to the plot, which are “world” and “EU-28.” Since the world overall could be regarded as a stable market, we suggest that the more a point deviates away from the origin on a major axis, the more stable it can be under major events. Each zoomed area of the plot largely consists of developed countries (European countries and North American countries) and major exporters of natural gas (Table 1). During all of the investigated years, no country moves out of the scope though their relative topology position may have changed. We notice that Mexico and Canada often take the leading position while the United States lags. Meanwhile, the United States, being the leading position of world economic entity, also has a lot of trades with other poles in the world. Also, the dependency on allies in all continents makes the United States to share and distribute the risk of the market. Mexico and Canada have rather simple energy trading relations and route with the United States. As a result, they gain more benefits of stability and less risk from trading relations.
From Figure 4, we can observe that position of China has constantly changed. In Figure 4C, it stays close to the developed country and outermost region in the plot. While in year 2015, China still stays away from the top and stable areas of countries. In the next following years (Figures 4E,F), it behaves even better than all previous years. The zigzag behavior of China indicates that it lacks strong stability for the increasing demand of gas. As a growing developing country that depends on energy heavily, China is greatly affected by the global market, especially for shortage of supply. The process that makes China a stable entity has both internal and external reasons. The internal reason might be the energy market opening strategy in 2015, introducing more freedom of trading and exporting to the market. This leads to a more open and efficient market, thus exposes China more close to the developed countries. Also, the natural gas pipeline between China and Russia begins construction in 2015. This gives a positive signal that China has even more demand for energy than before. The stimulation on the market related to China gives it more priority and interaction with the global market.
4.4 Discussion
The decrease of extreme outliers in Figure 2 may attribute to a more efficient energy market. Meanwhile, there might not exist simple reasoning behind this phenomenon (Badel and McGillicuddy, 2015; Baumeister and Kilian, 2016a). One possible explanation is the increment of trade volume in each year. As we analyze the network considering degree and edge weight, the increment in the trade value will certainly enhance the network structure in terms of the node to node dynamics. The more commodity trades between a pair of countries, the closer connection can exist (Ravasz et al., 2002; Comin et al., 2020). This also holds for the major traders. Countries with small capital and regional and political situations can override the power of trade volume (Filis and Chatziantoniou, 2013). On the other hand, a country can be more dependent on another on energy with the growth of trade volume. Then the national economy might be more correlated, which is also stated in (Hu and Cheng, 2008; Gabaix, 2016; Gong and Lin, 2018). Generally, the more population we have, the greater energy consumption will be. So developing countries may show a sharp increase in energy trade volume as energy consumption grows. A more efficient market can also increase the dynamics of the network. So the consequence of the event may be better revealed in the structure. Consequently, population growth, technology, and the development of a nation can set the ground for further analysis.
The changing topology position of China in Figure 4 from the year 2013 to 2017 indicates that the energy import system of China is not stable. The total demand for energy increases and leaves pressure on the energy import system. It could be affected by the unexpected demand increase and the effects last for years. For energy-importing countries, increasing reliance on imports exacerbates a country’s vulnerability under supply shocks. The development of unconventional resources and multi-import sources can be solutions to mitigate risks. For energy exporters, domestic economic development is highly reliant on international energy markets with the high volatility of energy prices. Energy trade correlation stability is important both for importers and exporters. A deeper investigation of energy consumption and energy trade networks of individual countries is worthy of further research and could shed light on diplomatic policies.
5 Conclusion
We presented a framework of the dynamic structure analysis over time by the dynamical embedding of complex networks, which is an extension of the heat kernel embedding. We focused on its applications to dimensional reduction and the detection of dynamical modules to highlight both intrinsic and induced features of world crude oil and gas trade networks. The similarity measure provides integrated description of networks and multi-scale statistics of dynamic blocks in terms of coarse-grained representations, which are different from the correlation analysis of time-series data. It suggests that the energy market system can be effectively described by a small set of major traders that govern the dynamics over some time scale. So the complexity of the dynamics could be reduced just keeping track of a few aggregated “meta-nodes”, whose state is governed by the major traders. By obtaining the dynamics characters of the world energy trade networks and localized features of the network structure, we assessed the effects of events on the trade correlation structure and importing or exporting countries. The visualized topological positions of the nodes could be understood as new features, which would give insights for long term decisions of countries’ stability under events. Multi-scale dynamical embedding of complex networks could be applied to deploy the resilience ability from shocks both for nodes and systems. The trends of multi-polarization on market sharing and stability of the trade loop among major traders is also helpful for developing countries, for example, China in making diplomatic decisions.
Because the industrial structure of the developed western economies reached maturity for decades, most of the econometric research on economic structural evolution is for developed states. Less-developed regions with their specific features have not been deeply studied. For instance, some external economy parameters, for example, GDP or economy growth of the countries of the year and the exchange rate in currency, play important roles in the results and should be considered. For further research, capturing information about a node, for example, for China, from the local distribution over node attributes around it is needed. The circumstance of population growth, technology, and economic development of the nation could be considered in a deeper investigation for China’s energy import security. Energy consumption and energy trade networks of individual countries are important factors affecting energy system stability. Both the macro and micro level research can open up new views for diplomatic policies.
Data Availability Statement
The original contributions presented in the study are included in the article/Supplementary Material; further inquiries can be directed to the corresponding author.
Author Contributions
FC is responsible for the whole manuscript and managed the research process. LX focuses on model construction and an analysis of the results. GF focuses on part of writing. QX focuses on part of writing. LD contributes on some of the results analysis.
Funding
This article is sponsored by the Natural Science Foundation of Shanghai (18ZR1420200), the National Natural Science Foundation of China (61603253), China Postdoctoral Science Foundation funded project (2016M601598), and the Fundamental Research Funds for the Central Universities.
Conflict of Interest
The authors declare that the research was conducted in the absence of any commercial or financial relationships that could be construed as a potential conflict of interest.
Publisher’s Note
All claims expressed in this article are solely those of the authors and do not necessarily represent those of their affiliated organizations, or those of the publisher, the editors, and the reviewers. Any product that may be evaluated in this article, or claim that may be made by its manufacturer, is not guaranteed or endorsed by the publisher.
Acknowledgments
We thank the support from the State Key Laboratory of Ocean Engineering and the Key Laboratory of Marine Intelligent Equipment and System, Ministry of Education.
Supplementary Material
The Supplementary Material for this article can be found online at: https://www.frontiersin.org/articles/10.3389/fenrg.2021.729690/full#supplementary-material
References
Abraham, I., Bartal, Y., and Neiman, O. (2006). Advances in Metric Embedding Theory. Adv. Maths. 228 (6), 3026–3126. doi:10.1145/1132516.1132557
An, Q., Wang, L., Qu, D., and Zhang, H. (2018). Dependency Network of International Oil Trade before and after Oil price Drop. Energy 165, 1021–1033. doi:10.1016/j.energy.2018.09.098
Axon, C. J., and Darton, R. C. (2021). Sustainability and Risk - a Review of Energy Security. Sustainable Prod. Consumption 27, 1195–1204. doi:10.1016/j.spc.2021.01.018
Aydoğan, B., Tunç, G., and Yelkenci, T. (2017). The Impact of Oil price Volatility on Net-Oil Exporter and Importer Countries’ Stock Markets. Eurasian Econ. Rev. 7, 231–253. doi:10.1007/s40822-017-0065-1
Badel, A., and McGillicuddy, J. (2015). Oil Prices: Is Supply or Demand behind the Slump?. Econ. Synopses. doi:10.20955/es.2015.8
Banisch, R., and Djurdjevac Conrad, N. (2015). Cycle-flow-based Module Detection in Directed Recurrence Networks. Epl 108, 68008. doi:10.1209/0295-5075/108/68008
Battiston, F., Nicosia, V., and Latora, V. (2014). Structural Measures for Multiplex Networks. Phys. Rev. E Stat. Nonlin Soft Matter Phys. 89, 032804. doi:10.1103/PhysRevE.89.032804
Baumeister, C., and Kilian, L. (2016a). Forty Years of Oil price Fluctuations: Why the price of Oil May Still surprise Us. J. Econ. Perspect. 30, 139–160. doi:10.1257/jep.30.1.139
Baumeister, C., and Kilian, L. (2016b). Understanding the Decline in the price of Oil since June 2014. J. Assoc. Environ. resource economists 3, 131–158. doi:10.1086/684160
Blanchard, O. J., and Gali, J. (2007). The Macroeconomic Effects of Oil Shocks: Why Are the 2000s So Different from the 1970s? Technical Report. Natl. Bur. Econ. Res.. doi:10.3386/w13368
Borg, I., and Groenen, P. J. F. (2010). Modern Multidimensional Scaling: Theory and Applications. J. Educ. Meas. 40, 277–280. doi:10.1111/j.1745-3984.2003.tb01108.x
BP (2019). Statistical Review of World Energy. Available at: https://www.bp.com/.
Casadiego, J., Nitzan, M., Hallerberg, S., and Timme, M. (2017). Model-free Inference of Direct Network Interactions from Nonlinear Collective Dynamics. Nat. Commun. 8, 2192–2210. doi:10.1038/s41467-017-02288-4
Comin, C. H., Peron, T., Silva, F. N., Amancio, D. R., Rodrigues, F. A., and Costa, L. d. F. (2020). Complex Systems: Features, Similarity and Connectivity. Phys. Rep. 861, 1–41. doi:10.1016/j.physrep.2020.03.002
Cui, P., Wang, X., Pei, J., and Zhu, W. (2019). A Survey on Network Embedding. IEEE Trans. Knowl. Data Eng. 31, 833–852. doi:10.1109/tkde.2018.2849727
De Domenico, M., Nicosia, V., Arenas, A., and Latora, V. (2015). Structural Reducibility of Multilayer Networks. Nat. Commun. 6, 6864. doi:10.1038/ncomms7864
Dehmamy, N., Milanlouei, S., and Barabási, A. L. (2018). A Structural Transition in Physical Networks. Nature 563, 676–680. doi:10.1038/s41586-018-0726-6
Delvenne, J. C., Lambiotte, R., and Rocha, L. E. (2015). Diffusion on Networked Systems Is a Question of Time or Structure. Nat. Commun. 6, 7366. doi:10.1038/ncomms8366
Esfahani, A. N., Moghaddam, N. B., Maleki, A., and Nazemi, A. (2021). The Knowledge Map of Energy Security. Energ. Rep. 7, 3570–3589. doi:10.1016/j.egyr.2021.06.001
Filis, G., and Chatziantoniou, I. (2013). Financial and Monetary Policy Responses to Oil price Shocks: Evidence from Oil-Importing and Oil-Exporting Countries. Rev. Quantitative Finance Account. 42 (4), 709–729. doi:10.1007/s11156-013-0359-7
Frey, N. C., Matin, S., Stanley, H. E., and Salinger, M. A. (2019). Universal Fluctuations in Growth Dynamics of Economic Systems. Sci. Rep. 9, 713–715. doi:10.1038/s41598-018-38088-z
Fu, G., Chen, F., Liu, J., and Han, J. (2019). Analysis of Competitive Information Diffusion in a Group-Based Population over Social Networks. Physica A: Stat. Mech. its Appl. 525, 409–419. doi:10.1016/j.physa.2019.03.035
Gabaix, X. (2016). Power Laws in Economics: An Introduction. J. Econ. Perspect. 30, 185–206. doi:10.1257/jep.30.1.185
Gong, X., and Lin, B. (2018). Time-varying Effects of Oil Supply and Demand Shocks on China's Macro-Economy. Energy 149, 424–437. doi:10.1016/j.energy.2018.02.035
Grover, A., and Leskovec, J. (2016). “node2vec: Scalable Feature Learning for Networks,” in Proceedings of the 22nd ACM SIGKDD international conference on Knowledge discovery and data mining, New York, NY, August 24–27, 2016, 855–864.
Hadfield, A. (2008). EU-Russia Energy Relations: Aggregation and Aggravation1. J. Contemp. Eur. Stud. 16, 231–248. doi:10.1080/14782800802309953
Hamilton, J. D., (2010). Historical Oil Shocks. In Handbook of Major Events in Economic History (New York, NY: Routledge Taylor and Francis Group). doi:10.4324/9780203067871.ch21
Hu, L., and Cheng, T. S. (2008). China’s Energy Security and Geo-Economic Interests in central Asia. Cent. Eur. J. Int. Security Stud. 2, 52. Available at: webmail2.cejiss.org%2Farticles%2Fvol2-2%2Fhu-cheng/
Inoue, A., and Kilian, L. (2016). Joint Confidence Sets for Structural Impulse Responses. J. Econom. 192, 421–432. doi:10.1016/j.jeconom.2016.02.008
ISO (2019). Country Codes. Available at: https://www.iso.org/obp/ui/#search/code/.
Kilian, L. (2009). Not all Oil price Shocks Are Alike: Disentangling Demand and Supply Shocks in the Crude Oil Market. Am. Econ. Rev. 99, 1053–1069. doi:10.1257/aer.99.3.1053
Kilian, L., Rebucci, A., and Spatafora, N. (2009). Oil Shocks and External Balances. J. Int. Econ. 77, 181–194. doi:10.1016/j.jinteco.2009.01.001
Kremer, M., Becker, A. P., Vodenska, I., Stanley, H. E., and Schäfer, R. (2019). Economic and Political Effects on Currency Clustering Dynamics. Quantitative Finance 19, 705–716. doi:10.1080/14697688.2018.1532101
Lambiotte, R., Delvenne, J. C., and Barahona, M. (2014). Random Walks, Markov Processes and the Multiscale Modular Organization of Complex Networks. IEEE Trans. Netw. Sci. Eng. 1, 76–90. doi:10.1109/tnse.2015.2391998
Lang, K., and Auer, B. R. (2019). The Economic and Financial Properties of Crude Oil: A Review. North Am. J. Econ. Finance 52, 100914. doi:10.1016/j.najef.2019.01.011
Li, T., Xue, L., Chen, Y., Chen, F., Miao, Y., Shao, X., et al. (2018). Insights from Multifractality Analysis of Tanker Freight Market Volatility with Common External Factor of Crude Oil price. Physica A: Stat. Mech. its Appl. 505, 374–384. doi:10.1016/j.physa.2018.02.107
Mealy, P., Farmer, J. D., and Teytelboym, A. (2019). Interpreting Economic Complexity. Int. J. Agric. Stat. Sci. 14, 1–9. doi:10.1126/sciadv.aau1705
Newman, M. E., and Clauset, A. (2016). Structure and Inference in Annotated Networks. Nat. Commun. 7, 1–11. doi:10.1038/ncomms11863
Newman, M. E. (2018). Network Structure from Rich but Noisy Data. Nat. Phys. 14 (6), 542–545. doi:10.1038/s41567-018-0076-1
Pecora, L. M., Sorrentino, F., Hagerstrom, A. M., Murphy, T. E., and Roy, R. (2014). Cluster Synchronization and Isolated Desynchronization in Complex Networks with Symmetries. Nat. Commun. 5, 1–8. doi:10.1038/ncomms5079
Albert, R., Jeong, H., and Barabási, A. L., (2000). Error and Attack Tolerance of Complex Networks. Nature 406, 378 – 382. doi:10.1038/35019019
Ravasz, E., Somera, A. L., Mongru, D. A., and Oltvai, Z. N. (2002). Hierarchical Organization of Modularity in Metabolic Networks. Science 297, 1551–1555. doi:10.1126/science.1073374
Ren, S., Li, H., Wang, Y., Guo, C., Feng, S., and Wang, X. (2021). Comparative Study of the china and u.S. Import Trade Structure Based on the Global Chromium Ore Trade Network. Resour. Pol. 73, 102198. doi:10.1016/j.resourpol.2021.102198
Rozemberczki, B., Allen, C., and Sarkar, R., 2019. Multi-scale Attributed Node Embedding. arXiv preprint arXiv:1909.13021.
Schaub, M. T., Delvenne, J. C., Lambiotte, R., and Barahona, M. (2019). Multiscale Dynamical Embeddings of Complex Networks. Phys. Rev. E 99, 062308. doi:10.1103/PhysRevE.99.062308
Schaub, M. T. (2014). “Unraveling Complex Networks under the Prism of Dynamical Processes: Relations between Structure and Dynamics,”. Ph.D. thesis.
Song, X., Niu, D., and Zhang, Y. (2016). The Chaotic Attractor Analysis of Djia Based on Manifold Embedding and Laplacian Eigenmaps. Math. Probl. Eng. 2016, 1–10. doi:10.1155/2016/8087178
Sorrentino, F., Pecora, L. M., Hagerstrom, A. M., Murphy, T. E., and Roy, R. (2016). Complete Characterization of the Stability of Cluster Synchronization in Complex Dynamical Networks. Sci. Adv. 2, e1501737. doi:10.1126/sciadv.1501737
Stavroglou, S. K., Pantelous, A. A., Stanley, H. E., and Zuev, K. M. (2019). Hidden Interactions in Financial Markets. Proc. Natl. Acad. Sci. U S A. 166, 10646–10651. doi:10.1073/pnas.1819449116
Tushar, W., Saha, T. K., Yuen, C., Smith, D., and Poor, H. V. (2020). Peer-to-peer Trading in Electricity Networks: An Overview. IEEE Trans. Smart Grid 11, 3185–3200. doi:10.1109/tsg.2020.2969657
Tushar, W., Yuen, C., Mohsenian-Rad, H., Saha, T., Poor, H. V., and Wood, K. L. (2018). Transforming Energy Networks via Peer-To-Peer Energy Trading: The Potential of Game-Theoretic Approaches. IEEE Signal. Process. Mag. 35, 90–111. doi:10.1109/msp.2018.2818327
Tushar, W., Yuen, C., Saha, T. K., Morstyn, T., Chapman, A. C., Alam, M. J. E., et al. (2021). Peer-to-peer Energy Systems for Connected Communities: A Review of Recent Advances and Emerging Challenges. Appl. Energ. 282, 116131. doi:10.1016/j.apenergy.2020.116131
UN (2019). Un Comtrade Database. Available at: https://comtrade.un.org/.
Wang, C., Zhang, X., Vilela, A. L., Liu, C., and Stanley, H. E. (2019). Industrial Structure Upgrading and the Impact of the Capital Market from 1998 to 2015: A Spatial Econometric Analysis in Chinese Regions. Physica A: Stat. Mech. its Appl. 513, 189–201. doi:10.1016/j.physa.2018.08.168
Xi, X., Zhou, J., Gao, X., Liu, D., Zheng, H., and Sun, Q. (2019). Impact of Changes in Crude Oil Trade Network Patterns on National Economy. Energ. Econ. 84, 104490. doi:10.1016/j.eneco.2019.104490
Xue, L., Chen, F., Guo, S., Fu, G., Li, T., and Yang, Y. (2019). Time Varying Correlation Structure of Chinese Stock Market of Crude Oil Related Companies Greatly Influenced by External Factors. Physica A: Stat. Mech. its Appl. 530, 121086. doi:10.1016/j.physa.2019.121086
Youssef, M., and Mokni, K. (2019). Do crude Oil Prices Drive the Relationship between Stock Markets of Oil-Importing and Oil-Exporting Countries? Economies 7, 70. doi:10.3390/economies7030070
Yuan, M., Zhang, H., Wang, B., Huang, L., Fang, K., and Liang, Y. (2020). Downstream Oil Supply Security in china: Policy Implications from Quantifying the Impact of Oil Import Disruption. Energy Policy 136, 111077. doi:10.1016/j.enpol.2019.111077
Keywords: dynamical network, complex networks, energy market, heat kernel embedding, multiscale embedding
Citation: Xue L, Chen F, Fu G, Xia Q and Du L (2021) Stability Analysis of the World Energy Trade Structure by Multiscale Embedding. Front. Energy Res. 9:729690. doi: 10.3389/fenrg.2021.729690
Received: 23 June 2021; Accepted: 09 August 2021;
Published: 29 September 2021.
Edited by:
Yanfei Li, Hunan University of Technology and Business, ChinaReviewed by:
Chau Yuen, Singapore University of Technology and Design, SingaporeVidya C. T, Centre for Economic and Social Studies (CESS), India
Copyright © 2021 Xue, Chen, Fu, Xia and Du. This is an open-access article distributed under the terms of the Creative Commons Attribution License (CC BY). The use, distribution or reproduction in other forums is permitted, provided the original author(s) and the copyright owner(s) are credited and that the original publication in this journal is cited, in accordance with accepted academic practice. No use, distribution or reproduction is permitted which does not comply with these terms.
*Correspondence: Feier Chen, Y2hlbmZlaWVyQHNqdHUuZWR1LmNu