- State Key Laboratory of Chemical Engineering, Tsinghua University, Beijing, China
Amine scrubbing is the most important technique for capturing CO2. The cyclic diamine N-(2-Hydroxyethyl)-piperazine (HEPZ), a derivative of piperazine, with good mutual solubility in aqueous solution, a low melting point, and a high boiling point, has the potential to replace PZ as an activator added in the mixed amine system to capture CO2. In this study, the solubility of CO2 in aqueous HEPZ solutions was determined for three HEPZ concentrations and four temperatures. The VLE data for HEPZ-H2O were obtained using a gas–liquid double circulation kettle at pressure 30–100 kPa, and the thermodynamic model for the HEPZ-H2O-CO2 system was built in Aspen Plus based on the electrolytic non-random two-liquid (ENRTL) activity model. The physical parameters for HEPZ and the interaction parameters for ENRTL, along with reaction constants of carbamate reactions, were regressed. Using the thermodynamic model, the CO2 cyclic capacity, speciation with loading, and heat of reaction for the CO2 capture system by the aqueous HEPZ solution are predicted and analyzed.
Introduction
Power generation by burning fossil fuels is the most important source of greenhouse gas emissions that cause global climate change (Anderson, 2016). Carbon capture and storage (CCS), as the process of capturing CO2 from flue gas from conventional coal-fired power plants, is the direct method to curb global warming (Plasynski et al., 2009). Amine scrubbing has been successfully and widely used in ammonia production as well as natural gas processing and is considered to be the most promising technology for industrialization of capture and separation of CO2 from flue gas generated by coal-fired power plants (Rochelle, 2009). The industrial applications’ challenges for amine scrubbing are the high energy consumption and huge size of separation equipment and heat exchange equipment as well as cost, which attributes to the flue gas’ large flow rate as well as its low CO2 partial pressure. Therefore, the development of new solvents and high-efficiency separation equipment and the enhancement of technological processes have been extensively studied to reduce the cost of capture. Developing new amines with outstanding properties is the most important method to reduce renewable energy and cost (Feron and Hendriks, 2005).
Good-performance absorbents can greatly reduce the operating cost of the capture process and generally need to have the following properties (Liang et al., 2015): the cyclic capacity is high, the reaction kinetics is fast, the heat of absorption is relatively low, the resistance to oxidative and thermal degradation is high, and the corrosivity, volatility, viscosity, and cost are low. The high CO2 cyclic capacity can reduce the solution’s circulation flow rate, thereby reducing the power of the pump and the energy consumption of the reboiler. The fast absorption kinetics reduces the size of the absorbers and strippers and also the maximal achievable rich loading, thereby reducing operating costs. The relatively low heat of absorption can help reduce the regeneration duty. The resistance to oxidative as well as thermal degradation is correlated with the quantity of solvent make-up as well as byproduct emissions to environment and volatility to the quantity of amine loss as well as emission. The low-viscosity solvents enhance mass and heat transfer, thus reducing the amount of packing and the size of the heat exchanger. Different amines have different molecular structures and absorption mechanisms, resulting in different absorption characteristics. There is a fast reaction rate, a low CO2 cyclic capacity, and a high absorption heat for the primary and secondary amines (Rinker et al., 2000). On the contrary, tertiary amines and steric-hindered amines have a high CO2 cyclic capacity, a slow absorption rate, and a low absorption heat (Dubois and Thomas, 2012). A mixed-amine system—mixed solvent of amines with different reaction mechanisms—combines the advantages of two alcohol amine solutions: a high CO2 cyclic capacity, a low heat of absorption, and a fast absorption rate. Activators are usually added to steric-hindered amines or tertiary amines to increase the absorption rate. Monoethanolamine (MEA) and piperazine (PZ) are the most commonly used activators, and related mixed amine systems have been extensively studied (Aronu et al., 2011; Choi et al., 2009; Dash et al., 2011; Mandal et al., 2001; Puxty and Rowland, 2011; Sakwattanapong et al., 2009).
The disadvantage of PZ as an activator is its low boiling point and high melting point. It is easy to crystallize at low temperatures and cannot be configured with higher-concentration solutions, which reduces the absorption. Its boiling point of 146°C is within the range of 120–160°C, the maximum working temperature of the device, so it is easy to volatilize at high temperatures, increasing the amount of amine loss and emission in large-scale carbon capture deployment. PZ derivatives have a similar molecular structure with PZ and in recent years have also been used to study their activation properties in mixed-amine solvents (Choi et al., 2016; Li et al., 2014a; Li et al., 2014b; Li et al., 2013; Yuan et al., 2017). Rochelle’s group from the University of Texas had studied about the absorption kinetics of PZ derivatives for CO2 capture (Chen and Rochelle, 2011). Our group’s previous study (Li et al., 2014b) measured the cyclic capacity of these PZ derivatives and calculated the heat of CO2 absorption by using the simplified Gibbs–Helmholtz equation. According to Chen and Rochelle’s research, the screening results indicate that there is a lower heat-of-CO2 absorption and an equal absorption rate as well as a higher cyclic capacity in 1-methylpiperazine (1MPZ) than in PZ. However, 1MPZ has greater volatility than MEA and PZ (Mandal et al., 2001). The high volatility is usually a problem for commercial use. Among all derivatives of PZ, N-(2-Hydroxyethyl) piperazine (HEPZ) has the highest boiling point of 246°C, a melting point of −38.5°C, and better water solubility and thermal stability than PZ. The chemical structure of HEPZ is shown in Figure 1. HEPZ can withstand higher temperatures and configure higher-concentration solutions in industrial applications, which show the potential of HEPZ to replace PZ as an activator. Since no literature studied the absorption performance of the HEPZ aqueous solution and mixed-amine system with HEPZ, there is a need to measure the relevant experimental data.
This study studied the HEPZ aqueous solution for CO2 capture, aiming to develop a rigorous thermodynamic model of HEPZ/CO2/H2O to accurately calculate the energy consumption during the capturing and then represent all relevant thermodynamic properties, such as vapor–liquid equilibrium (VLE), chemical reaction equilibrium, and heat capacity, which are important elements for the process simulation as well as optimization of CO2 capture. First, the gas–liquid double-circulation kettle was used to measure the VLE data for HEPZ/H2O at negative pressure and normal pressure, and the CO2 solubility data of HEPZ aqueous solutions with three concentrations (5 wt%, 15 wt%, and 30 wt%) as well as four temperatures (313.15, 343.15, 373.15, and 393.15 K) were measured using a stainless-steel reactor, which are necessary data for an accurate thermodynamic model. Data from the literature, such as heat capacity, saturated vapor pressure, etc., and the experimental data of this study were regressed to obtain the missing physical property parameters as well as interaction parameters of the model. Therefore, in this study, the activity coefficient model of electrolyte non-random double liquid (ENRTL) is adopted, which has been successfully used in the
Experiment
Materials
In this study, the chemicals and their information are shown in the Supplementary Material. All chemicals were used without further purification. MEA was used for validation of experimental methods. Deionized water was used to prepare the aqueous solutions, and the amine solutions in this study are all liquid at room temperature.
Vapor–Liquid Equilibrium
In this study, a customized gas–liquid double-circulation device made of glass was adopted to determine the VLE data of the HEPZ aqueous solution. The working principle is gas–liquid dual circulation. The two circulating pumps are used to forcefully circulate the gas and liquid parts at the same time so that the gas and liquid phases are fully contacted and the time to balance is shortened. The equilibrium temperature can be accurately measured, and partial condensation is very small. The construction of the gas–liquid double-circulation device is shown in Figure 2.
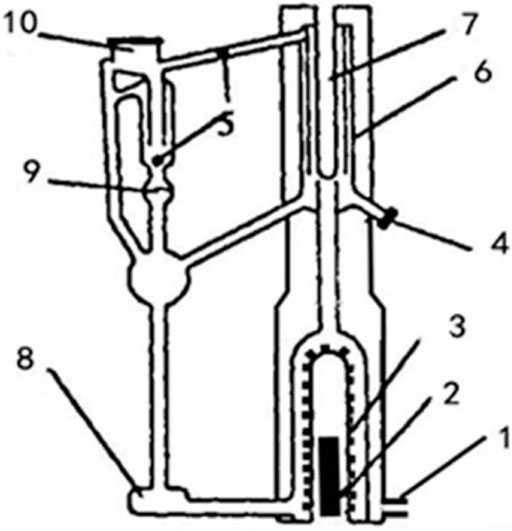
FIGURE 2. Gas–liquid double-circulation device: 1. vacuum pump, 2. heating rods, 3. boiling chamber, 4. liquid-phase sampling port, 5. vapor-phase sampling port, 6. balance cell, 7. temperature measuring cell, 8. magneton, 9. cock, 10. condensation pipe and pressure control system.
The device is made of glass. The solution is pumped into the boiling chamber from the reagent inlet at the bottom of the equipment and heated to boiling using the heating rod. The outer-side air of the boiling chamber is evacuated using a vacuum pump to vacuum for heat preservation. The boiling solution is flushed to the liquid sampling port by bubbles, and the thermometer put in the temperature-measuring cell candetermine the temperature of the boiling liquid phase in order to obtain the boiling point, which is stable after reaching boiling. The vapor enters the condensing tube and flows back to the gas sampling port after condensing; we closed the cock to hold the condensate, which is a sample of the gas phase. After opening the cock, the condensate and reagent are stirred using a magnet and continued to be heated to boil. The entire equipment is connected to an external pressure control device, which is brought to a certain negative pressure using a vacuum pump, achieving the control of the equipment pressure. Therefore, the equipment can obtain VLE data at different pressures. After the solution is boiled, the liquid and vapor phase samples are collected, and the concentration of each phase solution is measured using an Abbe refractometer. This equipment used in this study can measure the boiling point of a certain concentration of the solution and the vapor–liquid composition after boiling at a certain negative pressure or atmospheric pressure. The construction and the operation principle of the Abbe refractometer are provided in the Supplementary Material.
The main sources of error of the device are as follows: the sampling time after boiling is difficult to determine, and the accuracy of the pressure control device is limited; the fluctuation is about
CO2 Solubility
According to Dong et al. (2010), CO2 solubility has been measured in the stainless-steel reactor. The apparatus contains four 400 cm3 stainless-steel equilibrium cells (they have an identical structure with the one shown in Dong’s research) that were designed to operate at a temperature as high as 130°C and a pressure as high as 1 MPa, a 500 cm3 stainless-steel gas container with a temperature transducer and a pressure transducer on the top, and CO2 and
The key part of the device is the gas–liquid balance reactor, and the temperature in the gas and liquid phases was controlled using a heating jacket and then determined by two temperature transducers, whose accuracy was 0.1 K. A stirring paddle equipped in the kettle is driven by the external motor to generate magnetic force and drive the solution inside of the sealed kettle. The overall pressure was determined by a pressure transducer (JYB-KO-HAA, Kunlunhaian Co.), whose accuracy was about 0.5%. Meanwhile, the same temperature and pressure transducers were adopted by the CO2 gas container, which is used to obtain the total amount of CO2 that was introduced into the reactor by recording the pressure difference before and after each injection. Due to the simple structure of the gas chamber, the actual volume can be directly calibrated by the drainage method. However, the internal structure of the reactor is complicated and cannot be directly measured by the drainage method. Its actual volume is calibrated by the gas pressure difference method after measuring the volume of the CO2 gas chamber. At the beginning of each experiment, the reactor cell is washed by the remaining air through N2, and then, the aqueous amine solution with a volume of 100 cm3 is injected into the cell. Meanwhile, the temperature of the reactor was set at the experiment temperature. Later, CO2 was injected to the cell, and 10 h was provided for the absorption equilibrium after every injection.
The partial pressure of CO2 was obtained by determining the increase in the total pressure compared to the initial value after an injection of CO2, and it was assumed that the partial pressure of N2 and H2O was constant in each experiment. Using the Peng–Robinson (PR) cubic equation, the exact quantity at the gas phase was judged by three factors, including volume, pressure, and temperature (Peng and Robinson, 1976). Then, the dissolved CO2 concentration was expressed by CO2 loading with mole CO2/mole amine. The loading uncertainty was 8%, which was determined by the uncertainty of pressure, temperature, and volume, which were 0.5%, 0.1, and 0.5%, respectively. The uncertainty of CO2 partial pressure was estimated as 2%, and the details are shown in the study by Dong et al. (2010).
Validation of Experimental Methods
MEA/H2O/CO2, a well-known and widely studied system, was selected to verify the experimental methods. The CO2 solubility for the MEA solution has been measured in a vapor–liquid equalizer, as described in the study by Dong et al. (2010). In Dong et al.’s study, only the data at 313 K were verified. In order to verify the accuracy of experimental equipment in a wider temperature range, the same equipment was used to measure the CO2 solubility for 30 wt% MEA at 313.15 and 393.15 K. The experimental results are highly correlated with Lee et al. (1976)’s data and shown in Supplementary Material, but the CO2 pressure at a temperature of 313.15 K is slightly higher than the data from the literature, which is in line with the results of Dong et al. (2010).
To validate the gas–liquid double-circulation device for measurements, vapor–liquid equilibrium data for ethanol were measured at 293.15 K and 101.3 kPa. Then, these data were compared to those obtained from the literature. Data from this study agreed with the data from the study by Kurihara et al. (1993), as shown in Supplementary Material, validating the experimental method. The measurement accuracy of the Abbe refractometer is
Thermodynamic Systems
Physical dissolution and chemical absorption happen in the process of CO2 captured by amine solution, so physical equilibrium and chemical equilibrium need to be considered. There are a variety of intermolecular interactions in the loaded solution, including the interactions between molecules, between molecules and ions, and between ions, making the solution deviate from the ideal state. It is necessary to introduce an activity coefficient model for correction. The relative theories of physical equilibrium, chemical equilibrium, and activity coefficient that need to be considered in establishing a thermodynamic model are introduced in this section.
Physical Equilibrium
In a vapor–liquid equilibrium system, the activity of the components during the liquid phase is the same as the fugacity during the gas phase. For the components of amines and water, which use pure substances as the reference state, the formula of equilibrium can be expressed as
For the component CO2 using the infinite dilution state as the reference state, which is amine and CO2, the equilibrium formula is as follows:
where
The dependence of the Henry constant on temperature can be expressed as
The Redlich–Kwong (RK) equation of the state model was used to describe the gas phase. The Henry constant of CO2 in water was taken from the study by Chen et al. (1979).
Chemical Absorption
Chemical absorption reaction equations in the loaded HEPZ solution are as follows:
All the reaction equilibrium constants of the reactions mentioned above can be obtained from the standard-state Gibbs free energies of the equations’ chemicals. The calculation equation is as follows:
where
Protonation reactions 7 and 8 produced new ions
Activity Coefficient
Referring to 3.2, a series of reactions will take place in the loaded HEPZ solution, and multiple ions were produced in the process. The interaction between ions causes the liquid system to gradually deviate from the ideal state. It needs to introduce a coefficient model with accurate activity for calculations and simulation. In this study, the activity coefficients for binary interactions in the unloaded amine solution were calculated by the NRTL model, but those for the molecule–molecule binary, molecule–ion pair binary, and ion pair–ion pair binary in the loaded amine solution were calculated by the ENRTL model. The dependence of binary parameters on the temperature can be expressed as
where
Results of Modeling
All data and their range and resource used for regression are listed in Table 1.
N-(2-Hydroxyethyl) Piperazine
The heat capacity data of HEPZ obtained from the study by Poozesh et al. (2013), Tagiuri (2019) were regressed to acquire the ideal gas heat capacity constants (
The dependence of Antoine’s constants on the temperature is expressed as
N-(2-Hydroxyethyl) Piperazine + H2O
The data from experiments and the literature were regressed in this model, including excess enthalpy, the VLE data acquired in this study, and heat capacity (Poozesh et al., 2013; Tagiuri, 2019) for the mixed solution of HEPZ/H2O. The
In this study, VLE data at 30 kPa, 40 kPa, 55 kPa, 70 kPa, and 85 kPa and the atmosphere pressure of 101 kPa were measured. Because the viscosity of the high-concentration solution of HEPZ is too large, it is not convenient for experimental measurements. The mass fraction range of HEPZ in this experiment is 0.1–0.75. Figure 3 shows the data obtained by the experimental measurement and the data calculated by the model. The upper line and points represent for the mole fraction of HEPZ at the gas phase (
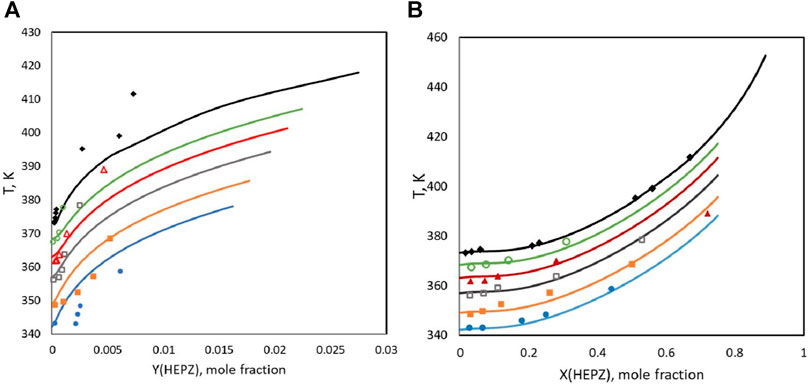
FIGURE 3. VLE data for HEPZ/H2O at 30 kPa, 40 kPa, 55 kPa, 70 kPa, 85 kPa, and 101 kPa. (A) Gas-phase data; (B) liquid-phase data: lines, Aspen results: blue, 30 kPa; yellow: 40 kPa; gray: 55 kPa; red: 70 kPa; green: 85 kPa; and black: 101 kPa; points, this study: ●, 30 kPa; ■, 40 kPa; □, 55 kPa; ▲, 70 kPa; ○, 85 kPa; and ◆: 101 kPa.
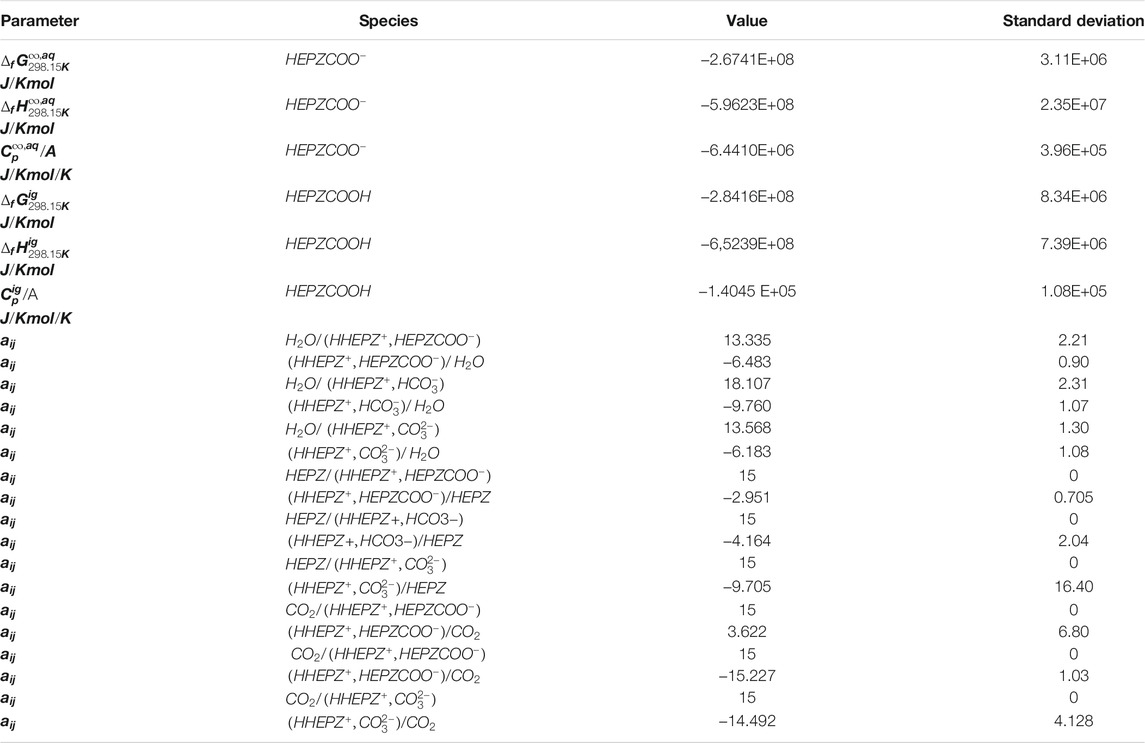
HEPZ has two dissociation constants pKa1 and pKa2, which are regressed by the manual adjustment of the standard-state properties of
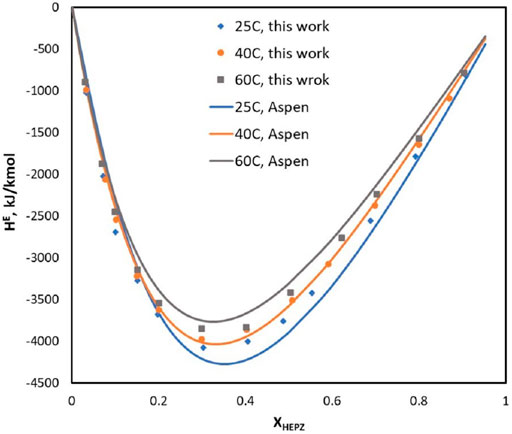
Poozesh et al. (2015) and Tagiuri (2019) measured the heat capacity values for HEPZ/H2O at various temperatures ranging from 303 to 353 K, and the mole fraction of HEPZ ranges from 0.1 to 0.9. In Figure 4, the calculated value of the model is compared with the measured value of the literature. In the high-concentration area, Figure 5 shows that there is a good correlation between the value calculated by Aspen and the experiment values. However, in the area of low concentration, the experiment values increase as T increases, and the calculated values do not show the same trend. The average relative deviation of all points is 0.0235%. The excess enthalpy of HEPZ/H2O calculated by Aspen is shown in Figure 5, and the average value of the relative deviation for excess enthalpy regression was 8.57%.
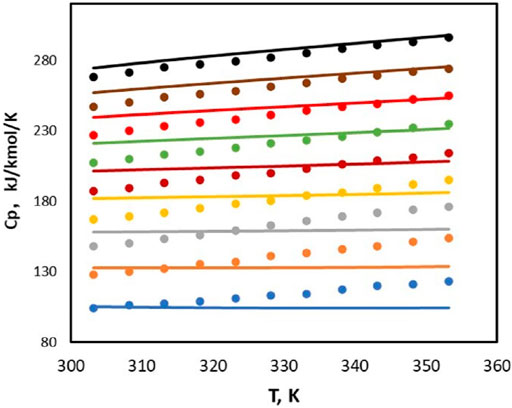
FIGURE 4. Heat capacity values for HEPZ/H2O (lines: Aspen, this study; points: ●:
N-(2-Hydroxyethyl) Piperazine/H2O/CO2
CO2 solubility data were measured by the method in 2.3, and then, they were regressed to acquire the ENRTL parameters as well as the standard-state properties
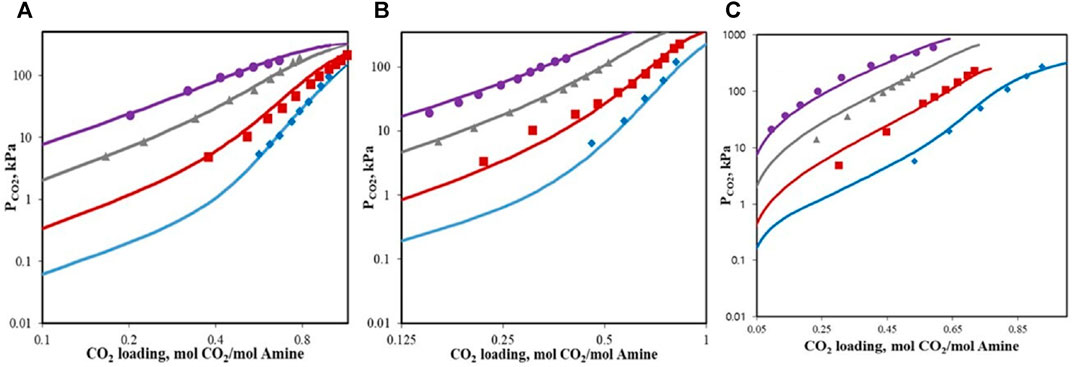
FIGURE 6. (A) CO2 solubility into 5 wt% HEPZ/H2O (lines, model results; points, this study: ◆, 313.15 K; ■, 343.15 K; ▲, 373.15 K; and ●, 393.15 K); (B) CO2 solubility into 15 wt% HEPZ/H2O (lines, model results; points, this study: ◆, 313.15 K; ■, 343.15 K; ▲, 373.15 K; and ●, 393.15 K); (C) CO2 solubility into 30 wt% HEPZ/H2O (lines, model results; points, this study: ◆, 313.15 K; ■, 343.15 K; ▲, 373.15 K; and ●, 393.15 K).
Cyclic Capacity
Circulating capacity is an important property to characterize the properties of amines, and there are two ways to calculate cyclic capacity. When considering a CO2 removal rate of 90% in the absorber, one way (way 1) is defining lean loading as the CO2 loading when the partial pressure of CO2 is 1 kPa at a temperature of 313.15 K, and the rich loading of CO2 partial pressure is 10 kPa. Meanwhile, cyclic capacity represents the difference between the rich and lean loadings with the unit of
However, in the actual operation of the absorption tower, the absorption tower is not at a constant temperature, and at the bottom of the tower, the rich loading is determined by the equilibrium partial pressure of CO2 in the flue gas as well as the temperature of the liquid. Also, the lean loading is defined by the desorption tower and not by the equilibrium partial pressure of CO2 in the top gas of the absorption tower. The other way (way 2) to calculate cyclic capacity is defining lean loading as the
Speciation
Figure 7 shows the speciation data for 5 wt%, 15 wt%, and 30 wt% HEPZ solutions at a temperature of 313.15 K forecast by the model. For 5 wt% and 15 wt% HEPZ solutions, when the loading is 0–0.5, most of the CO2 absorbed is converted into

FIGURE 7. Speciation for CO2 absorbed into 5 wt% (A), 15 wt% (B), and 30 wt% (C) HEPZ/H2O solutions at 313.15 K.
Reaction Equilibrium Constant and Heat of Reaction
With the activity coefficient as well as mole fraction of species in the 30 wt% HEPZ solutions at different temperatures calculated by the Aspen model, the equilibrium constants of the reactions in the system can be obtained as a function of temperature as follows:
where
The overall differential heat of reaction
Heat of Absorption Meanwhile, the heat of CO2 physical dissolution
where
where
where the equation parameters of
As this study did not take into account the species interaction, only the heat of physical dissolution and the chemical reaction heat were considered, but the excess enthalpy was not.
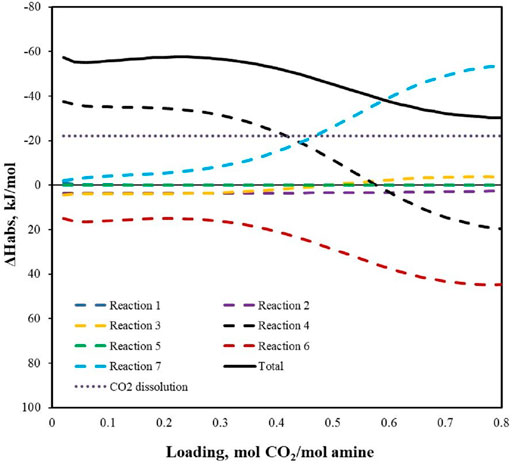
FIGURE 8. Differential heat of reaction in 30 wt% HEPZ at 313.15 K (—: total differential chemical reaction heat; ┅: heat of each reaction).
Conclusion
In this study, CO2 solubility was measured using the stainless-steel reactor for HEPZ aqueous solutions with three concentrations (5 wt%, 15 wt%, and 30 wt%) and four temperatures. Then, the VLE data for HEPZ/H2O were acquired using a gas–liquid double-circulation kettle at negative pressures (30 pKa, 40 pKa, 55 pKa, 70 pKa, and 85 pKa) and atmosphere pressure, within various mole fractions. The e-NRTL model as well as the sequential regression method were adopted to successfully develop a rigorous thermodynamic model for HEPZ/CO2/H2O in Aspen Plus. The missing physical parameters for HEPZ and the amine ions and the physical properties of interactions of NRTL as well as ENRTL were regressed from data acquired from this study and the literature. Based on the data from this study and the corresponding literature, the missing physical parameters of HEPZ, the standard state characteristics of amine ions, the interaction parameters of the non-random two-liquid model (NRTL), and ENRTL were regressed, including vapor pressure as well as heat capacity
The composition, cyclic capacity, and heat of absorption of the HEPZ aqueous system were predicted and analyzed by the model. Then, the heat of absorption reduced dramatically when the loading became higher. Meanwhile, the concentration of HEPZ indicated a negative impact on the absorption heat within the whole studied loading range, while the temperature showed a positive impact on the absorption heat, and the higher the temperature, the more obvious the tendency of the heat of absorption to decrease due to the load increase. The cyclic capacity increases as the concentration of HEPZ increases. Besides, the activity coefficient of all the species became larger when the concentration went higher. At a low loading, the main productors are
Data Availability Statement
The original contributions presented in the study are included in the article/Supplementary Material; further inquiries can be directed to the corresponding author.
Author Contributions
SL measured CO2 solubility and wrote the whole manuscript. Jianyou measured vapor–liquid equilibria for HEPZ + water. JC revised the manuscript.
Conflict of Interest
The authors declare that the research was conducted in the absence of any commercial or financial relationships that could be construed as a potential conflict of interest.
The handling editor declared a past co-authorship with one of the authors JC.
Publisher’s Note
All claims expressed in this article are solely those of the authors and do not necessarily represent those of their affiliated organizations or those of the publisher, the editors, and the reviewers. Any product that may be evaluated in this article or claim that may be made by its manufacturer is not guaranteed or endorsed by the publisher.
Acknowledgments
The authors would like to acknowledge the financial support from the National Natural Science Foundation of China (No. 21978145) and the National Science and Technology Support Program of China (No. 2015BAC04B01).
Supplementary Material
The Supplementary Material for this article can be found online at https://www.frontiersin.org/articles/10.3389/fenrg.2021.785039/full#supplementary-material
References
Aronu, U. E., Hoff, K. A., and Svendsen, H. F. (2011). CO2 Capture Solvent Selection by Combined Absorption-Desorption Analysis. Chem. Eng. Res. Des. 89 (8a), 1197–1203. doi:10.1016/j.cherd.2011.01.007
Chen, C.-C., Britt, H. I., Boston, J. F., and Evans, L. B. (1979). Extension and Application of the Pitzer Equation for Vapor-Liquid Equilibrium of Aqueous Electrolyte Systems with Molecular Solutes. Aiche J. 25 (5), 820–831. doi:10.1002/aic.690250510
Chen, X., and Rochelle, G. T. (2011). Aqueous Piperazine Derivatives for CO2 Capture: Accurate Screening by a Wetted wall Column. Chem. Eng. Res. Des. 89 (9), 1693–1710. doi:10.1016/j.cherd.2011.04.002
Choi, J. H., Kim, Y. E., Nam, S. C., Yun, S. H., Yoon, Y. I., and Lee, J.-H. (2016). CO2 Absorption Characteristics of a Piperazine Derivative with Primary, Secondary, and Tertiary Amino Groups. Korean J. Chem. Eng. 33 (11), 3222–3230. doi:10.1007/s11814-016-0180-9
Choi, W.-J., Seo, J.-B., Jang, S.-Y., Jung, J.-H., and Oh, K.-J. (2009). Removal Characteristics of CO2 Using Aqueous MEA/AMP Solutions in the Absorption and Regeneration Process. J. Environ. Sci. 21 (7), 907–913. doi:10.1016/S1001-0742(08)62360-8
Dash, S. K., Samanta, A., Nath Samanta, A., and Bandyopadhyay, S. S. (2011). Absorption of Carbon Dioxide in Piperazine Activated Concentrated Aqueous 2-Amino-2-Methyl-1-Propanol Solvent. Chem. Eng. Sci. 66 (14), 3223–3233. doi:10.1016/j.ces.2011.02.028
Dong, L., Chen, J., and Gao, G. (2010). Solubility of Carbon Dioxide in Aqueous Solutions of 3-Amino-1-Propanol. J. Chem. Eng. Data 55 (2), 1030–1034. doi:10.1021/je900492a
Dubois, L., and Thomas, D. (2012). Screening of Aqueous Amine-Based Solvents for Postcombustion CO2 Capture by Chemical Absorption. Chem. Eng. Technol. 35 (3), 513–524. doi:10.1002/ceat.201100523
Feron, P. H. M., and Hendriks, C. A. (2005). CO2Capture Process Principles and Costs. Oil Gas Sci. Technol. - Rev. IFP 60 (3), 451–459. doi:10.2516/ogst:2005027
Frailie, P., Plaza, J., Van Wagener, D., and Rochelle, G. T. (2011). Modeling Piperazine Thermodynamics. Energ. Proced. 4, 35–42. doi:10.1016/j.egypro.2011.01.020
Hamborg, E. S., and Versteeg, G. F. (2009). Dissociation Constants and Thermodynamic Properties of Alkanolamines. Energ. Proced. 1 (11), 1213–1218. doi:10.1016/j.egypro.2009.01.159
Hessen, E. T., Haug-Warberg, T., and Svendsen, H. F. (2010). The Refined E-NRTL Model Applied to CO2-H2O-alkanolamine Systems. Chem. Eng. Sci. 65 (11), 3638–3648. doi:10.1016/j.ces.2010.03.010
Kurihara, K., Nakamichi, M., and Kojima, K. (1993). Isobaric Vapor-Liquid Equilibria for Methanol + Ethanol + Water and the Three Constituent Binary Systems. J. Chem. Eng. Data 38 (3), 446–449. doi:10.1021/je00011a031
Lee, J. I., Otto, F. D., and Mather, A. E. (1976). Equilibrium between Carbon-Dioxide and Aqueous Monoethanolamine Solutions. J. Appl. Chem. Biotechnol. 26 (10), 541–549.
Li, H., Frailie, P. T., Rochelle, G. T., and Chen, J. (2014a). Thermodynamic Modeling of piperazine/2-aminomethylpropanol/CO2/water. Chem. Eng. Sci. 117, 331–341. doi:10.1016/j.ces.2014.06.026
Li, H., Moullec, Y. L., Lu, J., Chen, J., Marcos, J. C. V., and Chen, G. (2014b). Solubility and Energy Analysis for CO 2 Absorption in Piperazine Derivatives and Their Mixtures. Int. J. Greenhouse Gas Control. 31, 25–32. doi:10.1016/j.ijggc.2014.09.012
Li, L., Li, H., Namjoshi, O., Du, Y., and Rochelle, G. T. (2013). Absorption Rates and CO2 Solubility in New Piperazine Blends. Energ. Proced. 37 (37), 370–385. doi:10.1016/j.egypro.2013.05.122
Liang, Z., Rongwong, W., Liu, H., Fu, K., Gao, H., Cao, F., et al. (2015). Recent Progress and New Developments in post-combustion Carbon-Capture Technology with Amine Based Solvents. Int. J. Greenhouse Gas Control. 40, 26–54. doi:10.1016/j.ijggc.2015.06.017
Mandal, B. P., Guha, M., Biswas, A. K., and Bandyopadhyay, S. S. (2001). Removal of Carbon Dioxide by Absorption in Mixed Amines: Modelling of Absorption in Aqueous MDEA/MEA and AMP/MEA Solutions. Chem. Eng. Sci. 56 (21-22), 6217–6224. doi:10.1016/S0009-2509(01)00279-2
Peng, D.-Y., and Robinson, D. B. (1976). A New Two-Constant Equation of State. Ind. Eng. Chem. Fund. 15 (1), 59–64. doi:10.1021/i160057a011
Plasynski, S. I., Litynski, J. T., McIlvried, H. G., and Srivastava, R. D. (2009). Progress and New Developments in Carbon Capture and Storage. Crit. Rev. Plant Sci. 28 (3), 123–138. doi:10.1080/07352680902776440
Poozesh, S., Rayer, A. V., and Henni, A. (2015). Molar Excess Enthalpy (HmE) for Systems of Aqueous Piperazine Derivatives. J. Chem. Thermodynamics 90, 242–250. doi:10.1016/j.jct.2015.06.006
Poozesh, S., Rayer, A. V., and Henni, A. (2013). Molar Heat Capacity (Cp) of Aqueous Cyclic Amine Solutions from (298.15 to 353.15) K. J. Chem. Eng. Data 58 (7), 1989–2000. doi:10.1021/je400178k
Puxty, G., and Rowland, R. (2011). Modeling CO2 Mass Transfer in Amine Mixtures: PZ-AMP and PZ-MDEA. Environ. Sci. Technol. 45 (6), 2398–2405. doi:10.1021/es1022784
Rinker, E. B., Ashour, S. S., and Sandall, O. C. (2000). Absorption of Carbon Dioxide into Aqueous Blends of Diethanolamine and Methyldiethanolamine. Ind. Eng. Chem. Res. 39 (11), 4346–4356. doi:10.1021/ie990850r
Rochelle, G. T. (2009). Amine Scrubbing for CO 2 Capture. Science 325 (5948), 1652–1654. doi:10.1126/science.1176731
Sakwattanapong, R., Aroonwilas, A., and Veawab, A. (2009). Reaction Rate of CO2 in Aqueous MEA-AMP Solution: Experiment and Modeling. Energ. Proced. 1 (11), 217–224. doi:10.1016/j.egypro.2009.01.031
Tagiuri, A. M. (2019). Studies of Solubility of CO2 in Ionic Liquids, Kinetics, and Heat of Reactions of CO2 in Promising Cyclic Amines. PhD thesis. University of Regina. Available at: https://ourspace.uregina.ca/handle/10294/8969.
Yuan, Y., Sherman, B., and Rochelle, G. T. (2017). Effects of Viscosity on CO2 Absorption in Aqueous Piperazine/2-Methylpiperazine. Energ. Proced. 114, 2103–2120. doi:10.1016/j.egypro.2017.03.1345
Keywords: CO2 absorption, CO2 solubility, vapor–liquid equilibrium, N-(2-Hydroxyethyl)-piperazine (HEPZ), thermodynamic modeling, ENRTL model
Citation: Li S, Kang GW and Chen J (2021) Measurement and Thermodynamic Modeling for CO2 Solubility in the N-(2-Hydroxyethyl) Piperazine + Water System. Front. Energy Res. 9:785039. doi: 10.3389/fenrg.2021.785039
Received: 28 September 2021; Accepted: 25 October 2021;
Published: 29 November 2021.
Edited by:
Kangkang Li, Commonwealth Scientific and Industrial Research Organisation (CSIRO), AustraliaReviewed by:
Graeme Douglas Puxty, Commonwealth Scientific and Industrial Research Organisation (CSIRO), AustraliaHai Yu, Commonwealth Scientific and Industrial Research Organisation (CSIRO), Australia
Copyright © 2021 Li, Kang and Chen. This is an open-access article distributed under the terms of the Creative Commons Attribution License (CC BY). The use, distribution or reproduction in other forums is permitted, provided the original author(s) and the copyright owner(s) are credited and that the original publication in this journal is cited, in accordance with accepted academic practice. No use, distribution or reproduction is permitted which does not comply with these terms.
*Correspondence: Jian Chen, Y2otZGNlQHRzaW5naHVhLmVkdS5jbg==
 Simeng Li
 Jian Chen


