 Farzad Taheripour
 Ehsanreza Sajedinia
 Omid Karami
- Department of Agricultural Economics, Purdue University, West Lafayette, IN, United States
Induced Land Use Changes (ILUCs) can decrease the environmental benefits of Sustainable Aviation Fuels (SAFs) if produced from traditional food crops. The development of oilseed cover crops can eliminate the side effect of ILUCs for biofuel production because they come in rotation with the major crops with some savings in demand for new cropland. This study implemented Life Cycle Analysis (LCA) and GTAP-BIO to estimate ILUC emissions values, the potentially available area, and total possible emissions savings of producing SAFs from carinata, camelina, and pennycress in the United States. The results suggest that: 1) the meals produced in conjunction with increases in Sustainable Aviation Fuel production from carinata, camelina, and pennycress could reduce land use emissions by 12.9, 15.3, and 18.3 gCO2e/MJ, respectively; 2) the total area of available land for producing these feedstocks could be about 29.3 million ha in 2035; and 3) using this area of land for SAF production, depends on the mix of oilseed cover crops that can be produced in practice, could generate up to 92 million metric tons of savings in GHG emissions per year. The projected emissions savings is about 11% of the current global GHG emissions generated by the aviation industry. Providing incentives to encourage farmers to produce these cover crops and facilitating investment in producing SAF from these cover crops are the most important factors that could help the aviation industry to enhance emissions savings.
Introduction
The use of biofuels has been included in the emissions reduction policies of many countries across the world. However, the effectiveness of this policy is subject to debate as Induced Land Use Changes (ILUCs) and emissions vary across alternative biofuel pathways. Over the past 15 years, many papers have estimated ILUC emissions for various biofuel pathways1. The early papers in this field have claimed that producing biofuels from food crops (grains, oilseeds, sugar crops) will not lead to emissions savings due to large ILUC emissions (e.g., Searchinger et al., 2008 and Al-Riffai et al., 2010). However, the subsequent papers have rejected that claim and shown that the early papers in this area overrated the ILUC emissions for the first generation biofuels (Zilberman et al., 2018). On the other hand, several papers have shown that the second-generation biofuels produced from lignocellulosic energy crops cultivated on the available marginal land could make significant emissions savings. For example, Field et al. (2020) have shown that producing biofuels from dedicated energy crops could generate significantly large negative ILUC emissions due to major gains in soil carbon sequestration. The existing literature in this field has been mainly focused on ILUC values for ethanol and biodiesel produced from food crops and lignocellulosic feedstocks. More recently, Zhao et al. (2021) have estimated ILUC values for several aviation biofuel pathways again produced from food crops and lignocellulosic energy crops.
Due to concerns about using food crops for biofuels, since the late 2000s, the biobased industry has made major efforts to develop new biofuel feedstocks to lower the need for cropland and avoid competition between food and biofuel production. Developing new oilseed cover crops that can be used for biofuel production is an outstanding outcome of these efforts. These crops (e.g., camelina, carinata, and pennycress) can be produced on the existing cropland in rotation with other crops in 1 year in a multi cropping system and provide major savings in demand for cropland. It is important to emphasize that these crops could be produced as a second crop on the existing croplands that remain fallow in winter otherwise. While these oilseed cover crops can be used for biodiesel production, many papers have addressed the use of these oilseed cover crops to produce aviation biofuels (Zanetti et al., 2019; Alam and Dwivedi, 2019; Trejo-Pech et al., 2019; Robertson, 2020). Currently, the aviation industry relies on fossil fuels with no other economically affordable fuel alternatives (Prussi et al., 2021). In 2019, the global aviation industry emitted 785 million metric tons of CO2 (Graver et al., 2020). The United States aviation alone emitted 23% of this amount (Graver et al., 2020). It is about 5% of total energy-related CO2 emissions nationwide (EIA, 2019). Furthermore, the global aviation demand is expected to increases by 3.7% per year until 2039, regardless of the COVID-19 impact (IATA, 2020). The demand rise will result in around 2.27 billion tonnes of CO2 emissions, which is 2.31 times greater than the 2021 baseline (Valdés et al., 2021).
IATA members representing 93% of scheduled international air traffic put a cap on aviation net emissions to half the emissions by 2050 compared with the 2005 level (ICAO, 2019a). For this, they implemented a four-pillar policy: investment in technology, more effective operations, more efficient infrastructure, and positive economic measures (ICAO, 2019a). Sustainable Aviation Fuels (SAFs) have been used in many instances to designate fuels produced from non-conventional processes and, consequently, lower environmental impact (ICAO, 2019b). According to the Carbon Offsetting and Reduction Scheme for International Aviation (CORSIA), a SAF lowers carbon aviation fuel which an operator may use to reduce their offsetting requirement (ICAO, 2019b). SAF is becoming popular as one of the most promising ways to mitigate CO2 emissions from the aviation sector (IBAC, 2019). Some studies focused on SAF from different feedstocks and geographical places. Murphy et al. (2015) focused on the operational and economic factors related to lignocellulosic biomass supply for SAF production in central Queensland, Australia. They concluded that the region has the potential to produce all demand by using 1.1 million hectares of land. Hudson et al. (2016) set up a Roadmap to assess SAF potential production for the United Kingdom in the period up to 2050. They concluded that supports for 12 different biomasses could mitigate up to 24% of the United Kingdom aviation CO2 and create Gross Added Value up to £265 m. In a similar study in the United States, Chao et al. (2019) concluded that support from the government could reduce aviation emissions by 37.5–50% in 2050.
Besides these papers, and while many papers have examined the extent to which the first and second-generation biofuels provide emissions savings, not much effort has been made to assess the potential emissions savings due to producing biofuels from oilseed cover crops such as pennycress and carinata. However, some other studies analyzed economics (Eswaran et al., 2021; Mousavi-Avval and Shah, 2021) and agronomy (Mohdaly and Ramadan, 2020; Kumar et al., 2020; López et al., 2021) of pennycress and carinata. A typical oilseed cover crop can be produced as a second crop in rotation with other crops in 1 year on the existing croplands that remain fallow in winter otherwise. Many papers have introduced these crops as a proper feedstock for biofuel production (e.g., biodiesel or jet fuel), examined their oils and meals properties, and determined where and under what conditions they can be produced (e.g., Moser et al., 2009 and McGinn et al., 2019). However, to the best of our knowledge, no major effort has been made to quantify the potential emissions savings from using these cover crops for biofuel production. Producing biofuels from these crops will replace their equivalent uses of fossil fuels and generate major emissions savings. On the other hand, producing these oilseeds cover crops as a second crop will not generate additional demands for new cropland. The meal co-products of producing biofuels from these crops could be consumed as animal feed by the livestock industry and provide major savings in demand for cropland. In addition, the cultivation of oilseed cover crops could improve the Soil Organic Carbon (SOC) (Karami, 2021). This paper evaluates the emissions savings due to these effects for various options on cultivating these crops within the United States Midwest Corn Belt and outside this region. It discusses the policy incentives that can be implemented to gain the estimated emissions savings as well.
Finally, it is important to note that within the CORSIA framework, SAF can be produced from various feedstocks. Cultivation of some of these feedstocks could cause land use emissions (e.g., food crops), some could provide savings in land use emissions (e.g., oilseed cover crops or lignocellulosic feedstocks), and some feedstocks may not generate land use emissions (e.g., waste materials). In this paper, we only highlight potential emissions savings that could be gained due to SAF production from oilseed cover crops. Further research is needed to assess potential emissions savings for other SAF pathways.
Materials and Methods
To accomplish the goals of this research, we developed the following research activities:
Evaluation of ILUC Values for SAF Produced From Oilseed Cover Crops
Over the past 15 years, a large number of papers have estimated ILUC emissions for various biofuel pathways, including ethanol and biodiesel produced from food crops (grains, sugar crops, and edible vegetable oils) and lignocellulosic feedstocks (some examples are: Searchinger et al., 2008; Al-Riffai et al., 2010; Hertel et al., 2010; Tyner et al., 2010; and Taheripour et al., 2017). However, these papers have exclusively estimated ILUC values for road transportation biofuels. More recently, Zhao et al. (2021) have estimated ILUC values for 17 Sustainable Aviation Fuel (SAF) pathways also produced from food crops and lignocellulosic energy crops. The results of this paper show that ILUC values for aviation biofuels that can be produced from food crops are all positives (e.g., 20, 22.5, 34.6 gCO2e/MJ for United States soybean oil, Brazilian soybean oil, and palm oil produced in Malaysia and Indonesia, respectively). To the best of our knowledge, no major effort has been made to estimate ILUC values for SAF pathways that can be produced from oilseed cover crops cultivated in rotation with other crops in a double-cropping system. Here, we evaluate ILUC values for three varieties of oilseed cover crops in the United States: carinata, camelina, and pennycress.
We follow Zhao et al. (2021) to assess ILUC values for the cover crops mentioned above. These authors have introduced SAF pathways in the Global Trade Analysis Project-Biofuel (GTAP-BIO) model, which has been frequently used to assess the ILUC emissions due to biofuel production (e.g., Hertel et al., 2010; Tyner et al., 2010; and; Taheripour et al., 2017). GTAP-BIO is a Computable General Equilibrium (CGE) model that tracks production, consumption, and trade of all goods and services produced around the world. In particular, this model is designed to assess the land use consequences of alternative biofuel pathways, while it takes into account interactions between agricultural and energy markets and their links to other economic activities. We further developed this model by introducing SAF pathways for carinata, camelina, and pennycress.
Producing oilseed cover crops in rotation with other crops in a double-cropping system provides an opportunity to produce two products with no additional demand for land: Usable oils that can be converted to biofuels (SAF and biodiesel) and meal that can be used by livestock producers as a source of protein in animal feed diets. For example, the oil and meal contents of carinata are about 40 and 60%, respectively.
While production of an oilseed cover crop in rotation with other crops does not need additional land, its production as the second crop, could generate some savings in land use due to providing meal for the livestock industry. The additional meal produced from expansion in production of oilseed cover crops could help the livestock industry to produce more products using less land. The oilseed cover crops meals can be used as substitute for soybean meal or other oilseeds meals and drop the demand for cropland indirectly. Here we examine the extent to which producing SAF and its biodiesel co-products from oilseed cover crops produced in the United States affect land use changes at the global scale.
To accomplish this task, we added several new sectors into the GTAP-BIO model reported by Zhao et al. (2021) to produce carinata, camelina, and pennycress, their oils, and meals. Following these authors, we also considered the Hydroprocessed Esters Fatty Acids (HEFA) technology to convert the oils of these crops to SAF. This technology has been briefly described in S.M.
The oilseed cover crop sectors use intermediate inputs, including seeds, chemicals, energy, services, and other intermediate inputs. They demand primary inputs, including labor and capital (including profits gained above the operating costs) as well. The cost structures of these crops were determined using the techno-economic analyses used in the lifecycle assessments of these crops (Prussi et al., 2021) and in consultation with experts from CoverCress Inc.
For each new seed sector, a processing sector is included in the model. The new processing sectors purchase seeds, crush the seeds, convert the extracted oils to SAF (and biodiesel co-product), sell the fuels to the blending sector, produce meals, and sell the meals to livestock producers. The livestock industry uses the meal as feed. The cost structures of these industries follow the HEFA cost structure defined in Zhao et al. (2021).
To construct the benchmark database, the conservative yields of 2.4, 1.1, and 1.7 metric tons per hectare were used for carinata, camelina, and pennycress, respectively. In addition, the oil crushing rates of 0.42 for carinata, 0.39 for camelina, and 0.32 for pennycress were assumed. The model database is modified to include small amounts of outputs for each new pathway. Seeding the industry with a small quantity of the product is necessary to permit simulations in GTAP-BIO.
Finally, to assess the ILUC value for each oilseed cover crop pathway (i.e., carinata oil HEFA, camelina oil HEFA, and pennycress oil HEFA) an exogenous shock by 212.9 Million Gallons of Gasoline Equivalent (MGGE) was introduced to the model. For each pathway, the sock consists of 25% SAF and 75% biodiesel co-product. These shares are embedded in the HEFA technology. Following Zhao et al. (2021), a unique set of model parameters has been used across all examined pathways.
Potential Area for Producing Oilseed Cover Crops
Oilseed cover crops can be produced on marginal land or in rotation with other crops as a second crop in one planting year. In this paper, we only concentrate on the second option. Several papers (Sindelar et al., 2017; Akter et al., 2021) have addressed the plantation of oilseed cover crops in a double-cropping system, and some of the papers estimated the areas that these cover crops could be produced in rotation with other crops in the United States (Embaye et al., 2018; Alam and Dwivedi, 2019). Producing these cover crops in the United States Corn-Belt is an important option. Conventionally, a large portion of cropland in the Corn-Belt has been used to produce corn and soybeans in a 2-year rotation (henceforth: C-S rotation). Therefore, the area that follows this rotation is divided equally between soybean and corn in each crop year. If the land is used for corn production in the first year, that land will be used for soybean production in the second year and vice versa (Table 1). In this crop rotation, the whole area of cropland under corn and soybeans remains fallow in about 5 months from February to April at the beginning and then December and January at the end (Table 1). As mentioned above, some papers have shown that the oilseed cover crops can be introduced into this rotation in a double-cropping system to produce non-food oilseeds used for SAF production. The rotation of corn, oilseed cover crops, and soybean (henceforth: C-SC-S) is presented in the last two lines of Table 1. This table represents a general timeline for the C-SC-S double-cropping rotation. The exact timing of this rotation could vary according to the local agro-ecological conditions, maturity of soybean variety, and the type of cultivated oilseed cover crop. Depending on these conditions, the oilseed cover crops may be cultivated after corn harvest in September or October and harvested in May before soybean cultivation. It is important to note that, as shown in Table 1, with the proposed crop rotation, in between corn and soybean, each piece of cropland land will be cultivated for oilseed cover crops every other year. This means that compared with the conventional corn-soybean rotation, the proposed new rotation drops the area of winter fallow land by half.
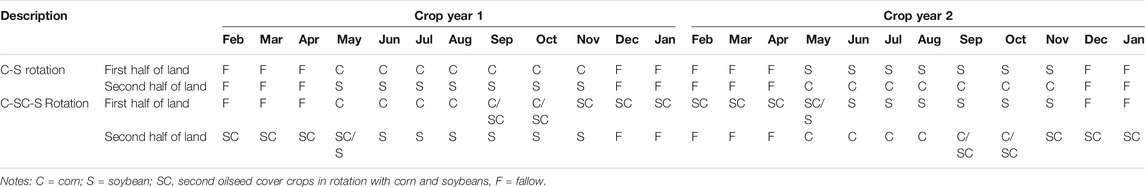
TABLE 1. Current corn-soybean rotation and proposed corn-second oilseed cover crop-soybean rotation timelines for the United States Corn-Belt.
To determine the potential area of producing oilseed cover crops in the United States, we rely on the work developed by Sindelar et al. (2017). They estimated the potential area for these crops for the United States Corn-Belt based on the common rotations used during 2009–13 in this region. However, Sindelar et al. (2017) missed two important facts: 1) areas of corn and soybean are growing over time while other crops (including Alfalfa) are declining, and 2) multiple cropping is possible outside the Corn-Belt as well. To remove these deficiencies, we considered area expansion for corn and soybean over time. In addition, we included potential areas outside the Corn-Belt. We worked with the average area of 2010–2020 based on USDA and estimated the potential area for producing oilseed cover crops for 2021 to 2035. The S.M. represents details of this estimation.
Finally, it is important to note that carinata, camelina, and pennycress can be produced on marginal cropland or even productive cropland as the main crop in late spring and summer. However, these alternatives may compete with other food crops and cause induced land use changes. The CORSIA framework has not considered these practices in providing feedstock for SAF production. Hence, within the CORSIA framework, oilseed cover crops should not displace other crops. The areas of land that we considered in this paper satisfies this limitation.
Potential Emissions Savings
The annual emission savings due to the use of a given oilseed cover crop (
1) Savings in emissions due to replacement of SAF with conventional jet fuel,
2) Savings in ILUC emissions
3) Savings in SOC due to cultivation of the seed,
Therefore
Where:
In these formulas,
The S.M. further describes these formulas and variables and provides sources of the implemented data for each equation.
Results and Discussion
ILUC Values for Carinata, Camelina, and Pennycress
Unlike biofuels produced from food crops, producing SAF from oilseed cover crops provides savings in cropland demand for two main reasons. First, producing these crops in a double cropping system in rotation with other crops does not increase demand for cropland. Second, converting these crops to SAF produces some meals that can be used by the livestock industry and that leads to savings in demand for cropland and hence less demand for deforestation.
Figure 1 shows the estimated induced land-use changes for the examined pathways. It shows that producing SAF from oilseed cover crops, regardless of the seed type, generates some savings in demand for cropland (blue bars). That leads to savings in land conversion towards active cropland [positive changes in: forest (dark green bars), pasture (light green bars), and marginal land (orange and yellow bars)]. For the same expansion in SAF, among the examined pathways, carinata and pennycress generate the lowest and highest savings in demand for cropland as shown in Figure 1. Two factors explain this observation. The first factor is seed yield. Carinata has the highest yield. The higher the yield is, the lower the saving in cropland will be for a given expansion in SAF. The second factor is the meal content of seed. Again, carinata has the lower meal content (or the highest oil content). For these two reasons, for a given shock in production of SAF, carinata provides the lowest and pennycress delivers the largest savings in demand for cropland. However, it is important to note that for a given area of land, carinata delivers more fuels than pennycress, for the same reason (higher seed yield and higher oil content).
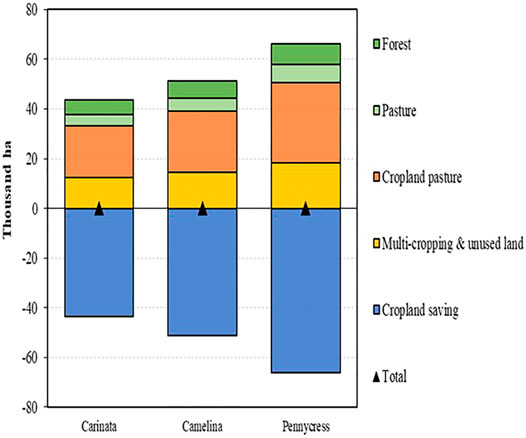
FIGURE 1. ILUCs due to expansions in SAF from carinata oil, camelina oil, and pennycress (all by HEFA).
Figure 2 shows the calculated ILUC values obtained for the examined pathways and their decompositions across sources of ILUC. The estimated ILUC values for carinata, camelina, and pennycress are -12.9, -15.3, and -18.3 gCO2e/MJ. These negative ILUC values reflect the fact that producing SAF from oilseed cover crops leads to savings in GHG emissions due to savings in demand for cropland. While carinata provided the lowest savings in land use emissions per MJ of produced fuels, it could provide more emissions savings for a given available area of land, as this crop produces more energy per unit of land. To highlight the importance of these savings, consider the estimated ILUC values for two other SAF pathways that could be produced in the United States: Corn ETJ and soybean oil HEFA. The estimated ILUC values for these two pathways are 24.9 and 20 gCO2e/MJ (Zhao et al., 2021). Therefore, producing SAF from oilseed cover crops has an absolute advantage over other SAF pathways that can be produced from food crops.
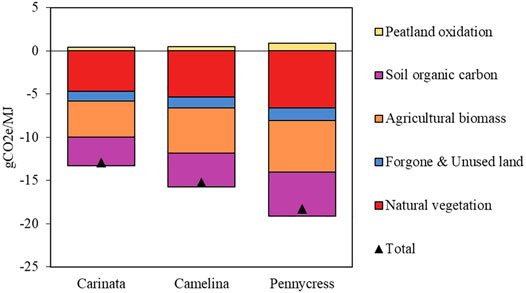
FIGURE 2. ILUCs for carinata oil, camelina oil, and pennycress in the United States (all by HEFA).
Figure 2 shows decompositions of the ILUC values for carinata, camelina, and pennycress by the sources of savings in emissions as well. This figure shows that savings in SOC, improvements in agricultural biomass, savings in foregone forest sequestration, and savings in losses of natural vegetation are the main sources of emissions savings for the examined oilseed cover crops; for details, see S.M. From this perspective, carinata, camelina, and pennycress are very similar.
Potential Area
The results show that there is a potential of 28.7 million hectares of land that we can sow oilseed cover crops such as carinata, camelina, and pennycress in 2021 (Figure 3). From this area, around 25.3 million hectares are in the United States Corn-Belt, and the other 3.4 million hectares are for the rest of the United States (not shown in the Figure). The potential area is expected to increase to 29.3 million hectares in 2035, as shown in Figure 3. Sindelar et al. (2017) also found that there is a potential of 27.1 million ha in the United States Corn Belt for sowing bioenergy crops. They also concluded that several factors affect the adoption rate of the farmers to choose oilseed cover crops in either corn-soybean rotation or corn-corn-soybean rotation.
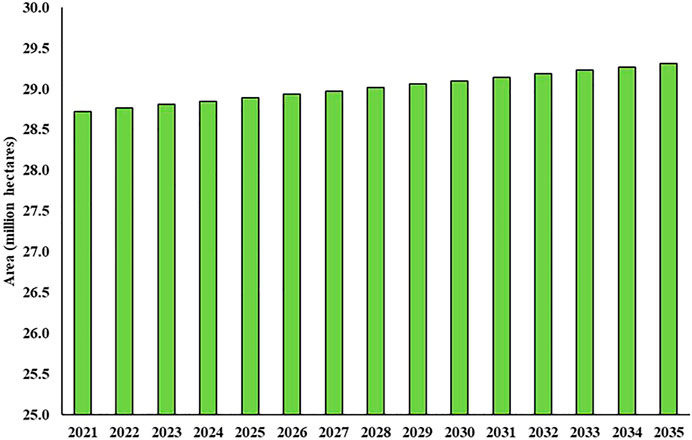
FIGURE 3. Potential area for oilseed cover crops from 2021 to 2035 in the United States.
In practice, the extent to which this area of land will be used for SAF production depends on various factors. The overall national policy and the plan of the United States aviation industry on using SAF are critical factors. A national mitigation policy that supports SAF production (e.g., financial support, mandates, and low carbon fuel standard) could generate major demand for oilseed cover crops encouraging farmers to adopt the C-CS-S rotation in practice. A major commitment to using SAF by the main operators of the aviation industry could cause the same effects. A secure demand for oilseed cover crops, providing educational and logistic supports for the farm industry, will encourage farmers to adopt the C-CS-S and other types of rotations better and faster to produce more oilseed cover crops. In practice, it depends on the regional climate and agronomy conditions, the costs of producing each type of oilseed cover crops, and provided policy incentives the farmers are expected to adopt and produce a mix of these crops. These factors jointly will determine the penetration rate for oilseed cover crops in each region.
Production of Oilseed Cover Crops
After knowing the potential area for producing oilseed cover crops, we could assess the potential production of oilseed cover crops. As addressed before, the existing literature mainly shows that carinata, camelina, and pennycress are the main cover crops that can be produced in a double-cropping system in rotation with other crops across the United States. As shown in Results and Discussion of the S.M., yields of these crops are not similar and vary by region and location of production. In addition, the extent to which each of these crops will be produced by farmers is uncertain. However, it is straightforward to provide a Production Possibility Frontier (PPF) for producing these crops at a macro level for United States agriculture. To define this PPF, since carinata and camelina are similar crops in terms of productivity and oil content, we concentrate only on carinata and pennycress. Hence, the PPF represents the maximum trade-off between the two selected oilseed cover crops.
To construct the PPF, we considered two extreme scenarios of devoting all available land in winter either to carinata or pennycress. As an example, consider Figure 4, which represents the represents the maximum trade-off between the two selected oilseed cover crops for 2035. In this year, as mentioned in the previous section, the total available area for producing oilseed cover crops will be about 29.3 million hectares. This area could be entirely devoted to the production of carinata. In this option, given the assumed carinata yield of 2.4 metric tons per hectare, the total available carinata seed for SAF production will be about 70.7 million metric tons (point A in Figure 3). On the other hand, if the entire land is devoted to pennycress in 2035, given the assumed yield of 1.68 metric tons per hectare, the available pennycress seed for SAF production will be about 49.5 million metric tons (point B in Figure 4). Any point on or under the PPF for 2035 (line AB in Figure 4) shows a possible option for the mix of carinata and pennycress feedstock for SAF production in 2035. For instance, point C shows the mix of the available land divided between carinata and pennycress half by half. Note that the annual PPF lines for 2021 up to 2035 fall below the PPF for 2035. However, the changes are not huge, as the potential area is expected to increase slowly. Indeed, the PPF for 2035 represents the set of potential mixes that might occur in the future in the production of oilseed cover crops for SAF.
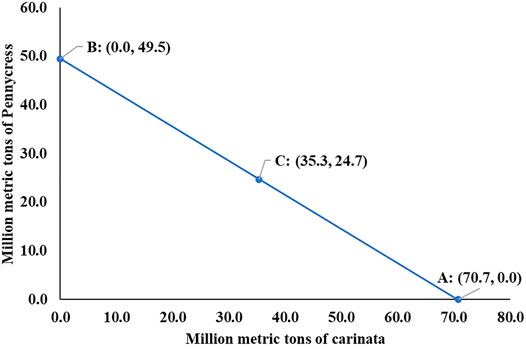
FIGURE 4. Production possibility Frontier for oilseed cover crops in 2035 in the United States.
Total Emissions Savings
Table 2 provides information about the annual emissions savings that can be achieved for the period of 2021–2035 for the two extreme cases mentioned above. The first scenario devotes the entire potential land for oilseed cover crops to carinata production. The second scenario allocates the entire land to pennycress. For the first scenario, the overall potential emissions savings increase from 91 MMT of CO2 emissions in 2021 to 92 MMT of CO2 emissions in 2035. The corresponding figures for pennycress for 2021 and 2035 are 50 and 51 MMT, respectively. Therefore, carinata can make more emissions savings than pennycress if it can be produced all over the potential area for the oilseed cover crops. The higher emission saving for carinata can be due to higher yield per hectare (2.4 versus 1.68 MT) as well as higher oil yield for carinata (43 versus 29%). Finally, Table 2 shows the potential savings in emissions for a scenario that equally divides the potential area for oilseed cover crops between carinata and pennycress. The estimated potential emissions savings for this case is about 70 MMT for 2021. It could increase to 72 MMT in 2035.
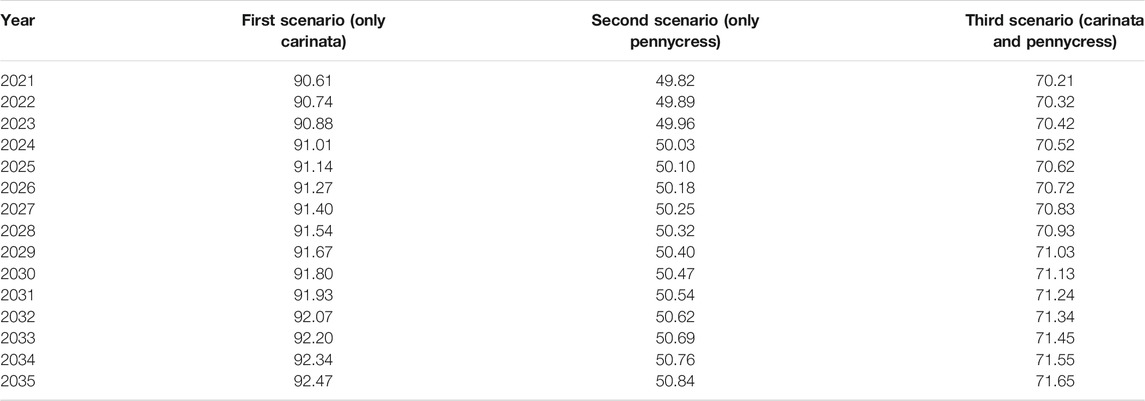
TABLE 2. Emission savings for carinata and pennycress from 2021 to 2035.
Therefore, the total annual emissions savings from SAF obtained from oilseed cover crops in 2035 could be between 52 and 92 MMT. These emissions savings are about 6–11% of the current annual emissions generated by the aviation industry on a global scale. In other words, if we consider oilseed cover crops in the corn-soybean rotation, we will be able to make enough feedstock to decrease the emissions of the aviation industry at the global scale up to 11%.
To better understand where the total emission savings come from, Figure 5 shows the decomposition of the total emissions saving for the third scenario mentioned above. The core LCA makes more than 70% of savings which is the highest. In contrast, improving SOC due to the cultivation of oilseed cover crops has the lowest share in total savings, around 11%. Savings due to ILUC stands in the middle by around 17% of total CO2 savings.
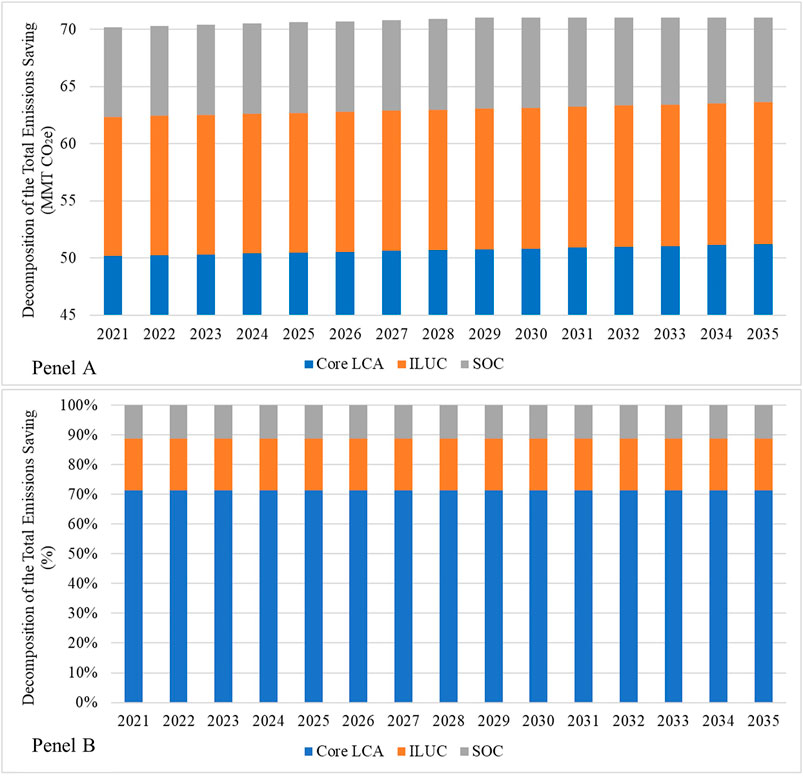
FIGURE 5. Decomposition of the total emissions savings (third scenario); Panel (A) represents total emissions by types of emissions; Pent (B) represents emissions shares by types of emissions.
Conclusion
Renewable sources can help the United States aviation sector mitigate its emissions, contributing to around 5% of total energy-related CO2 emissions nationwide (EIA, 2019). Using SAFs can successfully mitigate CO2 emissions in the aviation sector, particularly if produced from oilseed cover crops.
Oilseed cover crops are suitable feedstocks for SAF production while they can come in rotation with other crops, and there will not be any rise in demand for cropland for fuel production. Moreover, the livestock industry can use the meal that is a co-product in the SAF production process. Therefore, it will induce some savings in demand for cropland. This study estimated the total available land suitable for sowing carinata, camelina, and pennycress to provide feedstock for SAF production. It is possible to fit these oilseed cover crops in either corn-soybean or corn-corn-soybean rotations in the United States Corn Belt and the rest of the country. We also evaluated the total emissions savings due to ILUC, SOC increase, and replacing conventional jet fuel with SAF.
The results showed that producing SAF from carinata, camelina, and pennycress causes reductions in land use emissions by 12.9, 15.3, and 18.3 gCO2e/MJ, respectively. These ILUC values for oilseed cover crops can be compared with the estimated ILUC values for SAFs produced from corn and soybean, 24.9 and 20 gCO2e/MJ, respectively (Zhao et al., 2021). As a result, there is a big advantage for producing SAF from oilseed cover crops compared to SAF from food crops.
The estimated potential area for oilseed cover crops planting is 28.7 million hectares in the United States in 2021. From this, 25.3 million hectares will be in the United States Corn-Belt. Therefore, the total available area can reach 29.3 million hectares in 2035. If we sow carinata in all these available lands, we will be able to produce the highest amount of feedstock, 70.7 MMT of carinata. On the other hand, if we sow only pennycress on the available land, we will be able to produce 49.5 MMT of this oilseed cover crop. The total annual emissions savings from SAF obtained from oilseed cover crops in 2035 could be between 52 and 92 MMT, depends on the mix of oilseed cover crops produced. These emissions savings are about 6–11% of the current annual emissions generated by the aviation industry on a global scale.
SAF can mitigate emissions in the aviation sector and provide farmers a chance to improve their profits by including cover crops in their rotations. A national mitigation policy that supports SAF production (e.g., financial support, mandates, and low carbon fuel standard) could motivate farmers to adopt oilseed cover crops in corn-soybean or corn-corn-soybean rotations. There should also be some incentives for airlines to use SAFs instead of conventional fuels. It is also recommended that the farmers choose better farming practices (promotion of less intensive tillage practices and no-tillage) to improve SOC because SOC has the lowest share in total emissions savings.
The estimated emissions in this paper are subject to various sources of uncertainties. The sources of uncertainties are imbedded in LCAs, ILUC values, and SOC evaluations. The extent to which these cover crops will be produced in practice is uncertain too. However, providing incentives to encourage farmers to produce these cover crops and facilitating investment in producing SAF from these crops are the factors that help farmers to adopt cultivation of these crops faster.
Data Availability Statement
Publicly available datasets were analyzed in this study. This data can be found here: https://quickstats.nass.usda.gov/.
Author Contributions
Conceptualization: FT; Methodology: FT, ES, and OK; Data Assembly: FT, ES, and OK; Simulations: FT, ES, and OK; Formal Analysis: FT, ES, and OK; Original Draft: FT; Final Draft: FT and OK; Virtualizations FT, ES, and OK; Supervision: FT.
Funding
This study received financial support from: The United States Federal Aviation Administration Office of Environment and Energy through ASCENT, the FAA Center of Excellence for Alternative Jet Fuels and the Environment, ASCENT project (number 107208) through FAA Award (number 13-C-AJFE-PU) under the supervision of A.L. Oldani.
Conflict of Interest
The authors declare that the research was conducted in the absence of any commercial or financial relationships that could be construed as a potential conflict of interest.
Publisher’s Note
All claims expressed in this article are solely those of the authors and do not necessarily represent those of their affiliated organizations, or those of the publisher, the editors and the reviewers. Any product that may be evaluated in this article, or claim that may be made by its manufacturer, is not guaranteed or endorsed by the publisher.
Supplementary Material
The Supplementary Material for this article can be found online at: https://www.frontiersin.org/articles/10.3389/fenrg.2021.790421/full#supplementary-material
Footnotes
1Some of these papers has referred to ILUC as Indirect Land Use Change. However, both terminologies represent the same concept. The first section of the Supplementary Material (S.M.) of this paper describes the background of these two terminologies.
References
Abdelazim Mohdaly, A. A., and Ramadan, M. F. (2020). Characteristics, Composition and Functional Properties of Seeds, Seed Cake and Seed Oil from Different Brassica Carinata Genotypes. Food Biosci., 100752. doi:10.1016/j.fbio.2020.100752
Akter, H. A., Dwivedi, P., Anderson, W., Lamb, M., and Lamb, M. (2021). Economics of Intercropping Loblolly Pine and Oilseed Crops for Bio-Jet Fuel Production in the Southern United States. Agroforest Syst. 95 (2), 241–255. doi:10.1007/s10457-020-00584-5
Al-Riffai, P., Dimaranan, B., and Laborde, D. (2010). Global Trade and Environmental Impact Study of the E. Washington D.C.: U. Biofuels Mandate - Report for the E.C.
Alam, A., and Dwivedi, P. (2019). Modeling Site Suitability and Production Potential of Carinata-Based Sustainable Jet Fuel in the Southeastern United States. J. Clean. Prod. 239 (December), 117817. doi:10.1016/J.JCLEPRO.2019.117817
Arnaldo Valdés, R. M., Gómez Comendador, V. F., Comendador, G., and Fernando, V. (2021). The Role of Climate Change Levy Schemes in Aviation Decarbonization by 2050. IOP Conf. Ser. Mater. Sci. Eng. 1024 (1), 012114. doi:10.1088/1757-899x/1024/1/012114
Chao, H., Agusdinata, D. B., DeLaurentis, D., and Stechel, E. B.(2019). “Carbon Offsetting and Reduction Scheme with Sustainable Aviation Fuel Options: Fleet-Level Carbon Emissions Impacts for U.S. Airlines. Transportation Res. D: Transport Environ. 75: 42–56. doi:10.1016/j.trd.2019.08.015
EIA (2019). U.S. Energy-Related Carbon Dioxide Emissions. Washington D.C.: Independent Statistics and Analysis. https://www.eia.gov/environment/emissions/carbon/.
Embaye, W. T., Bergtold, J. S., Archer, D., Flora, C., Andrango, G. C., Odening, M., et al. (2018). Examining Farmers' Willingness to Grow and Allocate Land for Oilseed Crops for Biofuel Production.” Energ. Econ. 71, 311–320. doi:10.1016/j.eneco.2018.03.005
Eswaran, S., Subramaniam, S., Geleynse, S., Brandt, K., Wolcott, M., and Zhang, X. (2021). Techno-Economic Analysis of Catalytic Hydrothermolysis Pathway for Jet Fuel Production. Renew. Sustain. Energ. Rev. 151, 111516. doi:10.1016/j.rser.2021.111516
Field, J. L., Richard, T. L., Smithwick, E. A. H., Cai, H., Laser, M. S., LeBauer, D. S., et al. (2020). Robust Paths to Net Greenhouse Gas Mitigation and Negative Emissions via Advanced Biofuels. Proc. Natl. Acad. Sci. USA 117 (36), 21968–21977. doi:10.1073/pnas.1920877117
Graver, B., Rutherford, D., and Zheng, S. (2020). CO2 Emissions from Commercial Aviation 2013, 2018, and 2019. Washington D.C.: The International Council On Clean Transportation, no. October.
Hertel, T. W., Golub, A. A., Jones, A. D., O'Hare, M., Plevin, R. J., and Kammen, D. M. (2010). Effects of US Maize Ethanol on Global Land Use and Greenhouse Gas Emissions: Estimating Market-Mediated Responses. BioScience 60 (3), 223–231. doi:10.1525/bio.2010.60.3.8
Hudson, L., Jefferson, A. Bauen., Bauen, A., and Nattrass, L. (2016). “Sustainable Aviation.” In Christopher J B T - Biofuels for Aviation Chuck, 315–37, 315, 337. Academic Press. doi:10.1016/B978-0-12-804568-8.00014-7
ICAO (2019a). ICAO Environment Report. Chapter 4 - Market-Based Measures Available at: https://www.icao.int/Meetings/GLADs-2015/Documents/ENV_Report_MBMs_2010.pdf.
ICAO (2019b). ICAO Environmental Report 2019_Chapter 6_Climate Change Mitigation. Montreal, QC: CORSIA.
Karami, O. (2021). Assessing Environmental and Economic Impacts of Carinata-Based Sustainable Aviation Fuel Production in the S.E. United States. University of Georgia. Available at: https://www.etdadmin.com/student/mylist?siteId=1003&submissionId=803880.
Kumar, S., Seepaul, R., Mulvaney, M. J., Colvin, B., George, S., Marois, J. J., et al. (2020). Brassica Carinata Genotypes Demonstrate Potential as a Winter Biofuel Crop in South East United States.” Ind. Crops Prod. 150: 112353. doi:10.1016/j.indcrop.2020.112353
López, M. V., de la Vega, M., Gracia, R., Claver, A., and Alfonso, M. (2021). Agronomic Potential of Two European Pennycress Accessions as a Winter Crop under European Mediterranean Conditions. Ind. Crops Prod. 159: 113107. doi:10.1016/j.indcrop.2020.113107
McGinn, M., Phippen, W. B., Chopra, R., Bansal, S., Jarvis, B. A., Phippen, M. E., et al. (2019). Molecular Tools Enabling Pennycress ( Thlaspi Arvense ) as a Model Plant and Oilseed Cash Cover Crop. Plant Biotechnol. J. 17 (4), 776–788. doi:10.1111/pbi.13014
Moser, B. R., Knothe, G., Vaughn, S. F., and Isbell, T. A. (2009). Production and Evaluation of Biodiesel from Field Pennycress (Thlaspi arvenseL.) Oil†. Energy Fuels 23 (8), 4149–4155. doi:10.1021/ef900337g
Mousavi-Avval, S. H., and Shah, A. (2021). “Techno-Economic Analysis of Hydroprocessed Renewable Jet Fuel Production from Pennycress Oilseed.” Renew. Sustain. Energ. Rev. 149, 111340. doi:10.1016/j.rser.2021.111340
Murphy, H. T., O’Connell, D. A., Raison, R. J., Warden, A. C., Booth, T. H., Herr, A., et al. (2015). “Biomass Production for Sustainable Aviation Fuels: A Regional Case Study in Queensland.” Renew. Sustain. Energ. Rev. 44, 738–750. doi:10.1016/j.rser.2015.01.012
Prussi, M., Lee, U., Wang, M., Malina, R., Valin, H., Taheripour, F., et al. (2021). CORSIA: The First Internationally Adopted Approach to Calculate Life-Cycle GHG Emissions for Aviation Fuels. Renew. Sustain. Energ. Rev. 150 (February), 111398. doi:10.1016/j.rser.2021.111398
Robertson, K. A. (2020). Biomass Potential in Sustainable Aviation Fuel Development : Switchgrass Production Optimization and Carinata Oilseed Enterprise Viability Analysis. Knoxville, TN: University of Tennessee.
Searchinger, T., Heimlich, R., Houghton, R. A., Dong, F., Elobeid, A., Fabiosa, J., et al. (2008). Use of U.S. Croplands for Biofuels Increases Greenhouse Gases through Emissions from Land-Use Change. Science 319 (5867), 1238–1240. doi:10.1126/science.1151861
Sindelar, A. J., Schmer, M. R., Gesch, R. W., Forcella, F., Eberle, C. A., Thom, M. D., et al. (2017). Winter Oilseed Production for Biofuel in the US Corn Belt: Opportunities and Limitations. GCB Bioenergy 9 (3), 508–524. doi:10.1111/gcbb.12297
Taheripour, F., Zhao, X., and Tyner, W. E. (2017). The Impact of Considering Land Intensification and Updated Data on Biofuels Land Use Change and Emissions Estimates. Biotechnol. Biofuels 10 (1), 191. doi:10.1186/s13068-017-0877-y
Trejo-Pech, C. O., Larson, J. A., English, B. C., Yu, T. E., and Yu, T. E. (2019). Cost and Profitability Analysis of a Prospective Pennycress to Sustainable Aviation Fuel Supply Chain in Southern USA. Energies 12, 3055. doi:10.3390/en12163055
Tyner, W., Taheripour, F., Zhuang, Q., Dileep, K., and Baldos, U. (2010). Land Use Changes and Consequent CO2 Emissions Due to US Corn Ethanol Production: A Comprehensive Analysis.
Zanetti, F., Isbell, T. A., Gesch, R. W., Evangelista, R. L., Alexopoulou, E., Moser, B., et al. (2019). “Turning a Burden into an Opportunity: Pennycress (Thlaspi Arvense L.) a New Oilseed Crop for Biofuel Production.” Biomass and Bioenergy 130: 105354. doi:10.1016/j.biombioe.2019.105354
Zhao, X., Taheripour, F., Malina, R., Staples, M. D., and Tyner, W. E. 2021. “Estimating Induced Land Use Change Emissions for Sustainable Aviation Biofuel Pathways.” Sci. Total Environ. 779: 146238. doi:10.1016/j.scitotenv.2021.146238
Keywords: emissions savings, land use change, multiple cropping, oilseed cover crops, sustainable aviation fuels
Citation: Taheripour F, Sajedinia E and Karami O (2022) Oilseed Cover Crops for Sustainable Aviation Fuels Production and Reduction in Greenhouse Gas Emissions Through Land Use Savings. Front. Energy Res. 9:790421. doi: 10.3389/fenrg.2021.790421
Received: 06 October 2021; Accepted: 10 December 2021;
Published: 20 January 2022.
Edited by:
William Goldner, United States Department of Agriculture (USDA), United StatesReviewed by:
Arnaldo Walter, State University of Campinas, BrazilBenyamin Khoshnevisan, Chinese Academy of Agricultural Sciences (CAAS), China
Copyright © 2022 Taheripour, Sajedinia and Karami. This is an open-access article distributed under the terms of the Creative Commons Attribution License (CC BY). The use, distribution or reproduction in other forums is permitted, provided the original author(s) and the copyright owner(s) are credited and that the original publication in this journal is cited, in accordance with accepted academic practice. No use, distribution or reproduction is permitted which does not comply with these terms.
*Correspondence: Farzad Taheripour, dGZhcnphZEBwdXJkdWUuZWR1