 Sen Liu1
 Xia Fang
- 1State Grid Zhejiang Electric Power Corporation Research Institute, Hangzhou, China
- 2School of Mechanical Engineering Sichuan University, Chengdu, China
It can be seen that the corrosion failure of transmission and transformation equipment has increasingly restricted the safe operation of the Zhejiang power grid bottleneck problem. If effective anticorrosion measures are not taken promptly, transmission and transformation equipment serving in various sophisticated atmospheric environments will suffer serious corrosion damage in a relatively short period, which endangers the safe usage of transmission and transformation equipment and the security of grid operation. In this article, through the establishment of transmission and transformation steel components corrosion fracture mechanics model, a standard corrosion spectrum grading software based on DeepLabV3+ image segmentation technology is developed to determine the quantitative assessment method of corrosion damage and assess the corrosion status with safety degree of transmission and transformation equipment. According to the assessment results, the operation and maintenance units are guided to adopt differentiated corrosion maintenance and replacement strategies, so as to reduce corrosion safety hazards and reduce safety accidents and economic losses caused by corrosion, which is of great significance for the safe operation of power grids.
1 Introduction
Due to the huge area of China and the different climates in the regions (Shahbaz et al., 2020; Sun et al., 2020), the atmospheric corrosion environment is complicated and changeable, which causes failure and damage to the transmission towers serving in the natural environment, thus seriously affecting the normal operation of the power grid. The length of transmission line circuits at 220 kV and above totaled 840,000 km, with an increase of 3.8% year-on-year. However, according to recent statistics, the value of metal failures caused by corrosion in mainland China in 2014 was approximately 3.34% of the annual gross domestic product (GDP), while the cost of corrosion exceeded RMB two trillion (Xia et al., 2019). Among these, corrosion losses from metal components in-service exposed to the natural atmospheric environment (approximately 80% of the total equipment) accounted for about 50% (Wang et al., 2021). At present, the corrosion of transmission and transformation equipment has become one of the most common and significant disasters affecting the safety of the power grid. Corrosion has three typical characteristics of concealment (Matos et al., 2021), suddenness, and universality, which involve metal materials science, atmospheric environment science, chemical chemistry, corrosion electrochemistry, and other disciplines and technologies.
Material corrosion behavior in different atmospheric environments varies greatly (Cedeño-Vente et al., 2021), and serious corrosion of materials in local environments can easily cause the failure of transmission and substation equipment materials and components leading to grid safety accidents (Latosov et al., 2018), resulting in large economic losses and maintenance costs. For the corrosion condition of the pole tower, scholars have carried out a lot of research work. For example, Fan et al. (2016) conducted a study on the corrosion status of towers in some corrosive environments. The results indicate that transmission towers have experienced serious corrosion in coastal, industrial pollution, and acid rain concentrated areas, where rust is put into operation for 3–4 years and then transformed into overall rust in 1–2 years, while towers have fallen over in large areas due to corrosion failure. In addition, He et al. (2006) studied the atmospheric corrosion behavior of Q235 steel at 25 and 95 m from the shore and on marine platforms. It was found that there were large differences in the corrosion morphology of the samples on the sunrise and back Sun surfaces, where the corrosion products were mainly γ-FeOOH and Fe3O4. In terms of the corrosion resistance of the surface protective layer of the tower, Zhang et al. (2016) explored new technologies for the corrosion protection of steel components of transmission line towers. The study demonstrates that the addition of Al, Mg, Si, Re, and other elements to the pure zinc coating can obviously improve the corrosion resistance of the coating and reduce the whole life cycle cost.
The topography of Zhejiang Province slopes from southwest to northeast, with complicated terrain (Tao, 2022). The mountains are in three roughly parallel branches from southwest to northeast. Zhejiang is located in the central subtropical zone, with a monsoonal humid climate, moderate temperature, four distinct seasons, abundant light, and abundant rainfall. Due to the influence of oceanic and Southeast Asian monsoons (Zhang et al., 2019), Zhejiang has significant changes in the prevailing winds in winter and summer, significant seasonal changes in precipitation, and diverse configurations of climate resources (Wang et al., 2020). At the same time, under the dual influence of the westerly and easterly weather systems, there are many meteorological disasters, which are affected by typhoons, rainstorms, droughts, cold waves, high winds, hailstorms, frost damage, tornadoes, and other disasters. State grid Zhejiang electric power company is in a region with a different climate, a complicated and variable atmospheric corrosion environment. Long-term service in this natural environment transmission and transformation equipment will encounter serious corrosion damage. As shown in Figure 1, after a provincial power company of the state grid conducted a field survey of the province’s power transmission and transformation equipment in 2017, it was found that the number of pole/tower corrosion accounted for the largest proportion of transmission corrosion, accounting for 47%, while the metal framework accounted for the largest proportion of substation corrosion, accounting for 21%.
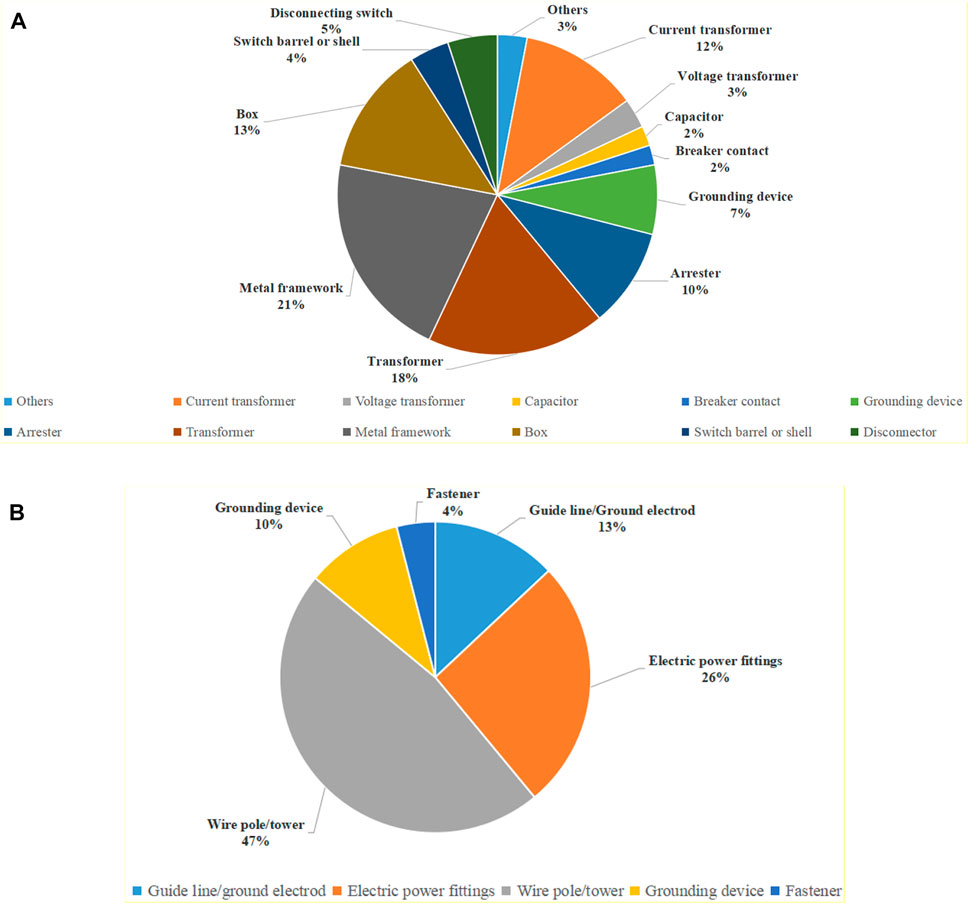
FIGURE 1. Proportion of corrosion cases of transmission and transformation equipment. (A) Transformation equipment and (B) transmission line.
Conventional corrosion detection techniques (Hernandez-Valle et al., 2014; Zhu et al., 2016; Patil et al., 2017) include manual detection, thickness measurement, and heavy measurement, but they are influenced by human experience. With the gradual development of modern detection methods, electrochemical detection, resistance detection, ultrasonic detection, and other methods are gradually being promoted and applied. However, these methods are expensive, cumbersome, poor field testability and other disadvantages, and are unsuitable for field application. In atmospheric environments, increased corrosion is always accompanied by changes in the corrosion morphology and structure of metal surfaces. Corrosion images can record information on the morphology of corroded metals and machine vision technology based on digital image processing is gradually being promoted as a fast and non-destructive inspection technique.
Machine vision (Melvyn et al., 2021) is part of artificial intelligence and utilizes imaging equipment to photograph and record inspection objects, which are processed and analyzed at the terminal (Tian et al., 2021). In practice, it has a huge impact on the detection of product merit and damage to parts. Generally, through image pre-processing, the noise or redundant information in the original image is removed (Irino et al., 2020), then through texture analysis or feature engineering processing of the image, different feature vectors are obtained; and finally, through machine learning methods such as random forest, decision tree, k-nearest neighbor (KNN), and neural network, different corrosion level results are classified. In addition, deep learning techniques are beginning to be applied to corrosion detection, which enables end-to-end recognition and detection from image to result, thus enabling a more accurate prediction of corrosion classification.
The main novelties/contributions of the proposed method are stated as follows:
Machine vision and deep learning technology are applied to study the corrosion morphology and distribution characteristics of pole towers.
The corrosion strength t-P-S-N curve equation of the member with corrosion time at reliability P is calculated according to the mechanical model, which calculates the failure time of the strength at different corrosion degrees respectively.
By developing the standard corrosion spectrum grading software for transmission and transformation steel components to photograph and identify in-service poles and towers, which enables quantification and corrosion grading.
The rest of this article is presented as follows: the atmospheric corrosion of metals is provided in Section 2. In addition, Section 3 describes the image segmentation based on DeepLabv3+ in detail. Section 4 illustrates modeling and analysis of corrosive working conditions in power transmission and transformation. The results and discussion of standard corrosion spectrum classification software in cases are illustrated in Section 5. Last, Section 6 summarizes various conclusions.
2 Atmospheric corrosion of metals
2.1 Key corrosion factors for metals in the atmosphere
Atmospheric pollutants (Prikazchikov et al., 2021) are transported to metal surfaces in two main forms, namely, dry deposition and wet deposition forms. According to the difference in the annual average humidity of the metal surface, the atmospheric environment is divided into three categories: dry environment (RH <60%), ordinary environment (RH = 60–75%), and humid environment (RH>75%). The relative humidity of the atmosphere is one of the most influential factors in atmospheric corrosion. The greater the relative humidity in the atmosphere, the air contains gaseous water to reach saturation and condensed into liquid water attached to the metal surface dew more easily, which produces more obvious condensation, and the corrosion rate also increased accordingly.
In addition, atmospheric corrosion is basically electrochemical corrosion based on the interaction between the material and the atmospheric environment, which usually occurs by the formation of a thin liquid film on the surface of the object by moisture. When the film reaches a thickness of 20–30 molecules, it becomes the electrolyte film required for electrochemical corrosion. At the same time, oxygen in the air, corrosive substances, and surface deposits dissolved in the metal surface liquid film will accelerate the corrosion of metals. Therefore, the elements of corrosion of metal materials in the atmosphere mainly include moisture, oxygen content, corrosive substances, and surface deposits.
Among all the elements of corrosion, the key factors affecting the atmospheric corrosion of metals are the time of forming a film with moisture on the metal surface and the amount of corrosive substances in the atmosphere. It is generally agreed that the main environmental factors affecting atmospheric corrosion are three: first, the temperature is above 0°C when the humidity exceeds the critical humidity time; second, the content of sulfur dioxide; and third, the content of salt particles. Therefore, the division of atmospheric corrosion environment is mainly based on humidity and pollutants atmospheric pollution components, which are the main factors that accelerate atmospheric corrosion.
2.2 Thermodynamic laws of atmospheric metal corrosion
Atmospheric pollution plays a serious destructive role on materials, while thermodynamics has an essential influence on the corrosion of metals in the environment. In the atmospheric environment, the main gases on the object erosion are SO2, H2S, CO2, etc. When there are SO2, carbon steel, and stainless steel corrosion resistance significantly decreased, along with SO2 content increases the amount of corrosion, which is particularly significant in the atmosphere when there is both H2O and SO2. SO2 corrosion of Fe is mainly due to the formation of SO2 in the water film on the surface of the metal sulfuric acid, while the metal in the air and the role of this film to produce oxygen depolarization.
2.2.1 Corrosion reactions in contaminated environments
The energy structure of the Zhejiang region is mainly coal-fired, and thus soot pollution is relatively serious. Analysis using scanning electron microscopy and X-ray energy spectroscopy knows that paraffin and soot contain large amounts of metal elements, which are catalysts for the oxidation process (Zhang et al., 2021) when formed with high humidity or precipitation in the air, as follows:
In the case of corrosion under a thin film of the sulfuric acid solution, oxygen depolarization is 100 times greater than hydrogen depolarization. It follows that metals in a polluted atmospheric environment undergo corrosion reactions mainly according to the following calculations
The increased corrosion effect of the following reactions can be ignored.
The aforementioned equations can be expressed collectively as
2.2.2 Thermodynamic calculations of metal corrosion reactions in atmospheric environments
The chemical reaction can be expressed as follows:
According to the thermodynamic principle, the free energy of the reaction at constant temperature and pressure changes as follows:
where K means the equilibrium constant and Q denotes the ratio of the product to the reactant for a given activity (i.e., when the concentration is expressed in terms of partial pressure).
The activity is expressed in terms of the partial pressure of the gas, which is calculated by
The free energy change at atmospheric temperature and pressure can be expressed as
Based on the data in Table 3, the standard free energy change for the corrosion reaction can be found as
Furthermore, due to the following equation
So, the following can be obtained
Substituting the data, the equilibrium constant for the corrosion reaction can be solved as follows:
Following the theory of calculation of Eq. 6, for the reaction of Eq. 4, the limiting equilibrium partial pressure can be calculated by
Taking the logarithm on both sides, this can be calculated as
Substituting the values obtained from the previous calculation and Eq. 15 into Eq. 9, which can be shown as follows:
Under equilibrium conditions and at natural local conditions the partial pressure is 0.20946 atm, thus changing Eq. (16) to Eq. (17), as follows:
The resulting solution (i.e., equilibrium partial pressure) can be expressed as
It is known from the basic theory of thermodynamics that the magnitude of Kp determines the extent to which a chemical reaction proceeds, where the larger is the Kp, the greater is the extent to which the reaction proceeds. From the calculated data, it is known that the equilibrium constant for the corrosion reaction of Fe in an SO2 polluted atmosphere is 2
3 Image segmentation based on DeepLabv3+
3.1 Image segmentation technique
Image segmentation is another fundamental task in computer vision besides classification and detection, which implies segmenting the image into different blocks based on the content. Compared to image classification and detection, segmentation is a more delicate task because each pixel point needs to be classified, as in the case of the street view segmentation below, where the outline of the object is precisely outlined due to the classification of each pixel point, while the bounding box is not given as in the case of detection.
The two parts of the split network are called the encoder and decoder; in short, the first part “encodes” the information as a compressed vector to represent the input. The role of the second part (decoder) is to reconstruct this signal into the desired output. There are many neural network implementations based on the encoder–decoder architecture. Among them, fully convolutional networks (FCNs), SegNet, and UNet are some of the most popular ones in recent years.
3.2 DeepLabv3+ algorithm
Based on DeepLabV3+ to implement image segmentation, the overall architecture flow of the algorithm model is demonstrated in Figure 2. There is no doubt that the algorithm also consists of two parts, encoder and decoder (Chen et al., 2018). The first module connected in encoder is the dynamic convolution neural network (DCNN), which represents the backbone network used to extract the image features (Yang et al., 2022). The right side of DCNN is an atrous spatial pyramid pooling (ASPP) network, which uses a 1

FIGURE 2. Algorithm flow of image segmentation based on DeepLabV3+.
In other words, the main body of encoder of DeepLabV3+ is DCNN with null convolution, which can be adopted from common classification networks such as ResNet, followed by ASPP module with null convolution, thus introducing multi-scale information. The underlying features are further fused with the higher-level features to improve the segmentation boundary accuracy.
4 Modeling and analysis of corrosive working conditions in power transmission and transformation
4.1 Mechanical model analysis of steel components for power transmission and transformation
4.1.1 Strength and deformation calculation
The finite element equations for the strength and deformation analysis of the cowling based on the finite element method is expressed as
where
The displacement solution of Eq. 19 can be calculated by
The stress solution of Eq. 19 can be calculated by
where
4.1.2 Transmission line tower model establishment
The transmission line tower is basically established by the beam unit, while the completed tower is established as shown in Table 1.
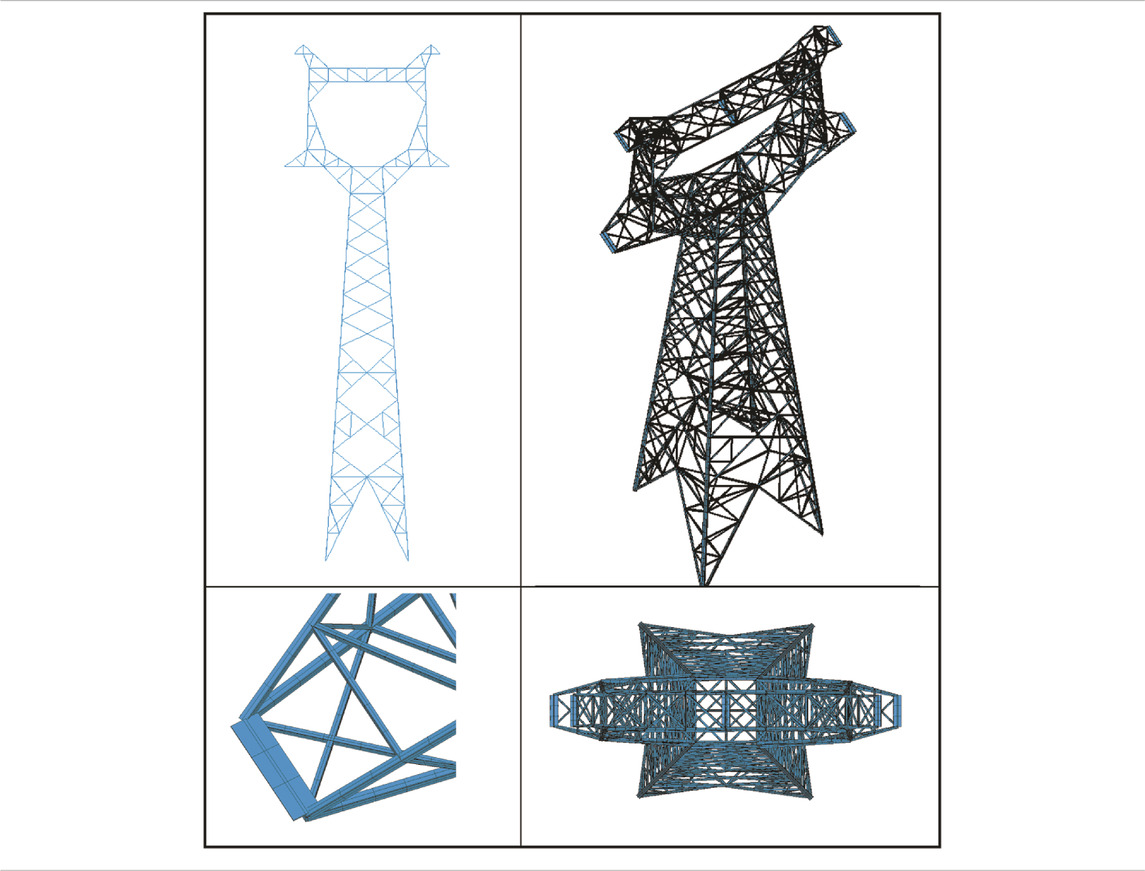
TABLE 1. Grid model.
1) The model is a truss structure, which is basically modeled by using beam units;
2) The bottom support of the model is fully restrained;
3) The model lifting wire pedestal adopts T-section and the rest adopts L-section;
4) Non-structural accessories such as lifting wires and top fixtures are ignored.
4.2 Modeling of corrosion conditions of steel components in power transmission and transformation
The transmission line tower leg corrosion problem has now seriously affected the safe and stable operation of transmission lines. In order to compare the maximum structural load change of the transmission tower under different corrosion conditions and analyze the overall impact of the corrosion of the iron frame on the tower, this section establishes a schematic diagram of the corrosion tower model to analyze the self-weight condition.
For the purpose of an accurate analysis of the load-bearing situation of the transmission tower under different corrosion conditions. In addition, section cutting is now carried out on the rod unit where the maximum stress point of the self-weight condition is located, which simulates the force situation of the maximum danger point of the tower under different degrees of corrosion, the detailed corrosion simulation section size cutting is shown in Table 2.
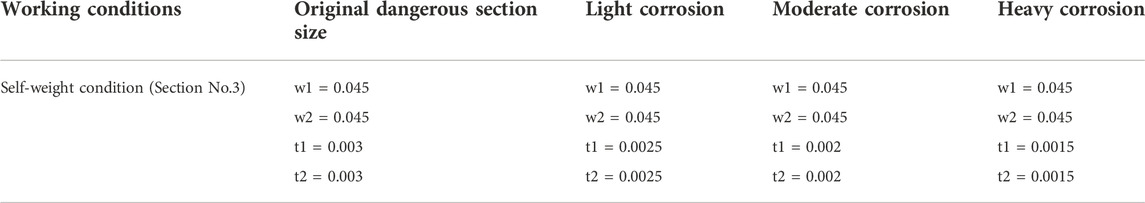
TABLE 2. Cutting thickness of rusted sections under different working conditions.
4.3 Transmission and transformation steel components corrosion conditions self-weight load analysis
Under the self-weight condition, the maximum stress of the transmission tower plus occurs on the crossbar at the lower end of the tower with a height of about 4.5 m. The maximum stress is 15.6MPa, and the cross-section of the beam where occurs in section 3. The beams of the cross-section where the maximum stress is located are established separately as light, medium, and heavy cross-sectional rust thickness percentages for finite element force analysis, which is calculated as presented in Table 3.
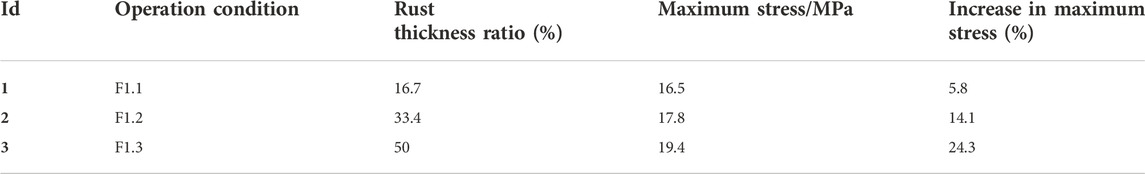
TABLE 3. Results of finite element stress analysis of corrosion tower under self-weight condition.
From the calculation results, it can be seen that under the self-weight condition with the increase of corrosion thickness, the maximum stress of the tower gradually increases, while the increase in general has less impact on the structural safety of the tower.
It is notable that the stress clouds under each working condition are detailed in Supplementary Appendix SA, while the local beam stress–strain clouds under each working condition are detailed in Supplementary Appendix SB and Supplementary Appendix SC.
5 Case study
5.1 Transmission and transformation steel components standard corrosion spectrum classification software
Based on the existing real image and standard spectrogram data set, the transmission and transformation tower corrosion detection software were developed. The inspection software mainly consists of the following parts: 1) transmission tower image display area; 2) tower basic information display area; 3) corrosion area calculation setting area; and 4) identification calculation results display area. By reading the local image and setting the basic configuration, it can run the inspection program. At the same time, the software supports the filling of geographic location information within China, which corresponds to the location information of the tower images, voltage lines, and other information one-by-one, so that precise positioning of the tower corrosion detection can be realized, which is convenient for workers to locate and repair.
5.2 Introduction of corrosion classification scheme for transmission and transformation steel components
The quantitative analysis of corrosion images is a difficult problem to be solved. Transmission and transformation tower images can only be obtained outdoors, where there are interference factors such as complex background and variable shooting environment, which bring great trouble to the algorithm modeling. Considering the above factors, this paper proposes a corrosion classification method for transmission and transformation steel components based on image semantic segmentation, as shown in Figure 3, which can be divided into the following steps: 1) image acquisition; 2) corrosion location and recognition of long-range image; 3) quantitative recognition of corrosion in close range images; 4) steel member matching; and 5) graded evaluation.
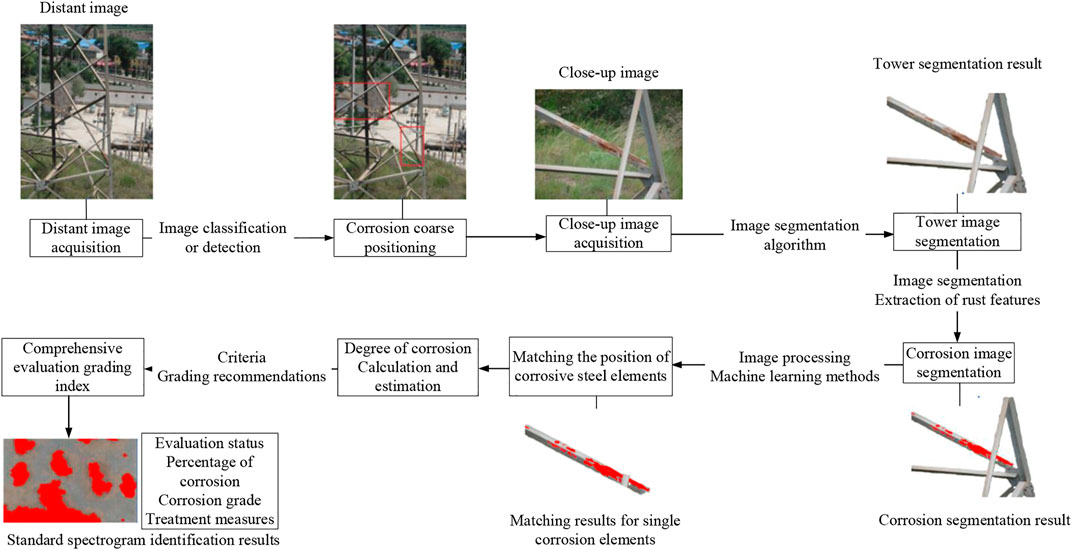
FIGURE 3. Corrosion recognition algorithm process for transmission and transformation steel components.
In the tower segmentation detection application, it is obvious that the algorithm has high recognition accuracy. After passing the dataset production and pre-processing steps, the algorithm is input into the DeepLabV3+ network, while image post-processing and user interface (UI) display are performed to obtain satisfactory recognition results.
5.3 Quantitative analysis and evaluation of corrosion by standard spectrograms
Modeling of standard corrosion spectra to complete the quantitative analysis of the degree of corrosion. Standard corrosion spectra, that is, the corrosion degree standard images used in major standards, including “DLT 2055–2019 Transmission Line Steel Corrosion Safety Assessment Guidelines,” “GB T6461-2002 Salt Spray Test National Standard Specimen and Specimen Rating,” “ASTM-D610-08 Standard Test Methods for Evaluating the Corrosion Degree of Painted Steel Surfaces,” of which the example images are shown in Figure 4A.
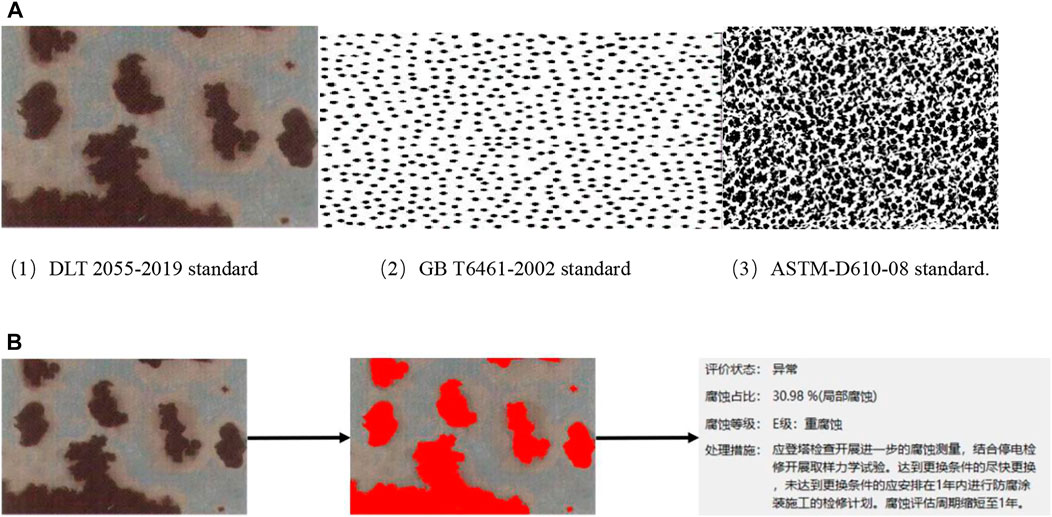
FIGURE 4. Example diagram and result diagram. (A) Example images in each major standard and (B) standard corrosion spectrum recognition results.
Based on the threshold method and contour extraction algorithm, this article has completed the aforementioned three corrosion standard example images of corrosion recognition modeling and corrosion simple category recognition (uniform corrosion or local corrosion), the recognition results are displayed in Figure 4B.
6 Conclusion
This article carries out the calculation of the corrosion fracture mechanics model of transmission and transformation steel components and the development of standard corrosion spectrum grading software, which contains the following three contributions/novelties:
1) The analysis of the mechanical properties of corrosion fracture of transmission and transformation steel components revealed that, under the load of corrosion and self-weight, if the structure is subjected to a small load, the impact of corrosion on the structure is relatively small. If the structure is subjected to larger loads, the impact of corrosion on the structure increases sharply and threatens the safety of the tower, which may produce the phenomenon of tower collapse;
2) Classification of corrosion images according to the established tower mechanical properties model, which is mainly based on the tower structure and corrosion fracture mechanical properties;
3) Inspection of steel corrosion using machine vision technology, that is, DeepLab-based semantic segmentation;
4) Through the multi-angle shooting scheme, the corrosion images of individual towers are obtained, and the corrosion classification results are obtained by image processing and classification, eventually a tower corrosion quantification scheme is formulated. The corrosion classification results of multi-directional tower images are evaluated comprehensively to obtain the final satisfactory corrosion rating of the tower.
Data availability statement
The original contributions presented in the study are included in the article/Supplementary Material; further inquiries can be directed to the corresponding author.
Author contributions
SL: conceptualization, writing–reviewing; JH: writing–original draft preparation, and investigation; ZQ: visualization and contributed to the discussion of the topic; XS: writing–eeviewing and editing; and XF: supervision.
Funding
This work is supported by the Science and technology project of State Grid Zhejiang Electric Power Co., Ltd. (B311DS221002).
Conflict of interest
SG, JH, ZQ, and XS were employed by the company State Grid Zhejiang Electric Power Company. The authors declare that this study received funding from State Grid Zhejiang Electric Power Corporation Research Institute. The funder had the following involvement in the study: data collection and analysis.
The remaining authors declare that the research was conducted in the absence of any commercial or financial relationships that could be construed as a potential conflict of interest.
Publisher’s note
All claims expressed in this article are solely those of the authors and do not necessarily represent those of their affiliated organizations, or those of the publisher, the editors, and the reviewers. Any product that may be evaluated in this article, or claim that may be made by its manufacturer, is not guaranteed or endorsed by the publisher.
Supplementary material
The Supplementary Material for this article can be found online at: https://www.frontiersin.org/articles/10.3389/fenrg.2022.1014603/full#supplementary-material
References
Cedeño-Vente, M. L., Manríquez, J., Mondragón-Rodríguez, G. C., Camacho, N., Gomez-Ovalle, A., Gonzalez-Carmona, J., et al. (2021). Application of a transmission line model to evaluate the influence of structural defects .on the corrosion behavior of arc-PVD CrN coatings. Ceram. Int. 47, 20885–20899. doi:10.1016/j.ceramint.2021.04.087
Chen, L., Zhu, Y., Papandreou, G., Schroff, F., and Adam, H. (2018). Encoder-Decoder with Atrous separable convolution for semantic image segmentation. Comput. Sci. ECCV, 833–851. doi:10.1007/978-3-030-01234-2_49
Fan, Z. P., Li, X. G., and Yue, Z. W. (2016). Dose-response functions of metallic materials natural environment corrosion. Shandong Electr. Power 43 (1), 6–9+24. Available at: https://kns.cnki.net/kcms/detail/detail.aspx?FileName=SDDJ201601006&DbName=CJFQ2016.
He, J. X., Qin, X. Z., and Yi, P. (2006). Corrosion exposure study on Q235 steel in marine atmospheric. Surf. Technol. 4, 21–23. doi:10.16490/j.cnki.issn.1001-3660.2006.04.007
Hernandez-Valle, F., Clough, A. R., and Edwards, R. S. (2014). Stress corrosion cracking detection using non-contact ultrasonic techniques. Corros. Sci. 78, 335–342. doi:10.1016/j.corsci.2013.10.018
Irino, N., Shimoike, M., Mori, K., and Yamaji, I. (2020). A vision-based machine accuracy measurement method. CIRP Ann. 69, 445–448. doi:10.1016/j.cirp.2020.04.107
Latosov, E., Maaten, B., Siirde, A., and Konist, A. (2018). The influence of O2 and CO2 on the possible corrosion on steel transmission lines of natural gas. Energy Procedia 147, 63–70. doi:10.1016/j.egypro.2018.07.034
Matos, T. S., Portella, K. F., Henke, S. L., Braganca, M., Galvao, M., Dias, B., et al. (2021). Analysis of anchor rod failure in a guyed transmission tower: Influence of microstructures and corrosion mechanisms. Eng. Fail. Anal. 121, 105166. doi:10.1016/j.engfailanal.2020.105166
Melvyn, L. S., Lyndon, N. S., and Mark, F. H. (2021). The quiet revolution in machine vision-a state-of-the-art survey paper, including historical review, perspectives, and future directions. Comput. Industry 130, 103472. doi:10.1016/j.compind.2021.103472
Patil, S., Karkare, B., and Goyal, S. (2017). Corrosion induced damage detection of in-service RC slabs using acoustic emission technique. Constr. Build. Mater. 156, 123–130. doi:10.1016/j.conbuildmat.2017.08.177
Prikazchikov, S. A., Shuvalov, K. I., Kushnikov, V. A., and Kushnikova, E. V. (2021). Setting tasks for constructing an integrated decision support and control system according to minimize losses from harmful effects of atmospheric pollutants. IFAC-PapersOnLine 54 (13), 727–731. doi:10.1016/j.ifacol.2021.10.538
Shahbaz, M., Raghutla, C., Chittedi, K. R., Jiao, Z., and Vo, X. V. (2020). The effect of renewable energy consumption on economic growth: Evidence from the renewable energy country attractive index. Energy 207, 118162. doi:10.1016/j.energy.2020.118162
Sun, K., Yao, W., Fang, J. K., Ai, X., Wen, J., and Cheng, S. (2020). Impedance modeling and stability analysis of grid-connected DFIG-based wind farm with a VSC-HVDC. IEEE J. Emerg. Sel. Top. Power Electron. 8 (2), 1375–1390. doi:10.1109/JESTPE.2019.2901747
Tao, A. X. (2022). Research on the realization path of carbon emission reduction in Zhejiang Province. Energy Rep. 8, 501–506. doi:10.1016/j.egyr.2022.03.103
Tian, Z. W., Ma, W., Yang, Q. C., and Duan, F. (2021). Application status and challenges of machine vision in plant factory-A review. Inf. Process. Agric. 9 (2), 195–211. doi:10.1016/j.inpa.2021.06.003
Wang, S., Liu, J., Li, J., Xu, L., Xu, G., Jiang, Y., et al. (2020). Environmental magnetic properties used to assess sediment sources and transport patterns in the muddy area along the Zhejiang coast, China. Estuar. Coast. Shelf Sci. 245, 106933. doi:10.1016/j.ecss.2020.106933
Wang, Z. G., Tian, Q. Q., and Geng, Z. (2021). Corrosion Investigation and protection measures of power transmission and transformation equipment in sichuan power grid. Corros. Prot. 43 (3), 34–37. doi:10.11973/fsyfh-202103006
Wang, Z. M., Wang, J. S., Yang, K., Wang, L., Su, F., and Chen, X. (2022). Semantic segmentation of high-resolution remote sensing images based on a class feature attention mechanism fused with Deeplabv3+. Comput. Geosciences 158, 104969. doi:10.1016/j.cageo.2021.104969
Xia, X. J., Jin, Y., and Qiao, H. W. (2019). Survey on corrosion of power transmission and transformation equipment. Corros. Sci. Prot. Technol. 31 (2), 121–127. doi:10.11903/1002.6495.2018.211
Yang, W., Li, X. Z., Li, M. Z., and Hao, Z. (20222022). Droplet deposition characteristics detection method based on deep learning. Comput. Electron. Agric., 107038C. doi:10.1016/j.compag.2022.107038
Zhang, D., Peng, F., Qiu, J., Tan, J., Zhang, X., Chen, S., et al. (2021). Regulating corrosion reactions to enhance the anti-corrosion and self-healing abilities of PEO coating on magnesium. Corros. Sci. 192, 109840. doi:10.1016/j.corsci.2021.109840
Zhang, X., Liu, J., Saito, Y., Xu, G., Chen, B., and Chen, L. (2019). Sedimentary signals of the upwelling along the Zhejiang coast, China. Estuar. Coast. Shelf Sci. 232, 106396. doi:10.1016/j.ecss.2019.106396
Zhang, Y. R., Huang, Q. D., and Liu, J. (2016). Novel corrosion protection technology for transmission tower steel components. Therm. Spray. Technol. 8 (1), 1–4.
Keywords: steel corrosion, transmission and transformation equipment, standard corrosion spectrum classification software, image segmentation technology, DeepLabV3+
Citation: Liu S, Hu J, Qian Z, Song X and Fang X (2023) Machine visual technology based steel corrosion evaluation and analysis of power transformation lines: A Zhejiang power grid case study. Front. Energy Res. 10:1014603. doi: 10.3389/fenrg.2022.1014603
Received: 08 August 2022; Accepted: 22 August 2022;
Published: 06 January 2023.
Edited by:
Bo Yang, Kunming University of Science and Technology, ChinaReviewed by:
Ning Yang, South China University of Technology, ChinaXingshuo Li, Nanjing Normal University, China
Copyright © 2023 Liu, Hu, Qian, Song and Fang. This is an open-access article distributed under the terms of the Creative Commons Attribution License (CC BY). The use, distribution or reproduction in other forums is permitted, provided the original author(s) and the copyright owner(s) are credited and that the original publication in this journal is cited, in accordance with accepted academic practice. No use, distribution or reproduction is permitted which does not comply with these terms.
*Correspondence: Xia Fang, ZmFuZ3hpYTA3MDlAMTYzLmNvbQ==