 Xiaojun Liao1,2
 Xiaoru Wang
- 1School of Electrical Engineering, Southwest Jiaotong University, Chengdu, China
- 2Skill Training Center of State Grid Sichuan Electric Power Company, Chengdu, China
The fast and robust identification of fault elements is essential for the security and continuous operation of the power grid. The existing methods might be maloperation for bad data disturbance and require strict and exact synchronization. To address the challenge, this paper uses the conflict graph to propose a new sensitivity graph signal model for the power grid fault diagnosis. Next, a novel graph Fourier transform (GFT)-based method is proposed to diagnose the fault branch. Firstly, the measurement sensitivity graph signals are constructed by the conflict graph model, where the data is from activated recorders and protection devices. Next, the eigenvalue and GFT coefficient are used to extract the frequency characteristics of the signals. The fault branches provide the maximum contribution rate to the high-frequency coefficient of GFT. Then, for each node, the importance degree of the measurement sensitivity conflict graph signal is defined. The high-frequency importance degree-based method is proposed to discriminate the fault branch. Finally, simulations and practical cases verify the correctness and effectiveness of the proposed method. The proposed method owns fast faults diagnosis and good practicability. Additionally, the identification accuracy is high and the method is robust to bad data interference, due to considering measured data from whole activated fault recorders and protection devices.
1 Introduction
Power gird requests accurate and robust fault diagnosis methods to guarantee its safe and stable operation (Sun et al., 2004), (Cui et al., 2016). Fast and clear fault diagnosis methods can help dispatchers make quick decisions to stop the further development of outage events. During faults in grids, the electrical signals change firstly, and then relays will trip the fault lines with changed signals and preset protection methods. The outputs of relays rely on protection methods and switch status (Liu et al., 2019) (Qu et al., 2019). A complex grid has several operation modes. When operation modes do not match the protection methods, the protection devices will refuse operation or mal-operation, as well as the switches. Thus, the switch status- and relay outputs-based fault diagnosis method meets a decrease in accuracy when maloperation or refuse operation occurs (Zhou et al., 2009). Electrical signals-based fault diagnosis methods are not influenced by the relay outputs or switch status.
Electrical signals can be obtained by fault recorders, and fault recorders-based methods attract the attention of researchers. In (Li et al., 2014), advanced technologies were adopted to integrate fault recorder data and proposed an exact fault location by the differential current. The method needs strict and exact synchronization. In (He et al., 2019), wide-area fault recording data and fuzzy C-means clustering are combined to propose a fault diagnosis method. The usage of the wavelet improves the accuracy of the method. However, a long time is required to finish the multiresolution wavelet analysis. The methods require sending complete fault recorder data to the main substation, and the progress needs a long delay to accomplish. Thus, methods without the transmission of complete data can have a fast diagnosis speed.
Reference (Qie et al., 2018) proposes a panoramic wave recording platform that supports power grid fault perception and analysis. It provides a platform to support the faster utilization of start-up measurement information of whole grid fault recorders. In (Lei et al., 2020), through the D5000 integrated platform multi-source information, automatic archiving and manual supplementary recording of power grid fault information are realized. Among the information, the current root-mean-square (RMS) value, voltage RMS value, and start-up value are first sent by message (Asuhaimi et al., 2007) with faster upload speed. Thus, methods using these values can realize a fast fault diagnosis. The RMS-based sorting method suffers low accuracy, due to the influence of bad data.
Fully using redundant data can increase the identification accuracy of the fault branch, and assess protection devices more comprehensively. The idea has been applied in event detection. Authors in (He et al., 2017) first proposed a big data technology-based analysis method for smart grids. They detect abnormals in the grid by the mean spectral radius of the random matrix which is formed by the measurement data from the whole grid. With the spectral theory of multidimensional matrix (STMM) (Ma et al., 2021), proposed a method to detect events in the power system. It can accurately detect the weak event situation in different scale systems. References (He et al., 2017) and (Ma et al., 2021) mainly focused on anomaly detection of power fluctuations and voltage sags. In (Hu et al., 2021), a trinetworks form-based generative adversarial network (tnGAN) is used to handle leak detection problems with incomplete sensor data. It needs many samples to form the model.
The graph-based method can also fully use redundant data. The node importance of the graph can be used in the assessment of node status (Li et al., 2019). However, those methods cannot be directly applied to the power grid diagnosis. The node importance in the grid is mainly classified based on the functions of the nodes in the transmission network, and the importance of nodes of different types is evaluated with different indexes (Xu et al., 2014). Many methods can be used to obtain the graph node importance. The degree-based node importance algorithm is a classical algorithm, mainly considering the influence of node positions. The popular algorithm is the path-based node importance algorithm that mainly considers the importance of inter-node paths, as the PageRank algorithm in web page ranking. The aforementioned methods are not suitable for the analysis of node importance in the fault network. The fault network analysis aims to find the branch that suffers from the most serious impact of faults or the node with the most obvious fault phenomenon.
Graph signal processing (GSP) has developed rapidly in recent years, where the GSP is an extended method of digital signal processing (DSP). GSP can give concepts of classical signal processing to signals associated with the underlying graph structure such as filtering, sampling, and modulation (Ricaud et al., 2019). GSP is widely applied in singularity detection, locating, clustering, and denoising for graph signals, due to the accurate extraction of the graph-spectrum frequency of the graph signal. For the application in power systems, GSP is mainly used in the detection of non-intrusive load (Zhao et al., 2018), false data attacks (Xu, 2020), abnormal data of power grid PMU (Ramakrishna and Scaglione, 2021), etc. However, GSP is rarely used in fault diagnosis, due to no suitable method to form graph signals.
According to literature reviews, fast fault diagnosis methods against disturbance of bad data are necessary to be further researched. In this paper, the proposed method directly uses graph signal without sample supervision, and can more accurately diagnose the fault center through graph frequency analysis. The main contributions are as follows:
(1) The sensitivity conflict graph signals are proposed. The signals include branch current sensitivity and voltage sensitivity. They can be fast calculated with proposed methods and do not need strict time synchronization.
(2) With the proposed signals, the graph Fourier transform can be directly applied to power grid fault diagnosis. The contribution rate in the high frequency of each branch is calculated, and the branch that has the highest contribution is identified as a fault branch. The proposed method is accurate and it is robust to missing data.
The rest of the paper is as follows. Section II presents the method to use the conflict graph to construct the measurement sensitivity graph signal. Section III gives the analysis of Graph Fourier transform for the measurement sensitivity signal, as well as Graph Fourier transform-based fault diagnosis method. The results of the simulation cases and the practical cases are placed in Section IV and Section V, respectively. Section VI concludes the paper.
2 Measurement sensitivity graph signal based on the conflict graph
The graph is represented as G= (V, E, W), where V = {v1, v2, ..., vN} is the set of N nodes in the graph; E = {e1, e2,..., eM} is the set of M branches in the graph; the weight matrix of the graph is W whose element wij represents the weight of the edge between the node i and node j. The wij = 0 indicates that the node i and j are not connected. The graph signal is a set of values defined at the vertex in the graph, represented as the N-dimensional vector f = [f (1), f (2),...,f (i),…,f (N)]T, where f(i) represents the value of the graph signal for node i (He et al., 2017).
2.1 Overview of the conflict graph
Graph signal processing (GSP) is the analysis of the signals defined on the graph nodes. The graph signal based on the main wiring of the grid can analyze the signal change of the bus node and can be used to discriminate the fault of buses. However, for grids, most faults occur at lines or a branch of the transformer. Fault lines can only be discriminated indirectly by the change of the bus node connected to the line. However, with the conflict graph model, the fault branch can be directly discriminated by seeing the branches of the main wiring of the grid as the graph signal nodes.
In the conflict graph, the nodes are transformed by the edges of the original graph G, and the edge represents the connection relationship of each edge in the original graph G. In other words, the conflict graph describes the mutual relationship between the edges in the original graph. Conflict graphs whose edges consist of directly adjacent edges are called 1-hop conflict graphs, line graphs for short. The 2-hop conflict graph is formed by edges within the adjacent 2-hop range (Manoj et al., 2018). Figure 1 shows an original graph, and its 1 hop and 2-hop conflict graph.
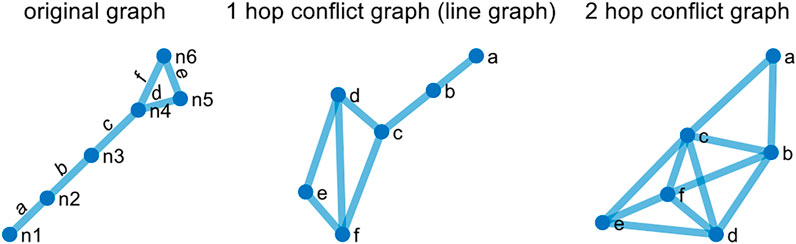
FIGURE 1. Graph of three types.
The 1-hop conflict graph is widely used in graph signal analysis for flows of the road traffic and communication channel (Reisch et al., 2021). The 2-hop conflict graph is mainly used for the interference analysis of the wireless channel signals (Al-Habob et al., 2020). In this paper, the 1-hop conflict graph is mainly adopted to process signals.
2.2 Conflict graph for measurement sensitivity graph signal
The sensitivity of measurement elements includes starting measurement elements and backup protection measurement elements. The starting measurement sensitivity can be obtained easily. Many protection devices can provide measurement data when they are activated, and these data can be applied directly. In the paper, the sensitivity of starting measurement is preferred use in the diagnosis. Backup protection measurement includes elements, for example, stage I, stage II, and stage III. The sensitivity of stage I is difficult to be detected in the non-fault lines, and thus it is rarely adopted. The sensitivity of the stage II and III can be used in the auxiliary criterion.
For faults at transmission lines, the protection devices of the fault line and the adjacent line might be activated by the startling elements. Usually, the startling elements include the phased current mutation-based, zero-sequence current-based, negative sequence current-based, and the bus voltage and its sequence voltage-based starting elements. The measurement sensitivity can be obtained by the measurement data at the time of activation and the threshold of starting elements. The root-mean-square value (RMS) or maximum value within a cycle after activation can be used as the measurement data.
The measurement sensitivity of the current starting element Isen is:
where Iq represents the measurement data of current variation fault components or zero-sequence current; Iset is the threshold.
The measurement sensitivity of the voltage starting element Usen is:
where Uq is the measurement data of voltage variation fault component or zero-sequence voltage; Uset is the threshold.
2.2.1 Original graph signal-based measurement sensitivity
In original graph G, the graph node signal is the voltage starting element measurement sensitivity of the bus node. The edge weight is depicted by the measurement sensitivity of the current starting element in each branch. Starting elements are installed on both sides of the line. To accurately discriminate the fault branch, the maximum value of starting elements between m and n side of line e(i) is taken as the value of the branch measurement sensitivity.
where Isen. m and Isen. n represent the sensitivity of the starting element at m side and n side, respectively.
In the power system, most transmission lines are double-circuit or even multi-circuit. The corresponding graph is called multi-graphs in graph theory, and usually, the multi-graph cannot be directly processed by the graph signal processing algorithms. In this paper, multi-circuit lines are seen as a branch whose weight is the sum of the measurement sensitivity of each circuit. In addition, for the starting element of the backup protection at each winding of the transformer, the weight is set as the sensitivity value of the corresponding current starting element.
2.2.2 Measurement sensitivity conflict graph signal
In the measurement sensitivity conflict graph signal, the node is the set of branches in the original graph G, namely Vt = [Ve1, Ve2, … , Vem]T. As for the N-dimensional vector f, signal f(i) of node i is expressed as follows:
where Isen. e(i) represents the measurement sensitivity of branch current in the original graph. Isen. e(i) can be obtained by Eq. 3.
In the conflict graph, the edges represent the connection relationship between branches in the original graph and the edge of the adjacent 1 or 2-hop ranges. The weight of the edge can be set to 1 or the sensitivity between the edges. Additionally, the node signal in the conflict graph is the branch current. To fully use the voltage measurement sensitivity in the original graph, the edge weight of the conflict graph is set to the average of the voltage measurement sensitivity of the two branches. The fault element can be accurately discriminated, with the different change characteristics of voltage and current. For ease of calculation, the average of the voltage measurement sensitivity of the two bus nodes connected by the branch in the original graph is used as the branch voltage measurement sensitivity, as shown in Eq. 5.
where Usen. m and Usen. n represent the sensitivity of the bus voltage starting element at m and n sides in the original graph, respectively.
In the conflict graph, the edges [e(i)] can be formed by the two edges within 1 or 2-hop ranges of the original graph [e(m) and e(n)]. The weight we(i) of edge e(i) is as follows:
where Ue(m) and Ue(n) represent the voltage measurement sensitivity of the edge e(m) and e(n) in the original graph, respectively.
The measurement sensitivity conflict graph signal constructed by Eqs. 4, 6 reflects the characteristics of the current and voltage measurement sensitivity in the fault region. For each branch measurement sensitivity, compared with directly using the current or voltage, the proposed measurement sensitivity conflict graph signal depicts the change and the fault severity more accurately during faults. Thus, with the proposed conflict graph signal, the faulty type and the fault branch can be detected more accurately.
3 Diagnosis method using graph Fourier transform
Graph Fourier transform is a tool for transforming graph signals with nodes as signals and branches as weights. For Graph Fourier transform on the graph signal, the eigenvector of the Laplace matrix of the graph is used as the transform basis to decompose the graph signal into graph signals with different degrees of smoothness. It is similar to the traditional Fourier transform decomposes the function into different frequencies function. For the sensitivity network, the high sensitivity occurs at the fault area and the low sensitivity occurs at other non-fault areas. Thus, the sensitivity signal in the fault area is non-smooth and has great changes. Applying graph Fourier transform to fault area sensitivity signal, a large component in high graph frequency will be generated. These high-frequency components are mainly generated by the fault center node. Using this feature, the fault center can be accurately diagnosed in the grid. With the proposed measurement sensitivity conflict graph signal and the graph Fourier transform, fault centers have the highest contribution rate to high-frequency components of the graph signals. A new fault diagnosis method is proposed with this character.
3.1 Graph Laplace matrix and its eigenvectors
The graph Laplace matrix L is defined as
where D represents the degree matrix of graph G and it is a diagonal matrix D = diag [d1, d2, … , dN]. The di represents the degree of the ith node and can be calculated by the sum of the weights of the edges associated with node i. W represents the weight matrix of the graph.
The set of eigenvalues of the graph Laplace matrix L is called the Laplace spectrum of the graph. The graph spectrum of graph G with N nodes is shown as follows:
where λ is the eigenvalue, and 0 = λ0 ≤ λ1 ≤ λ2 ≤ ... ≤ λN-1. The corresponding eigenvector for each eigenvalue is
For undirected graphs with edge weight with positive values, eigenvalues and eigenvectors both are real numbers, where the eigenvectors are complete orthogonal (CHUNG, 1997).
3.2 Graph Fourier transform
The graph Fourier transform uses the eigenvector U in Eq. 9 as the transformation basis. The graph Fourier transform (GFT) of the graph signal f is defined as
where
The graph signal changes slowly and is smooth when the GFT coefficient corresponding to the low-frequency eigenvalue is large and the GFT coefficient corresponding to the high-frequency eigenvalue is small. The graph signal changes and fluctuates greatly when the GFT coefficient corresponding to the high-frequency eigenvalue is large (Manoj et al., 2018).
3.3 The characteristic of the graph Fourier transform coefficient of the measurement sensitivity conflict graph
For asymmetric faults, the change of the current and voltage in the fault phase is significantly larger than that of the non-fault phase. Applying the graph Fourier transform on the measurement sensitivity conflict graph, the maximum eigenvalue λn of the fault phase is significantly larger than that of the non-fault phase. The GFT coefficient
To analyze the severity of the grounding fault, the graph Fourier transform is applied in the zero-sequence measurement sensitivity conflict graph. For grounding faults, the maximum eigenvalue and its corresponding GFT coefficient are significantly larger than that of normal operation. Thus the value depicts the severity of the grounding fault.
3.4 Faults diagnosis method based on graph Fourier transform
For the GFT coefficient corresponding to the highest frequency eigenvalues, nodes with large signal changes near the node occupy a large proportion of the coefficient. The nodes with small changes near the node contribute occupy a small proportion of the coefficient (Singh et al., 2017). The GFT coefficient of the largest eigenvalue λN-1 is as follows:
The ratio of GFT coefficient f(i)uN-1(i) to
For each node, the importance degree of the measurement sensitivity conflict graph signal is defined as follows:
The branch node with the largest I(i) is discriminated as the fault branch.
Based on the above analysis, the flow chart of the proposed method is shown in Figure 2. Collecting data from all activated protection devices and fault recorders, the sensitivity Isen and Usen is calculated by Eqs. 1, 2, respectively. Then, the measurement sensitivity conflict graph model is constructed, and the conflict graph signals f and w are calculated by Eqs. 4, 6, respectively. Next, using GFT extract the high-frequency information of the graph signal, and the importance degree I(i) for each node is calculated by Eq. 12. Finally, I(i) with the largest value is identified as the fault branch.
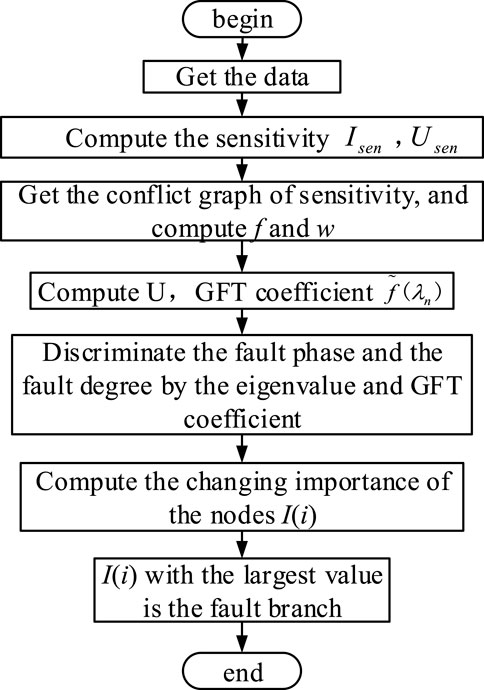
FIGURE 2. Flow chart of the proposed method.
4 Simulation examples and analysis
A typical 10-node network is used to test the effectiveness of the method, and an A-phase ground fault at branch L4 is used to illustrate. The topology and corresponding measurement sensitivity original graph signals are shown in Supplementary Appendix Figure SA1, where the graph signals include signals of each phase and zero-sequence. The measurement sensitivity of the 10-node test model is shown in Supplementary Appendix Table SA1. The 1-hop conflict graph is selected to construct the measurement sensitivity conflict graph signals.
4.1 Simulation results of measurement sensitivity conflict graph
With the original graph signals shown in Supplementary Appendix Figure SA1, the conflict graph can be constructed, where the edge weight we(i) and node signal f(i) of is calculated by Eqs. 4, 6. Figure 3 shows the conflict graph signals of each phase and zero-sequence, where the branch sensitivity weight we(i) is marked in the figure. The thickness of lines and the size of nodes are proportional to the corresponding sensitivity. From Figure 3, the number of starting branches for fault phase A is the most, with eight branches. The number of the starting branches for non-fault phases B and C is only three branches, respectively, where the value of sensitivity is low. The fluctuation of signals for non-fault phases is smooth. For zero-sequence measurement elements, the number of starting branches is only five branches, due to zero sequence shunt and some transformers without grounding.
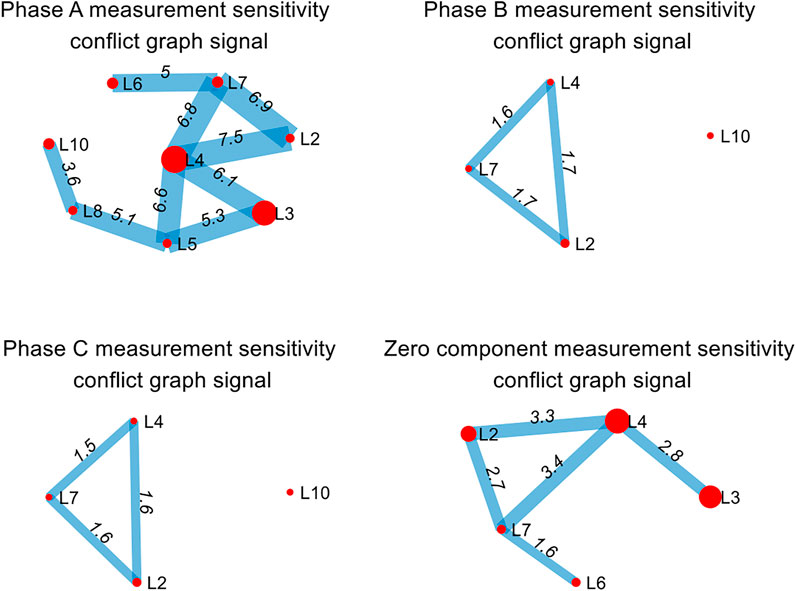
FIGURE 3. Measurement sensitivity conflict graph signal for each phase and zero-sequence.
4.2 Simulation results of coefficient of graph Fourier transform
With Eq. 10, Figure 4 shows the eigenvalue and GFT coefficient of the 1-hop conflict graph signal in Figure 3. From Figure 4, the maximum eigenvalues of fault phases (A-phase) and zero-sequence are 35 and 13, respectively, while the maximum eigenvalues of non-fault phases do not exceed 5. The GFT coefficients of the maximum eigenvalues for the fault phase and zero-sequence are 7.5 and 5, respectively, indicating that the high-frequency components and fluctuations of the corresponding graph signal are large. However, the GFT coefficient of the maximum eigenvalue for the non-fault phase does not exceed 1, indicating that the high-frequency component is low and the fluctuation is small. The A phase is discriminated as a fault by the proposed method.
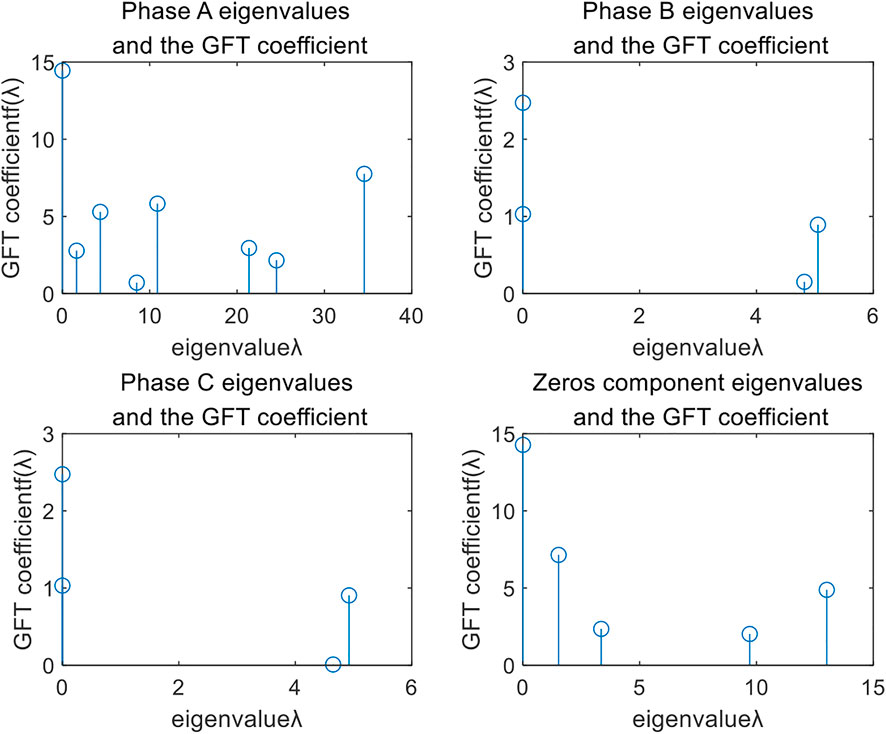
FIGURE 4. Eigenvalues and GFT coefficients for each phase and zero-sequence.
4.3 Discrimination results based on the conflict graph
With Eq. 12, the importance degree of the faulty phase and zero-sequence can be obtained for the branch corresponding to each node in the measurement sensitivity conflict graph. Figure 5 shows the diagnosis results of the proposed method and the results of the existing graph node importance degree-based algorithm. For the convenience of comparison, each algorithm adopts the normalization process compared with its maximum value.
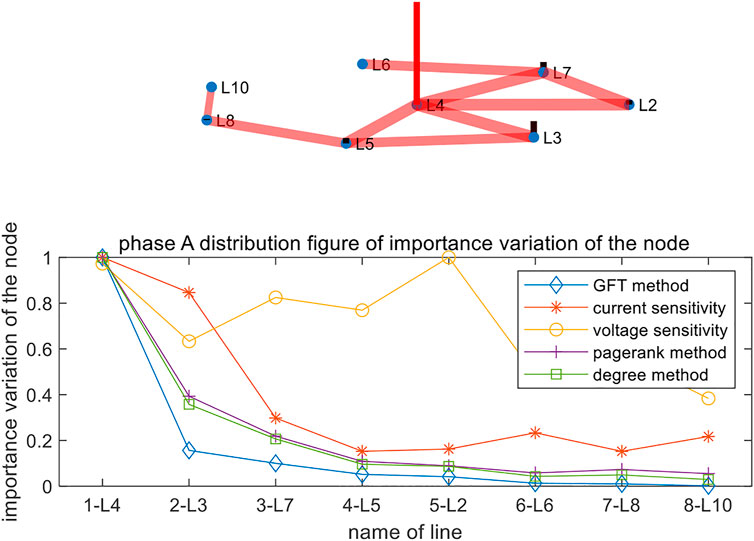
FIGURE 5. Simulation results of each line in the A-phase.
From Figure 5, the current sensitivity of L3 and L4 is few different, leading to difficulty to discriminate the fault branch. A similar circumstance occurs at the voltage sensitivity of L4 and L2. For the degree-based algorithm and PageRank algorithm, the largest importance ratio of the non-fault line L3 to the fault line L4 is around 0.4. For the proposed method based on GFT coefficient importance, the importance ratio of L3 to L4 is only 0.16. Compared with the other mentioned algorithms, the proposed importance degree of the conflict graph signal has the most significant difference among the fault branch and non-fault branches. Thus, the selectivity of the proposed method is better than that of the other typical algorithms.
The simulation results of the zero-sequence are shown in Figure 6. From Figure 6, the current sensitivity of L3 and L4 is few different, leading to difficulty to discriminate the fault branch. A similar circumstance occurs at the voltage sensitivity of L7 and L2. With the degree-based method and PageRank algorithm, the importance ratio of L3 to the fault line L4 is 0.36. For the proposed method based on the importance degree of the conflict graph signal, the importance ratio of L3 to L4 is 0.25, which has a more significant difference than that of other typical algorithms.
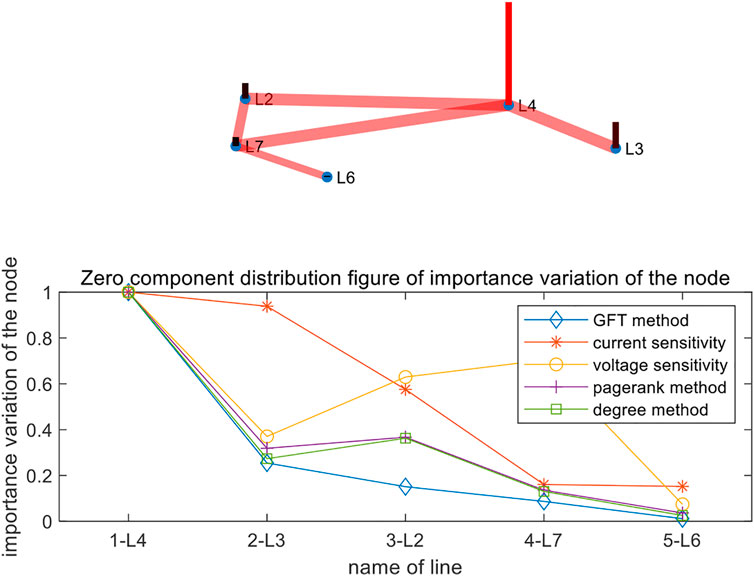
FIGURE 6. Simulation results of zero-sequence.
4.4 Fault diagnosis using the 2-hop conflict diagram
The accuracy of fault discrimination can be further improved with the 2-hop conflict graph and Figure 7 shows results with the 2-hop conflict graph. Compared with the ratio of L3 to L4 in the 1-hop conflict graph, the corresponding importance ratio in Figure 7 reduces from 0.16 to 0.09. The degree-based method and Pagerank algorithm can not work in the 2-hop conflict graph.
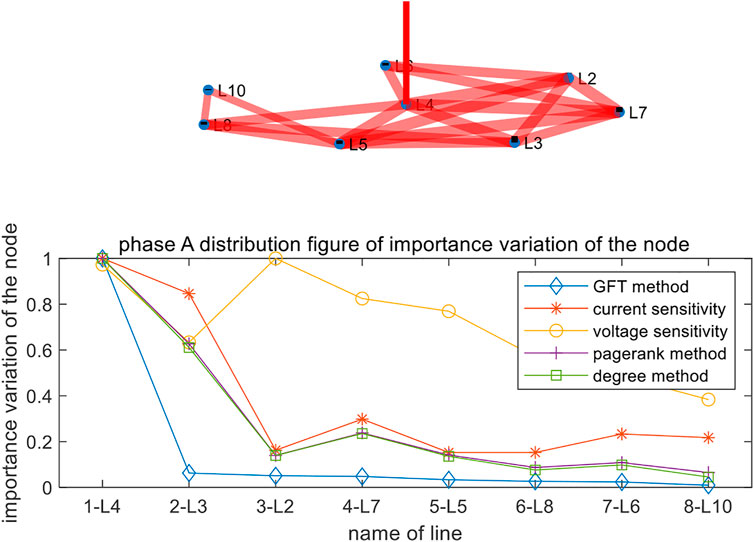
FIGURE 7. Simulation results of 2-hop conflict graph.
Figure 8 shows results of zero-sequence with the 2-hop conflict graph. The importance ratio of L3 to L4 reduces from 0.25 of that in the 1-hop conflict graph to 0.18.
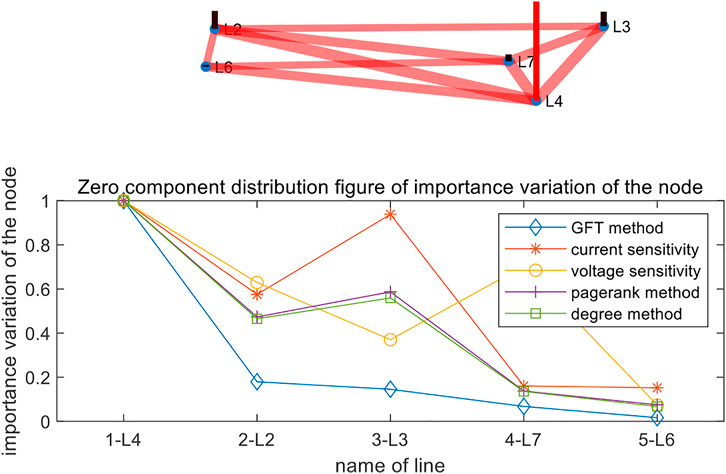
FIGURE 8. Simulation results of 2-hop conflict graph for the zero-sequence fault element.
To simplify the calculation, the 1-hop conflict graph can first be used to discriminate the fault branch in practice. For some special cases, when the difference in the 1-hop conflict graph is not significant, the 2-hop conflict graph can be adopted to improve the selectivity and accuracy of fault discrimination.
5 Simulation results of the actual power grid
In this section, the actual wave recording data is used to verify the effectiveness. The data is from an actual 500 kV power grid which includes a complex ring network and many branches. Operation modes of the complex grid are variable. In the variable scenario, the protection devices are possible to refuse operation or maloperation. Diagnosis methods using the switch and analog signals from protection devices might not obtain accurate results (Zhou et al., 2009). The proposed sensitivity graph signals consider each branch’s sensitivity. The proposed method can obtain an accurate result in the complex grid when missing a part of the data.
At present, the fault information management system of the grid has not yet realized the active upload of the action information of the starting element. Extra settings or improved equipment need to be done to achieve the function. Firstly, for an actual fault, the fault recorder information that has been activated at the time of the fault is called by the management system. Then, the fault starting value is obtained by the management system and parameters of network topology are obtained by the dispatching automation system. The topology of the grid is shown in Supplementary Appendix Figure SA2. It is a complex grid that includes 16 nodes and 20 branches. Based on the threshold setting principle of each producer, the original signal graph of the measurement sensitivity of the starting element is obtained. The measurement sensitivity of the 500 kV grid is shown in Supplementary Appendix Table SA2. The B-phase ground faults occur at branch L1 between N1 and N5, close to the N1 side. The original fault signal graphs of each phase and zero-sequence are shown in Supplementary Appendix Figure SA3.
5.1 Construction of measurement sensitivity conflict graph
Figure 9 shows the 1-hop conflict graph signals of measurement sensitivity for each phase and zero-sequence. C-phase has only two non-adjacent starting branches, and thus the 1-hop conflict graph cannot be formed. From Figure 9, the sensitivity conflict graph of the B-phase (fault phase) and zero-sequence changes greatly. However, for the sensitivity conflict graph for the non-fault phase (A-phase), the change is smooth. The zero-sequence fluctuates greatly, due to more grounding branches in the 500 kV system.
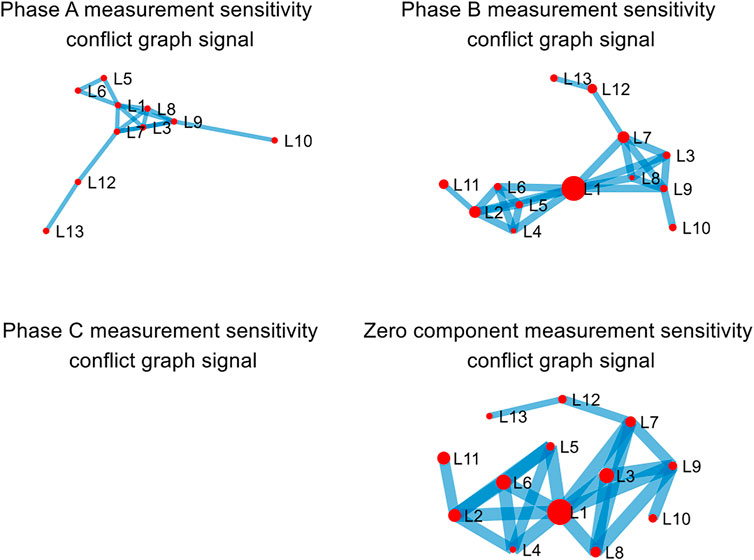
FIGURE 9. Conflict graph signal of measurement sensitivity for each phase-separation and zero-sequence.
5.2 Coefficients of graph Fourier transform
For each phase and zero-sequence, the eigenvalue and its coefficient (GFT coefficient) of the 1-hop complicit graphs are shown in Figure 10. From Figure 10, the maximum eigenvalues of the fault phase (B-phase) and zero-sequence are 150 and 80, respectively, while the maximum eigenvalues of the non-fault phase do not exceed 5. For the fault phase and the zero-sequence, the GFT coefficient of the maximum eigenvalue exceeds 40, close to the zero-frequency component. It is much larger than components of the other frequency range, which indicates that the high-frequency component of the graph signal is large and the fluctuation of the graph signal is great. However, for the non-fault phase, the maximum eigenvalue of the GFT coefficient does not exceed 1, far below the zero-frequency component. It indicates that the high-frequency component is very low and the fluctuation of the graph signal is very small. Based on the analysis, the fault phase can be discriminated as B-phase, and the fault is relatively serious.
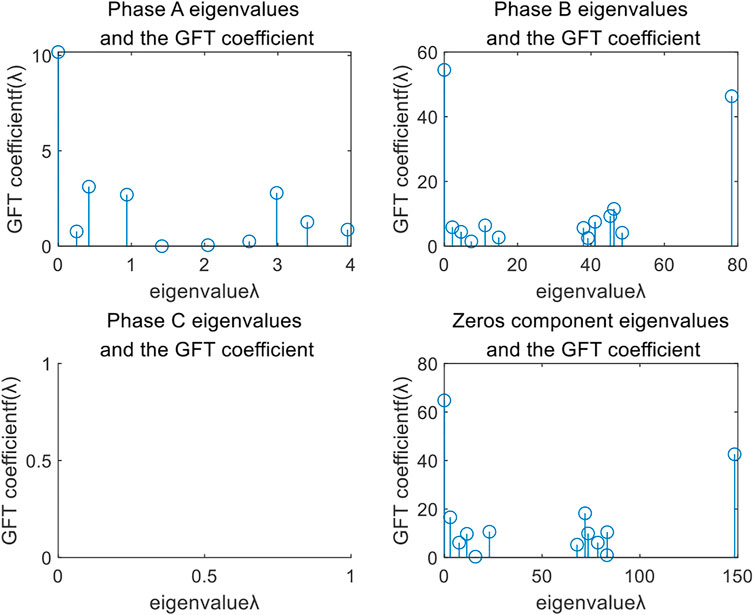
FIGURE 10. Eigenvalues and GFT coefficient of each phase and zero-sequence.
5.3 Simulation results based on the conflict graph
The simulation results of fault phase and zero-sequence are shown in Figure 11. From Figure 11, for the proposed GFT coefficient importance degree-based method, the largest importance ratio of the non-fault branch to fault branch L1 is about 0.05, which is significantly less than the ratio (0.25) of other typical algorithms. The fault branch can be easily discriminated by the significant difference.
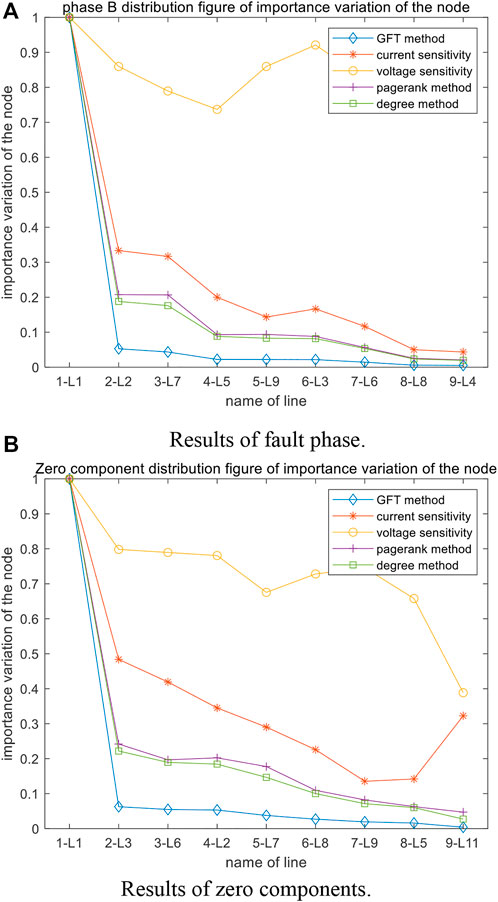
FIGURE 11. Simulation results of fault phase and zero-sequence.(A) Results of fault phase.(B) Results of zero components.
5.4 Fault tolerance test
The proposed fault diagnosis method is based on the change characteristics of the whole network graph signal, and the network changes of measurement sensitivity decrease from the fault center branch to the surrounding. Thus the fault branch can be accurately discriminated, even if the current and voltage of the fault branch are collected incorrectly or cannot be uploaded. Assuming that the fault branch takes the average level of the maximum non-fault branches, the proposed method is still effective. Figure 12 shows the simulation results.
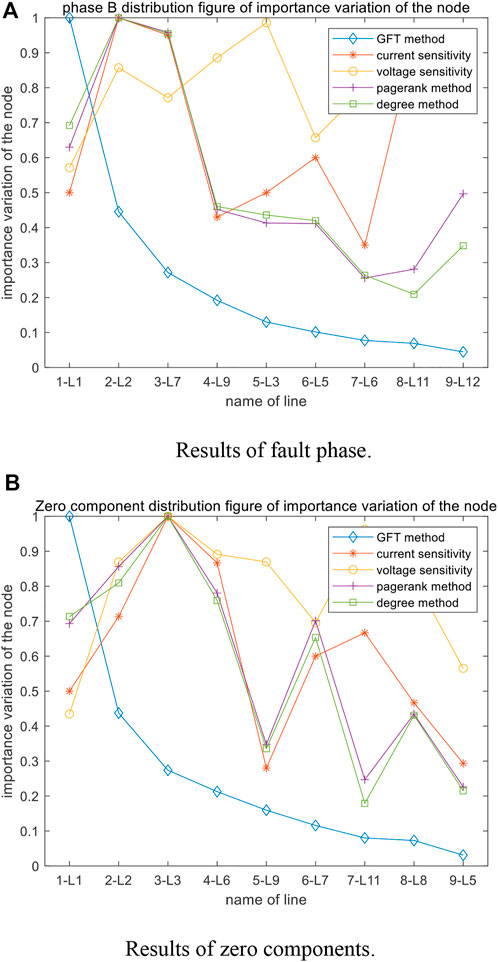
FIGURE 12. Simulation results of the fault tolerance test.(A) Results of fault phase.(B) Results of zero components.
From Figure 12, the current and voltage at the fault branch L1 are only about 50% of the maximum non-fault branches. The degree-based method and PageRank importance algorithm cannot identify the fault branch correctly, and the B-phase of branch L2 is misidentified, and the corresponding result in the zero-sequence is branch L3. However, with the proposed GFT coefficient importance degree-based method, the ratio of the L2 is 0.5 lower than that of fault branch L1, and the branch L1 can be correctly identified as the fault branch. For performance in fault tolerance, the proposed method is significantly better than other typical algorithms. The method is robust to bad data interference.
6 Conclusion
This paper proposes a fault diagnosis method using the graph Fourier transform (GFT) coefficient of measurement sensitivity graph signals. The measurement sensitivity graph signals in the conflict graph are formed by the fault recorders and measurement data of the protection devices. Next, for the signals, the eigenvalue of the GFT and GFT coefficient are used to form the importance degree. The importance degree-based method is proposed to identify the fault branch and fault type. Simulations and actual cases have verified the effectiveness of the method, and the main conclusions are as follows.
(1) With the proposed sensitivity graph signals, the GFT can be applied in the fault diagnosis, and the proposed method can accurately discriminate the fault center by GFT.
(2) The proposed method is robust and reliable when bad data interference or data missing occurs, due to the full use of measurement data from all activated devices. For a 500 kV actual complex grid, the proposed method can diagnose faults accurately.
(3) Compared to the degree-based method and page rank importance algorithm, the proposed method performs better in accuracy and reliability.
In the future, the characteristic of the GFT eigenvalue and GFT coefficient will be studied at different voltage levels, to improve the practicability of the method in power grids with different voltage levels. Secondly, with the application of the time-synchronous online monitoring technology based on the unified information model (Zheng et al., 2020), graph signals of waveform change can be constructed to accurately analyze and identify the dynamic change of the fault. Finally, data mining and its analysis can be achieved by other advanced techniques of graph signal process, such as graph filtering to detect abnormality of measurement components.
Data availability statement
The original contributions presented in the study are included in the article/Supplementary Material, further inquiries can be directed to the corresponding author.
Author contributions
XL: Analysis, modeling, method, verification, and writing. SY: Advising, writing, and editing. LZ: Simulation model and methodology. XF: Simulation model and conceptualization. XW: Advising, supervision, writing-reviewing.
Conflict of interest
Authors XL, LZ and XF were employed by Skill Training Center of State Grid Sichuan Electric Power Company. The remaining authors declare that the research was conducted in the absence of any commercial or financial relationships that could be construed as a potential conflict of interest.
Publisher’s note
All claims expressed in this article are solely those of the authors and do not necessarily represent those of their affiliated organizations, or those of the publisher, the editors and the reviewers. Any product that may be evaluated in this article, or claim that may be made by its manufacturer, is not guaranteed or endorsed by the publisher.
Supplementary material
The Supplementary Material for this article can be found online at: https://www.frontiersin.org/articles/10.3389/fenrg.2022.1020687/full#supplementary-material
References
Al-Habob, A., Dobre, O., Armada, A., and Muhaidat, S. (2020). Task scheduling for mobile edge computing using genetic algorithm and conflict graphs. IEEE Trans. Veh. Technol. 69 (8), 8805–8819. doi:10.1109/TVT.2020.2995146
Asuhaimi, A., Zin, M., and Abdul, K. S. P. (2007). The utilization of digital fault recorders in protection system Analysis on tenaga nasional berhad transmission system. IEEE Trans. Power Deliv. 22 (4), 2040–2046. doi:10.1109/TPWRD.2007.905456
Chung, F. R. K. (1997). Spectral graph theory. Providence, R.I, USA: Published for the Conference Board of the mathematical sciences by the American Mathematical Society.
Cui, Y., Shi, J., and Wang, Z. (2016). Power system fault reasoning and diagnosis based on the improved temporal constraint network. IEEE Trans. Power Deliv. 31 (3), 946–954. doi:10.1109/TPWRD.2015.2409376
He, J., Che, R., Meng, Q., and Zhang, H. (2019). Fault diagnosis method of power grid based on wide-area recorder data and fuzzy C-means clustering. Electr. Power Autom. Equip. 39 (6), 179–184. doi:10.16081/j.issn.1006-6047.2019.06.026
He, X., Ai, Q., Qiu, C., Huang, W., Piao, L., and Liu, H. (2017). A big data architecture design for smart grids based on random matrix theory. IEEE Trans. Smart Grid 8 (2), 1–686. doi:10.1109/TSG.2015.2445828
Hu, X., Zhang, H., Dazhong Ma, D., and Wang, R. (2021). A tnGAN-based leak detection method for pipeline network considering incomplete sensor data. IEEE Trans. Instrum. Meas. 70, 1–10. doi:10.1109/TIM.2020.3045843
Lei, M., Chen, Yi., Liu, F., He, M., and Fan, L. (2020). D5000 relay protection equipment online monitoring and analysis application improvement. Power Grid Technol. 44 (03), 1197–1202. doi:10.13335/j.1000-3673.pst.2018.2552
Li, J., Huang, H., and &Shu, Q. (2019). Evaluation of the importance degree of power communication network nodes under the dependent network theory. Power Syst. Prot. Control 47 (11), 143–150. doi:10.19783/j.cnki.pspc.180921
Li, N., Liang, J., Li, L., and Lin, X. (2014). Fault diagnosis system based on wide-area fault wave recording information at dispatching centre. Automation Electr. Power Syst. 38 (16), 100–104. doi:10.7500/AEPS20140112002
Liu, J., Zhang, K., Gao, L., and Huang, S. (2019). Based on relay protection information and improved spectral clustering analysis. Power Syst. Prot. control 47 (14), 37–43. doi:10.7667/PSPC20191405
Ma, D., Hu, X., Zhang, H., Sun, Q., and Xie, X. (2021). A hierarchical event detection method based on spectral theory of multidimensional matrix for power system. IEEE Trans. Syst. Man. Cybern. Syst. 51 (4), 2173–2186. doi:10.1109/TSMC.2019.2931316
Manoj, B., Chakraborty, A., and Rahul, S. (2018). Complex networks-A networking and signal processing perspective. Beijing, China: China Machine Press.
Qie, Z., Cui, X., Li, W., and Liu, F. (2018). Research on a fault sensing and analysis supporting platform for power grid. Electr. Power 51 (12), 88–94. doi:10.11930/j.iisn.1004-9649.201801118
Qu, Z., Gao, L., Kang, B., and Shi, G. (2019). Full-information fault diagnosis model of power system based on multi-source data. Power Syst. Prot. control 47 (22), 59–66. doi:10.19783/j.cnki.pspc.181579
Ramakrishna, R., and Scaglione, A. (2021). Grid-graph signal processing (Grid-GSP): A graph signal processing framework for the power grid. IEEE Trans. Signal Process. 69, 2725–2739. doi:10.1109/TSP.2021.3075145
Reisch, J., Großmann, P., Pöhle, D., and Kliewer, N. (2021). Conflict resolving-A local search algorithm for solving large scale conflict graphs in freight railway timetabling. Eur. J. Operational Res. 293 (3), 1143–1154. doi:10.1016/j.ejor.2021.01.006
Ricaud, B., Borgnat, P., Tremblay, N., Gonçalves, P., and Vandergheynst, P. (2019). Fourier could Be A data scientist: From graph fourier transform to signal processing on graphs. Comptes Rendus Phys. 20 (5), 474–488. doi:10.1016/j.crhy.2019.08.003
Sandryhaila, A., and Moura, J. (2014). Discrete signal processing on graphs: Frequency analysis. IEEE Trans. Signal Process. 62 (12), 3042–3054. doi:10.1109/TSP.2014.2321121
Singh, R., Chakraborty, A., and Manoj, B. (2017). GFT centrality: A new node importance measure for complex networks. Phys. A Stat. Mech. its Appl. 487, 185–195. doi:10.1016/j.physa.2017.06.018
Sun, J., Qin, S., and Song, Y. (2004). Fault diagnosis of electric power systems based on fuzzy petri nets. IEEE Trans. Power Syst. 19 (4), 2053–2059. doi:10.1109/TPWRS.2004.836256
Xu, L., Liu, J., Liu, Y., Liu, Y., Gou, J., and Bazargan, M. (2014). Classification and comprehensive assessment of node importance. Proc. CSEE 34 (10), 1609–1617. doi:10.13334/j.0258-8013.pcsee.2014.10.012
Xu, Y. (2020). A review of cyber security risks of power systems: From static to dynamic false data attacks. Prot. Control Mod. Power Syst. 5 (3), 19–201. doi:10.1186/s41601-020-00164-w
Zhao, B., He, K., Stankovic, L., and Stankovic, V. (2018). Improving event-based non-intrusive load monitoring using graph signal processing. IEEE Access 6, 53944–53959. doi:10.1109/access.2018.2871343
Zheng, M., Peng, Z., Bu, J., Zhang, Q., and &Zhou, Q. (2020). Time-synchronous online monitoring technology based on a unified information model. Power Syst. Prot. control 48 (15), 149–155. doi:10.19783/j.cnki.pspc.191072
Keywords: measurement element, sensitivity, conflict graph, graph fourier transform, fault diagnosis
Citation: Liao X, Yu S, Zhang L, Feng X and Wang X (2023) A novel fault diagnosis method for power grid based on graph Fourier transform. Front. Energy Res. 10:1020687. doi: 10.3389/fenrg.2022.1020687
Received: 16 August 2022; Accepted: 31 October 2022;
Published: 13 January 2023.
Edited by:
Zaibin Jiao, Xi’an Jiaotong University, ChinaCopyright © 2023 Liao, Yu, Zhang, Feng and Wang. This is an open-access article distributed under the terms of the Creative Commons Attribution License (CC BY). The use, distribution or reproduction in other forums is permitted, provided the original author(s) and the copyright owner(s) are credited and that the original publication in this journal is cited, in accordance with accepted academic practice. No use, distribution or reproduction is permitted which does not comply with these terms.
*Correspondence: Xiaoru Wang, eHJ3YW5nQGhvbWUuc3dqdHUuZWR1LmNu