- College of Electrical Engineering and Automation, Shandong University of Science and Technology, Qingdao, China
Inherent dynamic constraints of distributed generations (DGs) and the correlation between injected variables bring great challenges to distribution network operation. In order to improve the degree of coupling and interconnection coordination between different energy devices, improve the ability of the distribution network to cope with the uncertainty of DGs, achieve low-carbon operation, and improve the environmental friendliness of distribution network operation, this article proposes a robust optimization approach involving risk assessment. The semi-invariant method and scene clustering are used to deal with the uncertainty of DGs and load, thus formulating a robust optimization model for distribution network distribution based on risk indices. To address the time-varying constraints of energy storage systems (ESSs) and gas turbines, a two-stage box-based decomposition model is established. Dynamic constraints are included in the first stage to constrain the operating state and operating domain of the unit and ESSs. In the second stage, the multi-timescale optimization problem is transformed into multiple single-timescale optimization problems, which are solved by the column and constraint generation (C&CG) algorithm to improve the solution efficiency. The feasibility of the comprehensive optimization model based on dynamic reconfiguration and distributed robust optimization (DRO) is demonstrated with the PG&E 69 bus system.
1 Introduction
With the convening of the world climate conference, low-carbon development has gradually become the mainstream of energy development. Distributed generations (DGs), including photovoltaics (PVs), wind turbine (WT), gas turbines, and so on, characterizing low-carbon operation have received much attention. DGs applied in the distribution system can effectively relieve the pressure on the power supply of thermal power units and reduce the proportion of thermal power generation in the distribution network energy structure, which effectively reduces the carbon dioxide emissions of distribution network operation. DGs have essential importance in the distribution system operations (Wang et al., 2020). Meanwhile, the operation of the distribution network is restricted by the imbalance between the flexibility of the system and the uncertainties and volatility of DGs (Kalantar-Neyestanaki and Cherkaoui, 2021). The current approaches to deal with the uncertainties of DGs include stochastic optimization (Golmohamadi and Keypour, 2018), robust optimization (Zhang et al., 2018; Babaei et al., 2020; Shahbazi et al., 2021), and distributed robust optimization (DRO) (Liu et al., 2020). In comparison, DRO can more accurately and effectively deal with the imbalance problem. Norm-1 and norm-inf (Ji et al., 2022) are introduced in DRO to constrain the confidence interval, which avoids non-deterministic polynomial (NP) problems and improves efficiency. DRO has been applied in practice on uncertain issues including optimal scheduling of AC-DC distribution networks (Gao et al., 2020), integrated energy system scheduling (Zhang et al., 2021a), and energy storage configuration (Zhang et al., 2021b).
The uncertainties of distributed power sources bring great difficulties for the coordinated scheduling of the system and limit the grid-connected capacity of DGs. Therefore, research studies on solving the uncertainty of DGs are important for improving distribution system stability, expanding the scale of grid connection of DGs, reducing carbon dioxide emissions of distribution networks operations, and realizing low-carbon operation. To address these challenges, by combining norm-1 and norm-inf, a data-driven robust optimization model is proposed in Zhang et al., 2021b, which effectively constrains the spatiotemporal correlation of wind power. In Khasanov et al., 2021, a meta-heuristic rider optimization algorithm (ROA) is proposed to achieve optimal allocation of distributed power sources, coping with the challenges brought about by the uncertainties of distributed power sources and effectively improving the computational efficiency. At the same time, the optimal size and installation location of DGs are obtained based on the ROA calculation, which effectively improves the computational efficiency. The comprehensive optimization of the distribution network, which combines the dispatching of the energy storage systems (ESSs) and controllable DGs with distribution network reconfiguration (DNR), has significant potential to improve the system flexibility (Nunna et al., 2020; Baghbanzadeh et al., 2021). To improve the degree of source-grid-load coupling, flexible loads are introduced into the distribution network. A multiple time scale optimization model is proposed in Zhou et al., 2021 to address the uncertainties of flexible load and renewable energy sources (RESs). In Mokaramian et al., 2022, an energy hub (EH) system containing DGs is proposed to enhance system coupling and optimize demand supply, system reliability, and energy management. Meanwhile, the uncertainty model is constructed based on the stochastic optimization method, improving the system reliability. In Song et al., 2021, considering voltage stability constraints, an optimized scheduling framework with multiple timescales is proposed, which achieves the network loss minimization objective and effectively copes with load and RES uncertainties. However, the temporal series coupling constraints between ESSs and DGs easily lead to the model falling into local optimization, which has not been fully solved and has vital research significance.
Optimal distributed generation allocation (ODGA) and network reconfiguration (NR) play a vital role in improving the economy and reliability of the distribution system. The change of distribution network topology can achieve the effect of optimized distribution network operation power flow, which optimizes the system operation mode, reduces distribution network loss, and improves the distribution network operation economy. At the same time, the cost of purchasing electricity from the upper grid is reduced, thus reducing the operating output of thermal power units, which reduces carbon dioxide emissions and improves the environmental friendliness of system operation. In Uniyal and Sarangi, 2021, the optimization of the distribution system is realized by NR and distributed generation control, combined with probabilistic power flow and the adaptive whale optimization algorithm. In Shaheen et al., 2021, to address the challenges of distribution network reconfiguration and cooperative optimization of DGs, a distribution network optimization deployment method based on cyclic strategy and the balanced optimization algorithm is proposed, which effectively improves the quality and reliability of the system power supply. Meanwhile, it reduces power loss of the distribution network and improves economy and environmental friendliness. A DNR method based on the market theory is proposed. Considering the marginal price of DG buses, the optimal configuration with the network with minimum power loss is calculated by the solution method combining the fireworks algorithm and iterative game algorithm, which improves the power quality and the economy and environmental friendliness of distribution network operation (Azad-Farsani et al., 2021). In Alam and Arefifar, 2021, the uncertainty of PV and WT is described by probability theory to improve data accuracy. Considering the optimal operating cost of the system, a heuristic-based particle swarm optimization algorithm is used to calculate the optimal configuration of ESSs and optimal distribution network topology, improving distribution system operation stability and environmental friendliness.
Research studies of risk assessment of the system are important in response to the key issues caused by DGs. Stochastic power flow is an important approach for the risk assessment of distribution systems. It is calculated based on an analytical approach (Chen et al., 2021) and simulation approach (Gallego et al., 2021). The simulation approach performs a large number of power flows on the basis of enough sampling statistics, and the number of samplings is a critical factor affecting the error of the calculation result. The process of the simulation approach is too complicated to inefficient (Xiong et al., 2019). The analytical approach focuses on estimating the moments and probability density functions of the output variables, which effectively improve the operational efficiency of the distribution system, but the adjustment of parameters during analytical approach calculation is more difficult. In addition, the analytical approach cannot take into account the correlation of the DGs, and the accuracy of the risk assessment results is low (Da Silva and de Castro, 2018). In You et al., 2021, to eliminate the impact brought by wind power volatility and unexpected scenarios on the system, a wind power uncertainty set considering network accident scenarios is formulated, and then an emergency constrained optimal power flow model considering system risk is established. In Gruosso et al., 2019, a simulation framework relying on the generalized polynomial chaos algorithm is established, which evaluates the sensitivity of variables to potential changes in power demand. In Yang et al., 2020, combining a flexibility analysis framework and sample weighted averages, the risks from expected operating costs and uncertainty are treated approximately by conditional value-at-risk. In Xiao et al., 2021, a risk assessment model and risk aversion approach based on point estimation are proposed to address the uncertainty of RES, which effectively improves the calculation efficiency and enhances risk control capabilities. However, the impacts of the correlation between the injected variables on the operation of the system are not considered.
In this article, a comprehensive optimization model based on a box decomposition algorithm and system risk indicators is developed. The typical scenarios are obtained considering the correlation between input variables. For the most extreme scenarios, the probability distribution is determined by combining the scenario analysis method and robust optimization. In the absence of probability distribution in extreme scenarios, norm-1 and norm-inf constraints are introduced to constrain scene probability distribution within confidence intervals, and a two-stage distribution robust optimization model based on a box decomposition algorithm is established that transforms the dynamic coupling constraints into single-period optimization constraints, improving the efficiency of handling dynamic constraints. Considering the correlation between DGs and load, a dynamic reconfiguration model based on the risk indicators is proposed, which is solved using the particle swarm optimization (PSO) algorithm based on heuristic rules, and the column and constraint generation (C&CG) algorithm is applied to solve the distribution robust optimization model. The robustness and feasibility of the model are verified by the PG&E 69 system.
Based on the historical research studies, the main contribution of this work is summarized below.
1) An improved scenario analysis method is proposed to deal with the DG uncertainty problem. An improved K-means clustering algorithm, considering the correlation between data, obtains typical scenes. Both norm-1 and norm-inf are introduced to constrain probability confidence intervals of the scenario distribution and search the probability distribution of extreme scenarios, therein improving the robustness of the obtained typical scenarios.
2) The box decomposition algorithm is applied to solve the distribution robust optimization problem, and the model is transformed into a two-stage optimization model to effectively handle the dynamic constraints, that is,. ESSs and gas turbines, while decomposing the multi-timescale problem into multiple single-timescale problems to significantly improve the solution efficiency.
3) An improved risk assessment method is proposed combining an improved semi-invariant method and clustering method. The risk indicators of the system are obtained, which consider the correlation between DGs and load. High volatility power sources, that is, wind power, are treated separately, resulting in a significant improvement in the accuracy and reliability of calculation.
The rest of this article is organized as follows: Section 2 introduces the risk indicators calculation method based on the improved semi-invariant method and clustering techniques. Section 3 gives the mathematical model. Section 4 presents the solution ideas of the model. Section 5 develops the feasibility analysis and verification of the research content of this article by means of numerical examples. The conclusions are drawn in Section 6.
2 Risk indicators calculation method
2.1 Scenario analysis
2.1.1 Sampling
The sampling process in the scenario analysis method plays an important role in describing uncertainty problems. Considering the correlation between sample data, the Latin hypercube sampling (LHS) method is used to obtain samples with specific correlation coefficients. The LHS method covers the sample points evenly and comprehensively across the distribution through stratified sampling. The specific steps are as follows.
a) Randomly generate a matrix
b) Get the correlation coefficient matrix
c) Let
d) The elements of each row of
2.1.2 Clustering
After obtaining the sample data of the input variables by the LHS, the typical scenarios are obtained by the improved K-means clustering method. However, the number of clusters affects the performance of the system, that is, the larger the number of clusters, the closer the obtained scenarios will be to the probability distribution of the input variables. However, the efficiency of robust optimization also decreases. Therefore, the optimal number of clusters is determined through the elbow method (Jiang et al., 2021).
The elbow method uses the ratio of average distance
After the optimal number of clusters is determined by the elbow method, the improved K-means algorithm (Wu and Wu, 2020) is used for clustering.
2.2 Risk indicators
2.2.1 Improved probabilistic power flow algorithm
1) Probabilistic power flow
The distribution functions of injected power are assumed to be independent of each other. In stochastic power flow calculation, random variables are represented as
Given
The probability distribution of state increment
2) Semi-invariant method
Semi-invariance is an important numerical characteristic of random variables, which can be obtained by numerical transformation of the characteristic function of the distribution function. However, the process of calculating semi-invariance by definition is extremely complex. Therefore, we use the absolute moment and the central moment to get the semi-invariance. The semi-invariance of the state variables X and S can be expressed as
3) Improved probabilistic power flow
Typical scenarios can reflect the correlation between input variables, but due to the fluctuation of the output power of new energy generation devices, that is, wind power generation, it is necessary to determine the appropriate number of typical scenarios according to the fluctuation of input variables that ensure that the typical scenarios accurately reflect the correlation between input variables and improve the calculation efficiency.
The input variables are divided into a group with higher volatility and a group with lower volatility, which are clustered separately. The clustering results of the two groups are recombined to form combined scenarios. Based on LHS and the probability distribution of the combined scenarios, a more accurate representation of the power correlation can be obtained (Zhang et al., 2020a). Then the cumulative distribution function can be obtained.
2.2.2 Risk indicator
1) System over-limit probability
The over-limit probability of node voltage and branch power can be calculated from their corresponding cumulative distribution functions.
2) Severity of over-limit
When
When the branch's active flow exceeds the branch’s capacity upper limit and the probability of exceeding the limit is lower than 0.001%, the risk degree of exceeding the limit of the active power can be expressed as
The voltage and active power risk indicators of loss of load are respectively expressed as
The system risk indicator is defined as
3 Comprehensive optimization model of active distribution networks
To achieve distribution network operation optimization and improve the flexibility of active distribution networks, ESSs and controllable DGs are widely used in active distribution networks. However, inherent dynamic constraints of ESSs and DGs with time coupling increase the complexity of the optimization model, resulting in a lower efficiency of the model solution. Therefore, the box decomposition algorithm (Cho et al., 2019) has been developed.
To deal with the dynamic constraints, variables are decomposed into two categories. Then, a two-level model is established: the continuous variables, that is, power output of DGs, micro gas turbines, energy storage, and other components, are the first category of variables. The discrete variables related to network topology are the second category of variables. Based on the box decomposition algorithm, the first class of variables is solved in two stages: in the first stage, dynamic constraints are incorporated to constrain the operating domains of micro gas turbines and ESSs at each period; then the operating states and operating domains of the units at each period and the single-period operating domains of ESSs are obtained. In the second stage, the multi-period dynamic optimization problem is decomposed into multiple single-period optimization problems to obtain the first class of variables. Then, dynamic reconfiguration based on the PSO algorithm is carried out to obtain the second class of variables.
3.1 Distributional robust optimization model
The distribution robust optimization model describes the probability distribution with the set of distributions and searches for the optimal solution that can meet the requirements of worst probability distribution in all cases of the required distribution. The distributional robust optimization model is
where
The difficulties of the distributional robust optimization method in model transformation and solution are obvious, which are aggravated by considering dynamic constraints with temporal coupling, so the box decomposition algorithm is introduced to improve the efficiency of the model solution.
3.2 Distributional robust optimization model based on the box decomposition algorithm
3.2.1 First stage
The objective function is
In Equation 18, the first term represents the start-up cost of gas turbines. The second term represents the constant term of the operating cost.
The constraints in the first stage are expressed as follows.
1) Units’ output power constraints
2) Units’ ramp rate constraints
3) Units’ minimum continuous operating time constraints
4) ESS charging and discharging state constraints
5) ESS operation domain boundary constraints
6) ESS capacity constraints
3.2.2 Second stage
The objective function includes gas turbine operating cost, ESS degradation cost, power loss cost, wind and solar abandonment cost, and power purchase cost from the main grid.
Equation 30 includes five parts: gas turbine operation cost, energy storage aging cost, network loss cost, cost of wind and light abandonment, and power purchase cost of the main network.
The relevant constraints are as follows.
(1) System operating constraints
2) DG operating constraints
3)Gas turbine operating and ESS operating constraints
The compact form of the optimization model is
Equation 53 represents all the constraints related to the variables in the first stage; (54) represents the constraints, which couple the first-stage variables and second-stage variables; (55) represents the second-order cone relaxation constraints; (56) represents the related constraints of the second-stage variables.
Due to the uncertainty of DG output and the imperfection of historical data, the scenario probability distribution is biased, so a robust optimization approach is introduced to constrain the scenario probability distribution. K original scenarios are obtained by LHS; then
where
where
3.3 Dynamic reconfiguration model
Due to the constraints of the actual grid operation, it is difficult for dynamic reconfiguration to achieve the goal of the economic optimality and the minimum number of network topology reconfigurations simultaneously. By means of an improved hierarchical clustering algorithm with the temporal constraints, the operation states of the distribution network throughout the day are clustered into several states. Based on the information obtained from clustering, the dynamic reconfiguration problem is transformed into multiple single-period static reconfiguration problems.
3.3.1 Improved hierarchical clustering with temporal constraints
The improved hierarchical clustering with temporal constraints is based on the coalescing hierarchical clustering method, considering both temporal constraints and distribution network reconstruction number constraints, specifying that only two adjacent time periods can be coalesced, and based on the number of reconfigurations allowed under given conditions enumerating to obtain the best time-sharing scheme (Zhang et al., 2020b). The clustering model is
3.3.2 Reconfiguration model
Based on risk indicators, the objective function of distribution network dynamic reconfiguration is
The power balance, node voltage, branch power flow constraints, and radial structural constraints on the distribution network should be satisfied.
Comprehensive optimization of the distribution network is realized by solving the aforementioned distribution robust optimization model and dynamic reconfiguration model.
4 Solution methodology
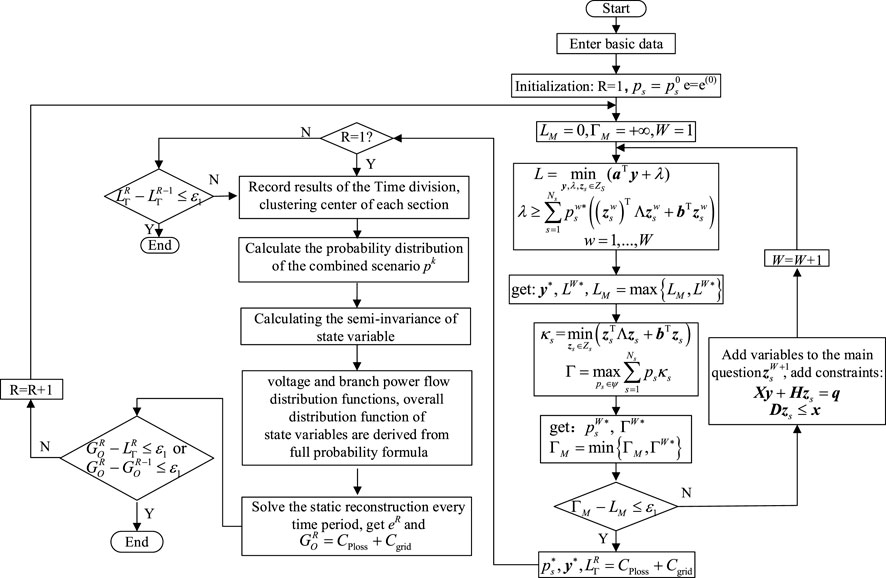
The comprehensive optimization model proposed in this article is a multi-layer, multi-stage model, including a dynamic robust optimization and a dynamic reconfiguration. The dynamic reconfiguration model is solved using the PSO algorithm. The dynamic robust optimization model is decomposed into a master problem and a subproblem and solved iteratively using the C&CG algorithm. The two-layer model is solved iteratively over time periods until the system optimal economy is met; then the final optimization results are obtained.
4.1 Main problem
Based on the known probability distribution p of each scenario, the main problem aims to find the optimal solution which has the minimum operation cost, which can be expressed as
The variable
4.2 Subproblem
The subproblem is the double-layer structure of max-min, which can be expressed as
Under the condition that the variable
In conclusion, (Eq. 57) is transformed into a mixed integer linear programming problem. After probability
4.3 Model solution steps
In order to efficiently, accurately, and reliably solve the model, PSO and C&CG are combined to achieve the results. The solution flowchart is shown in Figure 1. We solve for typical scenario N and scenario probability distribution
5 Case studies
The PG&E 69 system is used to test the validity of the proposed model. The rated voltage of the system is 12.66 kV, and the base power is set to 10 MW. The parameters of DGs and gas turbine cost are given in Table 1 and Table 2, respectively. Taking the cost of network loss, wind curtailment, and light curtailment as 50$/MWh, the ESS charge–discharge aging cost is 0.6$/MW.
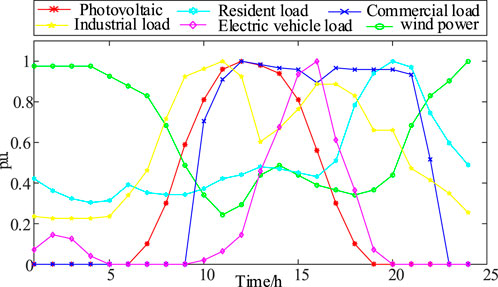
Figure 2 describes the curves of predicted power including residential load, industrial load, commercial load, and distributed power sources.
5.1 Analysis of the improved probabilistic power flow algorithm
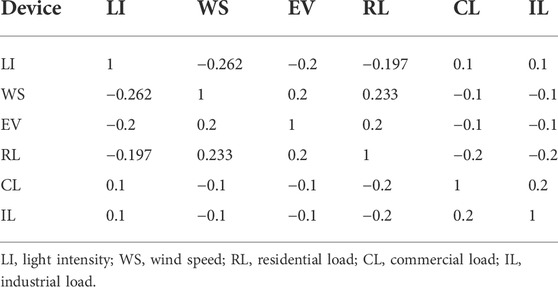
Table 3 reveals the correlation coefficient between DGs and load.
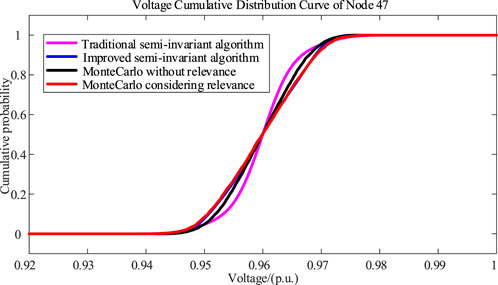
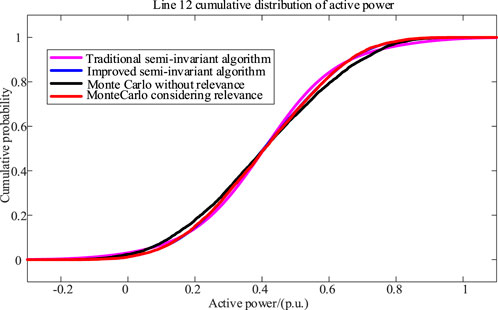
This section compares the proposed probability power flow algorithm with the Monte Carlo method (MC) and traditional semi-invariant algorithm and intends to carry out a comparative analysis from aspects of calculation error and calculation efficiency to illustrate the superiority of this proposed power flow algorithm. Based on the elbow method, it can be determined that the ideal number of clusters is 8. Based on LHS, 6000 clusters of correlated data
Scenario I: Calculate probability flow for data
Scenario II: Calculate probability flow for data
Scenario III: The traditional semi-invariant algorithm is used to calculate probability power flow.
Scenario IV: The improved semi-invariant algorithm is used to calculate probabilistic power flow.
As described in Figure 3, the probability curves of the four scenarios intersect at a voltage of 0.96 p.u., which is the expected voltage of node 47. In Figure 4, the expected value of the active power of line 12 is about 0.42 p.u. It can be concluded if the correlation between DGs and load has a significant influence on the MC simulation results. Since the traditional semi-invariant method cannot take into account the correlation between variables, the calculation result has a large error compared with the MC method. In addition, in the case of large fluctuations in the variables, the error caused by linearization is also obvious. It can be observed that the results of the improved semi-invariant method are basically consistent with that of the MC method considering correlation, indicating that the error caused by large fluctuation of variables can be reduced by the improved semi-invariant method.
As shown in Table 4, due to the large number of samples, the computational efficiency of the MC method is the lowest. The traditional semi-invariant algorithm has the shortest running time because it only calculates power flow once. The execution time of the improved semi-invariant algorithm is longer than that of the traditional semi-invariant algorithm because it performs the multi-scenario calculation, but it is still much lower than the MC method. It can be seen that the improved semi-invariant algorithm significantly improves the computational efficiency while ensuring high computational accuracy.
5.2 Risk indicators analysis
To analyze the impact of load and DG uncertainty on distribution system operation security, the risk indicators under different scenarios are calculated separately. The upper and lower limits of bus voltage are set to 1.05 and 0.95 p.u., respectively. At t = 14 s, electric vehicles (EVs), PV power stations, WT, micro gas turbines, and ESSs are added to the distribution network in sequence. The output powers of ESSs and gas turbines are at their expected values. The results are indicated in Table 5.
It can be known by analyzing the data in Table 5 that connecting EV to the system will reduce the node voltage, which will increase the risk of loss of load caused by the voltage exceeding the limit. DGs increase the bus voltage level, resulting in a significant drop in the risk indicators caused by voltage over-limit. For uncertain factors with small fluctuations such as EV and PV, their impact on RV can be ignored. DGs such as WT characterized by large fluctuations will increase the probability of exceeding the limit of branch power and increase the risk indicator RS. Integration of ESS can effectively alleviate the impact of wind power fluctuations.
5.3 Optimization results
1) Influence of ESS and micro gas turbines.
Three different cases are studied.
Case 1. Only wind power and PVs are integrated.
Case 2. On the basis of Case 1, ESSs are integrated.
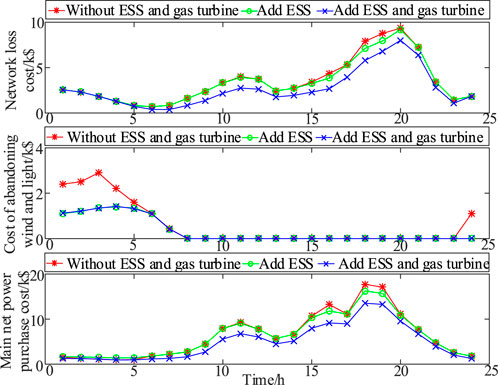
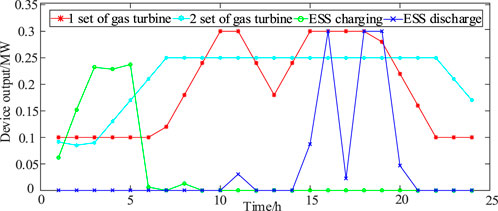
Case 3. On the basis of Case 2, micro gas turbines are integrated.The optimization results in each case are described in Figure 5. It is known that after ESSs are integrated, the cost of wind and light abandonment is effectively reduced.Moreover, ESSs can also reduce the network loss cost and the cost of purchasing electricity from the main grid. Compared with Case 2, the cost of abandoning wind and light in Case 3 is basically the same when micro gas turbines are integrated. Nevertheless, the network loss and the cost of purchasing electricity from the main grid are reduced to a large extent, which improves the economy of the system. The output powers of ESSs and micro gas turbines in Case 3 are described in Figure 6.Comparing Figure 5 and Figure 6, it can be known that in 1–6 h, the ESSs are in a charging state, and the absorbed power corresponds to the discarded wind power. The bidirectional power flow characteristics of the ESSs can effectively alleviate wind and light abandonment. However, limited by the capacity of the ESS devices, the charging power of ESS decreases gradually in 5–6 h, which leads to the optimization effect of cost generated by abandoned wind and light that is not obvious. Compared with Figure 2, when the load is light and the cost of purchasing electricity from the main grid is low, ESSs work in the charging state to absorb the excess power. During the period of heavy load, the input power from the main grid is relatively large, and ESSs are in the discharge state, which can effectively reduce the network loss and purchase cost caused by excessive load. It can also be observed that the output curve of the micro gas turbines is consistent with the cost curve of purchasing electricity from the main grid. When the system requires more power, the output of the gas turbines increases accordingly, which effectively reduces the cost of purchasing electricity and the power loss of the network.
2) Influence of carbon dioxide emission
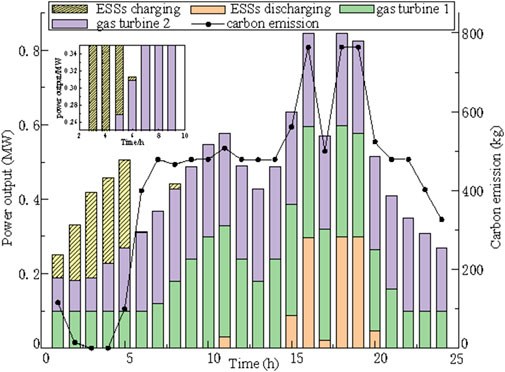
As proved in Figure 7, ESSs improve the ability of the system to accommodate WT and PV, 0–5 h ESS storage surplus wind power, and 6 and 8 h storage surplus PV. The ESS discharge participates in system peaking during the peak periods of the distribution system and reduces the supply pressure of thermal power units, which can reduce 1.0352 tons of carbon dioxide emissions. Gas turbines offer the advantages of low carbon operation, which can meet load demand during distribution network operation and reduce the proportion of thermal power units in the power supply of the distribution network, which can reduce 9.286 tons of carbon dioxide emissions in 24 h. The decision results indicate that the synergistic operation of ESSs and gas turbines can effectively solve the uncertainty of DREs increasing operational flexibility, promote the accommodation of WT and PV, increase grid-connected regulation, and improve peaking capacity. At the same time, relying on gas turbines and ESSs to inject power into the distribution network, it can effectively reduce carbon dioxide emissions and improve the environmental friendliness of distribution network operation.
3) Influence of network topologyTable 6 provides the cost and reliability index before and after NR. After reconfiguration, the network loss has been significantly reduced, and the problem of abandoning wind and light has been effectively avoided. At the same time, the optimization of the network topology can significantly reduce the risk indicators of the system. Meanwhile, with the reduction in the cost of active power purchase, it can be concluded that optimization of distribution network topology can reduce relief of the upper grid to distribution network load demand, so thermal power unit output is reduced, which in turn reduces the system’s CO2 emissions and promotes the development of low-carbon operation of the system.
4) Analysis of optimization results
To verify the feasibility and performance of the proposed model and algorithm, the genetic algorithm (GA) and the classical distribution robust model are selected for comparison. The results are exhibited in Table 7 and Table 8. It can be seen that the genetic algorithm has high-risk indicators and low reliability, and the result is not optimal. The economy of the classical distributional robust optimization model is optimal; however, since the upper limit of branch power is ignored, the risk indicators increase, which can lead to an increase in the probability of system failure.Compared with a genetic algorithm, the proposed model has obvious advantages in economy and reliability. Compared with the classical distributed robust model, the proposed model gives a slightly higher cost, but the reliability advantage is obvious. In addition, the problem of solving mixed variables is avoided, and the operation efficiency is significantly improved.
6 Conclusion
According to the experimental results of the PG&E69 node system, the following conclusions are drawn:
1) The improved probabilistic power flow algorithm can reflect the correlation between DGs and load under regional and environmental influences. At the same time, it can effectively reduce the calculation error and greatly reduce the execution time.
2) The bilateral power flow of the ESSs has a positive effect on improving the penetration of wind power and PV, and the access of the micro gas turbines plays an important role in reducing purchase costs from the main grid and network loss. The optimization of system topology can effectively improve the flexibility of the system and solve the problem of abandoning wind and light, thereby effectively improving the utilization rate of RES, and increasing the grid-connected capacity of wind and PV. Then, carbon dioxide emissions from distribution network operations are effectively reduced and operational environmental friendliness is improved.
3) Compared with the genetic algorithm and robust optimization method, the proposed model can improve the economy of system operation and ensure the reliability of the system. Furthermore, the multi-period dynamic optimization problem is transformed into single-period static optimization problems, and the discrete variables are separated, thereby effectively reducing solution time.
In the future work, we will consider improving the model solving method to optimize the problems with complex modeling and a low efficiency so as to improve the efficiency of system operation and decision-making.
Data availability statement
The original contributions presented in the study are included in the article/Supplementary Materials; further inquiries can be directed to the corresponding author.
Author contributions
All authors listed have made a substantial, direct, and intellectual contribution to the work and approved it for publication.
Funding
This work is supported by the National Natural Science Foundation of China under Grant 52107111 and in part by Shandong Provincial Natural Science Foundation ZR2021QE117.
Conflict of interest
The authors declare that the research was conducted in the absence of any commercial or financial relationships that could be construed as a potential conflict of interest.
Publisher’s note
All claims expressed in this article are solely those of the authors and do not necessarily represent those of their affiliated organizations or those of the publisher, the editors, and the reviewers. Any product that may be evaluated in this article or claim that may be made by its manufacturer is not guaranteed or endorsed by the publisher.
References
Alam, M. S., and Arefifar, S. A. (2021). “Mobile energy storage operation in micro-grid integrated distribution systems considering network reconfiguration,” in 2021 IEEE International Conference on Electro Information Technology (EIT), Mt. Pleasant, MI, USA, 14-15 May 2021, 223–229. doi:10.1109/EIT51626.2021.9491895
Azad-Farsani, E., Sardou, I. G., and Abedini, S. (2021). Distribution network reconfiguration based on LMP at DG connected busses using game theory and self-adaptive FWA. Energy 215, 119146. doi:10.1016/j.energy.2020.119146
Babaei, S., Jiang, R., and Zhao, C. (2020). Distributionally robust distribution network configuration under random contingency. IEEE Trans. Power Syst. 35, 3332–3341. doi:10.1109/tpwrs.2020.2973596
Baghbanzadeh, D., Salehi, J., Gazijahani, F. S., Shafie-khah, M., and Catalão, J. P. (2021). Resilience improvement of multi-microgrid distribution networks using distributed generation. Sustain. Energy Grids Netw. 27, 100503. doi:10.1016/j.segan.2021.100503
Chen, J., Wu, W., and Roald, L. A. (2021). Data-driven piecewise linearization for distribution three-phase stochastic power flow. IEEE Trans. Smart Grid 13, 1035–1048. doi:10.1109/TSG.2021.3137863
Cho, Y., Ishizaki, T., Ramdani, N., and Imura, J. (2019). Box-based temporal decomposition of multi-period economic dispatch for two-stage robust unit commitment. IEEE Trans. Power Syst. 34, 3109–3118. doi:10.1109/TPWRS.2019.2896349
Da Silva, A. M. L., and de Castro, A. M. (2018). Risk assessment in probabilistic load flow via Monte Carlo simulation and cross-entropy method. IEEE Trans. Power Syst. 34, 1193–1202. doi:10.1109/TPWRS.2018.2869769
Gallego, L. A., Franco, J. F., and Cordero, L. G. (2021). A fast-specialized point estimate method for the probabilistic optimal power flow in distribution systems with renewable distributed generation. Int. J. Electr. Power & Energy Syst. 131, 107049. doi:10.1016/j.ijepes.2021.107049
Gao, H., Wang, J., Liu, Y., Wang, L., and Liu, J. (2020). An improved ADMM-based distributed optimal operation model of AC/DC hybrid distribution network considering wind power uncertainties. IEEE Syst. J. 15, 2201–2211. doi:10.1109/JSYST.2020.2994336
Golmohamadi, H., and Keypour, R. (2018). Stochastic optimization for retailers with distributed wind generation considering demand response. J. Mod. Power Syst. Clean. Energy 6, 733–748. doi:10.1007/s40565-017-0368-y
Gruosso, G., Netto, R. S., Daniel, L., and Maffezzoni, P. (2019). Joined probabilistic load flow and sensitivity analysis of distribution networks based on polynomial chaos method. IEEE Trans. Power Syst. 35, 618–627. doi:10.1109/TPWRS.2019.2928674
Ji, H., Chen, S., Yu, H., Li, P., Yan, J., Song, J., et al. (2022). Robust operation for minimizing power consumption of data centers with flexible substation integration. Energy 248, 123599. doi:10.1016/j.energy.2022.123599
Jiang, X., Chen, J., Zhang, W., Wu, Q., Zhang, Y., Liu, J., et al. (2021). Two-step optimal allocation of stationary and mobile energy storage systems in resilient distribution networks. J. Mod. Power Syst. Clean. Energy 9, 788–799. doi:10.35833/MPCE.2020.000910
Kalantar-Neyestanaki, M., and Cherkaoui, R. (2021). Coordinating distributed energy resources and utility-scale battery energy storage system for power flexibility provision under uncertainty. IEEE Trans. Sustain. Energy 12, 1853–1863. doi:10.1109/TSTE.2021.3068630
Khasanov, M., Kamel, S., Rahmann, C., Hasanien, H. M., and Al Durra, A. (2021). Optimal distributed generation and battery energy storage units integration in distribution systems considering power generation uncertainty. IET Generation Trans. Dist. 15, 3400–3422. doi:10.1049/gtd2.12230
Liu, J., Chen, Y., Duan, C., Lin, J., and Lyu, J. (2020). Distributionally robust optimal reactive power dispatch with wasserstein distance in active distribution network. J. Mod. Power Syst. Clean. Energy 8, 426–436. doi:10.35833/MPCE.2019.000057
Mokaramian, E., Shayeghi, H., Sedaghati, F., Safari, A., and Alhelou, H. H. (2022). An optimal energy hub management integrated EVs and RES based on three-stage model considering various uncertainties. IEEE Access 10, 17349–17365. doi:10.1109/ACCESS.2022.3146447
Nunna, H. K., Sesetti, A., Rathore, A. K., and Doolla, S. (2020). Multiagent-based energy trading platform for energy storage systems in distribution systems with interconnected microgrids. IEEE Trans. Ind. Appl. 56, 3207–3217. doi:10.1109/TIA.2020.2979782
Shahbazi, A., Aghaei, J., Pirouzi, S., Shafie-khah, M., and Catalão, J. P. (2021). Hybrid stochastic/robust optimization model for resilient architecture of distribution networks against extreme weather conditions. Int. J. Electr. Power & Energy Syst. 126, 106576. doi:10.1016/j.ijepes.2020.106576
Shaheen, A. M., Elsayed, A. M., El-Sehiemy, R. A., and Abdelaziz, A. Y. (2021). Equilibrium optimization algorithm for network reconfiguration and distributed generation allocation in power systems. Appl. Soft Comput. 98, 106867. doi:10.1016/j.asoc.2020.106867
Song, T., Han, X., and Zhang, B. (2021). Multi-time-scale optimal scheduling in active distribution network with voltage stability constraints. Energies 14, 7107. doi:10.3390/en14217107
Uniyal, A., and Sarangi, S. (2021). Optimal network reconfiguration and DG allocation using adaptive modified whale optimization algorithm considering probabilistic load flow. Electr. Power Syst. Res. 192, 106909. doi:10.1016/j.epsr.2020.106909
Wang, C., Lei, S., Ju, P., Chen, C., Peng, C., Hou, Y., et al. (2020). MDP-based distribution network reconfiguration with renewable distributed generation: Approximate dynamic programming approach. IEEE Trans. Smart Grid 11, 3620–3631. doi:10.1109/TSG.2019.2963696
Wu, Z., and Wu, Z. (2020). An enhanced regularized k-means type clustering algorithm with adaptive weights. IEEE Access 8, 31171–31179. doi:10.1109/ACCESS.2020.2972333
Xiao, H., Pei, W., Deng, W., Ma, T., Zhang, S., Kong, L., et al. (2021). Enhancing risk control ability of distribution network for improved renewable energy integration through flexible DC interconnection. Appl. Energy 284, 116387. doi:10.1016/j.apenergy.2020.116387
Xiong, X., Wu, W., Li, N., Yang, L., Zhang, J., Wei, Z., et al. (2019). Risk-based multi-objective optimization of distributed generation based on GPSO-BFA algorithm. IEEE Access 7, 30563–30572. doi:10.1109/ACCESS.2019.2902886
Yang, X., Xu, C., He, H., Yao, W., Wen, J., Zhang, Y., et al. (2020). Flexibility provisions in active distribution networks with uncertainties. IEEE Trans. Sustain. Energy 12, 1. doi:10.1109/TSTE.2020.3012416
You, L., Ma, H., Saha, T. K., and Liu, G. (2021). Risk-based contingency-constrained optimal power flow with adjustable uncertainty set of wind power. IEEE Trans. Ind. Inf. 18, 996–1008. doi:10.1109/TII.2021.3076801
Zhang, Y., Ai, X., Wen, J., Fang, J., and He, H. (2018). Data-adaptive robust optimization method for the economic dispatch of active distribution networks. IEEE Trans. Smart Grid 10, 3791–3800. doi:10.1109/TSG.2018.2834952
Zhang, Y., Gao, H., Ji, X., Liu, Q., and Yu, Y. (2020a). “Robust integrated optimization of active distribution network based on system risk index,” in 2020 IEEE 3rd Student Conference on Electrical Machines and Systems (SCEMS), Jinan, China, 04-06 December 2020, 48–54. doi:10.1109/SCEMS48876.2020.9352411
Zhang, Y., Ji, X., Xu, J., Yin, Z., Han, X., and Zhang, C. (2020b). “Dynamic reconfiguration of distribution network based on temporal constrained hierarchical clustering and fireworks algorithm,” in 2020 IEEE/IAS Industrial and Commercial Power System Asia (I&CPS Asia), Weihai, China, 13-15 July 2020, 1702–1708. doi:10.1109/ICPSAsia48933.2020.9208388
Zhang, Y., Liu, W., Huang, Z., Zheng, F., Le, J., Zhu, S., et al. (2021a). Distributionally robust coordination optimization scheduling for electricity-gas-transportation coupled system considering multiple uncertainties. Renew. Energy 163, 2037–2052. doi:10.1016/j.renene.2020.10.131
Zhang, Y., Liu, Y., Shu, S., Zheng, F., and Huang, Z. (2021b). A data-driven distributionally robust optimization model for multi-energy coupled system considering the temporal-spatial correlation and distribution uncertainty of renewable energy sources. Energy 216, 119171. doi:10.1016/j.energy.2020.119171
Zhou, B., Xia, J., Yang, D., Li, G., Xiao, J., Cao, J., et al. (2021). Multi-time scale optimal scheduling model for active distribution grid with desalination loads considering uncertainty of demand response. Desalination 517, 115262. doi:10.1016/j.desal.2021.115262
Nomenclature
Sets
Parameters
Variables
A-H ,X, Q Matrix forms corresponding to variables in distributional optimization model constraints
f,q,o,c,d,g Vector forms corresponding to variables in distributional optimization model constraints
Keywords: risk assessment, distributional robust optimization, semi-invariant method, clustering, two-stage box-based decomposition
Citation: Zhang Y, Yang Z, Ji X, Zhang X, Yu Z and Wu F (2022) Robust optimization of the active distribution network involving risk assessment. Front. Energy Res. 10:963576. doi: 10.3389/fenrg.2022.963576
Received: 07 June 2022; Accepted: 27 June 2022;
Published: 04 August 2022.
Edited by:
Jiajia Yang, University of New South Wales, AustraliaReviewed by:
Luhao Wang, University of Jinan, ChinaLili Hao, Nanjing Tech University, China
Jinyu Wang, Xi’an Jiaotong University, China
Copyright © 2022 Zhang, Yang, Ji, Zhang, Yu and Wu. This is an open-access article distributed under the terms of the Creative Commons Attribution License (CC BY). The use, distribution or reproduction in other forums is permitted, provided the original author(s) and the copyright owner(s) are credited and that the original publication in this journal is cited, in accordance with accepted academic practice. No use, distribution or reproduction is permitted which does not comply with these terms.
*Correspondence: Xingquan Ji, xqji@sdust.edu.cn
 Yumin Zhang
 Zizhen Yang
 Xingquan Ji
 Xuan Zhang
 Zihan Yu
 Fucheng Wu