 Caroline Taylor
 Justin Maroccia2
 Kurt A. Rosentrater
- 1EarthShift Global, Kittery, ME, United States
- 2Corn Refiners Association, Washington, DC, United States
- 3Department of Agricultural and Biosystems Engineering, Iowa State University, Ames, IA, United States
High fructose corn syrup (HFCS) 55 (HFCS55) is a sweetener made from corn composed of 55% fructose and a mix of glucose and minor amounts of short chain oligosaccharides. It is widely used in food applications as a sweetener, preservative, flavor enhancer, moisture retainer, and to provide texture. The objective of this study was to assess the cradle-to-gate environmental impacts of average U.S. production of HFCS55. Our assessment was based on confidential primary data supplied by 13 participating facilities, including material and energy inputs and emissions for milling, refining and coproduct drying. We estimated life cycle impacts using the Tool for the Reduction and Assessment of Chemical and Environmental Impacts (TRACI 2.1). Additional impact categories were included for land use (midpoint H), Global Warming Potential (100 years) (GWP), and Cumulative Energy Demand. Environmental hotspots identified in the production of HFCS55 indicated that direct emissions from the conversion process contribute over 50% of the global warming potential, as well as the overwhelming bulk of energy and fuels used in the system, 35%–40% of acidification and ecotoxicity impact potentials and potential respiratory effects caused by particulate matter. Coal and natural gas extraction and combustion accounted for 70%–90% of the global warming impacts for process heat and power, and their extraction also contribute significantly to acidification and ecotoxicity. About 40% of the global warming potential for HFCS55 was generated by fuel used in processing for the aggregated industry average HFCS55. Nearly half of the HFCS55 was produced in facilities that utilize coal in cogeneration of steam and electricity, and that grouping had almost 20% higher impact than the U.S. aggregated. Replacing coal in the industry average with natural gas could lower impact about 20%; for the coal-using cogeneration group, that benefit would be larger. Replacing all coal and natural gas with biogas from process residues potentially could more than halve the global warming potential depending on which grouping a facility was in, although this scenario needs further evaluation. A sensitivity analysis of energy replacement options for HFCS55 showed that transition from coal to natural gas or other energy sources would lower the GWP and other impacts. This assessment was the first study of its kind; further work is needed to explicitly define areas for industry improvement. This study focuses primarily on High Fructose Corn Syrup (HFCS), specifically HFCS55, production. This work addresses that crucial gap by providing the most up-to-date, industry-relevant life cycle assessment (LCA) and associated life cycle inventory available for corn wet milling and HFCS55 and other products. It also provides a life cycle inventory for the production of U.S. corn used for wet milling and refining. Prior to this work, there are no published analyses of the life cycle environmental impacts of HFCS 55 (or associated sweeteners) reflecting industry practice from primary data at industry scale. Indeed, there are very few assessments of the environmental impact of HFCS as a product, industry-scale or otherwise.
Introduction
Corn wet milling and refining–the steeping and grinding of field corn (maize) for fractionation into starch, germ, and fiber and from there to myriad products including sweeteners and starches, oil and germ, protein, fiber and feed–in the United States (U.S.) is a major part of the global supply chain. Its products are found in food, fuels, and materials, and are an essential part of livestock production. The outputs of corn wet milling and refining are also a of particular importance for renewable materials and fuels and the bioeconomy, elements of long term sustainability. Understanding of their environmental impacts is a key component of decisions from material selection to policy design.
Amongst corn wet milling products, sweeteners represent the largest product group, accounting for about 42% of production (starches, ethanol, and other co-products including feeds account for 11%, 2% and 44%, respectively) (Corn Refiners Association, 2019). High Fructose Corn Syrup (HFCS) is a corn-based sweetener comprised of fructose, glucose, and minor amounts of short chain oligosaccharides. More than 70% of the HFCS produced annually is a solution of 55% fructose, HFCS 55 (United States Department of Agriculture, 2022). HFCS 55 is produced in wet milling facilities across the United States (U.S.), heavily concentrated in the primary corn producing sates of the midwestern U.S, using feedstock purchased from corn growers in several U.S. states. It is used in a wide range of food applications as a sweetener, preservative, flavor enhancer, moisture retainer, and to provide texture (Corn Refiners Association, 2017).
Wet milling softens the cell wall, starch, and proteins of a corn (or other cereal) grain by the addition of moisture. This softening facilitates complete dissociation of a cereal grain endosperm cell to release starch granules which can then undergo further processing. The primary unit operations that differentiate wet and dry milling are steeping, deeming, and germ separation. The wet milling process begins when corn is steeped for 28–48 h in water and 0.1%–0.2% sulfur dioxide to aid maceration. Steeping is followed by deeming, where deeming or attrition disc mills ground the corn, which divorces the germ from the remaining grain seamlessly and the germ separator isolates the germ (Rosentrater and Evers, 2018). The starch from wet milling is then refined, undergoing enzymatic saccharification and liquefaction, isomerization, concentration and clean up, yielding a family of sweeteners, of which HFCS is the largest output. The corn wet milling and refining process is highly integrated and yields several products and coproducts, all of which share some portion of the environmental burden.
The environmental impacts of corn wet milling and refining products contribute significantly to the life cycle environmental impacts of a variety of systems of interest for sustainability, particularly bioplastics and corn ethanol, and the food system. While the human health effects of food and food additives have been researched extensively, there is increasing global interest in also understanding the environmental effects of manufacturing these products as a result. Additionally, full product life cycle impacts, especially for GHG emissions, are increasingly needed for voluntary and regulatory uses. As this applies to, for example, reporting of Scope 3 emissions, suppliers and ingredient producers increasingly need this data for customers downstream of them in the supply chain.
To date there has been very little research and published information on the environmental impacts of HFCS and other corn sweeteners, leaving a crucial gap in meeting sustainability reporting and planning goals. At the moment, this lack of data is the biggest issue for the assessment of many biobased chemical platform molecules (Davidson et al., 2021). As others have noted (Ortiz-Reyes and Anex, 2020), the life cycle assessment (LCA) literature is severely lacking in studies specific to major industrial sweetener production. Prior to this work, there are no published analyses of the life cycle environmental impacts of HFCS 55 (or associated sweeteners) reflecting the industry wide product from primary data at industry scale. Indeed, the literature contains very few assessments of the environmental impact of HFCS as a product, industry-scale or otherwise.
Despite its importance for sustainability and the fact that corn wet milling is a component of many LCA studies, public inventory and impact data are lacking. Because the primary focus for corn products has so far been on the fuel pathway, most studies focus on dry milling and/or stop at fermentable sugars (see, e.g., Ortiz-Reyes and Anex, 2020) or leave the refining of starch to sweeteners largely opaque or aggregated (e.g., Wang et al., 2007, and the evolution of those pathways, including Xu et al., 2022). Of those studies that do consider fructose or high fructose sweeteners, the vast majority use library processes (see, e.g., Fabbri et al., 2023; Moreno et al., 2020, and others) which typically reflect older data, not current information.
Unfortunately, there are a limited number of HFCS-specific inventories and analyses that can be used for LCA. They are typically based on process modelling using literature (Eerhart et al., 2012), industry insight analysis linked to technoeconomic models, or implementation of an industry partner’s inventory along with literature data. The latter of these provides the bulk of the background data for studies that neither rely on library processes for fructose and other corn sweeteners nor use glucose as a proxy.
Indeed, inventory data for LCAs of HFCS are so sparse that glucose is frequently employed as a default proxy (Nessi et al., 2022) where HFCS is needed, even when assessing HFCS specifically (Kis et al., 2019). The contributions from the fructose feedstock are non-negligible–e.g., 4%–15% of the GWP for a variety of cakes (Pak et al., 2022) and about 8% for breakfast cereal (Jeswani et al., 2015), of which more than a third of the impact is from the starch-to-sweetener process. Because glucose is produced as in intermediate in corn refining to HFCS, using glucose as proxy leads to underestimating the environmental impacts of products for which it is an input.
Due to the limitations in available inventories and environmental impacts for corn wet milling and refining, the determination of environmental impacts for products in which HFCS55 is an input have needed to rely upon older data, less certain models, and/or been unable to reflect current, industry average HFCS55 for use in their supply chain. As demand for carbon accounting of products expands across many sectors of economies throughout the world, a robust life cycle inventory and assessment of corn sweeteners, particularly HFCS, is needed to support those studies as well as the development of other bio-based products (Fabbri et al., 2023; Flugge et al., 2017; Lee et al., 2021; Moreno et al., 2020).
The primary motivation for this work was to assess the life cycle environmental impacts for industry average HFCS55 as a major ingredient in the food supply chain, and, as part of that process, the wet milling of corn grain to starch and coproducts. It is intended both to provide the corn wet milling industry insight into its life cycle environmental impacts, including identification of environmental hotspots along the supply chain, and to address a crucial gap in data needed for robust LCA of HFCS-based products that hampers assessment of environmental impacts for many food and other products.
This study integrates primary data provided by 13 operating corn wet mill refineries spanning U.S. corn wet milling to build a current industry-level average inventory for corn wet milling and refining. This inventory is used in an ISO-compliant, cradle-to-gate LCA to assess the life cycle environmental impacts associated with corn wet milling and HFCS55 production, from crop production through collection and transport and thence wet milling and refining to sweeteners. In addition to quantifying life cycle environmental impacts for HFCS 55 and the wet milled starch from which it is derived, this study also quantifies life cycle environmental impacts of two additional corn refining products, HFCS42 and high-concentration glucose syrup (DE 95–100), as well as two wet milling coproducts, corn germ and corn gluten meal. It also provides a life cycle inventory for the production of U.S. corn used for wet milling and refining and provides inventories for starch production and refining based on primary data from the wet milling industry.
Understanding the potential environmental impacts of manufacturing HFCS55 will assist corn refiners in identifying targets for advancement, research, and impact mitigation. The insights gained will provide refineries with information that can be used to communicate to food producers and to the public on the relative environmental impacts of HFCS55. This information will also enable wet milling refineries to identify opportunities and needs for environmental stewardship for the sweetener industry and for corn refineries and their operations more specifically. The outcomes of this study can also be used by researchers, policymakers, and LCA practitioners for improved, more robust LCAs of products using inputs from corn wet milling and refining based on current industry-wide practice. The study helps meet the need for a robust life cycle inventory and assessment of corn sweeteners, particularly HFCS, to support the demand for carbon accounting of products expands across sectors and the development of other bio-based products.
Methods
A cradle-to-gate LCA is carried out to assess the environmental impacts for HFCS55 from corn wet milling at the industry level in the U.S. Use and end-of-life stages are not included because of the number of possible products into which HFCS55 is an input.
Goal and scope
The first phase of an LCA is to define the goal and scope of the study. According to ISO 14044, the goal of the study should clearly specify the intended application; reasons for carrying out the study; intended audience; and whether the results are intended to be disclosed to the public. The scope of the study should include a description of the most important aspects of the study including the functional unit, system boundaries, cut-off criteria, allocation, impact assessment method, assumptions, and limitations.
The primary objective of this study was to assess the cradle-to-gate environmental impacts of U.S. average production of HFCS55 by refineries (i.e., at the aggregated level) in the U.S. context. This included several sub-objectives related to HFCS55.
• To compare the life cycle impacts for U.S. production of HFCS55 in the study year (2017) with the results of the 2011 LCA of HFCS55 to identify any improvements in environmental performance;
• To identify environmental hotspots along the HFCS55 supply chain, particularly within the wet milling process, to inform the development of improvement opportunities for corn wet milling producers;
• To use scenario analysis to model environmental improvement opportunities within the wet milling process based on likely opportunities to avenues to decrease impact that were indicated by the hotspot analysis.
Ultimately, the main opportunities for environmental improved identified in the analysis were approaches to reduce energy impacts, including alternative primary fuels, changing heat production technologies, and decreasing heat demand. Thus, scenario analyses were focused on alternative primary fuels, changing heat production technologies, and decreasing energy demand because energy/fuel consumption dominate impacts in almost every category.
A secondary objective of this study was to quantify the life cycle impacts of several other outputs that are derived from the corn wet milling process. These include: HFCS42; Glucose syrup (DE 95–99); Corn germ; and Corn gluten meal.
The intended application of the study was to develop quantitative information to inform corn wet milling manufacturers about where the impacts of producing HFCS55 originate within their production processes, to quantify environmental impact improvements that have resulted from process changes since 2011, to identify future process improvements that could be made, and to quantify how these environmental impacts compare with other sweeteners. In addition, the life cycle impact assessment (LCIA) results for HFCS42, corn germ, corn gluten meal, and glucose syrup (DE 95–100) will be used separately to inform corn wet milling manufacturer’s customers about their cradle-to-gate environmental impacts. Corn wet milling companies intend to use the results to inform internal decision-making, but also intends to make the study results available to customers and the public in the future.
The LCA model and report have been completed according to the ISO 14040 (ISO, 2006a) and 14044 (ISO, 2006b) requirements for a full comparative LCA intended to support comparative assertions.
Corn refiners previously commissioned a comparative LCA of HFCS55 in 2011 which was carried out by researchers at Michigan State University. Although the results of that project are confidential, the data and methods were used to inform the development of the approach to the present study and provided insight on the compilation of an updated Life Cycle Inventory (LCI). When possible, the results of this previous LCA study have been included to provide context on the process improvements the corn refining industry has made since 2011. However, it should be noted that this study and the 2011 study differ in several significant areas, including level of detail, participating facilities, included impact categories, and final product mixes from starch refining, and thus comparisons should be viewed with caution.
Function and functional unit definitions
A functional unit is defined as the quantified performance of a product system for use as a reference unit (ISO, 2006a). This facilitates the determination of reference flows for the system being studied.
HFCS55 can provide many functions in food products; however, its primary function is to provide sweetness. The primary function of the studied system was to produce HFCS55 to be used as a food additive that provides sweetness. During production of HFCS55, the corn wet milling process also produces HFCS42, a precursor to HFCS55, another commonly used food additive. The wet milling process also yields several other products and coproducts for which the proportions of product relative to HFCS55 can vary greatly depending on corn input quality, processing operations and decisions, market conditions, and demand for specific products or coproducts. Of specific interest to this study were glucose syrup (DE 95–99), corn germ, and corn gluten meal, all of which are sold to other producers for incorporation into a range of other products or used as livestock feeds.
The functional unit for the cradle-to-gate analysis of HFCS55 was the provision of a sweetness additive equivalent to 1 kg of table (refined white) sugar. Although there are some compositional differences between HFCS55 and table sugar, such as content of nutrients and micronutrients, this study does not account for these nutritional differences as they are not directly related to the function. Although HFCS55 and table sugar have some compositional differences, these differences do not affect the function of the product, the provision of equivalent sweetness.1 The sweetness of HFCS55 is equivalent to table sugar (Hannover and White, 1993; Hobbs, 2009; Corn Naturally, 2018). As a result, 1 kg of HFCS55 is equivalent to 1 kg of table sugar, and thus the functional unit of 1 kg HFCS55 is used for this study.
The functional units for the non-comparative products, HFCS42, DE95-97, corn gluten meal (CGM) and corn germ, were 1 kg for each product.
The study period was production year 2017, for which corn wet millers provided operational data via detailed survey and workbook. The study region was continental U.S.
System descriptions and system boundaries
System boundaries are established in LCA to include the significant life cycle stages and unit processes, as well as the associated environmental flows in the analysis. This lays the groundwork for a meaningful assessment where all important life cycle stages and the flows associated with each alternative are considered. Carefully defining the system boundaries can also help communicate what processes have been excluded because they were not significant contributors to the life cycle environmental impacts of the studied system.
HFCS55
This study’s focus was on HFCS55, which is produced through the milling and refining of corn, along with a variety of other products, including additional sweeteners and products used as livestock feeds.
Figure 1 represents the general system boundary diagram for production of HFCS55 from corn, as well as for production of HFCS42, glucose syrup, corn germ, and corn gluten meal (product colors were simply to flag separate product sets). The life cycle begins with corn cultivation. Corn is grown across much of the U.S., heavily consolidated in the Midwestern Corn Belt, which supplies most of the corn processed by participants in this study. Following harvest, corn is transported from the various suppliers to a local elevator, and then to the wet milling plants via heavy-duty truck and/or rail. There, the grain undergoes processing to sweeteners and a range of other products.
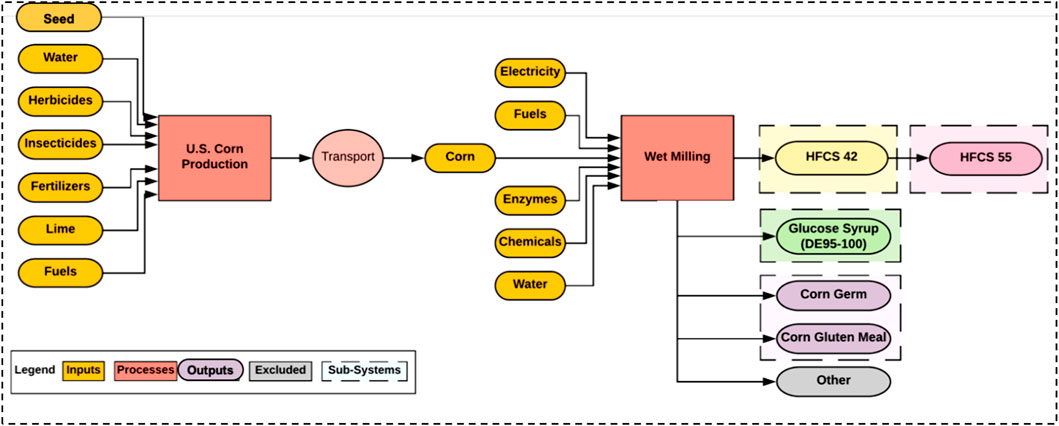
FIGURE 1. System boundary for HFCS5 production (product colors are simply to identify product groups for ease of tracking.
The details of the included life cycle stages described for each below, along with an overview of associated coproducts and their handling as part of the study.
The core process of the HFCS55 life cycle is corn wet milling. This process includes several sub-processes, including starch milling from grain and refining of starch to sweeteners, among others. Some wet milling facilities include on-site oil extraction, but many facilities sell dried corn germ directly to other producers, introducing additional variability important in a system as highly integrated as corn wet milling.
Sweeteners other than HFCS55, HFCS42 and dextrose syrups (DE95-99, often referred to as ‘corn syrups’ or CSU) are also produced from the starch stream, among them, for example, sweeteners like maltose or sorbitol and other sugar alcohols (see the Figure 5 and associated text for descriptions of the range of products and variations represented in the HFCS55 systems included here). The other major coproduct is corn gluten feed. Because the latter often also includes the stillage from ethanol production and because the energy inputs for it were tracked separately, it has been excluded from the system. These are grouped under “Other syrups” in the Figure 5A.
The corn wet milling process is a highly integrated system of several sub-processes, including centralized heat or heat and power production and wastewater treatment (see the more detailed process diagram in Figure 4). The wet milling process can be configured to produce a range of product and coproduct outputs, the mix of which is modifiable depending on market conditions and demand. Participating corn refiners provided operational data via detailed survey and workbook.
For the purposes of this study, the important sub-processes modeled include.
• Milled Starch Production;
• Saccharification/Dextrose Production;
• Glucose Syrups Production;
• HFCS42 Production;
• HFCS42 to HFCS55 Conversion;
• Centralized Heat and Power Production; and
• Wastewater Treatment.
The Milled Starch Production sub-process includes steeping, germ separation, grinding, screening, and fiber/starch/gluten separation, with separate drying of fiber/germ/gluten. The starch milling process is quite consistent across this industry, with some variation among the feed coproduct slate. A portion of the starch slurry from this Starch Milling is sent to the Sweeteners Production subprocess, which includes liquefaction, saccharification, cleanup and separation to produce dextrose syrup of which all or a portion will undergo isomerization and concentration to become fructose syrups, HFCS42 and 55 chief amongst them.
In contrast to starch milling, the process structure for refining varies among corn refineries. This was driven by variation among product slates: not every corn refinery site produces every sweetener product, nor do the sites produce the same products in similar proportions. This contributes to the variability across the industry, and it could be argued that there is not a single, coherent corn refining industry, but many individual operators in the same general collective space. This variability limits the feasibility of creating any type of industry norm or average and makes generalization of the LCA results to the members difficult, as hotspots for one member may not even be part of another’s operations.
Coproduct treatment. Importantly, the corn wet milling system that produces HFCS55 generates multiple products that also exit the system boundary. Several of these were included in the study (HFCS42, DE95-99, corn germ, corn gluten meal). Corn gluten feed, however, is not, due to the common practice of merging stillage and distillation residues for ethanol production with the feed stream. Alcohol production is also not included in the system boundary.
Where possible, system subdivision and assignment of product-specific burdens were utilized in the corn processing system, aided by the relatively high resolution of data collected to create the inventory. For primary sweeteners that could not be segmented consistently, the burdens were shared across the primary products (HFCS55, HFCS42 and DE95-99) from the aggregated process on the basis of mass and the effect of this choice assessed via sensitivity assessment. Where this has not been possible and the resultant product leaves the system independently (namely, fiber and steepwater going to feed; see associated detailed process in Figure 4), allocation on the basis of mass was used, since corn gluten feed was a dominant product with relatively inelastic demand, making displacement inappropriate.
Retention or collection and use of corn stover differs widely even over small areas, and corn was not grown with the primary intention of generating stover. Thus, stover was considered a byproduct for the purposes of this study, in keeping with treatment of residues in the other crops.
Cut-off criteria
For this study, every effort was made to include all the flows associated with the processes studied. However, because of the complexity inherent in highly integrated production systems such as corn wet milling as well as operational and organizational culture differences, we found considerable variability in the completeness of the data provided by producers. This varying completeness manifests itself in mathematical variability in the aggregated modeling data and the results. To fill data gaps and account for variability, extrapolation was made from facilities with more complete data sets to those of similar structure with less complete data sets. During the interpretation phase, a one percent (1%) of environmental relevance criterion, as calculated by the impact assessment method, was used to test the sensitivity of the results to assumptions and data substitutions made.
Excluded processes
Some aspects within the set boundaries of an LCA are typically excluded due to statistical insignificance or irrelevancy to the goal and scope. The following impacts were excluded from this study.
• Human activities (e.g., employee travel to and from work), research and development (i.e., the laboratory and inputs related to the development of the technologies), and services (e.g., the use of purchased marketing, consultancy services, business travelling);
• Infrastructure was not included in the foreground data;
• Ancillary water and fuel use for on-site vehicle washing/rinsing;
• The use phase of the HFCS55 as a food additive was considered beyond the scope of this analysis to consider all potential end uses of HFCS55, and the applications of the product were not material to the objectives of refineries in undertaking this study;
• Metals emissions and soil erosion from the crop production systems because it was the same across the compared systems; and
• The end of life of HFCS55 because it would be equivalent across the compared systems.
Assumptions for the corn sweetener life cycle inventory
Based on data availability and, particularly, heterogeneity among the level of detail supplied for each facility, several assumptions were made about the corn milling systems.
Because corn wet milling is a mature technology and the data showed that starch milling processes at the participating facilities were substantively similar, a level of transferability was assumed in order to fill gaps; e.g., energy use for coproduct drying/handling in starch milling.
All participating facilities indicated no significant changes were made in the 6 months prior to FY 2017. Production and operations data were provided for Fiscal Year production, Apr-2017 to Mar-2018, except for emissions data, which were reported on a calendar year basis. Because all participating facilities indicated no significant changes in the 6 months prior to FY2017 relative to FY2017 operations, the Jan-Mar 2017 reported emissions could be used in place of Jan-Mar 2018.
Facilities supplied information on the states of origin and average distance traveled for their corn supply. Less than a quarter of the facilities were able or willing to provide higher specificity, such as county of origin, which would allow more granular analysis. Delivered corn was assumed to be sufficiently well described by state level practices cataloged by the USDA.
All grid electricity was modeled as coming from a single grid, the Midwest Reliability Organization (MRO).
Co-product allocation
Coproduct allocation was a significant methodological consideration in this study since the highly integrated wet milling process results in several products and coproducts (e.g., corn gluten meal, etc.) in addition to HFCS55, among which the environmental burden must be shared. Outputs of the processing facilities wholly utilized within the system boundary were not coproducts. The primary product system produces multiple sweeteners, in this case, HFCS and other pentoses and hexoses in syrup and dry forms. Other high-volume coproducts or residues are produced as a result of producing sweeteners, referred to here as coproducts. The coproducts fall into three distinct categories. First were those that were deeply entrenched in other products involved in the system. Next were those that were too dominant to be viewed as a displacer (corn gluten feed is already dominant in a relatively inelastic market and is not displacing other feeds). Lastly were sweeteners with processing integrated with the primary sweetener.
Allocation is a calculation step in which the process inputs and environmental burdens of the overall production system are attributed to the primary product and each of the coproducts according to a defined relationship. According to ISO 14044, attempts should be made to avoid allocation of the process inputs by using the system subdivision or system boundary expansion where possible. If allocation cannot be avoided, an allocation method–based on physical causality (mass or energy content, for example) or some other relationship such as economic value–should be used (ISO, 2006b).
Where possible, allocation has been avoided via system subdivision and direct assignment of inventory components to particular products. The process-level primary data for the HFCS55 system supports a modular model with separate units for starch milling; CGM dewatering and drying; germ dewatering and drying; refining starch to sweeteners; steam production or cogeneration; and waste treatment. For refining (production of sweeteners from starch), product revenue and mass shares were used to isolate contributions to the products under study (pre-allocation, in effect) when data was provided.
The highest-impact flow potentially requiring allocation is energy. For corn wet milling, process-level primary data tracking fuels and energy use in the drying of milling coproducts has allowed assignment of the bulk of energy used in the system to specific outputs. As a result, only a relatively small share of input remains to be allocated for starch milling. Where direct assignment of inventory components to particular coproducts was not possible, the system and production of indicated coproduct has been considered with respect to its uses.
This study uses allocation based on physical property (mass) as the primary allocation approach for the remaining products leaving the system boundary where subsystem disaggregation was insufficient to isolate impacts to particular products in the combined system. Energy allocation was applied to cogeneration processes.
To assess the importance of allocation, a sensitivity analysis was conducted where economic allocation was used as an alternative allocation procedure (except in cogeneration, which remained energy allocation). Direct financial data would generally be desirable so that economic allocation could be used to test a market-driven distribution of impact among products at the producer level. However, data for the participating facilities were not available. In place of these data, historical USDA and public market data were used. Market prices for (dominant) products/coproducts were compiled from historical public data.
Impact assessment method
Impact assessment methods are used to convert LCI data (environmental emissions and raw material extractions) into a set of potential environmental impacts. The environmental impact metrics included in the 2011 study included fossil fuel energy consumption, greenhouse gas (GHG) emissions, other air emissions, and water use.
The impact categories from 2011 were included in the present study so that any improvements in environmental performance since that time could be quantified. In addition to these core impacts, the scope of the impact assessment was broadened to include several other metrics that captured other environmental dimensions of the HFCS55 production system. The environmental impact categories for this study are summarized in Table 1.
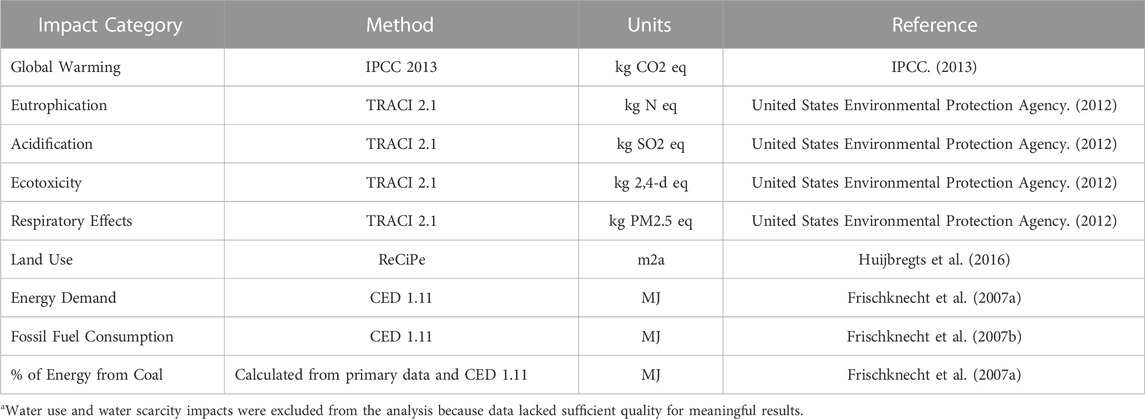
TABLE 1. Selected impact categories and corresponding method and units of measure.
Each impact category was characterized by a unit of measure to which the resource and emission flows were normalized. To aggregate the substances into the impact categories, substances were multiplied by their characterization factors to convert into an equivalent substance (e.g., CO2), and then added together to create a total score for each impact category (e.g., climate change).
Calculations
SimaPro 9.0 was used to model the life cycle activities for HFCS55 production and for calculating the potential life cycle impacts. This software program was used for the calculation of life cycle inventories and impact assessment, contribution analysis, parameterization and related sensitivity analysis and uncertainty analysis.
Limitations
Limitations of the study
Although the results of the previously commissioned comparative LCA of HFCS55 were confidential, the data and methods were used to inform the development of the approach to the present study and any conclusions that could be drawn about evolution of the systems are of interest. However, it should be noted that this study and the 2011 study differ in several significant areas, including level of detail, participating facilities, included impact categories, and final product mixes from starch refining, and, thus, comparisons should be viewed with caution.
The results of this study may not be generalizable across wet milling refineries. The process structure for refining varies among corn refineries, driven by variation among product slates: not every site produces the same products in similar proportions. This variability across the industry limits the feasibility of creating a single consolidated model reflecting of industry norm or average.
Individual corn grower practices vary from the state-level averages. Supply data limited the resolution that could be used for crop production. The state level averages, based primarily on data reported to USDA, provide an aggregate perspective based on county or subcounty data. A detailed inventory for corn production for actual practice associated with delivered and processed corn may provide a different impact than that based on the inventory developed here.
Operator data available for the corn wet milling and refining processes reflected an unexpectedly high degree of heterogeneity and lack of resolution (process granularity), and it was found that prohibitively high effort would be needed to resolve that on existing data (there was some indication that this will improve in the future). Several additional scenario analyses were anticipated at the outset but could not be performed because the available data was not sufficient to complete them (opportunities to decrease use of and/or recover water throughout the process; phosphorous capture and recovery), or because they were outside the system boundary (CO2 capture from fermentation tanks).
Water use data was not sufficient to support evaluation of potential water use impacts. The authors’ experience with industrial systems and discussions with data providers suggest that the issues associated with water use data arise from the relatively minimal cost of water in most regions of the U.S. compared to the final products’ values. Consequently, water volume and quality are often measured with a lower degree of precision and/or completeness than other LCI inventory inputs. In this study, both availability and quality of data for water flows in the corn milling system were variable and weak and mass balances for water could not be closed despite significant effort to fill the data gaps. Interpolating water use based on other data was attempted, but results were found to be contradictory. This was a significant and important gap that should be addressed in future studies. Since water flows could not be resolved to a level of quality sufficient to support analysis, this study lacks potential impacts for a category of interest.
Limitations of the LCA method
The ability of LCA to consider the entire life cycle of a product makes it an attractive tool for the assessment of potential environmental impacts. Nevertheless, similar to other environmental management analysis tools, LCA has several limitations. These can be related to data quality and unavailability of potentially relevant data.
Furthermore, LCA is based on a linear extrapolation of emissions with the assumption that all the emissions contribute to an environmental effect. This is contrary to threshold-driven environmental and toxicological mechanisms. Thus, while the linear extrapolation may be a reasonable approach for more global and regional impact categories such as Global Warming Potential (GWP) and Acidification, it may not accurately represent the human- and eco-toxicity related impacts.
It should be kept in mind that even if a study has been critically reviewed, the impact assessment results are relative expressions and do not predict impacts on category endpoints (e.g., wildlife species), exceedance of thresholds, or risks.
Life cycle inventory
The second phase of an LCA is to collect LCI data. LCI data contains the details of the resources flowing into a process and the emissions flowing from a process to air, soil, and water. Due to the extent and complexity of the LCI for the HFCS system, the raw LCI data and supporting calculations for the primary systems and data were not provided in this document.
LCI data overview
As is typical in LCA, the data used in this study was a combination of primary and secondary data. In instances where primary data was not available to characterize the production systems, secondary data from published and peer-reviewed sources were used. Secondary data was primarily drawn from the Ecoinvent 3.5 database and from the Agrifootprint 4.0 (Blonk Consultants, 2017) database for U.S. crop production.
Grid electricity was modeled using modified Ecoinvent 3.5 processes for the subgrid appropriate to the production region: Midwest (MRO) for corn. Initial results showed the GWP and eutrophication resulting from electricity to be much higher than anticipated when using the regionally appropriate background electricity grid data from Ecoinvent. When the contribution analysis was examined in greater detail, the electricity grid data in Ecoinvent were found to have several inconsistencies with the current U.S. grid. Most significantly, the fraction of electricity from coal was attributed almost entirely to brown coal (lignite), which accounts for a much smaller share of commercial generation of electricity in the U.S. than in Europe. The Ecoinvent grid electricity mixtures were corrected and updated to match biannual generator survey data from the National Energy Technology Laboratory (https://www.epa.gov/egrid). These data were used to compute the corrected electricity generation mix by fuel type or energy source for each North American Electric Reliability Council Region. All library and foreground processes were modified to use these updated grid processes. Tap water was regionalized for the U.S. from the Canadian tap water processes, using the corrected grid electricity processes. This revised grid mix and tap water were used for further analyses for corn sources.
As mentioned previously, mass allocation was the preferred method used in this study. Economic allocation is an alternative, and its effect upon impacts was explored in the sensitivity analysis. Data were thus provided at the level monitored and allocation applied as necessary after attribution and system subdivision. Both mass and economic allocation have been used for these sweeteners in past work. As part of the sensitivity and uncertainty analysis, impact potentials have been computed using both allocation methods for corn sweeteners.
Crop production
Corn cultivation in the U.S. is widespread. It is an intensive process involving tillage, application of fertilizers, pesticides, sometimes irrigation, and mechanical crop management practices reliant on fossil fuel consumption for power. Corn yield, a key performance characteristic, varies from seed to seed, field to field, region to region, and year to year. Fuel consumption, water consumption, and agrochemical input usages also vary regionally and temporally.
The LCI data reflects production practices for the specific states supplying participating refinery producers. This data included.
• Corn yield;
• Fertilizer use;
• Pesticides use (herbicide, insecticide, fungicide);
• Lime use;
• Water use;
• Fuel consumption;
• Electricity consumption; and
• On-field emissions and runoff from fertilizer, lime, and pesticide applications.
Primary data for the creation of the corn production was drawn heavily from the U.S. Department of Agricultural statistics service (United States Department of Agriculture, 2019). Crop yields and production, cropped area, applied irrigation, macronutrient use, and pesticide applications data were drawnfrom United States Department of Agriculture. (2018) primary data compiled from U.S. corn growers, accessed via queries of the National Agricultural Statistics Service “Quick Stats” portal (USDA NASS). Production data was aggregated at regional and state levels as needed to accommodate the study’s industry scale perspective. Temporal averages spanning three to 5 years, including the study year (2017), were calculated for each parameter at the state level. Parameter variability was captured statistically using average annualized data sets and the spatial variation of the data.
The USDA data was supplemented with state and regional information from agricultural extension offices, industry guidance and published literature, etc. This is described below. In particular, energy use data is not tabulated in the USDA NASS database. Energy consumption values for corn cropping were obtained from enterprise crop budgets published for each state by the local agricultural extension offices. For corn, values from prior analyses of agricultural energy use based on USDA data were also used, as described below. The mix of fertilizers used were calculated from USDA national level data and used for corn crops. The inventory reflects corn grown on a corn-corn-soy rotation. Corn cultivation data was taken primarily from USDA data compiled annually and as part of the semi-annual Agricultural Census. This provides county-level data on production, loss, nutrient and agrochemical application, water use and irrigation. This data has been retrieved at the state level and statistical variation over the 3–5 years around the study period used to determine uncertainty parameters. USDA productivity estimates reflect storage and transport and associated losses.
Weighted averages were calculated from these temporal and geographic averages to create an aggregated a supply (consumption) weighted average based on quantity and source location. Figure 2 shows the distribution of corn supply included in the study. Both to preserve confidentiality and because many facilities were not able to provide county or sub-county sourcing information, the state-level LCI data for corn production provided the highest possible resolution inventory data. The inventory is given in the supplemental materials, section S2.
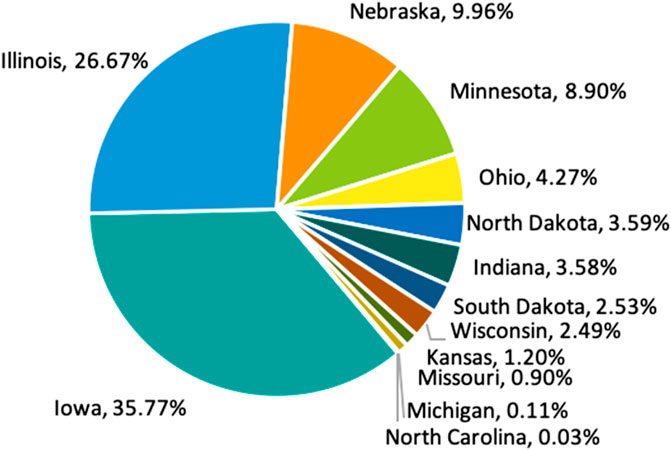
FIGURE 2. Corn supply by state in the current study based on primary data.
To ensure consistent treatment of corn crops, field emissions were calculated specific to the study. Emissions were calculated endogenously during modelling, rather than calculating the field emissions exogenously (i.e., fixed values), so that field emissions and runoff would respond to changes in, for example, field applications of fertilizers during sensitivity analysis.
Field emissions resulting from agricultural practice and related parameters are summarized in Table 2. Nitrogenous and carbon emissions were calculated during modeling based on the IPCC National Inventory Report (NIR) guidance (IPCC, 2006; IPCC, 2019), with Tier 2 parameters where possible, matching growing region and conditions. Phosphorus and nitrate emissions to groundwater were calculated based on Ortiz-Reyes and Anex (2018) and with values updated from Ortiz-Reyes and Anex, (2020). Simple partitioning was used for pesticide fate after application based on Margni et al. (2002), which differs from the Ecoinvent assumption of complete emission of pesticides to soils. As part of the modeling in SimaPro, the NIR equations and the crop-specific parameters were used for calculated parameters in the crop production unit processes and calculated as part of each life cycle assessment calculation. Other than nitrogen and soil carbon emissions because of management practice, additional soil emissions were not included, because - especially for metals and erosion - they were generally calculated for the average land and practice and did not add to the analysis. Carbon sequestration was not incorporated beyond that reflected by the IPCC NIR calculations for soil carbon changes.
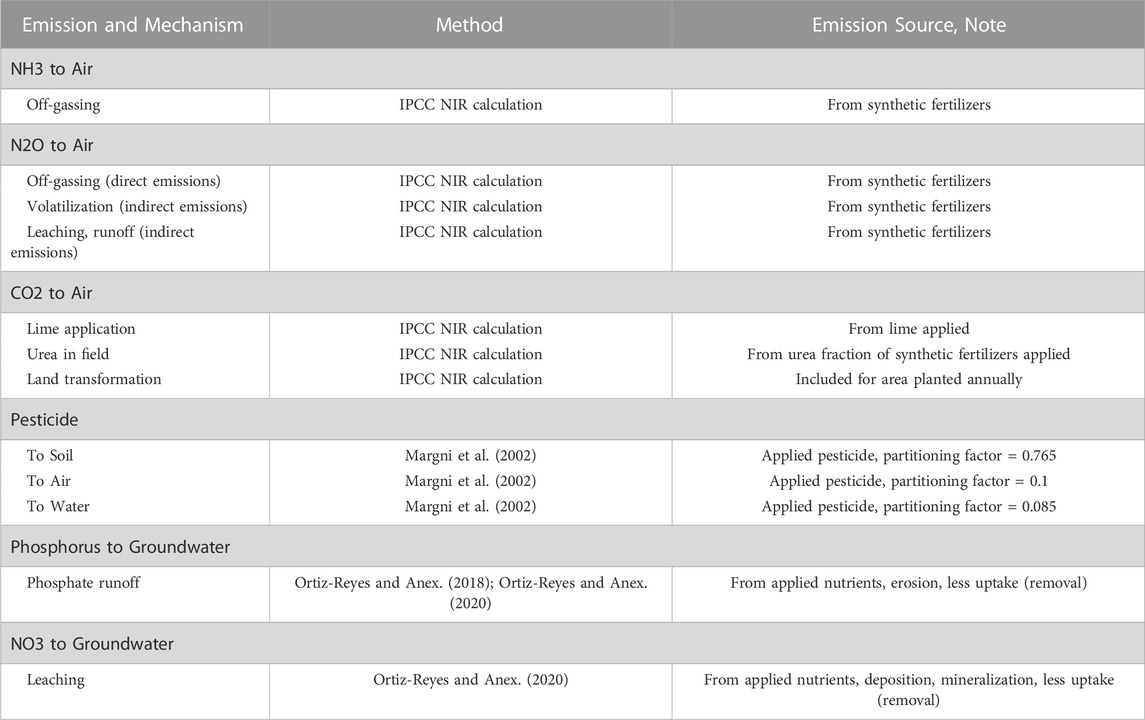
TABLE 2. Included emissions from nutrient application and land transformation. Relevant parameters may be found in supplemental materials.
Background data for the manufacturing of materials, production of energy, and waste treatment utilized for corn production were modeled using data from Ecoinvent 3.5. and supporting agricultural data were drawn from the Agrifootprint 4.0 (Blonk Consultants, 2017) database.
Grain transport
Transportation of corn grain to participating wet mills is via truck and rail. Primary data for transportation distances between the corn growers and local elevators, and local elevators to the wet milling plants, were provided by participating companies along with transportation mode shares.
Background data for the production of fuels and air emissions from heavy-duty vehicle (or other modes) transportation were obtained from the Ecoinvent 3.5 database. Based on a reviewer’s comment, the effect of using a U.S. source for heavy truck for tailpipe emissions (using values from GREET 2018) was checked and resulted in no change in share of impact, so the Ecovinvent process was retained.
Corn wet milling: Starch milling and refining processes
Figure 3 shows the process flow diagram for the corn wet milling and refining system used to produce HFCS55, as well as the secondary products included here, HFCS42, 95–100DE, corn germ, and corn gluten meal. In practice, process segmentation is less sharp than shown diagram due to the high levels of process integration, the use of heat recovery and differences in configuration. Corn gluten feed (shown in grey in the diagram) is also produced, but it is not included in the system boundary for this study because alcohol production is not included in the system boundary and whether a site includes alcohol production or not dramatically changes the feed production.
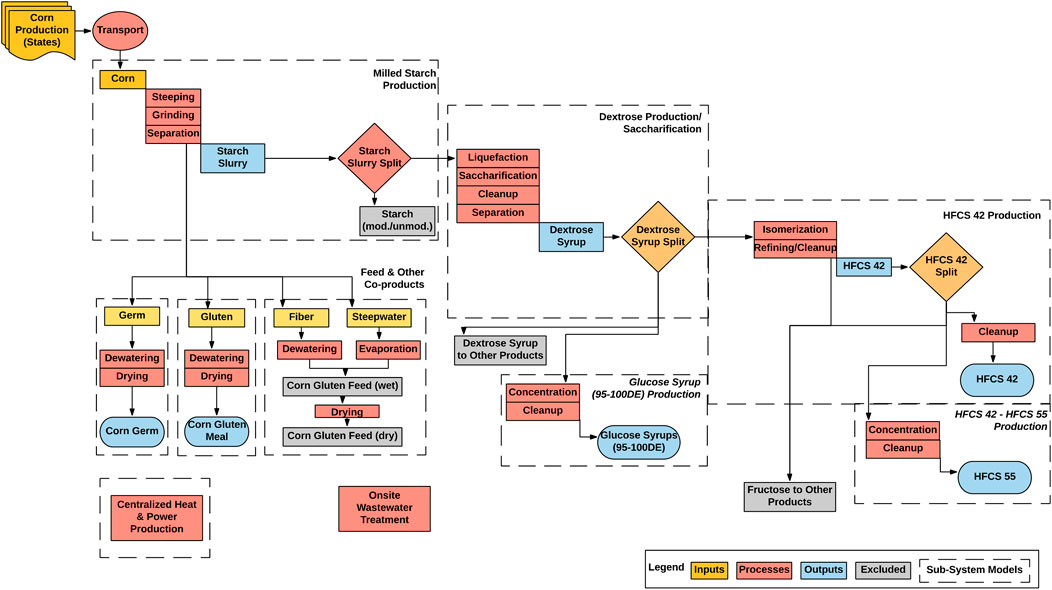
FIGURE 3. Process flow diagram and system boundaries of the generalized wet milling portion of the cradle-to-gate production of HFCS 42, HFCS55, and related co-products. Connected subsystem blocks are modeled together in a consolidated process, reflecting the necessary level of aggregation for data harmonization.
Corn grain processing is consistent among refiners through starch milling, after which it may diverge to some extent, although the unit processes remain similar. Starch streams (as slurry) spilt to a variety of sweeteners, starch, and/or ethanol, depending on the operator and market conditions.
In some configurations, higher concentration fructose products may be produced in addition to HFCS55, or a portion of the dextrose stream will be split to produce higher concentration dextrose syrups (including D90-95 and above). Dextrose syrup is used as input to the HFCS42 production sub-process, and the dextrose syrup stream is also directed towards sorbitol production (not part of system boundary) and glucose syrups production. Raw HFCS42 can then be cleaned up and sold directly or used as input for the HFCS42 to HFCS55 conversion process where it is converted to HFCS55 through concentration and cleanup. Some configurations produce HFCS90 and dilute with HFCS42 to obtain HFCS55. In short, there are a variety of configurations in active use.
The non-starch part of the corn grain is fractionated into germ, which will often undergo processing to oil onsite or elsewhere, gluten, which will become corn gluten meal (CGM), and fiber and the thin steepwater that will together become corn gluten feed (CGF) after evaporation of excess water from the steepwater and drying of the fiber.
Each of the 13 facilities included in this study either completed a detailed data collection workbook to the extent possible, or provided alternative documentation supplying the requested data. This data included process input and output information on five primary sections: 1. corn sourcing and transport information; 2. starch milling (including production of key coproducts); 3. refining - starch to studied sweeteners (HFCS55, HFCS42, and Concentrated Glucose/Dextrose syrups); 4. on-site wastewater treatment, if relevant; and 5. steam (heat) or combined heat and power production, as appropriate. Primary data included.
• Feedstock inputs (corn);
• Chemical inputs;
• Water use;
• Enzyme inputs;
• Electricity generation and consumption;
• Heat generation and consumption;
• Fuel consumption;
• Process air emissions;
• Process wastewater emissions;
• Annual production of HFCS55, HFCS42, and glucose syrup (DE 95–100);
• Annual production of corn gluten meal and corn germ; and
• Caloric value, energy content and unit prices for HFCS55 and coproducts.
The data was consolidated and then normalized to bushels of corn input for starch milling or pound of starch processed for refining. This was then used to interpolate values to fill gaps where detail for subprocesses was missing but viable to fill.
For refining, a consolidated LCI for the primary sweeteners (HFCS55, HFCS42, and DE95-99) was included to give a sense of the generalized process while preserving confidentiality; this consolidated inventory was not the modeled case and is provided only for context. The LCI data collected from each of the sites was provided in anonymized form during review. Consolidated inventories are provided in the supplemental materials.
Energy flows in corn wet milling
Energy consumption is a major contributor to the environmental impacts of corn wet milling and refining. The handling of energy flows is thus essential to representing the production system.
Corn wet mills are highly integrated systems, with extensive heat integration and, often, water integration (the latter is one reason for the difficulties with the water data mentioned previously). However, because energy use is so important, it is often monitored at higher resolution. Figure 4 shows energy consumption specific to products in the wet milling system, prior to refining.
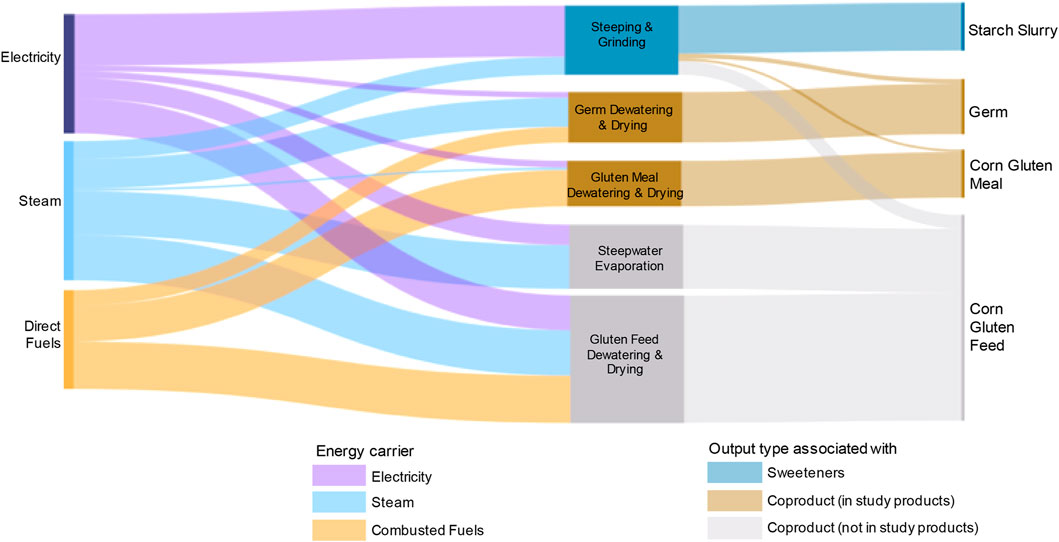
FIGURE 4. Diagram showing energy use by energy carrier and process for corn milling and coproducts production. Consumption is dominated by dewatering and drying processes associated ultimately with coproducts. The portion of energy consumed by the process all products come from (steeping and grinding) ultimately must be shared amongst the outputs using allocation. “Direct fuels” includes natural gas and biogas combusted for coproduct drying; there is no direct fuel consumption for steeping and grinding (RTO fuels included in drying).
A portion of the consumed energy was used for the process steps from which all outputs were derived (steeping and grinding) and ultimately must be shared amongst the outputs using allocation. The rest of the consumed energy was associated with processes specific to final products and, in most cases, tracked separately. In the figure, HFCS55 was solely covered by the output from steeping and grinding going to the starch slurry; all other energy flows were wholly utilized by the coproducts.
Most site operators were able to provide a breakdown of energy use between starch and coproducts; many of those provided detailed breakdowns of energy use by coproduct and/or process. Steepwater (LSW) evaporation for final use in corn gluten feed (CGF) is a significant energy use in the system that is used entirely for the coproduct stream but is often reported with steeping and grinding. For sites that provided the LSW steam use separately, that value has been used. For those sites that did not provide a breakdown between steam use in LSW evaporation, steeping, grinding, and the resultant value assessed for agreement with the value calculated using the latent heat of vaporization.2
Direct combustion fuels were generally reported only for coproducts. However, for sites using regenerative thermal oxidizer (RTO) units for pollution control, a share of the gas used to fire the units must be shared across the system even though there was no direct fuel consumption specifically for steeping and grinding. Where the exact consumption for RTO was reported, this value was assigned to starch milling. For sites using RTO units that grouped RTO gas with gas used for drying, the gas use was apportioned based on data reported for other sites, weighted by fuel mix, grind, and coproduct output. This value was not separated from the other fuels in the figure.
Where producers were able to supply emissions and fuels data for specific wet milling products and coproducts (due to monitoring and/or regulatory instruments) those fuels and emissions were assigned to the specific products. More significantly, combustion fuels used for coproduct drying could be assigned solely to coproducts, avoiding allocation of an important driver of impacts (see above). All but two of the participating sites were able to provide this breakdown; the distribution of use among the reporting sites were used to interpolate values for those two sites.
The starch milling process is common to all products produced in a corn wet mill, all of which originate from the steeping, grinding and separation of corn. Thus, where an inventory component was not disaggregated by the facility (e.g., solid waste disposal in most cases), that characteristic was used to ensure that the burden was not “lost.” For example, plant fugitive emissions were assigned to starch milling, as were Regenerative Thermal Oxidizer (RTO) emissions as they provide a site-wide benefit.
Where producers were unable to supply influent and effluent flow data for specific subprocesses associated with a particular product, such as solid waste at most facilities, data for those processes were assigned to starch milling as the burden should be attributed to the processed material. During modeling, impacts of starch milling and impacts not attributed directly to particular products and coproducts were allocated with both mass-based and economic value-based approaches. The share of wet milling impacts allocated to the coproducts was then combined with the coproduct-specific impacts to get the total coproduct life cycle impacts. Impacts were then allocated among coproducts based on allocation method (mass or economic). That is, where direct assignment to a particular process component was not possible, assignment was made to starch milling, the impacts of which were shared by all products derived from the mill.
Gaps in supplied data (emissions, releases, wastes) were filled where possible using annual reports filed with government agencies. Emissions, releases, and wastes data were supplemented where necessary with data from primary reporting programs accessed through EPA’s Enforcement and Compliance History Online (ECHO) (https://echo.epa.gov/) portal. If emissions supplied by the facility did not include CO2, CH4, and/or N2O values, those were collected from the facility’s Greenhouse Gas Reporting Protocol (GHGRP) filing for the same year. If it was possible to match combustion units to the facility detail, this was done. If not, the share of each fuel used for each module was used to partition the GHGRP reported values between appropriate modules. A similar approach was taken with Discharge Monitoring Reports (DMR) and Toxics Release Inventory (TRI) Multi-Year Loading Report data to fill gaps in the facility-provided data for wastewater emissions and solid and hazardous waste data.
Background data for the manufacturing of materials, production of energy, and waste treatment were modeled using data from Ecoinvent 3.5.
Facility variability and model structure for the industry level inventory
Configuration and product slate differences, exacerbated by operational decisions, make the HFCS55 system particularly difficult to generalize. The corn processors represented in the study set generate several coproducts in addition to HFCS55, including other sweeteners and corn germ and corn gluten meal (derived from Milled Starch Production). Figure 5A shows the range of product slates and shares for the facilities participating in this study. For corn sweeteners especially, there are many products which can be produced including HFCS55, HFCS42, various grades of dextrose, corn starch, steep liquids, and fermentation products. The types and amounts of coproducts may vary according to the producer and were not consistently produced across all refineries.
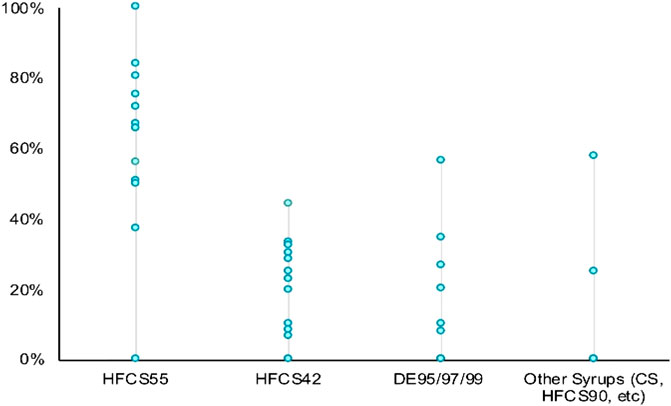
FIGURE 5. Variation in products and inputs across participating facilities. Variability of sweetener products and product shares across participating facilities. This variation introduces significant challenges in defining an ‘average’ facility or HFCS55.
Equipment at the corn milling operations also imposes some restrictions on possible products. Operational decisions, including the choices made during processing in response to equipment capabilities, input material properties, and market conditions for outputs also introduce variability during production on a day-to-day basis which can be reflected in uncertainty. The heterogeneity of refinery product slates and, consequently, structures, among corn refineries was clear in the parameters (Figure 5B) including energy sources, corn inputs, and products, by-products and coproducts.
The ranges for ammonia and sulfuric acid appear artificially larger; very small amounts of the two were used, so differences were magnified. Water use data was illustrative only, because inconsistent water use data prevented closure of the water balances. This variability limits the feasibility of creating any type of industry norm or average. It also complicates the generalization of average LCA results to particular members, because one member’s hotspots may not be part of another’s operations.
Despite these variabilities, a clear grouping of facilities arises from utilities and starch milling because so much of the impact arises from energy production, particularly coal use. This grouping gives rise to a hybrid model for the analysis.
Figure 6 shows the structure used to create the life cycle model from the operator data. The level of granularity in the data provided differed among participating facilities resulting in some difficulties reconciling the data across sites. The key assumptions used in compiling the life cycle inventory are summarized below, along with approaches used to harmonize the system and create a cohesive inventory.
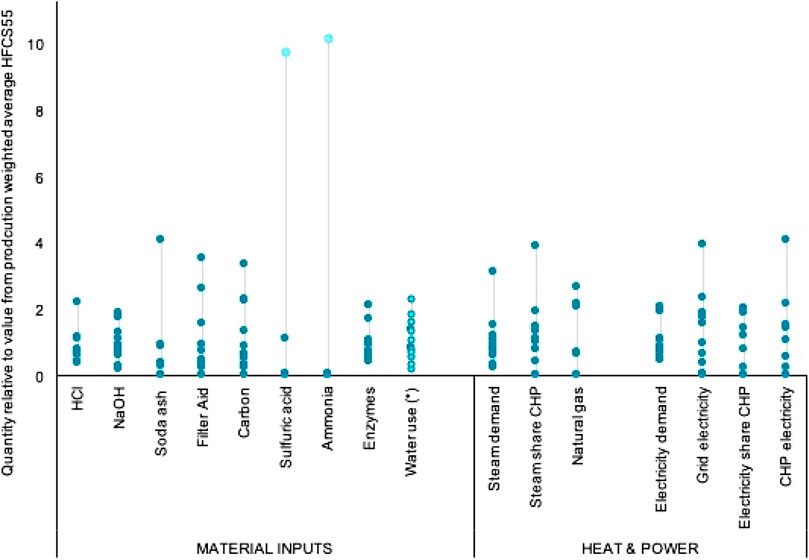
FIGURE 6. Variability in refining inputs per pound of starch across participating facilities.
Data quality
In practice, all data used in an LCA study are a mixture of measured, estimated and calculated data.
Data treatment
To evaluate the quality of the data used for modeling the production systems, data quality indicators (DQI) were used to assess each flow using a data quality matrix approach. These scores were also used to assess uncertainties on the data where statistical information was unavailable, and subsequently assess the uncertainty of the model and the results for instances where standard deviations were not available.
Five types of DQI were evaluated by the chosen pedigree matrix (Ciroth et al., 2016) by using scores from 1 to 5 for the following parameters.
1. Reliability (related to the reliability of the collected primary data);
2. Completeness (related to the completeness of the primary data);
3. Temporal correlation (related to the temporal correlation of the primary data);
4. Geographical correlation (related to the geographical correlation of the secondary data used);
5. Further technological correlation (related to the technological correlation of the secondary data used).
Data quality scores were assigned to the data by the authors using the pedigree matrix in SimaPro, which was based on the pedigree matrix for Ecoinvent (see Table seven.3 in Frischknecht et al., 2007a). The selection of pedigree scores was based on the authors’ knowledge of the characteristics of the data relative to the specified scores in the pedigree matrix. These scores were then combined with basic uncertainty factors to develop squared geometric standard deviations for use in Monte Carlo analysis to determine the influence of data quality on the reliability of the study results.
Compound modeling
Scores were assigned to the data in the SimaPro software program based on these criteria. In instances where primary data on standard deviations were not available for a given data point, these data quality scores were combined with basic uncertainty factors to develop squared geometric standard deviations for use in Monte Carlo analysis to determine the influence of data quality on the reliability of the study results. Because of the use of parameterized models with parameters carrying uncertainty, the resultant (effective) distributions were mixed. Most parameters were normal (treated using standard deviation), some were lognormal treated with pedigree (as were most of the background processes) or with GSD where possible. In some cases (unanticipated releases to water/land reported under TRI) uniform from 0 to the value has been used.
Summaries of distributions, standard deviations, and data quality scores were also determined.
Results and discussion
One of this study’s primary objectives was to understand the relative life cycle environmental impact potentials for a primary sweetener in the U.S, HFCS55 and some companion products. As the results below demonstrate, crop utilization, available coproduction, and variation in energy use for the sweeteners, as well as the extent of heterogeneity across producers, are all found to have significant effects on the analysis. It must be noted that, although water impacts are an important element of bio-based and agri-food products, the water data were not sufficiently robust to support analysis and it was not possible to draw conclusions or make distinctions among the various technology groupings based on water use in this study and water-related impacts are not presented here.
Impacts of the Industry Average Case for HFCS55 and HFCS42, DE95-99, Corn Germ and Corn Gluten Meal Products.
The impact assessment results for all included impact categories for industry average HFCS55 and other identified products of interest in the HFCS55 system are shown in Table 3. Because these results are for the industry average case, they include the heterogeneity in product slates among refiners, a range of efficiencies, and the mix of the four technology groups.
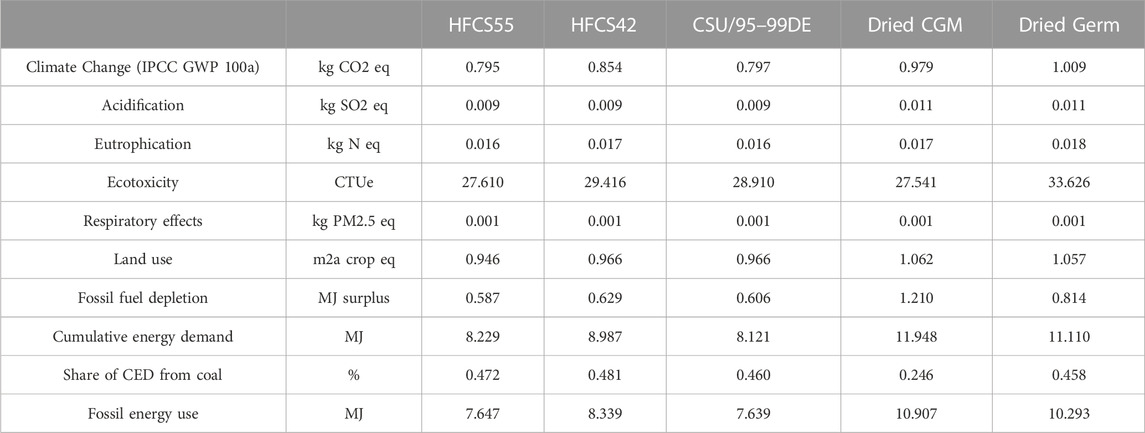
TABLE 3. Impact assessment results for the primary products of the HFCS55 production system included in the study, for 1 kg of each component.
Figure 7 highlights the climate change and fossil fuel depletion potential categories. HFCS55 shows slightly lower impacts than the other sweeteners and coproducts across all of the categories except share of CED from coal. HFCS42, which is a produced alongside HFCS55, often by combining a 90% fructose HFCS stream with HFCS55, has an impact about 20% above that for HFCS55, while the mix of dextrose syrups are roughly equivalent (within 5%–10% of each other). This trend holds across impact categories and for mass or economic allocation. The slightly higher share of CED from coal impacts for HFCS55 relative to that from the mix of dextrose syrups is a reflection of product slates and share of each from the different technology groups found in the industry average, rather than a reflection of differences in the underlying processes. The same is true of the differences between HFCS55 and 42.
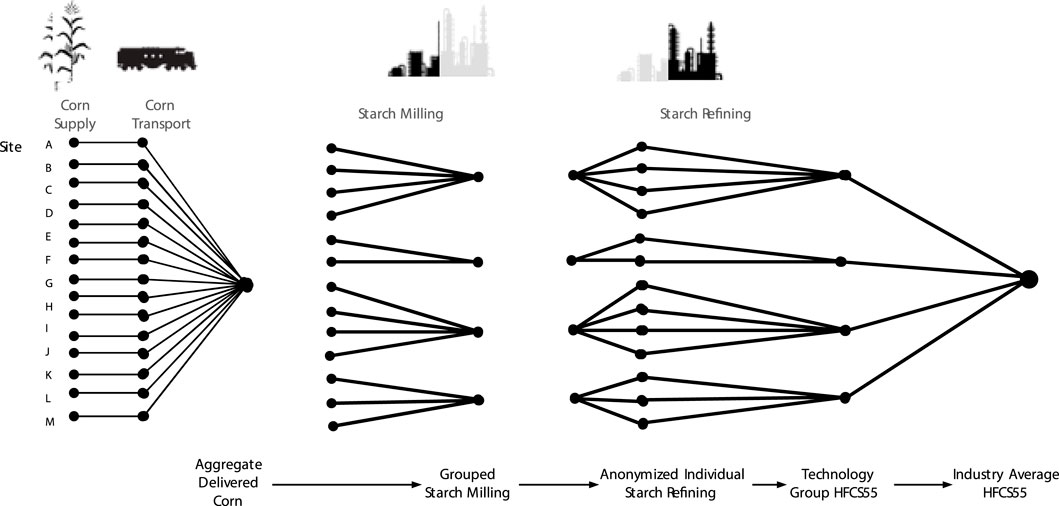
FIGURE 7. Schematic of the model structure used for the LCA of the HFCS production system, constructed from technology groups based on coal use and use or absence of cogeneration for heat and power.
The effect of changing the allocation approach from mass to economic on climate change and fossil fuel depletion categories is shown for all of the included products in Figure 7. Table 4 provides the impacts associated with industry average HFCS55 production for both mass and economic allocation. Under economic allocation, HFCS55 are somewhat higher, increasing by 15%–30% over those determined using mass allocation, with the exception of share of CED from coal which is slightly lower. This latter difference is a result of the differing balance of product slates among producers. As Figure 7 shows, changing the allocation approach has a small but non-negligible effect on the relative ordering of sweetener and coproduct climate change and fossil fuel impacts. The impacts for HFCS42 decrease relative to both HFCS55 and the mixed syrups. The most dramatic effect of changing the allocation approach is seen in the coproducts. The corn gluten meal and corn germ products derived from the starch milling process were similar to each other when impacts were allocated by mass. However, when economic allocation was applied, corn germ carries a significantly higher share of impact than does corn gluten meal, reflecting the former’s significantly higher value. Because only the starch milling process was common between the sweeteners and the coproducts, the impacts for the sweeteners were not altered by this difference.
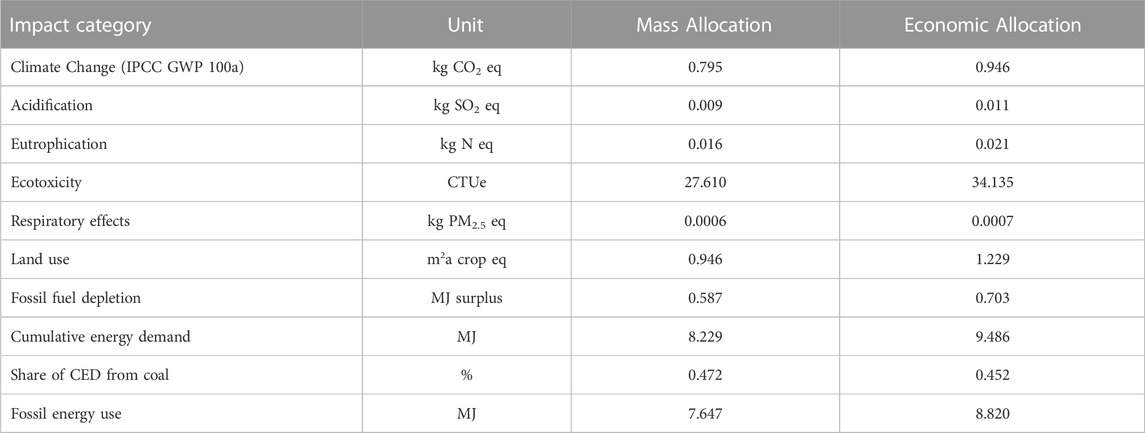
TABLE 4. Impact Assessment Results Summary for industry average HFCS55, per kg of sweetener using both mass allocation (left) and economic allocation (right).
Contribution analysis
The contributions of the main life cycle stages to the environmental impact potentials to produce HFCS55 are shown in Figure 8. Processing (wet milling and refining) is the primary contribution to Global Warming Potential, Respiratory effects, and Cumulative Energy Demand. The crop production portion of the life cycle dominates the other categories. A more detailed breakdown of life cycle stage contributions to the impacts is presented in Figure 9 to show relative significance.
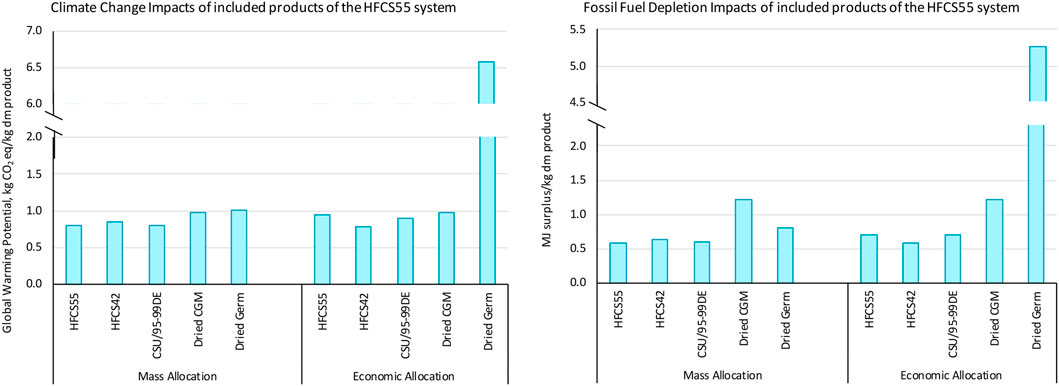
FIGURE 8. Climate change (left) and fossil fuel depletion potentials (right) for the included sweetener and starch coproducts in the HFSC55 system, showing the impact of changing allocation from mass (left) to economic (right).
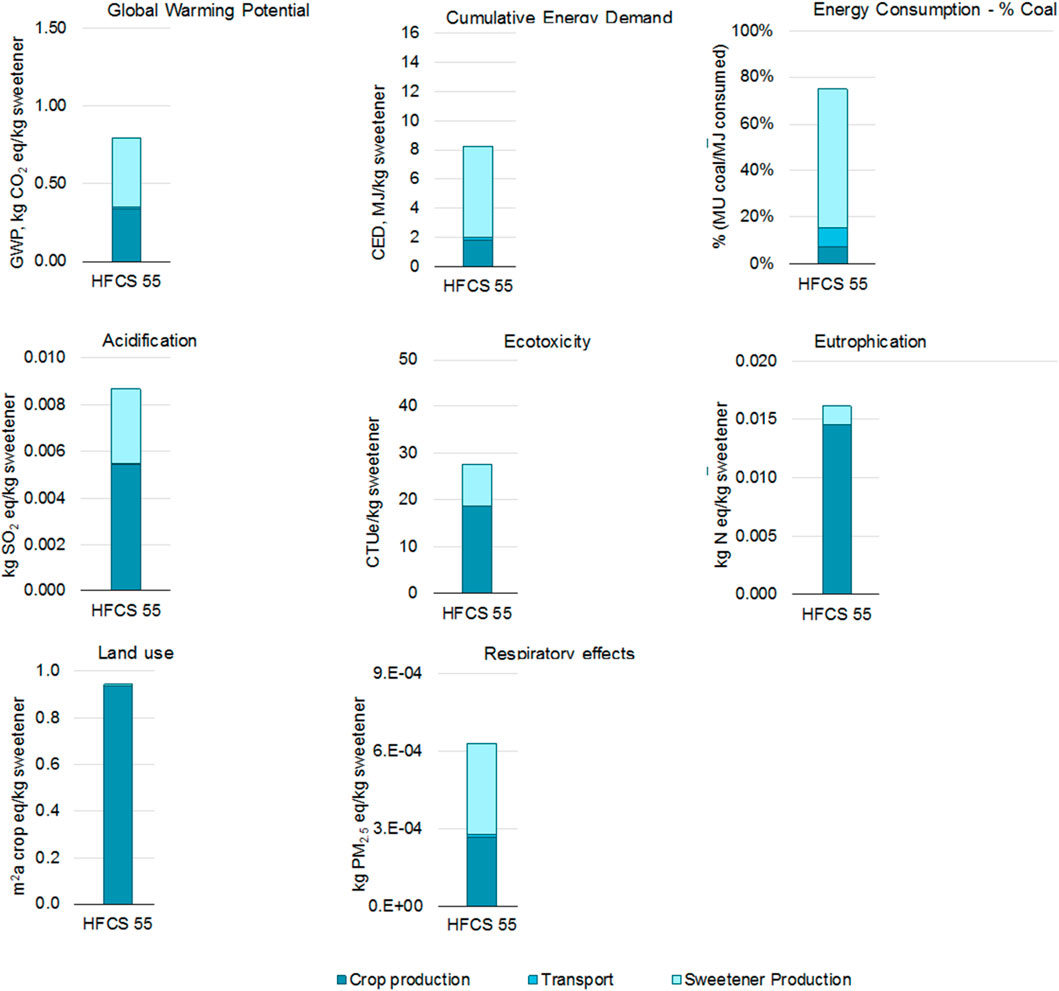
FIGURE 9. Breakdown of life cycle impacts HFCS55 (1 kg dry basis, industry average case) between crop production, grain transport, and sweetener production including wet milling and refining using mass allocation, showing the relative magnitude. (Methods: Global Warming Potential IPCC100a 2013; CED v1.11; Land Use ReCiPe 2016; others from TRACI v2.1).
Crop production was the primary hotspot for most of the environmental impacts. However, for the sweetener systems, refining, with its higher energy consumption than for other stages of the life cycle, was the most significant impact in three categories: Global Warming Potential, Cumulative Energy Demand, and Respiratory Effects. All three of these impact categories are heavily influenced by onsite fuel combustion emissions. In particular, the combustion of coal, whether it be in a boiler or in a cogeneration (combined heat and power, CHP) unit, drives many of the impacts during the starch milling and refining operations. Coal and natural gas extraction and combustion drive 70%–90% of the global warming impacts for process heat and power, and their extraction also play a visible role for acidification and ecotoxicity. The large share of energy use by the coproducts of starch milling result in a lower contribution to impacts by the milling portion of processing compared to refining.
Given the significance of crop production in determining the life cycle impacts of sugar production, the uncertainties in the crop cultivation data have great influence on the environmental impact potentials. These uncertainties are compounded by variations in yields of sweeteners per unit mass of agricultural product input, where yields may be a function of both processing choices to meet market conditions and capabilities of processing equipment to convert agricultural products to valuable sweeteners outputs. These factors are discussed future below as part of the uncertainty analysis.
Global warming potential
The Global Warming Potential (GWP) impact category refers to the warming that can occur because of increased emissions of greenhouse gases from human activities. This warming can lead to changes in the global climate which can cause negative impacts to human and ecosystem health. This impact category provides a quantitative assessment of the contribution that each of the included sweeteners can make to global warming based on characterization factors used by the Intergovernmental Panel on Climate Change (IPCC) over a 100-year time horizon (IPCC, 2013).
Global warming potential in HFCS55 arises primarily from the refining stage (65% in HFCS55). In this case, heat or heat and power were the biggest factors. The results of the contribution analysis indicate that coal combustion was a significant driver of the GWP, whether directly firing a boiler or used in a cogeneration facility.
Cumulative Energy Demand
The Cumulative Energy Demand (CED) category tabulates the use of energy, both renewable and non-renewable, across the life cycle as a result of the production, use, and disposal of the product(s) (Frischknecht et al., 2007b). The energy demand can decrease available resources and increase environmental impacts from fuel extract/production through use.
Cumulative Energy Demand (CED) provided the primary measure of energy consumption. HFCS55 uses significant fractions of coal as an energy source (panel c), about 60% for corn sweetener. This similar ratio of coal to natural gas consumption was also why the results for GWP parallel the results for energy consumption, the fuel mix was similar. Impacts in the HFCS55 sugar systems reflect a significant share of energy from coal. Fossil Fuel Depletion was also assessed. It incorporates resource availability along with consumption, and those energy types, such as natural gas, were in much smaller supply relative to the overall (global) consumption, will show higher impacts. While the impacts discussed previously highlighted the fact that coal combustion was driving many of the impacts, coal is in abundant world supply relative to world demand, with an estimated reserve base of about 150 years, for natural gas or petroleum-derived fuels, the reserve base is estimated to be on the order of 50 years (estimated from data provided by U.S. Energy Information Administration for 2017).
Acidification impact potential
Acidification is the increasing concentration of hydrogen ions (H+) within a local environment. It occurs as a result of the addition of acids (e.g., sulfuric acid) or by the addition of substances that increase the acidity of the environment (e.g., ammonia). Acidifying substances such as sulfur dioxide and nitrogen oxides are often emitted to the air via combustion of fossil fuels and then deposited in the environment (e.g., acid rain) where acidification can result in damages to human infrastructure and natural ecosystems (e.g., lakes, rivers, wildlife).
As might be expected with an agricultural crop, fertilizers, in particular phosphate, drive much of the Acidification Potential in the field. Also, a driver in the agricultural portion of the life cycle was combustion of fuels in agricultural equipment. As can be seen in Figures 8, 9, sweeteners production also contributes significantly to the impact potential. As with the Global Warming Potential, this can be attributed to fuel combustion for producing heat and energy at each of the Refining sites.
Eutrophication impact potential
Eutrophication refers to a decrease in available oxygen levels in either freshwater or marine waters due to an increase in the growth of algae and weeds that is driven by excess nutrients in the water. The release of nutrients such as nitrogen and phosphorous are the primary drivers, and these low-oxygen zones can have negative effects on freshwater and marine ecosystems and organisms.
Fertilizers were the primary contributors to the eutrophication potential for each of the systems, contributing, in general, about 60 percent of the impact for corn agriculture. The contributions associated with the refining process are associated with energy resource extraction and consumption.
Ecotoxicity impact potential
The Ecotoxicity impact category refers to negative impacts to ecosystems and non-human organisms resulting from exposure to higher concentrations of toxic substances in the environment.
Agriculture was the most significant driver of ecotoxicity. Within crop agriculture, fertilizers were again the largest impact potential drivers. In the refining process, particularly HFCS55, grid electricity was the largest driver ecotoxicity impact during the refining process.
Respiratory effects impact potential
The Respiratory Effects impact category refers to the accumulation of particulate matter and precursors to particulates in ambient air which can result in several negative human health effects including respiratory illness and death. Common sources of primary and secondary particulates were fossil fuel combustion, wood combustion, and dust particles from roads and fields.
Respiratory Effects impacts are, again, driven by combustion emissions, including fuels in the field or fuels at the refinery, and by fertilizers from agriculture. With the latter, as for Ecotoxicity Impact, it was not the fertilizer use directly that was the issue but the production of the fertilizers using energy which form various air emissions sources either on site or purchased.
Land use impact potential
Land Use refers to a decline in the potential species and agricultural utility of land, or the agricultural land occupation potential, based on land occupation, transformation, and relaxation (as the land returns to its natural state over time) and the relative species loss due to local land (Huijbregts et al., 2016).
Crop yield the most important attribute for land use impacts. For the impacts associated with HFCS55 specifically, the yield of usable products and coproducts relative to the area used dictates the magnitude of contributions.
Water use impact potential
Water Use and impact were computed using net water consumption and water scarcity metrics (the AWARE method (Boulay et al., 2018) and the Water Scarcity Impact, WSI (Boulay et al., 2011)) which encompasses both the quantity and quality of water used and the water availability within a watershed in the impact calculation. Under the AWARE method, small water uses in watersheds with large water availability have much less impact than the same quantity of water consumed in a watershed with limited water availability. A negative impact can occur when a greater quantity of water was returned to the watershed than was consumed. Consumption was quantified as both volumetric consumption or as degradation of water quality through the addition of contaminants, or heat. (Boulay et al., 2018). However, the available water data was found to be of insufficient quality for meaningful results and these categories are not shown.
Results for water use impacts were not included due to data limitations. Since water in most regions of the U.S. was inexpensive relative to the value of the final product, its volume and quality were often not measured with the degree of precision as many other inputs to an LCI. Availability and quality of data for water flows in the corn milling system were variable and weak. Despite effort to fill the gaps, we were not able to resolve the water flows to a level of quality sufficient to support analysis and were not able to close the water balance. The open water balance dominates all water impact results for corn sweeteners here, where processing stages receive water from other stages in a highly integrated way, resulting in ambiguous flows. For example, water consumption during on site combustion during milling was shown to produce water. Wastewater treatment outputs seem to have a significant negative value during the production phase for corn sweeteners.
Structural analysis of the HFCS55 system
Structural and variation analyses were done for the corn refining operations and for the corn refining industry to understand the range of potential impact around the ‘average’ HFCS55 and the sources and range of uncertainties that needed to be included in this LCA, and to provide actionable perspective on the environmental hotspots in the HFCS55 system.
The heterogeneity of HFCS55 impacts across generalized sites makes clear the tenuousness of defining a single industry average. Figure 10 shows impact for each site’s refining portion coupled with the generalized starch milling and heat and power production that matches it (that is, site X was a cogeneration site that uses coal, so anonymized site X’s refining was paired with starch milling cogeneration with coal; cogeneration with coal; and the fully aggregated corn). Relative impacts in each category cover a large range, but generally lie between about 50% lower to almost 100% higher.
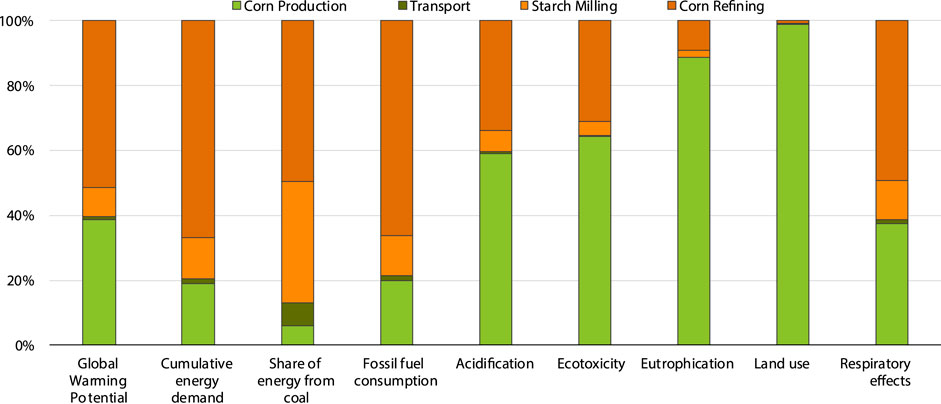
FIGURE 10. Results of the contribution analysis by life cycle stage for HFCS55 production (industry average) with mass allocation. (Methods: Global Warming Potential IPCC100a 2013; CED v1.11; Land Use ReCiPe 2016; others from TRACI v2.1).
Figure 11 shows the contributions to each impact category by life cycle stage with processing further broken down to illustrate drivers under the control of the participants. Acidification, ecotoxicity, eutrophication, and land use impacts are dictated by the agricultural portion of the system, land use almost completely. Impacts in these areas can be influenced by sourcing decisions and recommended best practices with corn growers.
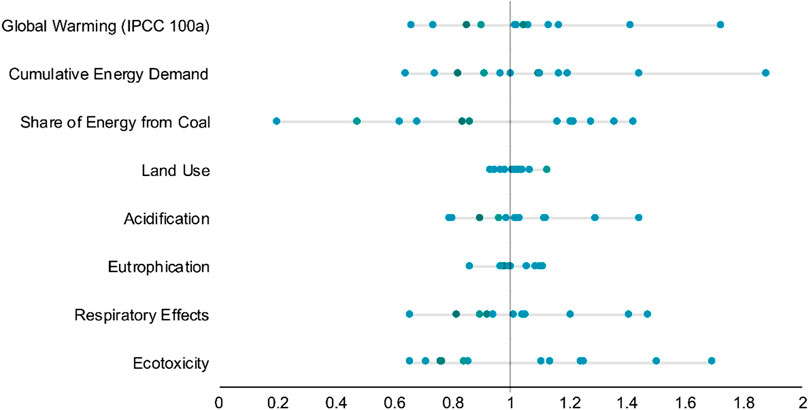
FIGURE 11. Range of calculated relative impacts for HFCS55 production by anonymized facilities with mass allocation. No single facility is consistently highest or lowest, and facilities’ locations in the range of impact for each impact category differ from category to category. (Methods: Global Warming Potential IPCC100a 2013; CED v1.11; Land Use ReCiPe 2016; others from TRACI v2.1).
Direct emissions from the wet milling process, which include combustion emissions from fuel use, contribute over 50% of the global warming, as well as the overwhelming bulk of energy and fuels use in the system (CED, % energy from coal, Fossil Fuel Consumption). It also accounts for 35%–40% of acidification and ecotoxicity impact potentials and the potential respiratory effects caused by particulate matter. In general, the feedstock (grain corn) accounts for most of the rest of the impacts, 35% in global warming, 55%–60% of acidification and ecotoxicity, and almost all the potential eutrophication and land use impacts. Feedstock transport to the plant, upstream impact potentials of chemical manufacture and transport, and waste management contribute little to the overall life cycle impact potentials, although the former two were visible in the total energy use. Non-combustion processing emissions contribute non-negligibly only to the potential respiratory effects.
Corn milling and refining variability
The structural analysis clearly resolved four HFCS55 ‘types’ or technology groups that underpin the industry average case: HFCS55 produced at a cogeneration site that had coal in its mix; HFCS55 produced at a cogeneration site that does not utilize coal; HFCS55 produced at a site that has coal in its mix but does not use cogeneration; and HFCS55 produced at a site without cogeneration that does not use coal.
Figure 12 shows results for Global Warming Potential, Cumulative Energy Demand and Eutrophication for the different groups, for heat production, starch milling, and refining. In most cases, the set of refineries with cogeneration using coal has the highest impacts. However, differences in productivity or other operating parameters result in deviations from that trend, for example in eutrophication (bottom row), impacts for HFCS55 and milled starch were the same or higher for boilers without coal, in part because the midwestern grid relies relatively heavily on coal.
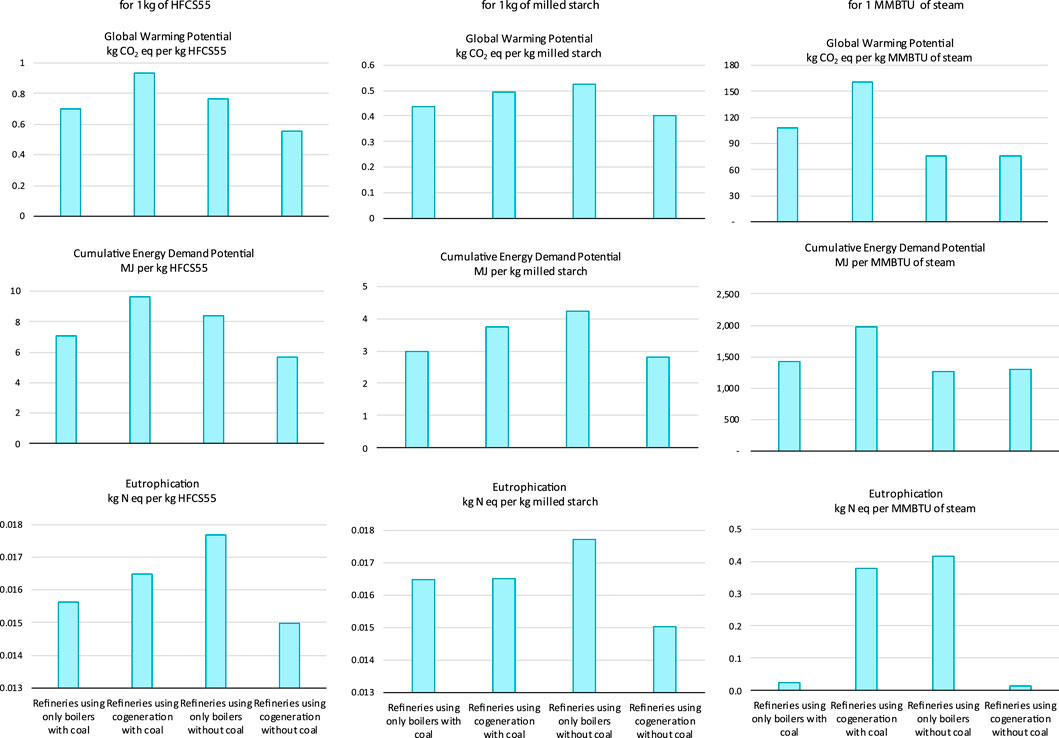
FIGURE 12. Contributions to the life cycle impacts of the Corn Wet Milling and Refining processes. Impacts in all cases except land use are dominated by process heat and power. (Methods: Global Warming Potential IPCC100a 2013; CED v1.11; Land Use ReCiPe 2016; others from TRACI v2.1).
Because the number of facilities in each grouping differs, with some groups having only a few, the potential for a particular site will be situation specific and the group values are not definitive. In all four groups, energy use (source and production) was the biggest factor. The variation in heat and power demand for refining operations across sites (Figure 5B), coupled with the different fuels used for heat generation, drives the variation in impacts among the groups (this is also addressed in the sensitivity/scenario analysis below).
Figure 12 shows the share of Global Warming Potential from fuel use for the four groups, clearly supporting the primacy of the impact intensity of energy used in starch milling and refining indicated in the contribution analyses. Where coal is used, it accounts for the largest contribution to the global warming potential excluding agriculture. Where coal is absent from the primary energy mix (it will still be present in the grid impacts where grid electricity is used), energy contributions decrease and other factors, particularly agricultural production, dominate. These results represent the mix of facilities of each type.
Energy replacement scenarios
Energy use, both combustion and upstream, plays a significant role in the environmental impact of HFCS55 in almost all categories (see Figure 11; Figure 12. However, the magnitude of its contribution differs significantly between the different refinery groupings. In practice, this means that operators of facilities of differing types will have varied strategies to decrease impact.
To provide an initial understanding of the potential routes to decrease the environmental impact of HFCS55 in aggregate (i.e., at the industry level) and for each of the four refinery types, a series of simple energy replacement scenarios were analyzed. Six scenarios were created from three possibilities: 1. transitioning to all cogeneration for heat and power to avoid use of electricity from the relatively high impact MRO grid (with about 58% of electricity from coal); 2. replacing the fuels used with lower impact options already in use; and 3. a simple replacement of existing fuels with biogas assumed to be produced locally. Basecase reflects the aggregate industry average based on facility data.
Global warming impact potentials for these scenarios are presented in detail for the industry average case in Figure 13. The single largest benefit comes from replacing coal, whether with natural gas or, where possible, biogas. The is also the driver for the impact reduction associated with shifting to cogeneration, because midwestern grid electricity is contributing a significant share of the impact. While biogas currently represents only about 4% of the natural gas combusted for heat and power at the wet mills included in this study, that share ranges from 10% to above 20% at some sites already. The biogas replacement scenario was included to provide some initial insight about potential utility of expanding biogas use in an industry already using some and has significant scope for expansion. The biogas scenario represents a preliminary or screening perspective and should be viewed as suggestive rather than concrete.
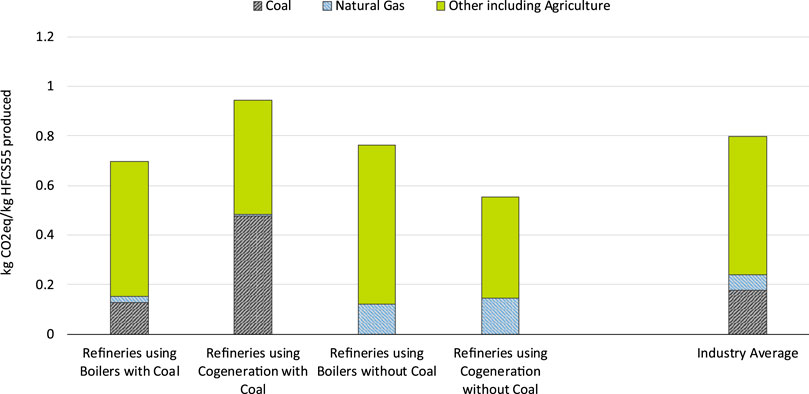
FIGURE 13. Contribution of Fuel Sources to HFCS55 Sweetener Production global warming potential for each of the four subsets of refinery heat configurations and the industry average. Most facilities, and the largest share of corn processed (grind) annually, have cogeneration infrastructure and use coal. Because the number of facilities in each grouping, product mixes, and amount of corn processed differs among groups, group values are not definitive and the reduction potential will be situation specific. (Method: GWP 100y, IPCC 2013).
Figure 14 shows the energy replacement scenario results for global warming impacts of HFCS55 production for the industry average case and each of the technology groups. As both Figures 12, 14 illustrate, the magnitude of improvement from energy replacement options depends strongly on facility type grouping. The set of facilities using cogeneration with coal will see the largest improvement, while those not using coal or using significantly less coal will need to target additional and/or alternative strategies for improvement. The groupings, and the impacts for the resulting base case, were based on the actual reported data from each of the facilities of that type. Thus, the groupings were not fully generalized, and the results of the energy replacement analysis would likely differ in practice. Taken across the range of facility types, the results of the energy replacement and modification analysis suggest that replacing higher impact fuels with those lower in impact provides a significant potential for the industry to decrease its overall environmental impact, and that shifting fuels mix was more important than switching to cogeneration at sites not already using it.
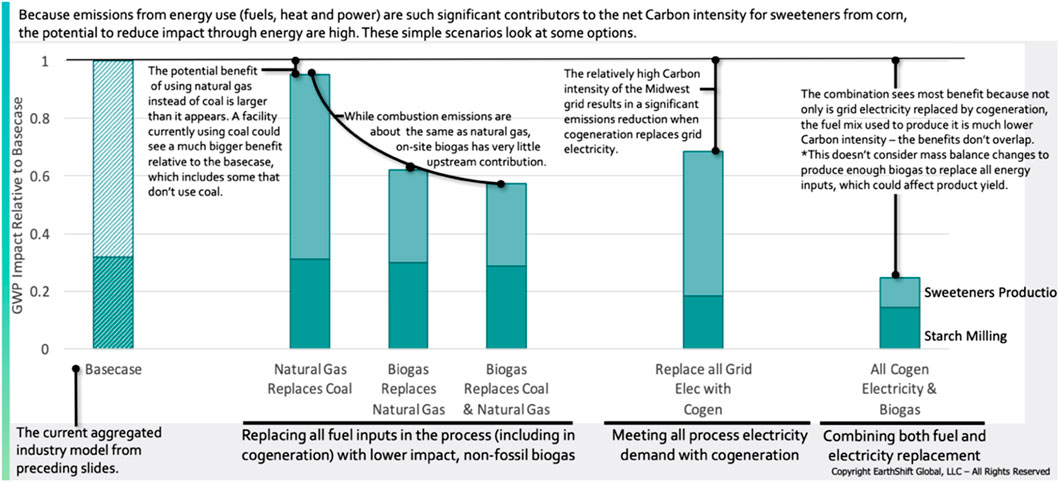
FIGURE 14. Breakdown of GWP reductions associated with each of the energy impact reduction scenario shown for the industry average case. Impacts are normalized to the basecase.
As noted, the biogas replacement scenario was intended simply to provide an indication of whether such an approach could materially decrease impact and thus whether it should be explored more concretely. The results here indicate clearly that it should be. These represent a preliminary assessment and should be viewed as suggestive rather than concrete.
Uncertainty and sensitivity
Uncertainty analysis is an important part of an LCA, particularly when differentiating between possible options or routes. Interpreting the results of the single point and contribution analyses alone can leave large gaps in understanding. For example, if processes A and B are compared and B offers the lower environmental impacts it might be inferred B is the better process. If the assumptions made in creating the system model for B introduces large uncertainty the computation may show that the results for B lie in the middle of a large range, while the results for A lie in the middle of a narrow range. If the range for B has considerable overlap with the range for A, the level of confidence with which it can it be stated that B is truly better than A is ambiguous. For the sweeteners systems studied here, these considerations were significant.
Major drivers of uncertainty in the calculated impacts are discussed below and in the HFCS LCI. As is common with agricultural products, the variability in crop production and harvest characteristics were important, as were energy use in processing and yields. These were assessed as part of the sensitivity analysis.
For sensitivity analyses, the effect of allocation method was also studied. Mass allocation was the preferred, but economic allocation was also used for corn to assess the impact of allocation choice. In addition, these results were compared to results for library processes and previous published LCAs; results of the current study were consistent with earlier analyses.
Uncertainty analyses
As mentioned previously, variation and uncertainty were found to be particularly important for these systems. Significant effort was devoted to capturing the key sources of uncertainty, as well as to modeling the systems in a manner which preserved confidential information and did not mathematically magnify or depress the effect of uncertainty on the results. The initial approach of modelling an effective average corn starch refining operation magnified the uncertainty because of the mathematics used in computing the effective average. The choice to model corn starch refining instead as an aggregate of individual facilities decreased the uncertainty of the results which allowed for more certainty in the interpretation of the results and provided a much more realistic depiction of the industry.
Results of the uncertainty analyses are presented in Figure 15 for the independent and correlated uncertainty analyses of the industry average HFCS55 case. Cumulative energy demand shows the narrowest uncertainty range, reflecting the comprehensiveness with which this value is tracked and the fact that the majority of energy use, as illustrated in Figure 4, is associated with non-starch product streams. The uncertainty range associated with acidification from HFCS55 was markedly high, but the difference in performance persists in the correlated analysis and demonstrates that the difference in the category between the different technology groups was distinguishable. The following sections discuss the primary sources of uncertainty that arise in addition to the structural differences in the HFCS55 production system.
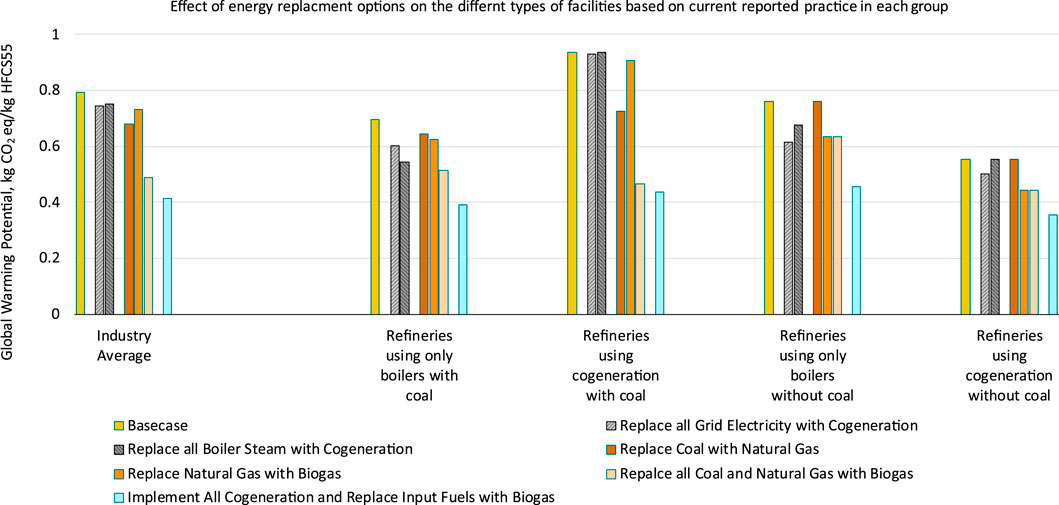
FIGURE 15. Global warming potential changes as a result of energy replacement options in the corn wet milling process for the industry average HFCS55 and HFCS55 produced at each of the four facility types identified, per kg HFCS55 dry basis.
Crop production uncertainties
Yield is the most significant contributor of variability in the agricultural system as it varies over a fairly large range year to year (Figure 16) as a function of rain fall, temperature, and other factors. Depending on which subset of years and geographies is chosen for the LCA, the variability of the crop yields differs significantly. If the date range includes only non-drought years for corn, variability is on the order of 50%. However, if the data used to create the crop input covers a period with drought (e.g., 2012, orange dot in Figure 16), then yield variability could be 100%. Sucrose content, which influences sweetener yields more than it does other elements of the system, also varies by a few percent year to year.
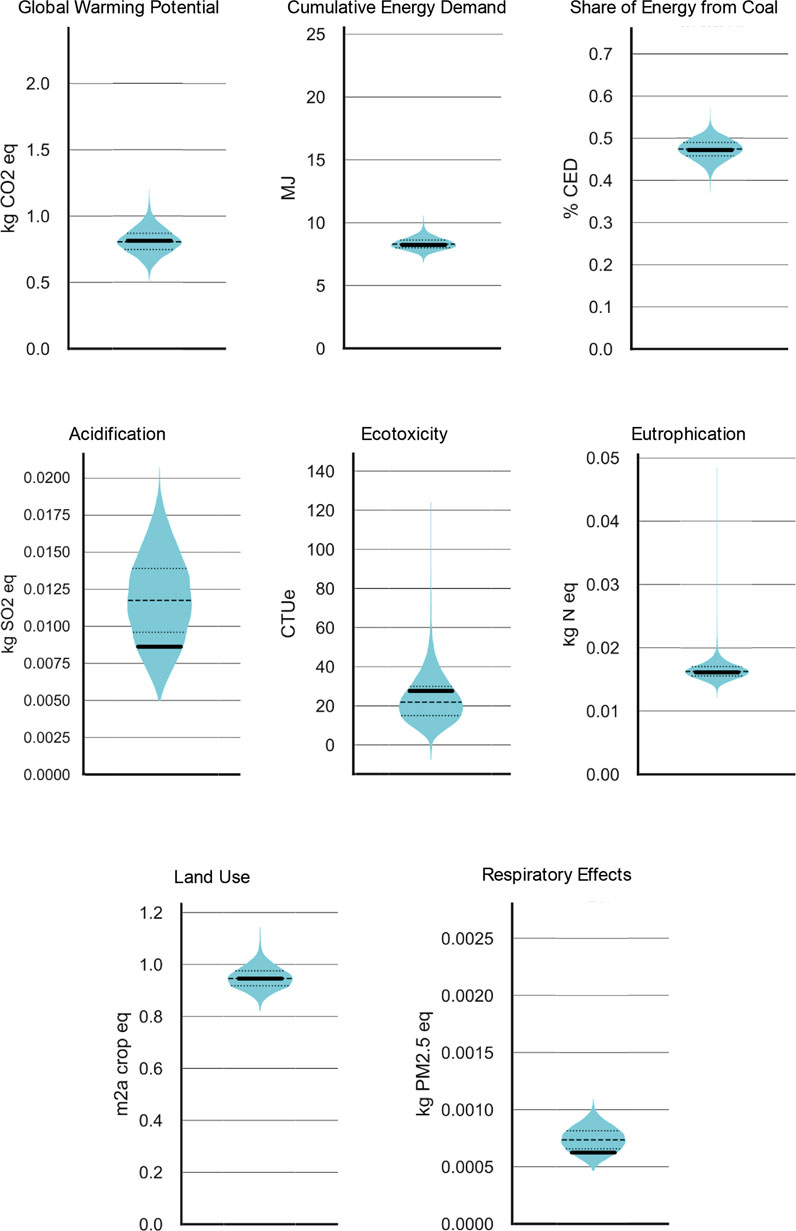
FIGURE 16. Assessment of environmental performance across assessed impact categories for 1 kg of sweetener at the facility gate (cradle-to-gate) for industry average HFCS55 including uncertainty. The distribution of potential impacts, based on Monte Carlo uncertainty analysis (8,000 steps), are presented as their probability surface (blue violins, width is proportional to probability for that value), along with dashed lines showing the median and 25th and 75th quartiles and a black bar for the single point value.
As with products derived from most agricultural crops, there was uncertainty associated with the agricultural operations in the field. This can be caused by year-to-year variations in weather, medium to longer term changes in seed, changes in soil productivity, and new management techniques such as precision agriculture, or low till or no till field management. These uncertainties can be magnified when comparing the same crop produced in different regions, especially across time.
The variability in yields during the past decade shown in Figure 16 for corn, and in sucrose content over the period, make material contributions to the impact ranges observed in Figure 15.
Sweeteners production uncertainties
Decisions made during conversion of crops to products introduce a second set of uncertainties, largely arising from variation in the system(s). These include the variation in product mixes among participating sites and in process inputs (Figure 5). For the HFCS55 system, these were reflected in the uncertainty and data quality parameters and in the refining modules of the model, with their individual anonymized inventories.
At many points within this report, the results have pointed to coal combustion as a significant driver for most of the impacts. Figure 17; Figure 12 illustrate the differences between the four subsets of refinery heat configurations and the variability within each system across the data sources used. The HFCS55 system has a high proportion of coal relative to the total energy demand. This uncertainty range has an increasing influence on the results when it was used in conjunction with other sources of uncertainty in the system, such as yields and product mixes.
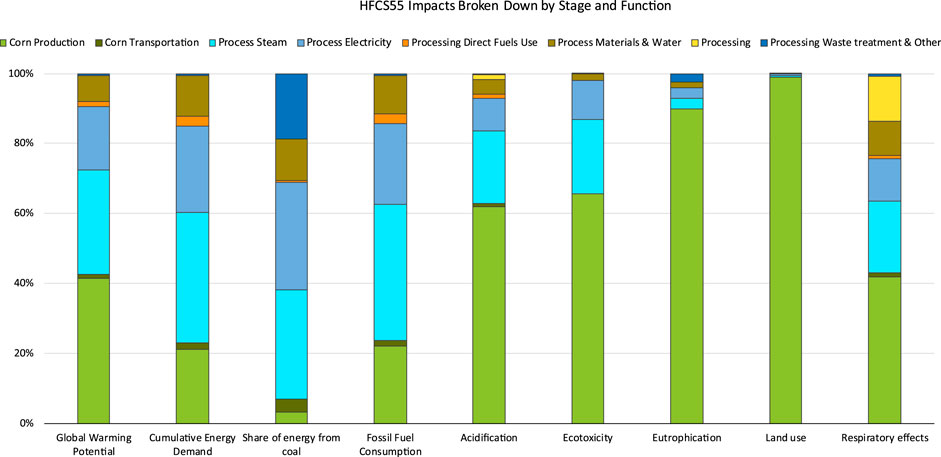
FIGURE 17. Global warming potential and other impacts for heat production, starch milling and HFCS55 refining across all four technology groupings. (Methods: GWP, 100y IPCC 2013; CED v1.11; Eutrophication TRACI v2.1).
Sensitivity analyses
Sensitivity analyses were used to assess the significance of various important system parameters to the results of the study, including allocation type, yield and conversion factors in both agriculture and conversion, and energy supply and demand.
The sensitivity of potential impacts for HFCS55 on selected impact categories to changes in key yields and inputs are presented in Figure 18.
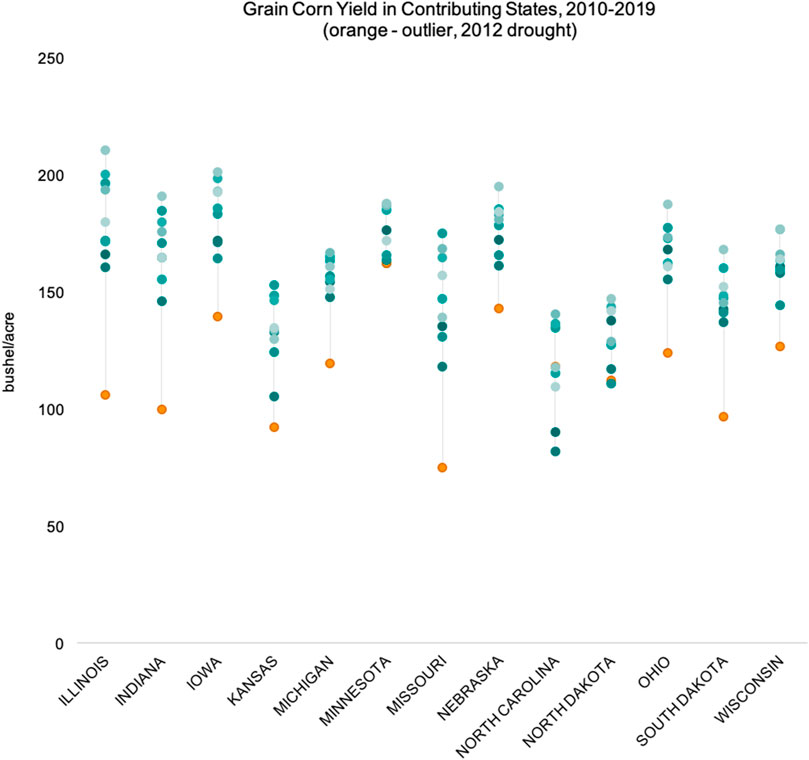
FIGURE 18. Historical Variability in Corn Productivity in the states included in the analysis (data from USDA NASS).
For the HFCS55 system, impact results were influenced primarily by sweetener, starch and crop yields, as well as by the fuels used in processing (especially coal) and the efficiency of the boiler or cogeneration system. This further reinforces the significance of fuels in the overall environmental performance of HFCS55. Acidification and ecotoxicity demonstrated some responsiveness to steam demand in the final refining stage. Only acidification showed a non-negligible sensitivity to fertilizer use. The results of the sensitivity analysis show that the study results are robust to these variables.
The HFCS55 system produces multiple products, although the starch milling process splits off the largest of the coproducts, so allocation can have a material effect of study results. To assess the importance of allocation choice, economic allocation was applied in addition to the default mass allocation approach used. The results of the allocation sensitivity analysis are discussed above. The relative ordering of sweeteners change little with allocation method, although the impacts for HFCS55 increase 5%–30% depending on category when changing from mass to economic allocation. The impacts of coproducts yielded by starch milling increase dramatically from mass to economic allocation, driven by the relative value of corn germ.
Interpretation and implications
The Interpretation stage in an LCA draws together the key findings from the study results to draw conclusions about the studied systems in light of the study objectives, the results of the uncertainty and sensitivity analyses, and considering the data quality.
Study objectives
The primary objective for this study was to quantify the life cycle environmental impacts of HFSC55 and other wet milling products at the industry average level. Possibly the largest influence on the LCA results was the fact the process structure for refining varies among corn refineries. This is driven by variation among product slates: not every site produces every sweetener product, nor do the sites produce the same products in similar proportions, as discussed above. This contributes to the variability across the industry. Life cycle environmental impacts for HFCS55, HFCS42, DE95-100, corn germ and corn gluten meal that were robust to changes in key parameters were able to be quantified at the industry level by calculating the production weighted average impacts.
The structural and operating variability in the industry both limits the feasibility of creating a generalizable industry model and makes generalization of the LCA results across industry members difficult as hotspots for one member may not even be part of another’s operations. From an impact assessment perspective, the corn refining industry is not so much a single, coherent industry as it is many individual operators in the same general collective space. However, the existence of clear groupings among the sites allows members to identify key areas for further analysis and low hanging fruit opportunities for improvement as well as longer term strategies.
Among this study’s objectives was identification of the environmental impact drivers (hotspots) for the corn sweeteners during refining and identification of some potential means of decreasing those impacts. Despite the structural differences, some implications apply across the industry. As discussed above, most of the impacts were driven by either combustion emissions or by fertilizer production and use. The is true for each of the technology groups, as well as at the industry level. Thus, as the energy replacement scenarios show, there are clear targets for improvement. As seen in Figure 9; Figure 11, energy consumption during refining was a significant driver of total system energy consumption, and, by extension, the driver of impacts such as GWP and Respiratory Effects. Fossil fuels supply most of the refining’s energy demand (>90%), primarily from coal and natural gas. Thus, as shown in Figure 14, one mechanism to lower the life cycle impacts of HFCS55 would be to reduce the energy consumption in combination with switching to lower carbon and lower emissions fuel sources. A number of facilities employ natural gas-driven combined heat and power systems, and these facilities had lower impact potentials (data not shown to protect confidentiality). As the energy replacement scenarios illustrated, each facility type would respond differently to such changes; the biggest improvement would be for the sites using cogeneration and coal.
Another objective was to identify opportunities for reductions in water consumption during refining. After much analysis of the water input and wastewater output data provided by the facilities, this question cannot be answered. The water and wastewater data were too variable, often incomplete, and water use within the facilities varied among uses such as cooling water, process water, steam, and water use for cleaning. Some of this variation was driven by the varied product mix discussed earlier, but primarily arises from lack of tracking infrastructure for water flows potentially attributable to the low cost of water compared to corn, energy, and chemicals, leading to lack of monitoring of use.
Comparison to prior work
Another of the objectives of this LCA was to compare the impact assessment results of HFCS55 with the same results from the previous study (2011). The comparison is presented in Figure 19 (water impacts were not included due to the data quality limitations), which suggests some potential reduction in GWP impacts in the time between the two studies, although the differences between the studies mean that the relative performance is uncertain. Comparison of the results for HFCS55 in the current study with those from the 2011 LCA for HFCS55 was hampered by significant methodological and data quality differences between these studies which make a direct comparison of the results less meaningful.
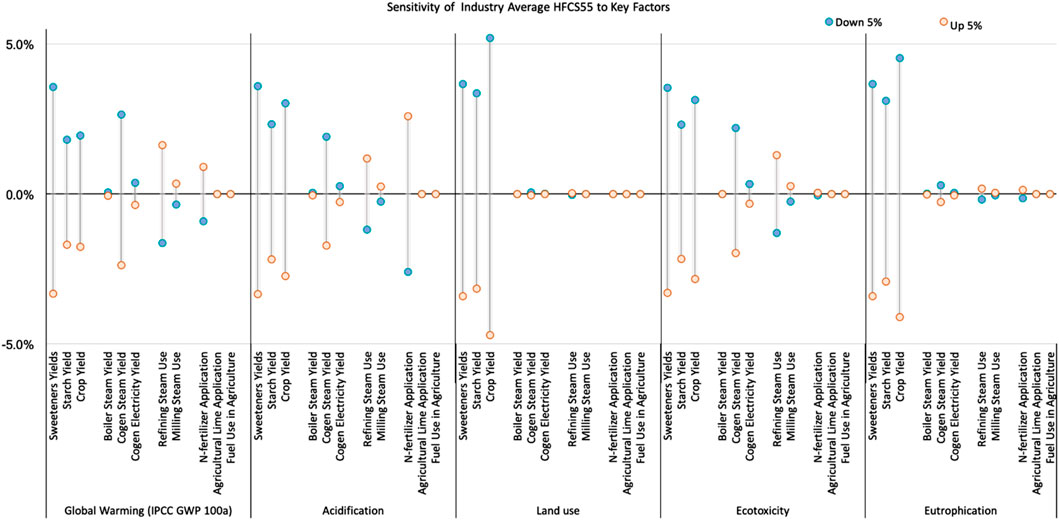
FIGURE 19. Comparison of HFCS55 global warming potential and fossil fuel use from this study (solid fill) with prior HFCS55 LCA results (separate, unreviewed study, pattern fill). Error bars on the industry values are the 10%ile-90%ile range. The scope of the studies differed in number and identity of participating sites, the modeling structure differed, and, importantly, the 2011 study considered use pre-allocated data for HFCS55 (primarily based on revenue share), while the current study includes additional products. The effect of process improvements between the two studies thus cannot be directly extracted. Data denoted by grey boxes is based upon 2011 LCA unpublished data using GREET.
Among other aspects, the current LCA went into greater detail in preparing a model of corn agriculture, including a greater scope and a finer level of detail about production methods by region, state, and/or county for corn, and modeling emissions, runoff and leeching using more specific parameters. This study also collected a much larger set of data on corn processing: starch milling and refining across more products, better reflecting the highly integrated wet milling and refining processes; analyzed that data over much more consistent subsets of the corn refining industry, and aggregated that data in a different manner, by production, than the previous study. There were also some differences in the participating sites. Most significantly, in 2011, companies supplied pre-allocated data for HFCS55 rather than modeling the combined process. The comparison in Figure 19 should be viewed considering the above caveats.
Data quality
The quality of the input data and consistency of treatment also influence interpretation of the relative performance. The aspects of data quality and system comparability are summarized in Table 5 where the level of detail and consistency of the data across stages can be compared. For each of the data quality parameters, the data used, and the updates applied are believed to be adequate to support the goal and scope of the study.
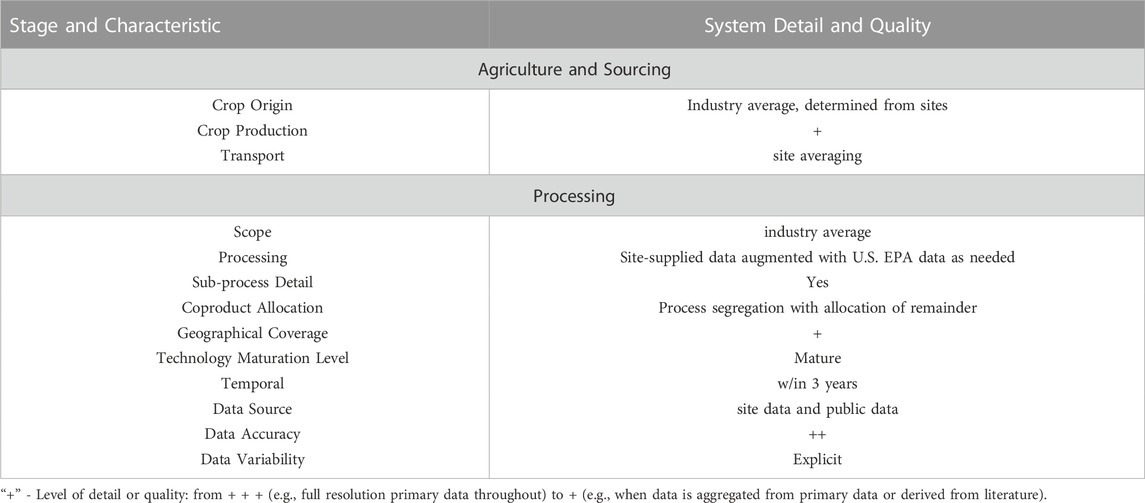
TABLE 5. Inventory overview - ISO data quality and consistency check.
Recommendations and moving forward
The results of this study indicate some opportunities for improvement in the environmental performance of CRA refineries, even across the variable configurations and for the industry as a whole. These include energy production and grain sourcing, as well as factors relating to data collection and consistency. Table 6 compiles the recommendations based on this LCA.
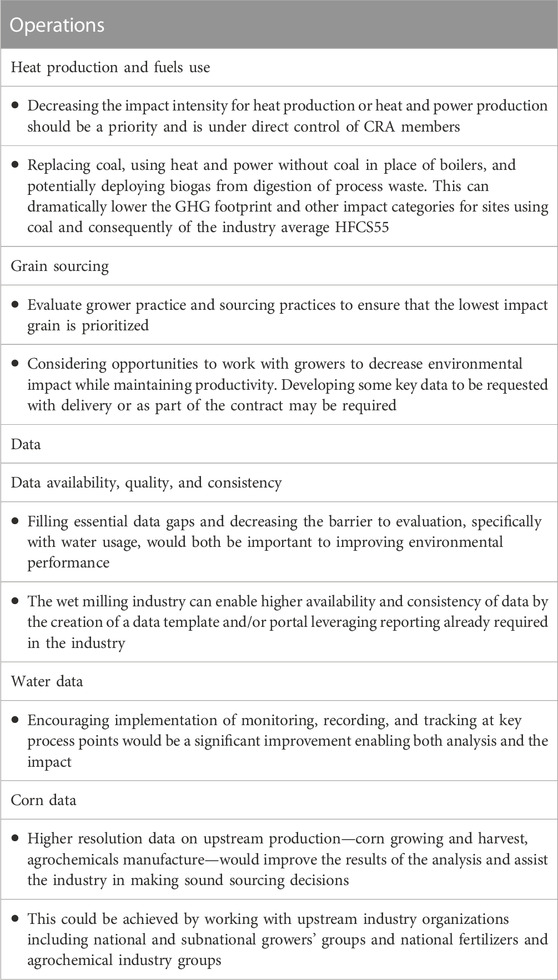
TABLE 6. Recommendations arising from the LCA.
Data are crucial to support continuing improvement of corn products and products derived from them. From the perspective of creating an LCA as well as from that of operational improvement, there are many opportunities for collecting better data within a corn refinery which might allow for a better attribution of process flows and emissions to specific products. Improving monitoring and collection of data on water consumption or water use through activities such as the installation of flow meters, or by creating a process model which would allow water use, and many other items of interest in an LCA, to be computed from the available data and physicochemical relationships. As a category of specifically identified as of increasing interest, the lack empirical data distinctly hinders optimization and improvement. Another area for improving data would be the collection of detailed data on the composition of flow streams within and coming out of the facilities, which could be used to assess opportunities for phosphorus capture and recovery among other things. A simplified data template that leverages data already necessary for compliance, normalizes process descriptions, and suggests consistent monitoring points for consistency would be valuable for utility of future analysis and tracking improvement on environmental factors. This could address the challenge in this analysis by decreasing effort to supply robust data while providing for some consistency to support future analysis and comparison back to earlier analysis to demonstrate improvements. It could also be linked to a simple tool for members to assess their performance against the average.
Because corn grain is such a large contribution to the total impact, it is an important element to consider for improvement. To do so, study results suggest benefits from sourcing grain preferentially from lower impact growers and requiring more data about the grain’s production, and looking for opportunities to support lower impact grain production.
Energy consumption during corn refining drives many of the impact potentials for the HFCS55 sweetener, and the use of coal plays a particularly significant role (Figure 20). Thus fuel choice and use is a powerful lever. Changing from coal intensive to a natural gas intensive corn milling and refining system, and, of more significant potential benefit, transition to biogas from process residues has significant potential to improve the sustainability of HFCS.
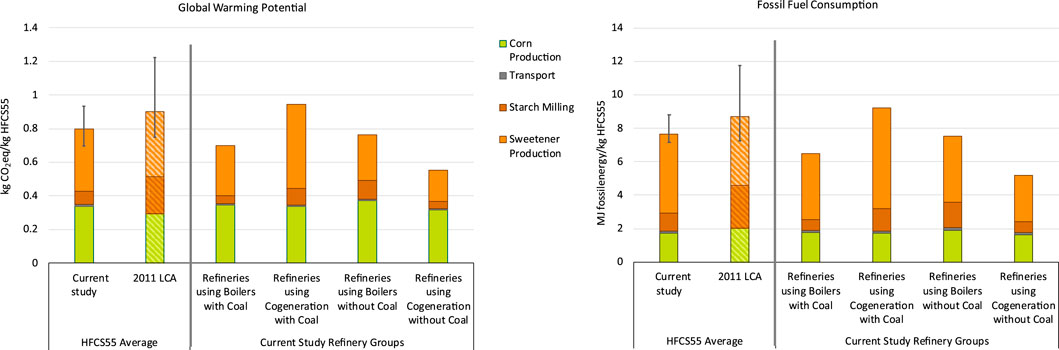
FIGURE 20. Comparison of HFCS55 global warming potential and fossil fuel use from this study (solid fill) with prior HFCS55 LCA results (separate, unreviewed study, pattern fill). Error bars on the industry values are the 10%ile-90%ile range. The scope of the studies differed in number and identity of participating sites, the modeling structure differed, and, importantly, the 2011 study considered use pre-allocated data for HFCS55 (primarily based on revenue share), while the current study includes additional products. The effect of process improvements between the two studies thus cannot be directly extracted. Data denoted by grey boxes is based upon 2011 LCA unpublished data using GREET.
Companies across the corn wet milling industry are engaging in sustainability initiatives to tackle two primary contributing factors to industry environmental impact: corn production and emissions from energy consumption. These goals, when looked at alongside the results of this study, are a potential indicator of the positive trend in reducing environmental impact across the corn wet milling industry. The longest-term goal regarding absolute GHG emissions and energy from one of these companies seeks to reduce absolute GHG emissions by 25% and energy intensity of operations by 15% by 2035. Looking to crop production in particular, many of these companies have engaged in partnerships with other food and agriculture industry organizations to reduce the environmental impact of corn sourcing. Among these goals, one corn wet milling company is seeking to “sustainably source” 100% of its primary crops across all operations by 2030.
Conclusion
This study explored the potential life cycle environmental impacts of the corn-based sweetener, HFCS55, at the industry level, developing detailed inventories for corn wet milling and starch refining based on primary data from 13 participating facilities in the continental U.S. It provides environmental impacts for HFCS55, HFCS42, DE95-100, corn germ, and corn gluten meal. Variation and uncertainty were found to be important in the sweeteners systems, due in part to the inherent variability of agricultural production and also to the number of sites producing HFCS55 and variation amongst them.
A detailed contribution and hotspot analysis of HFCS55 was completed to provide information on improvement opportunities for the corn refining industry and evaluate the impact of sustainability efforts. As part of the hotspot analysis, a structural analysis of the HFCS55 system was performed, indicating that defining a single ‘average’ HFCS55 is tenuous at best, due to differences in process configuration and fuels use. A significant contributor was the production and use of process heat and power, in particular the use of coal, which dominates the potential environmental impacts.
Energy consumption, specifically, coal usage, during corn refining contributes many of the impact potentials for the HFCS55 sweetener. Moving from coal to natural gas reduces GWP and will also reduce other impact categories that are heavily influenced by combustion by-products. Energy production, grain sourcing, and factors relating to data collection and consistency are possible areas for improvement in terms of environmental performance of refineries. Despite a goal to evaluate water use as an important category, the availability and quality of data available from the HFCS55 producers was not sufficient for substantive analysis.
The study identified opportunities for corn wet milling plants to work with members to encourage the use of lower carbon energy production systems, such as natural gas driven combined heat and power, solar thermal or photovoltaic, capture of waste heat, or generation of heat from processing residuals, as well as substitution with biogas produced from digestion of residues and waste, already found in some sites. It also identified opportunities to improve future impact assessments. These include opportunities to collect data within a corn refinery to potentially allow for a better attribution of process flows and emissions to specific products. More useful data on water consumption or water use through activities could be achieved through installation of flow meters and creating a process model which would allow water use, and many other items of interest in an LCA, to be computed from the available data and physicochemical relationships.
Future studies should explore energy replacement scenarios, include the use of biogas, in more detail, and address water impacts.
Data availability statement
The raw data supporting the conclusion of this article will be made available by the authors, without undue reservation.
Author contributions
CT conducted the analysis and drafted the manuscript, JM supervised the project and edited the manuscript, MM and KR edited the manuscript. All authors contributed to the article and approved the submitted version.
Acknowledgments
The authors gratefully acknowledge Dr Nathan Ayer of EarthShift Global for his very helpful comments and discussion in designing the study. The authors are also profoundly grateful for the commitment and substantial efforts of the staff at the CRA members’ participating sites who gathered data for this LCA.
Conflict of interest
CT was employed by EarthShift Global. JM was employed by Corn Refiners Association.
The authors declare that the research was conducted in the absence of any commercial or financial relationships that could be construed as a potential conflict of interest.
Publisher’s note
All claims expressed in this article are solely those of the authors and do not necessarily represent those of their affiliated organizations, or those of the publisher, the editors and the reviewers. Any product that may be evaluated in this article, or claim that may be made by its manufacturer, is not guaranteed or endorsed by the publisher.
Supplementary material
The Supplementary Material for this article can be found online at: https://www.frontiersin.org/articles/10.3389/fenrg.2023.1023561/full#supplementary-material
Footnotes
1The results and observations contained in this report are not intended to and do not state, suggest, or mean that HFCS and/or sugar is unsafe, toxic, poisonous, or contaminated with any impurities, or that the consumption of HFCS or sugar are uniquely responsible for any negative human health consequences.
2Although energy to heat the steepwater before water removal is unknown, vaporization uses far more energy than heating, and, thus, this provides a reasonable check on the interpolated values.
References
American Sugar Company (2018). Lime. Avaliable At:https://www.crystalsugar.com/media/18377/lime.pdf.
Blonk Consultants (2017). Agrifootprint 4.0. Database for U.S. crop production. Avaliable At:https://www.Agrifootprint.com.
Boulay, A. M., Bare, J., Benini, L., Berger, M., Lathuillière, M. J., Manzardo, A., et al. (2018). The WULCA consensus characterization model for water scarcity footprints: Assessing impacts of water consumption based on available water remaining (AWARE). Int’l J. Life Cycle Assess. 23, 368–378. doi:10.1007/s11367-017-1333-8
Boulay, A. M., Bulle, C., Bayart, J. B., Deschenes, L., and Margni, M. (2011). Regional characterization of freshwater use in LCA: Modeling direct impacts on human health. Environ. Sci. Technol. 45, 8948–8957. doi:10.1021/es1030883
Ciroth, A., Muller, S., Weidema, B. P., and Lesage, P. (2016). Empirically based uncertainty factors for the pedigree matrix in ecoinvent. Int’l J. Life Cycle Assess. 21 (9), 1338–1348. doi:10.1007/s11367-013-0670-5
Corn Naturally (2018). Scientific data/composition/relative sweetness of selected nutritive sweeteners. Available at: http://www.cornnaturally.com/hfcs-scientific-data/HFCS-Nutritional-Equivalencies/Composition (Accessed January 9, 2018).
Corn Refiners Association (CRA) (2017). About high fructose corn syrup. Available at:https://corn.org/products/sweeteners/high-fructose-corn-syrup/(Accessed December 12, 2017).
Corn Refiners Association (CRA) (2019). Industry overview 2019. Available at: https://corn.org/wp-content/uploads/2020/02/CRA-Industry-Overview-2019-Final.pdf (Accessed January 10, 2023).
Davidson, M. G., Elgie, S., Parsons, S., and Young, T. J. (2021). Production of HMF, FDCA and their derived products: A review of life cycle assessment (LCA) and techno-economic analysis (TEA) studies. Green Chem. 23, 3154–3171. doi:10.1039/D1GC00721A
de Azevedo, T., Costa Junior, C., Brandão, A., Cremer, M. d. S., Piatto, M., Tsai, D. S., et al. (2018). SEEG initiative estimates of Brazilian greenhouse gas emissions from 1970 to 2015. Sci. Data 5, 180045. doi:10.1038/sdata.2018.45
Di Noi, C., Ciroth, A., and Srocka, M. (2017). openLCA 1.7 comprehensive user manual. Berlin, Germany: GreenDelta GmbH. Available at: https://www.openlca.org/wp-content/uploads/2017/11/openLCA1.7_User_Manual_v1.1.pdf.
Eerhart, A. J. J. E., Faaij, A. P. C., and Patel, M. K. (2012). Replacing fossil based PET with biobased PEF; process analysis, energy and GHG balance. Energy Environ. Sci. 5, 6407–6422. doi:10.1039/C2EE02480B
Fabbri, S., Owsianiak, M., and Hauschild, M. Z. (2023). Evaluation of sugar feedstocks for bio-based chemicals: A consequential, regionalized life cycle assessment. GCB Bioenergy 15, 72–87. doi:10.1111/gcbb.13009
Flugge, M., Lewandrowski, J., Rosenfeld, J., Borland, C., Hendrickson, T., Jaglo, K., et al. (2017). A life-cycle analysis of the greenhouse gas emissions of corn-based ethanol. Report prepared by ICF under USDA Contract No. AG-3142-D-16-0243.
Frischknecht, R., Jungbluth, N., Althaus, H. J., Doka, G., Dones, R., Hischier, R., et al. (2007a). Implementation of life cycle impact assessment methods: Data v2.0 ecoinvent report No. 3. Switzerland: Swiss Centre for Life Cycle Inventories, Dubendorg.
Frischknecht, R., Jungbluth, N., Althaus, H. J., Doka, G., Dones, R., Hischier, R., et al. (2007b). The ecoinvent database: Overview and methodology. Dubendorf, CH: Swiss Centre for Life Cycle Inventories.
Goedkoop, M., Huijbregts, M. A. J., and Heijungs, R. (2009). ReCiPe 2008, A life cycle impact assessment method which comprises harmonized category indicators at the midpoint and the endpoint level. Minist. Volkshuisv. Ruimte Miieu.
Hannover, L, M., and White, J. S. (1993). Manufacturing, composition, and applications of fructose American. J. Clin. Nutr. 58, 724S–732S.
Hobbs, L. (2009). “Sweeteners from starch,” in Starch. Editors J. BeMiller, and R. Whistler (London, United Kingdom: Academic Press), 797–832.
Huijbregts, M. A. J., Steinmann, Z. I. N., Elshout, P. M. F., Stam, G., Verones, F., Vieira, M. D. M., et al. (2016). ReCiPe 2016: A harmonized life cycle impact assessment method at midpoint and endpoint level report I: Characterization. Nijmegen: Department of Environmental Science, Radbound University Nijmegen.
International Panel on Climate Change (IPCC) (2013). “IPCC fourth assessment report,” in The physical science basis (IPCC). Available at:http://www.ipcc.ch/ipccreports/ar4-wg1.htm.
International Panel on Climate Change (IPCC) (2006). IPCC guidelines for national greenhouse gas inventories. Available at:https://www.ipcc-nggip.iges.or.jp/public/2006gl/index.html.
International Panel on Climate Change (IPCC) (2019). IPCC national inventory reporting guidance 2019 refinement to the 2006 IPCC guidelines for national greenhouse gas inventories. Available at: https://www.ipcc-nggip.iges.or.jp/public/2019rf/index.html.
ISO (2006b). ISO 14044: Environmental management -- life cycle assessment -- requirements and guidelines. International Organization for Standardization.
ISO (2006a). ISO14040: Environmental management -- Life cycle assessment -- Principles and framework. International Organization for Standardization.
Jeswani, H. K., Burkinshaw, R., and Azapagic, A. (2015). Environmental sustainability issues in the food–energy–water nexus: Breakfast cereals and snacks. Sustain. Prod. Consum. 2, 17–28. doi:10.1016/j.spc.2015.08.001
Kis, F., Maravić, N., Kertesz, S., and Šereš, Z. I. (2019). Life cycle assessment of liquid inverted sugar and high-fructose corn syrup. Anal. Tech. Szeged. 13, 28–39. doi:10.14232/analecta.2019.1.28-39
Lee, U., Kwon, H., Wu, M., and Wang, M. (2021). Retrospective analysis of the U.S. Corn ethanol industry for 2005 – 2019: Implications for greenhouse gas emission reductions. Biofuels, Bioprod. Bioref. 15, 1318–1331. doi:10.1002/bbb.2225
Margni, M., Rossier, D., Crettaz, P., and Jolliet, O. (2002). Life cycle impact assessment of pesticides on human health and ecosystems. Agric. Ecosyst. Environ. 93, 379–392. doi:10.1016/S0167-8809(01)00336-X
Moreno, J., Iglesias, J., Blanco, J., Montero, M., Morales, G., and Melero, J. A. (2020). Life-cycle sustainability of biomass-derived sorbitol: Proposing technological alternatives for improving the environmental profile of a bio-refinery platform molecule. J. Clean. Prod. 250, 119568. doi:10.1016/j.jclepro.2019.119568
Nessi, S., Sinkko, T., Bulgheroni, C., Garbarino, E., Garcia-Gutierrez, P., Giuntoli, J., et al. (2022). Life Cycle Assessment (LCA) of alternative feedstocks for plastics production. Part 2, Illustrative case studies. Luxembourg: Publications Office of the European Union.
Ortiz-Reyes, E., and Anex, R. P. (2018). A life cycle impact assessment method for freshwater eutrophication due to the transport of phosphorus from agricultural production. J. Clean. Prod. 177, 474–482. doi:10.1016/j.jclepro.2017.12.255
Ortiz-Reyes, E., and Anex, R. (2020). Life cycle environmental impacts of non-cellulosic fermentable carbohydrates for the production of biofuels and chemicals. Int. J. Life Cycle Assess. 25, 548–563. doi:10.1007/s11367-019-01708-5
Pak, S. C., Ri, R. J., and Han, H. I. (2022). Life cycle-carbon footprints for environmental performance/labeling of crop-based food products: Analyses of complementary functional units and hotspots. Int. J. Environ. Sci. Technol. 20, 2375–2388. doi:10.1007/s13762-022-04174-z
Rosentrater, K. A., and Evers, A. D. (2018). “Wet milling: Separating starch, gluten (protein) and fibre,” in Kent’s technology of cereals: An introduction for students of food science and agriculture (London, United Kingdom: Woodhead Publishing).
Scully, M. J., Norris, G., Falconi, T. M. A., and MacIntosh, D. L. (2021). Carbon intensity of corn ethanol in the United States: State of the science. Environ. Res. Lett. 16, 043001. doi:10.1088/1748-9326/abde08
United States Department of Agriculture (2022). USDA economic research service. Avaliable At: https://www.ers.usda.gov/publications/pub-details/?pubid=93754.
United States Department of Agriculture (2018). USDA feed grains yearbook. Avaliable At: https://www.ers.usda.gov/data-products/feed-grains-database/feed-grains-yearbook-tables.
United States Department of Agriculture (2019). U.S. Sugar outlook august 2019. Avaliable At: https://www.ers.usda.gov/publications/pub-details/?pubid=93754.
United States Environmental Protection Agency (U.S.EPA) (2012). Tool for the reduction and assessment of chemical and other environmental impacts (TRACI): User's manual TRACI version 2.1. Software baseline documentation number S-10637-CP-2-0. Cincinnati, OH: Sustainable Technology Division, National Risk Management Research Laboratory, Office of Research and Development.
Wang, M., Wu, M., and Huo, H. (2007). Life-cycle energy and greenhouse gas emission impacts of different corn ethanol plant types. Environ. Res. Lett. 2, 024001. doi:10.1088/1748-9326/2/2/024001
Warncke, D., Bast, L., and Christenson, D. (2010). Lime for Michigan soils. Extension bulletin E-471 revised. Avaliable At: https://soil.msu.edu/wp-content/uploads/2014/06/Lime-for-MI-soils-E-471.pdf.
White, J. S., and Nicklas, T. A. (2016). “High fructose corn syrup use in beverages: Composition, manufacturing, properties, consumption, and health effects,” in Beverage impacts on health and nutrition. Editors T. Wilson, and N. J. Temple (Switzerland: Springer International Publishing), 285–301.
Xu, H., Lee, U., and Wang, M. (2022). Life-cycle greenhouse gas emissions reduction potential for corn ethanol refining in the USA. Biofuels Bioprod. Bioref 16, 671–681. doi:10.1002/bbb.2348
Keywords: life cycle assessment, environmental impacts, carbon footprint, corn milling, wet milling, sustainability assessment
Citation: Taylor C, Maroccia J, Masterson M and Rosentrater KA (2023) Comprehensive life cycle assessment of the corn wet milling industry in the United States. Front. Energy Res. 11:1023561. doi: 10.3389/fenrg.2023.1023561
Received: 19 August 2022; Accepted: 12 June 2023;
Published: 06 July 2023.
Edited by:
Quang-Vu Bach, University of Hawaii at Manoa, United StatesReviewed by:
Lara Moody, Institute for Feed Education and Research, United StatesPau Loke Show, University of Nottingham Malaysia Campus, Malaysia
Copyright © 2023 Taylor, Maroccia, Masterson and Rosentrater. This is an open-access article distributed under the terms of the Creative Commons Attribution License (CC BY). The use, distribution or reproduction in other forums is permitted, provided the original author(s) and the copyright owner(s) are credited and that the original publication in this journal is cited, in accordance with accepted academic practice. No use, distribution or reproduction is permitted which does not comply with these terms.
*Correspondence: Kurt A. Rosentrater, S2Fyb3NlbnRAaWFzdGF0ZS5lZHU=