 Boyu Liu
 Jun Yao*
- Research Center of Multiphase Flow in Porous Media, China University of Petroleum (East China), Qingdao, China
Dissolution trapping stands as a critical mechanism for the geological carbon storage (GCS) and can be notably improved through density-driven convection. However, to the best of the author’s knowledge, the discussion on density-driven convection of CO2-H2S mixture has been limited to the exclusion of intersected fractures and lithology sequence effects. Therefore, this study aims to systematically investigate the impact of H2S concentration, fractures, and lithology sequence on convective mixing. Four distinct mechanisms that influence convective mixing of CO2-H2S mixtures in the presence of fractures were identified: 1) accelerated downward solute transportation in fractures, 2) coalescence between plumes around fractures and primary down-swelling plumes, 3) high fracture conductivity inhibiting plume migration across fractures, and 4) upward flow in fractures facilitating the transport of high-concentration solute out of the system. Additionally, the effects of lithology sequence on the shape of CO2 plumes and the curve shape of the total flux at the top boundary were described. The results demonstrated that density-driven convection is enhanced with decreasing H2S concentration and increasing fracture interaction angle and fracture conductivity ratio. The magnitudes of density-driven convection, ranked from high to low, are fining downward, uniform, and fining upward lithology sequences. Furthermore, the H2S concentration affects the flow direction within fractures and alters the relative magnitude of the dimensionless concentration in the noise sequences. The findings of this study on a small scale were proven to be applicable on a large scale.
1 Introduction
The substantial increase in CO2 emissions resulting from the extensive utilization of fossil fuel-based energy sources has led to significant climate-related challenges since the advent of the industrial revolution (Kumar et al., 2020). As an effective strategy to mitigate net CO2 emissions, the implementation of CO2 capture and storage (CCS) technology has emerged as a promising solution (Zhao et al., 2023). Geological formations suitable for CO2 storage include saline aquifers, depleted oil and gas reservoirs, and oil and gas reservoirs under CO2-enhanced oil recovery (Hannis et al., 2017; Nguyen et al., 2018). Among these formations, saline aquifers have garnered particular interest due to their significant porosity and permeability, offering substantial storage capacity (Celia, 2017; Jia et al., 2023).
The injected CO2 in the saline aquifer is supercritical because saline aquifers usually exist at depths greater than 800 m (Bachu and Adams, 2003). The supercritical CO2 density varies between 266 and 766 kg/m3, while the water density is 945–1,230 kg/m3 (Adams and Bachu, 2010). Due to the buoyancy effect caused by the large density difference between Sc-CO2 and water, the Sc-CO2 rises upward until it reaches an impermeable caprock called structural trapping (Taku Ide et al., 2007). The structurally trapped Sc-CO2 then dissolves into brine through molecular diffusion, causing an increase in brine density from 0.1% to 1% depending on reservoir conditions such as pressure, temperature, and salinity (Ennis-King and Paterson, 2003). The higher density of CO2-saturated brine overlying fresh brine causes the instability of the system and finger-like CO2 plumes to form (Amooie et al., 2018). This process is called density-driven convection, which improves the amount of CO2 dissolved in brine by continuously replacing CO2-saturated brine with fresh brine so that fresh brine can be in constant contact with Sc-CO2 above (Farajzadeh et al., 2007; Hassanzadeh et al., 2007).
The co-injection of CO2 mixtures into deep saline aquifers has been a promising way to achieve capital and energy savings because separating CO2 from impure streams is an expensive and energy-consuming process (Knauss et al., 2005; Wang et al., 2011; Markewitz et al., 2012). Depending on whether the density of gas-saturated brine decreases or increases, co-injection of CO2 mixtures may delay or accelerate convective dissolution. Li and Jiang (2014) investigated the effects of nitrogen and sulfur dioxide impurities on convective dissolution. They stated that the nitrogen impurity hindered while the sulfur dioxide impurity enhanced the convective mixing. Liu et al. (2017) found that H2S had an inhibitive effect on convective mixing. However, the above studies ignored the double-diffusive effects on the onset of convection. Jafari Raad and Hassanzadeh (2016) first investigated double diffusive effects and stated that the diffusion contrast between CO2 and impurities resulted in a non-monotonic density profile. Kim and Song (2017) indicated that double diffusive effects had positive or negative effects on system stability depending on the diffusivity ratio, buoyancy ratio, and impurity concentration. The effects of CO2 mixtures on density-driven convection have been investigated through experimental studies. Mahmoodpour et al. (2020) conducted experiments under reservoir conditions, analyzing N2 mole fractions of 0%, 10%, 20%, and 100% with varying brine salinities. Their findings highlighted that the presence of N2 can either hinder or promote density-driven convection, depending on the mole fraction of N2. Li et al. (2023) performed experiments in Hele-Shaw cells, examining the influence of O2 and Ar as impurities. The results demonstrated that Ar impurities had the potential to enhance convective mixing, while O2 impurities were found to weaken convective mixing.
Formation heterogeneity also plays an essential role in convective mixing. In terms of heterogeneous permeability, Farajzadeh et al. (2011) investigated different flow regimes of density-driven convection with different magnitudes of permeability variance. Aggelopoulos and Tsakiroglou (2012) investigated the micro-heterogeneous permeability and showed that the micro-heterogeneity strengthened the convective mixing. Soltanian et al. (2016) investigated the effect of the facies-based heterogeneity on convective mixing and upgraded it to three dimensions. Concerning fractures, the effects of fracture angle, fracture density, fracture permeability, fracture aperture, fracture surface roughness, fracture-matrix permeability ratio, and intersected fractures on the convective mixing were investigated (Kim et al., 2019; Rezk and Foroozesh, 2019; Shafabakhsh et al., 2021). Numerous experimental studies have also been conducted to explore the impact of heterogeneous porous media on CO2 convective mixing. Agartan et al. (2015) conducted an experiment in heterogeneous media under atmospheric conditions, revealing that significant convective mixing may not exist in some formations, particularly in layered systems with low-permeability layers. Wang et al. (2021) observed that the sand layer initially affected by downward fingers plays a dominant role in finger evolution. Amarasinghe et al. (2020) conducted experiments under reservoir conditions (10 MPa and 50°C) and observed fingering in highly permeable porous media, whereas lower permeable porous media (500 mD) exhibited piston-like displacement.
Previous studies have separately examined the effects of impurity and heterogeneity on convective mixing. Nevertheless, it is imperative to consider the realistic scenario where CO2 mixtures are injected into heterogeneous formations. Therefore, the present work focuses on the co-injection of CO2-H2S in fractured and sequential saline aquifers. The study aims to elucidate how fractures and lithology sequences impact plume shape and the subsequent convective mixing rate. Additionally, the study analyzes how the effects of H2S concentration on convective mixing change in the presence of fractures and lithology sequences. The simulation model coupling the continuity equation, Darcy’s flow, and mass balance equation was developed based on COMSOL Multiphysics 5.6 (COMSOL, 2020).
This article is structured as follows. First, the governing equations and flash calculation process are detailed. Then, the model description and parameters are listed. The model is validated by the published results. Furthermore, the numerical results and discussion are provided, and the small-scale results are extended to the large scale. The main conclusions of the paper are presented at the end.
2 Methodology and model description
2.1 Governing equations
The governing equations for convective mixing include the continuity equation and the mass balance equation. The continuity equation in the porous medium is given by
Darcy’s velocity
Where
Where
Fluid density is a function of temperature, pressure, and component concentration. The density equation expressed by Diersch and Kolditz (2002) is used for simplicity.
Where
To account for the presence of fractures within the porous medium, the “Fracture Flow” interface available in COMSOL Multiphysics 5.6 was utilized. This interface utilizes tangential derivatives to characterize the flow along the interior boundaries. The flow in the fracture is governed by the continuity equation and the mass balance equation, represented as (COMSOL, 2020).
Where
COMSOL Multiphysics’ flash calculation at the thermodynamic interface was used to obtain CO2 and H2S concentrations at the top boundary, assuming local thermodynamic equilibrium. The Rachford-Rice equation (Rachford and Rice, 1952) is used to obtain the partitioning of different components into two phases given as:
Once the mole fraction of the liquid phase (
The dissolved H2S and CO2 compositions in the water phase are used as the top boundary conditions, as shown in Table 1. The average error between our results and the results from Li and Jiang (2020) is 1.3%, indicating that our results can be used in this study.
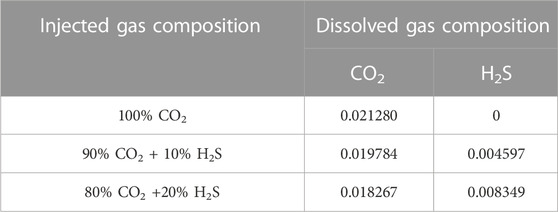
TABLE 1. The dissolved gas compositions at 10 Mpa and 45
2.2 Boundary and initial conditions
The domain boundaries are characterized to govern the flow and concentration behaviors. For the left, right, and bottom boundaries, impermeability is assumed, resulting in the following conditions:
At the top boundary, a constant pressure condition is implemented to satisfy the continuity equation:
To account for perturbations caused by CO2 injection or formation heterogeneity, a sine wave function is introduced. This function represents the concentrations of CO2 and H2S at the top boundary and is defined as
Where
Initially, the water phase contains no CO2 or H2S, and the pressure in the domain is equal to the pressure at the top boundary:
2.3 Model setup and simulation parameters
To investigate the density-driven convection, a two-dimensional domain below the gas-saturated brine layer was built using COMSOL Multiphysics 5.6, as shown in Figure 1A. Both the domain width and height were 1 m. The formation brine in the research domain was assumed to be pure water, and no gas was initially dissolved. All domain boundaries were assumed to be closed except the top boundary, which was assumed to be a constant concentration boundary. The CO2 and H2S concentrations are shown in Table 1. Other assumptions included the following: First, the top boundary was assumed to be sharp, and the two-phase transition zone caused by capillary pressure was ignored (Emami-Meybodi et al., 2015). Second, the free gas mixture above the top boundary was assumed to be abundant, so the pressure change due to the dissolution of the gas mixture was ignored, and the top boundary was kept gas-saturated (Li and Jiang, 2020). Third, the domain was assumed to be isothermal (Islam et al., 2014).
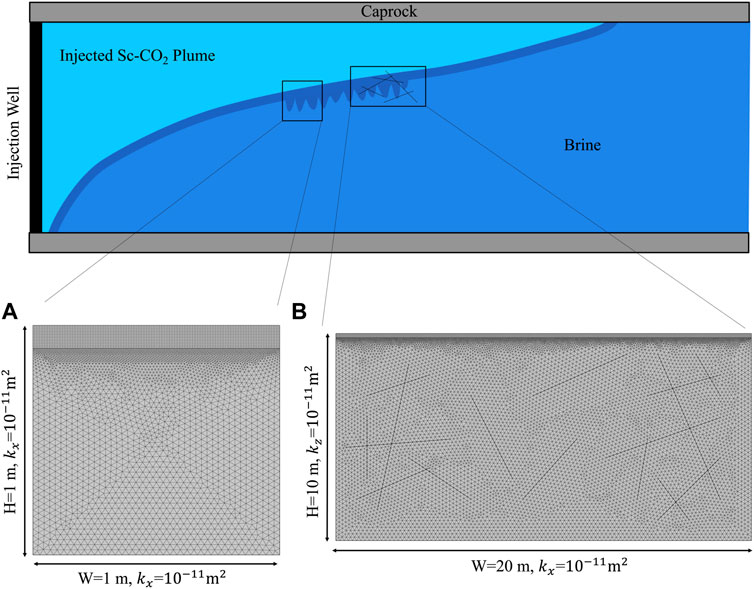
FIGURE 1. Schematic illustration of (A) small-scale domain, and (B) large-scale domain with intersected fractures.
To simulate the convective dissolution problem, the “Darcy’s flow” interface and the “transport of diluted species in porous media” interface were coupled. To accurately capture the diffusive behavior during the early stages, it is necessary to ensure that the grid size near the top boundary is smaller than the critical thickness of the diffusive boundary layer at the onset of convection. The critical thickness, denoted as L, can be calculated using the equation
TABLE 2. Simulation parameters.
2.4 Measurements of convective dissolution
Four measurable parameters were defined to study the dynamic behavior of convective dissolution. The first parameter is dimensionless spatial concentration, which quantifies the extent of CO2 dissolved in water calculated by
This parameter is analyzed versus the dimensionless time represented by
Where
The second parameter is the total mass flux at the top boundary (
The third parameter is the Rayleigh number (Ra), which measures the magnitude of convective flow to diffusive flow, represented by
The fourth parameter is the Sherwood number (
3 Results and discussion
3.1 Measurements of convective dissolution
To study the effects of H2S concentration on convective mixing, three H2S concentrations (0%, 10%, and 20%) were designed. The typical features of CO2 plume development and curve are explained using the 0% H2S case as an example. As Figures 2, 3 show, from
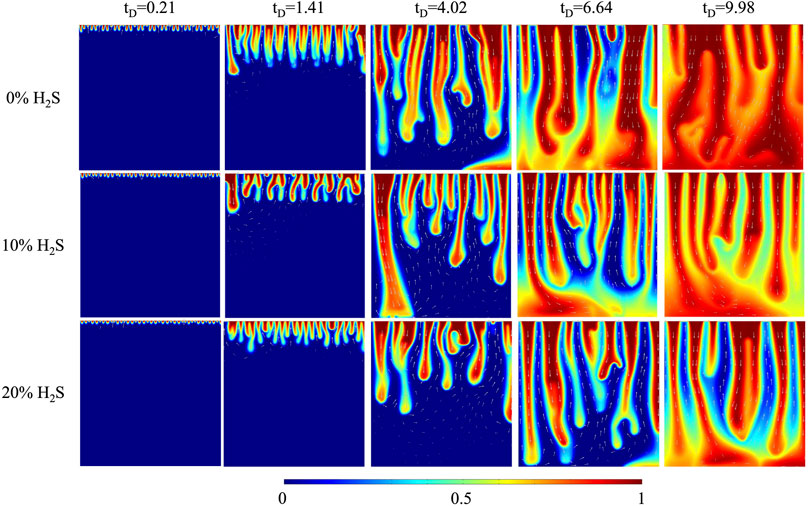
FIGURE 2. The comparison of CO2 plume development for three H2S concentration cases.
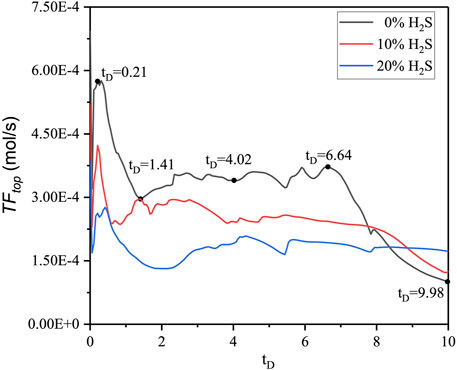
FIGURE 3. The comparison of
The density difference between gas-saturated and gas-free water, the Rayleigh number, the dimensionless CO2 concentration at
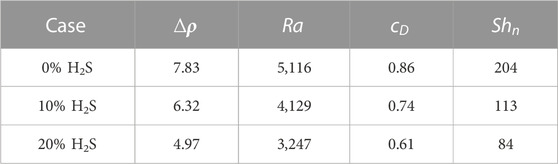
TABLE 3. Results for different H2S concentration cases.
3.2 Effects of fracture intersection angle (
This section analyzed the effects of three fracture intersection angles (30
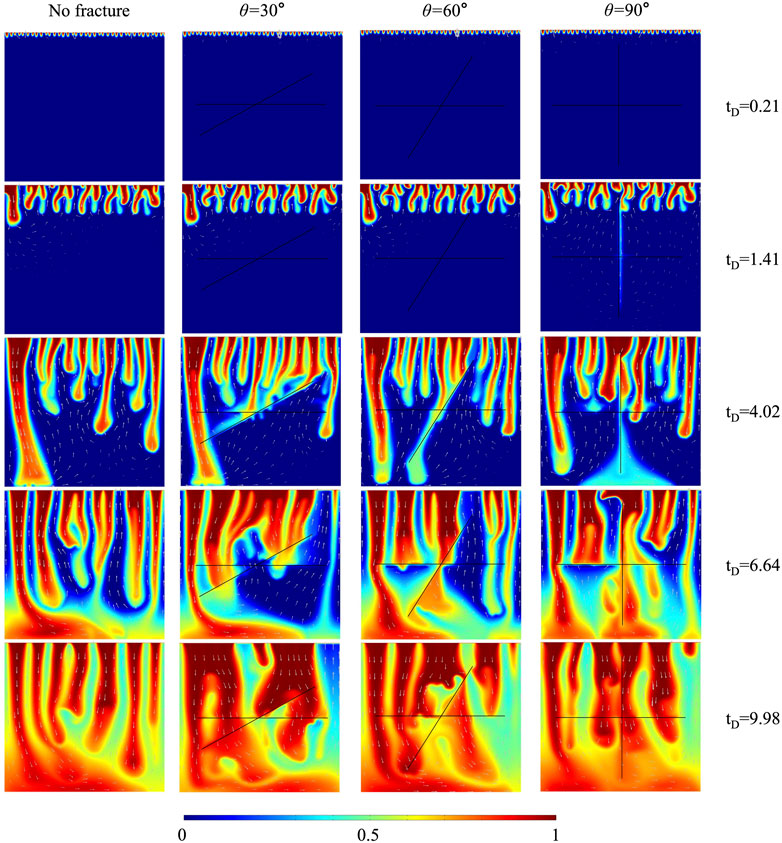
FIGURE 4. The comparison of CO2 plume development between cases with three fracture intersection angles and case without fracture for 10% H2S concentration.
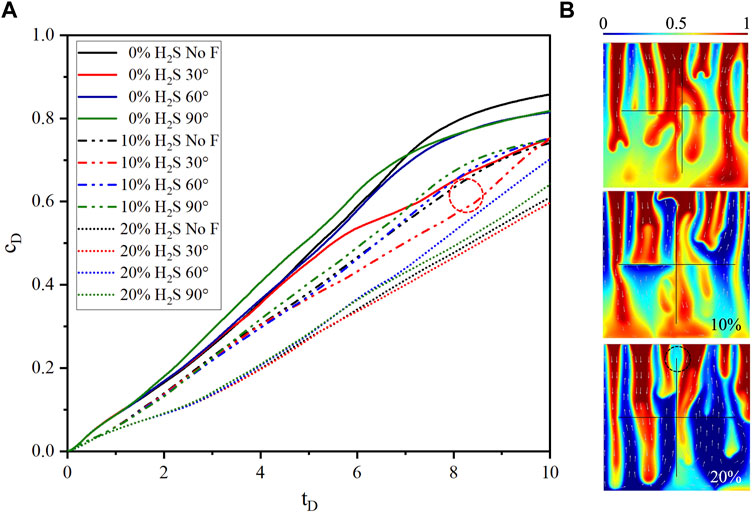
FIGURE 5. (A) The comparison of dimensionless CO2 concentration between cases with three fracture intersection angles and case without fracture for 10% H2S concentration. (B) CO2 plume shapes of three H2S concentrations at
The dimensionless CO2 concentration difference between the case without fracture (10% H2S) and the case of
In conclusion, four aspects of the influence mechanisms of intersected fractures on convective mixing are discussed. Fractures enhance convective mixing by accelerating downward solute transportation. The coalescence between merged plumes around fractures and main down-swelling plumes delays the convective mixing. The high fracture conductivity prevents plumes from flowing across fractures, hindering convective mixing. The upward flow in fractures delays convective mixing by transporting high-concentration solute out of the domain. These four mechanisms determine whether intersected fractures enhance or delay convective mixing.
3.3 Effects of fracture conductivity ratio (
The fracture conductivity ratio (
The impact of fracture conductivity ratio on CO2 plume development in 10% H2S concentration cases is shown in Figure 6. The solute in the vertical fracture transports relatively slowly in the case of
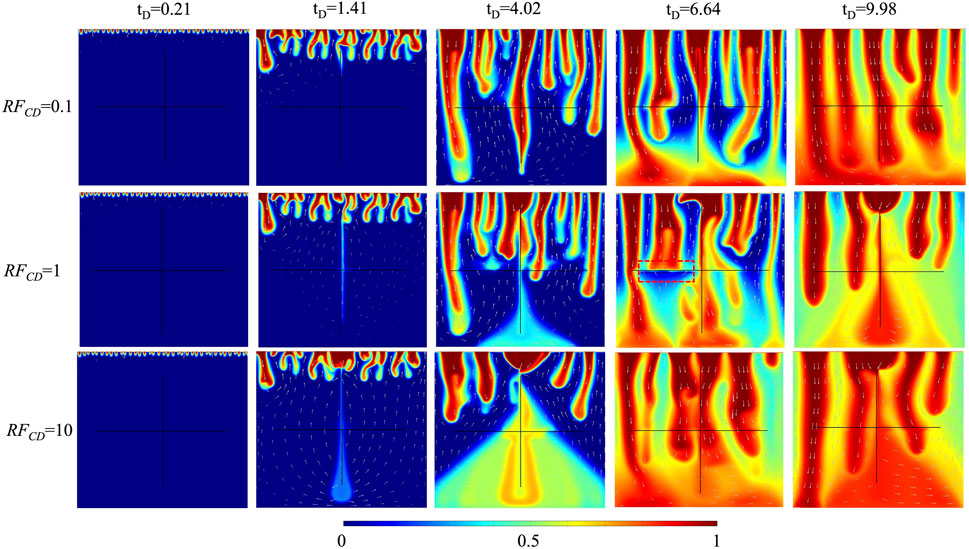
FIGURE 6. The comparison of CO2 plume development of three fracture conductivity ratios for 10% H2S concentration.
The comparison of dimensionless CO2 concentrations and Sherwood numbers of three fracture conductivity ratios (
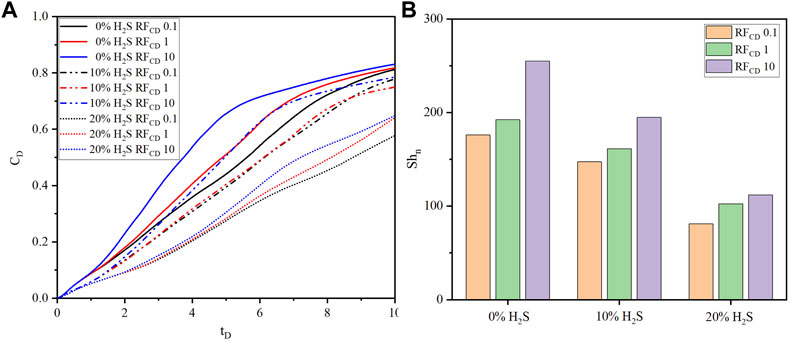
FIGURE 7. The comparison of (A) dimensionless CO2 concentration, and (B) Sherwood number of three fracture conductivity ratios (
3.4 Effects of lithology sequence
The grain size sequence controlled by hydrodynamic conditions results in sedimentary formation with spatial variation in permeability. Generally, stronger hydrodynamic conditions tend to induce the deposition of coarse grains and higher permeability formations (Jin et al., 2020). The typical lithology sequences include the uniform, fining upward, fining upward with noise, fining downward, and fining downward with noise, as described in Figure 8A. In this study, the permeability contrast was set to 3. The highest permeability was
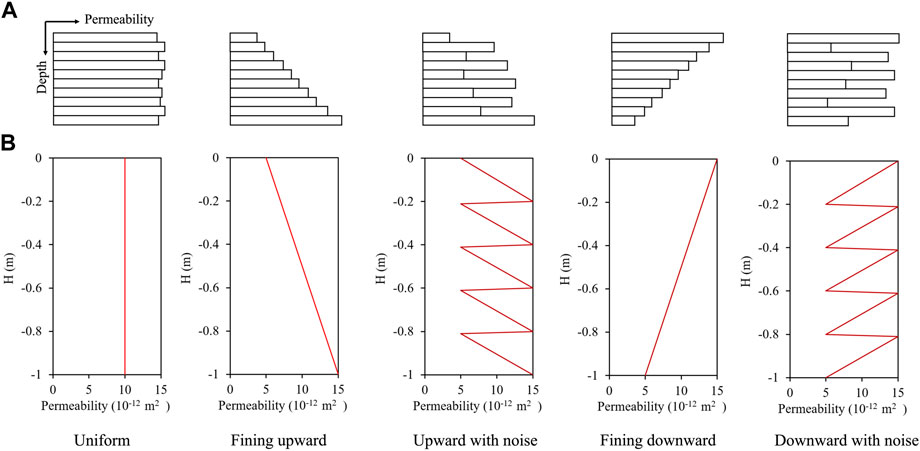
FIGURE 8. (A) The description of five typical lithology sequences, including the uniform, fining upward, fining upward with noise, fining downward and fining downward with noise sequences. (B) The permeability variations of five modelled lithology sequences.
Figure 9 shows the CO2 plume developments of different lithology sequences for 10% H2S concentration. The plume shapes are different among uniform, fining upward, and fining downward cases. The plumes of fining upward sequence do not merge until the main plumes hit the bottom boundary, which creates many thin and long fingers. This is because the downward permeability is higher than the horizontal permeability, making plumes prefer to flow downward. The lower permeability near the top boundary limits convective mixing, which causes the dimensionless CO2 concentration of fining upward sequence to be lower than that of uniform sequence. On the contrary, the plumes of fining downward sequence start merging earlier than the plumes of uniform sequence, and strong fingers are created. The reason is that plumes tend to flow horizontally because the downward permeability is lower than the horizontal permeability. The higher permeability near the top boundary facilitates the convective mixing and increases the dimensionless CO2 concentration. The fining upward with noise sequence accelerates the merging compared to the fining upward sequence, while the fining downward with noise sequence delays the merging compared to the fining downward sequence, given that the increased number of noise layers results in a higher permeability change gradient near the top boundary. Besides, the layered structures of CO2 plume developments are identified in the noise sequences.
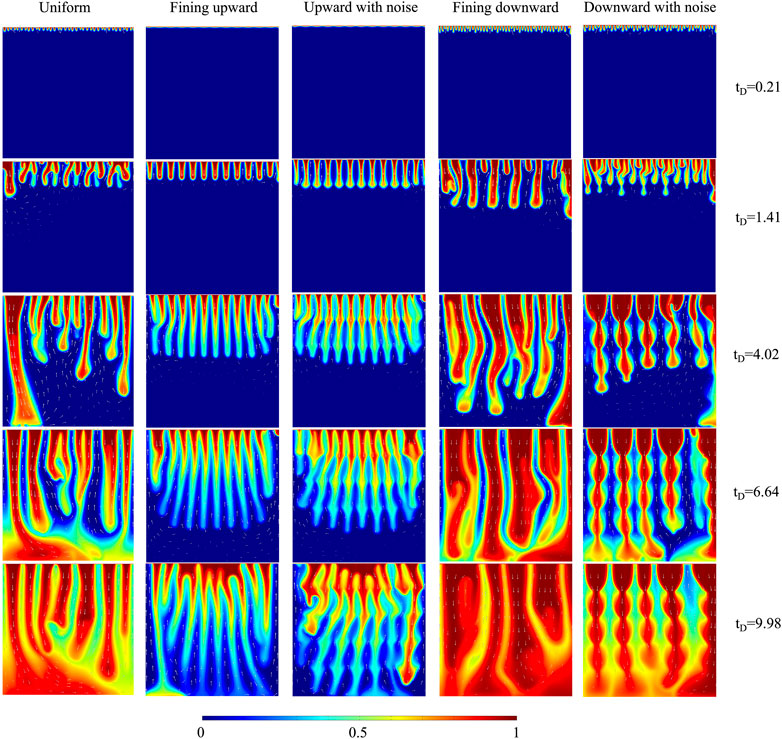
FIGURE 9. The comparison of CO2 plume development of five lithology sequences for 10% H2S concentration.
The magnitudes of dimensionless concentration, ranked from high to low, are fining downward, uniform, and fining upward lithology sequences, as shown in Figure 10A. The distinction between fining upward and upward with noise, as well as between fining downward and downward with noise, becomes more pronounced with an increase in H2S concentration. This observation can be attributed to the interplay between density-driven convection and the effect of the noise sequence. When the H2S concentration is low, density-driven convection is prominent, diminishing the impact of the noise sequence. Conversely, a high H2S concentration leads to a delay in density-driven convection, amplifying the effect of the noise sequence. The curve shapes of
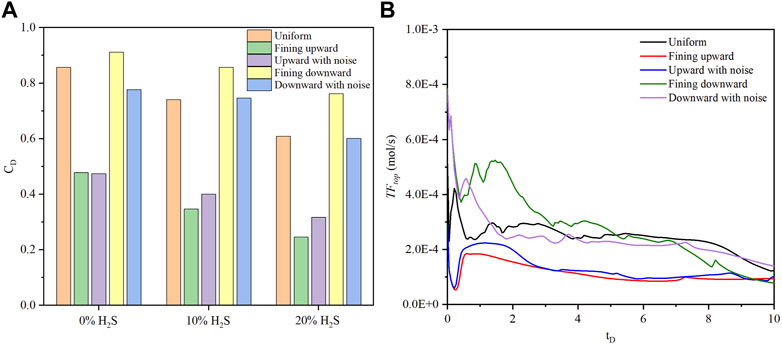
FIGURE 10. The comparison of (A) dimensionless CO2 concentration of five lithology sequences for three H2S concentrations (0%, 10%, and 20%) at
3.5 Effects of domain scale
Six large-scale cases with 20 m in width and 10 m in height were run to investigate the scale effect on density-driven convection. The relative parameters are shown in Table 4. The matrix porosity and permeability were set to 0.2 and
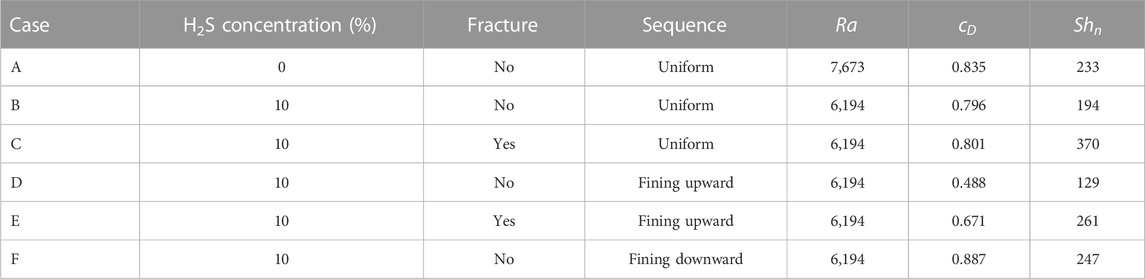
TABLE 4. Parameters and results for six large scale cases.
The plume developments of cases B and C are shown in Figure 11. When case B is compared to the case with 10% H2S concentration in Figure 2, the plume developments with dimensionless time are similar, demonstrating the applicability of small-scale results to large-scale. At
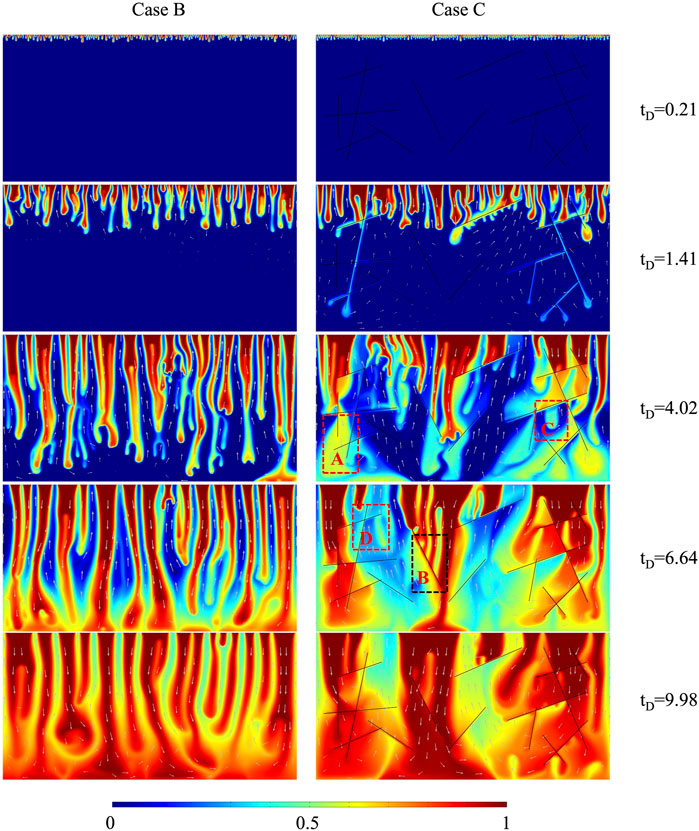
FIGURE 11. Temporal CO2 plume developments of Case B and C.
The dimensionless CO2 concentration and Sherwood number for six large-scale cases at
4 Conclusion
The effects of impurities on density-driven convection have been widely discussed without considering the effects of fracture and lithology sequence. This work addressed this gap through numerical simulations built on COMSOL Multiphysics. The effects of H2S concentration, fracture interaction angle, fracture conductivity ratio, and lithology sequence on the density-driven convection were investigated. The following are the findings:
1. The increase in H2S concentration delays the onset time of each flow regime and decreases the
2. Four influence mechanisms of fractures on convective mixing are identified, including the accelerated downward solute transportation in fractures, which enhances convective mixing; the coalescence between plumes around fractures and the main down-swelling plumes, which delays convective mixing; the high fracture conductivity preventing plumes from flowing across fractures, which hinders convective mixing below fractures; and the upward flow in fractures transporting high-concentration solute out of the domain, which delays convective mixing.
3. The dimensionless CO2 concentration increases with the fracture intersection angle due to the delayed coalescence between the merged central plume and left plume and increases with the fracture conductivity ratio because of the accelerated downward solute transportation. Besides, the H2S concentration changes the effects of fractures because the flow direction in fractures changes with the H2S concentration.
4. The CO2 plume shapes and
5. The magnitudes of dimensionless concentration, ranked from high to low, are fining downward, uniform, and fining upward lithology sequences. The distinction between fining upward and upward with noise, as well as between fining downward and downward with noise, becomes more pronounced with an increase in H2S concentration.
6. Large-scale cases are designed to extend small-scale results to a large scale. Both the plume development with dimensionless time and the order of dimensionless concentration on a large scale are the same as those on a small scale. Besides, four influence mechanisms of fractures on convective mixing observed on a small scale are also identified on a large scale. Therefore, the deductions made on a small scale are applicable on a large scale.
Data availability statement
The datasets presented in this study can be found in online repositories. The names of the repository/repositories and accession number(s) can be found below: Datasets related to this article can be found at http://doi.org/10.5281/zenodo.6899947, an open-source online data repository hosted at Zenodo (Liu, 2022).
Author contributions
BL: Conceptualization, validation, methodology, software, investigation, and writing-original draft. JY: Writing-review and editing, supervision, project administration, funding acquisition. All authors contributed to the article and approved the submitted version.
Funding
This work was supported by the National Natural Science Foundation of China (Grant Number: 52034010).
Conflict of interest
The authors declare that the research was conducted in the absence of any commercial or financial relationships that could be construed as a potential conflict of interest.
Publisher’s note
All claims expressed in this article are solely those of the authors and do not necessarily represent those of their affiliated organizations, or those of the publisher, the editors and the reviewers. Any product that may be evaluated in this article, or claim that may be made by its manufacturer, is not guaranteed or endorsed by the publisher.
Supplementary material
The Supplementary Material for this article can be found online at: https://www.frontiersin.org/articles/10.3389/fenrg.2023.1241672/full#supplementary-material
References
Adams, J. J., and Bachu, S. (2010). Equations of state for basin geofluids: algorithm review and intercomparison for brines. Geofluids 2 (4), 257–271. doi:10.1046/j.1468-8123.2002.00041.x
Agartan, E., Trevisan, L., Cihan, A., Birkholzer, J., Zhou, Q., and Illangasekare, T. H. (2015). Experimental study on effects of geologic heterogeneity in enhancing dissolution trapping of supercritical CO2. Water Resour. Res. 51 (3), 1635–1648. doi:10.1002/2014WR015778
Aggelopoulos, C. A., and Tsakiroglou, C. D. (2012). Effects of micro-heterogeneity and hydrodynamic dispersion on the dissolution rate of carbon dioxide in water-saturated porous media. Int. J. Greenh. Gas Control 10, 341–350. doi:10.1016/j.ijggc.2012.06.012
Amarasinghe, W., Fjelde, I., Rydland, J.-Å., and Guo, Y. (2020). Effects of permeability on CO2 dissolution and convection at reservoir temperature and pressure conditions: A visualization study. Int. J. Greenh. Gas Control 99, 103082. doi:10.1016/j.ijggc.2020.103082
Amooie, M. A., Soltanian, M. R., and Moortgat, J. (2018). Solutal convection in porous media: comparison between boundary conditions of constant concentration and constant flux. Phys. Rev. E 98 (3), 033118. doi:10.1103/physreve.98.033118
Bachu, S., and Adams, J. J. (2003). Sequestration of CO2 in geological media in response to climate change: capacity of deep saline aquifers to sequester CO2 in solution. Energy Convers. Manag. 44 (20), 3151–3175. doi:10.1016/s0196-8904(03)00101-8
Celia, M. A. (2017). Geological storage of captured carbon dioxide as a large-scale carbon mitigation option. Water Resour. Res. 53 (5), 3527–3533. doi:10.1002/2017wr020841
Diersch, H. J. G., and Kolditz, O. (2002). Variable-density flow and transport in porous media: approaches and challenges. Adv. Water Resour. 25 (8), 899–944. doi:10.1016/S0309-1708(02)00063-5
Emami-Meybodi, H., Hassanzadeh, H., Green, C. P., and Ennis-King, J. (2015). Convective dissolution of CO2 in saline aquifers: progress in modeling and experiments. Int. J. Greenh. Gas Control 40, 238–266. doi:10.1016/j.ijggc.2015.04.003
Ennis-King, J. P., and Paterson, L. (2003). Role of convective mixing in the long-term storage of carbon dioxide in deep saline formations. Spe J. 10 (03), 349–356. doi:10.2118/84344-pa
Ennis-King, J., Preston, I., and Paterson, L. (2005). Onset of convection in anisotropic porous media subject to a rapid change in boundary conditions. Phys. Fluids 17, 084107. doi:10.1063/1.2033911
Farajzadeh, R., Ranganathan, P., Zitha, P. L. J., and Bruining, J. (2011). The effect of heterogeneity on the character of density-driven natural convection of CO2 overlying a brine layer. Adv. Water Resour. 34 (3), 327–339. doi:10.1016/j.advwatres.2010.12.012
Farajzadeh, R., Salimi, H., Zitha, P., and Bruining, J. (2007). Numerical simulation of density-driven natural convection in porous media with application for CO2 injection projects. Int. J. Heat Mass Transf. 50 (25-26), 5054–5064. doi:10.1016/j.ijheatmasstransfer.2007.08.019
Hannis, S., Lu, J., Chadwick, A., Hovorka, S., Kirk, K., Romanak, K., et al. (2017). CO2 storage in depleted or depleting oil and gas fields: what can we learn from existing projects? Energy Procedia 114, 5680–5690. doi:10.1016/j.egypro.2017.03.1707
Hassanzadeh, H., Pooladi-Darvish, M., and Keith, D. W. (2007). Scaling behavior of convective mixing, with application to geological storage of CO2. AIChE J. 53 (5), 1121–1131. doi:10.1002/aic.11157
Islam, A., Korrani, A. K. N., Sepehrnoori, K., and Patzek, T. (2014). Effects of geochemical reaction on double diffusive natural convection of CO2 in brine saturated geothermal reservoir. Int. J. Heat Mass Transf. 77, 519–528. doi:10.1016/j.ijheatmasstransfer.2014.05.040
Jafari Raad, S. M., and Hassanzadeh, H. (2016). Does impure CO2 impede or accelerate the onset of convective mixing in geological storage? Int. J. Greenh. Gas Control 54, 250–257. doi:10.1016/j.ijggc.2016.09.011
Jia, C., Ren, B., Sepehrnoori, K., Delshad, M., Liu, B., Sun, H., et al. (2023). Numerical studies of hydrogen buoyant flow in storage aquifers. Fuel 349, 128755. doi:10.1016/j.fuel.2023.128755
Jin, G., Liu, J., Liu, L., Zhai, H., Wu, D., and Xu, T. (2020). Effect of lithological rhythm on gas production performance via depressurization through a vertical well in a confined hydrate reservoir. Mar. Petroleum Geol. 122, 104696. doi:10.1016/j.marpetgeo.2020.104696
Kim, M. C., and Song, K. H. (2017). Effect of impurities on the onset and growth of gravitational instabilities in a geological CO2 storage process: linear and nonlinear analyses. Chem. Eng. Sci. 174, 426–444. doi:10.1016/j.ces.2017.09.038
Kim, M., Kim, K.-Y., Han, W. S., Oh, J., and Park, E. (2019). Density-driven convection in a fractured porous media: implications for geological CO2 storage. Water Resour. Res. 55 (7), 5852–5870. doi:10.1029/2019WR024822
Knauss, K. G., Johnson, J. W., and Steefel, C. I. (2005). Evaluation of the impact of CO2, co-contaminant gas, aqueous fluid and reservoir rock interactions on the geologic sequestration of CO2. Chem. Geol. 217 (3), 339–350. doi:10.1016/j.chemgeo.2004.12.017
Kumar, S., Foroozesh, J., Edlmann, K., Rezk, M. G., and Lim, C. Y. (2020). A comprehensive review of value-added CO2 sequestration in subsurface saline aquifers. J. Nat. Gas Sci. Eng. 81, 103437. doi:10.1016/j.jngse.2020.103437
Li, D. D., Zhong, Y. H., and Jiang, X. (2023). Experimental study of impurity effects on convective mixing in Hele-Shaw cell with application to CO2 geological sequestration. Adv. Water Resour. 172, 104379. Article 104379. doi:10.1016/j.advwatres.2023.104379
Li, D., and Jiang, X. (2014). A numerical study of the impurity effects of nitrogen and sulfur dioxide on the solubility trapping of carbon dioxide geological storage. Appl. Energy 128, 60–74. doi:10.1016/j.apenergy.2014.04.051
Li, D., and Jiang, X. (2020). Numerical investigation of convective mixing in impure CO2 geological storage into deep saline aquifers. Int. J. Greenh. Gas Control 96, 103015. doi:10.1016/j.ijggc.2020.103015
Liu, B. (2022). Effects of impurity on the density-driven convection of CO2 in fractured and rhythmic saline aquifers. doi:10.5281/zenodo.6899947
Liu, Y., Ding, T., Yu, B., and Yang, Y. (2017). Convective dissolution analysis of long-term storage of acid gas in saline aquifers. Energy Procedia 114, 3417–3431. doi:10.1016/j.egypro.2017.03.1473
Mahmoodpour, S., Amooie, M. A., Rostami, B., and Bahrami, F. (2020). Effect of gas impurity on the convective dissolution of CO2 in porous media. Energy 199, 117397. doi:10.1016/j.energy.2020.117397
Mahmoodpour, S., Rostami, B., and Emami-Meybodi, H. (2018). Onset of convection controlled by N2 impurity during CO2 storage in saline aquifers. Int. J. Greenh. Gas Control 79, 234–247. doi:10.1016/j.ijggc.2018.10.012
Markewitz, P., Kuckshinrichs, W., Leitner, W., Linssen, J., Zapp, P., Bongartz, R., et al. (2012). Worldwide innovations in the development of carbon capture technologies and the utilization of CO2. Energy Environ. Sci. 5, 7281–7305. doi:10.1039/c2ee03403d
Millington, R. J., and Quirk, J. p. (1961). Permeability of porous solids. Trans. Faraday Soc. 57, 1200–1207. doi:10.1039/tf9615701200
Nguyen, P., Carey, J. W., Viswanathan, H. S., and Porter, M. (2018). Effectiveness of supercritical-CO2 and N2 huff-and-puff methods of enhanced oil recovery in shale fracture networks using microfluidic experiments. Appl. Energy 230, 160–174. doi:10.1016/j.apenergy.2018.08.098
Rachford, H. H., and Rice, J. D. (1952). Procedure for use of electronic digital computers in calculating flash vaporization hydrocarbon equilibrium. J. Petroleum Technol. 4 (10), 19–3. doi:10.2118/952327-g
Rezk, M. G., and Foroozesh, J. (2019). Study of convective-diffusive flow during CO2 sequestration in fractured heterogeneous saline aquifers. J. Nat. Gas Sci. Eng. 69, 102926. doi:10.1016/j.jngse.2019.102926
Shafabakhsh, P., Ataie-Ashtiani, B., Simmons, C. T., Younes, A., and Fahs, M. (2021). Convective-reactive transport of dissolved CO2 in fractured-geological formations. Int. J. Greenh. Gas Control 109, 103365. doi:10.1016/j.ijggc.2021.103365
Slim, A. C. (2014). Solutal-convection regimes in a two-dimensional porous medium. J. Fluid Mech. 741, 461–491. doi:10.1017/jfm.2013.673
Soltanian, M. R., Amooie, M. A., Dai, Z., Cole, D., and Moortgat, J. (2016). Critical dynamics of gravito-convective mixing in geological carbon sequestration. Sci. Rep. 6 (1), 35921. doi:10.1038/srep35921
Taku Ide, S., Jessen, K., and Orr, F. M. (2007). Storage of CO2 in saline aquifers: effects of gravity, viscous, and capillary forces on amount and timing of trapping. Int. J. Greenh. Gas Control 1 (4), 481–491. doi:10.1016/S1750-5836(07)00091-6
Wang, J., Ryan, D., Anthony, E. J., Wildgust, N., and Aiken, T. (2011). Effects of impurities on CO2 transport, injection and storage. Energy Procedia 4, 3071–3078. doi:10.1016/j.egypro.2011.02.219
Wang, S., Cheng, Z., Zhang, Y., Jiang, L., Liu, Y., and Song, Y. (2021). Unstable density-driven convection of CO2 in homogeneous and heterogeneous porous media with implications for deep saline aquifers. Water Resour. Res. 57 (3), e2020WR028132. doi:10.1029/2020WR028132
Zhao, K., Jia, C., Li, Z., Du, X., Wang, Y., Li, J., et al. (2023). Recent advances and future perspectives in carbon capture, transportation, utilization, and storage (cctus) technologies: A comprehensive review. Fuel 351, 128913. doi:10.1016/j.fuel.2023.128913
Zhao, Y., Wang, W., Guo, R., Wang, W., Zhu, Y., Wang, R., et al. (2021). Relation of heterogeneity and gas-bearing capacity of tight sandstone: A case study of the upper paleozoic tight gas sandstone reservoir in the southeast of the ordos basin. ACS Omega 6 (24), 15716–15726. doi:10.1021/acsomega.1c00965
Keywords: CO2 storage, solubility trapping, natural convection, heterogeneous formation, supercritical CO2
Citation: Liu B and Yao J (2023) Numerical study on density-driven convection of CO2-H2S mixture in fractured and sequential saline aquifers. Front. Energy Res. 11:1241672. doi: 10.3389/fenrg.2023.1241672
Received: 17 June 2023; Accepted: 04 August 2023;
Published: 14 August 2023.
Edited by:
Bo Ren, The University of Texas at Austin, United StatesReviewed by:
Cunqi Jia, The University of Texas at Austin, United StatesVarvara Sygouni, University of Patras, Greece
Ye Tian, Southwest Petroleum University, China
Copyright © 2023 Liu and Yao. This is an open-access article distributed under the terms of the Creative Commons Attribution License (CC BY). The use, distribution or reproduction in other forums is permitted, provided the original author(s) and the copyright owner(s) are credited and that the original publication in this journal is cited, in accordance with accepted academic practice. No use, distribution or reproduction is permitted which does not comply with these terms.
*Correspondence: Jun Yao, cmNvZ2ZyX3VwY0AxMjYuY29t