 Filip Stefaniak
- Laboratory of Bioinformatics and Protein Engineering, International Institute of Molecular and Cell Biology in Warsaw, Warsaw, Poland
Toxicity evaluation of newly synthesized or used compounds is one of the main challenges during product development in many areas of industry. For example, toxicity is the second reason—after lack of efficacy—for failure in preclinical and clinical studies of drug candidates. To avoid attrition at the late stage of the drug development process, the toxicity analyses are employed at the early stages of a discovery pipeline, along with activity and selectivity enhancing. Although many assays for screening in vitro toxicity are available, their massive application is not always time and cost effective. Thus, the need for fast and reliable in silico tools, which can be used not only for toxicity prediction of existing compounds, but also for prioritization of compounds planned for synthesis or acquisition. Here I present the benchmark results of the combination of various attribute selection methods and machine learning algorithms and their application to the data sets of the Tox21 Data Challenge. The best performing method: Best First for attribute selection with the Rotation Forest/ADTree classifier offers good accuracy for most tested cases. For 11 out of 12 targets, the AUROC value for the final evaluation set was = 0.72, while for three targets the AUROC value was = 0.80, with the average AUROC being 0.784 ± 0.069. The use of two-dimensional descriptors sets enables fast screening and compound prioritization even for a very large database. Open source tools used in this project make the presented approach widely available and encourage the community to further improve the presented scheme.
Introduction
Toxicity evaluation of newly synthesized or used chemicals (pharmaceuticals and its metabolites, cosmetic ingredients, biocides, or anthropogenic pollutants) is one of the main challenges during product development in many areas of industry. For example, it has been estimated that in the pharmaceutical industry the toxicology and clinical safety is accounting for 30% of failures in clinical trials (Kola and Landis, 2004). The risk of attrition can be substantially reduced by the introduction of toxicity testing at the early stages of product development. Such evaluation, especially when performed on a large scale, is neither time/cost effective, nor—in case of tests performed on animals—ethically justified. It is estimated that the introduction of a new pesticide to the market requires testing on 7000 animals and costs tens of millions of dollars (Erickson, 2011). Moreover, animal models are frequently poorly correlated with response on humans (Knight, 2007; Shanks et al., 2009). Although in vivo testing seems to be inevitable at the late stage of a product development, many efforts to shift from traditional in vivo tests to higher-throughput and less expensive cell-based assays have been made. For example “The Toxicology in the 21st Century” (Tox21) program, is aimed at developing more reliable toxicity assessment methods as well as developing and validating cellular (in vitro) toxicity assays. The Tox21 10 K chemical library consists of ~10,500 plated compound solutions, consisting of 8311 unique chemical substances, including pesticides, industrial chemicals, food-use additives and drugs (Huang et al., 2014). Acquired activity data can serve not only as in vitro signatures that could be used to predict in vivo toxicity endpoints (Martin et al., 2011; Sipes et al., 2011) and to prioritize chemicals for extensive toxicity testing (Judson et al., 2010), but also to provide the scientific community with training data sets for developing reliable in silico toxicity models (Sun et al., 2012). Also, many attempts toward development of new computational methods for high-throughput toxicity prediction have been made and many techniques and algorithms have been proposed (Deeb and Goodarzi, 2012; Bakhtyari et al., 2013; Cheng et al., 2013; Valerio, 2013; Low et al., 2014; Omer et al., 2014; Toropov et al., 2014; Rouquie et al., 2015). In recent years, machine learning methods are gaining more attention as robust and accurate tools for Quantitative structure–activity relationship (QSAR) and Quantitative structure–property relationships (QSPR) modeling (Durrant and Amaro, 2015; Freitas et al., 2015; Liu, 2015). The key to success in building predictive models are: (a) the quality of a training data set, (b) the descriptive power of molecular descriptors, and (c) selecting and tuning machine learning algorithms. Here I present a detailed description of creating activity prediction models using the Tox21 Data Challenge data set (Subchallenges 1–12). It consists of activity data for two panels playing important roles in toxicological pathways. Nuclear Receptor Signaling Panel (nr) included activity data for seven targets: aryl hydrocarbon receptor (ahr), androgen receptor—full length (ar) and Ligand Binding Domain (ar-lbd), aromatase, estrogen receptor alpha—full length (er) and Ligand Binding Domain (er-lbd) and peroxisome proliferator-activated receptor gamma (ppar-gamma). Stress Response Panel (sr) included data for five targets: nuclear factor (erythroid-derived 2)-like 2/antioxidant responsive element (are), ATAD5, heat shock factor response element (hse), the disruption of mitochondrial membrane potential (mmp) and p53. Great emphasis is laid upon the initial performance benchmark of the various combinations of attribute selection methods and classification algorithms. Two-dimensional molecular descriptors set and dictionary-based fingerprints enable fast screening and compound prioritization even for very large databases. All software used during this study is freely available and open source, making the presented approach widely available for the scientific community.
Materials and Methods
The training dataset provided by the Challenge organizers (https://tripod.nih.gov/tox21/challenge/data.jsp) consisted of the activity data for ~10 k compounds (Tox21 10 K compound library, structures provided as SMILES) on 12 targets, with the activity class assigned “Active” or “Not active” (for discussions of activity call procedures, see Shockley, 2012; Tice et al., 2013). The Testing dataset, provided later by the Challenge organizers consisted of activity data for 269 compounds. The final predictions were performed on the evaluation set of 647 compounds with unknown activity.
All calculations were performed on the desktop computer with Intel Core i7-4770 K CPU processor (eight cores) and 16 GB RAM, running Ubuntu 12.04.5 LTS.
Structures Standardization and Preprocessing
The chemical structures in the provided Tox21 Challenge data sets were standardized using the LyChI (Layered Chemical Identifier) program (version 20141028, https://github.com/ncats/lychi). Compounds with ambiguous structure (compound identifier with more than one chemical structure assigned) or activity (compound identifier with activity labels “Active” and “Not active” on a single target) were excluded using KNIME GroupBy node (KNIME 2.10.4, http://www.knime.org/; Berthold et al., 2007). For each compound, only the biggest component was preserved (KNIME component Separator node). For each target, data set was downsized such that the activity values were evenly distributed—all records from the minority class were retained and a random sample from the majority class was added (KNIME Row Sampling node). Standardized and downsized datasets used for modeling are available as Supplementary Materials.
Descriptors Generation
For standardized data sets, two-dimensional molecular descriptors were calculated using KNIME nodes: RDKit (http://rdkit.org/, 117 descriptors), CDK (Beisken et al., 2013; http://sourceforge.net/projects/cdk/, 97 descriptors) and fingerprints [PubChem (881 bits) and MACCS (167 bits)], giving 1262 descriptors for each compound. For the list of used descriptors and literature references see Supplementary Table S5. For each target, Arff weka file was created using KNIME Arff Writer node.
Classification Algorithms Screen
Preprocessing and classification algorithms screen was performed in the Weka Experiment Environment (Weka 3.6.6, Hall et al., 2009), with 10-fold cross validation with 10 repetitions. In each run, data was preprocessed with Remove Useless filter (all constant attributes are deleted, along with any that exceed the maximum percentage of variance, set to 99%) and Standardize filter (standardizes all numeric attributes to have zero mean and unit variance). Attribute selection was performed with two search methods: Best First and Rank Search, with CfsSubset attribute evaluator. Machine learning algorithms tested were: ADTree (alternating decision tree), FT (functional trees), FURIA (Fuzzy Unordered Rule Induction Algorithm), IBk (k-nearest neighbors), J48, Naïve Bayes, REPTree, and SMO (sequential minimal optimization for training a support vector classifier). Ensemble methods tested in the second step of the screen were: Rotation Forest, Decorate, Dagging, Bagging and AdaBoost M1. Unless otherwise stated, all algorithms were used with default settings. The performance of the models was measured using area under the receiver operating characteristic (ROC) curve metrics (AUROC).
Predictions
The final models were built in KNIME with Weka 3.6 nodes, using the Best First attribute selection method with Rotation Forest/ADTree classifier (for parameters of the classifier see Supplementary Table S6). For each target, 10 models were built using randomly selected subset of 95% of training set. Each model was evaluated on the remaining 5% of the training set and on the testing set. The model with the best AUROC value was selected for the final predictions. The estimation of probability of a chemical being active was rounded to three decimal places.
Results and Discussion
The data processing workflow is shown in Figure 1. It involved six main steps: data preprocessing, descriptors calculation, feature selection and classification algorithms screen, training, testing, and predictions.
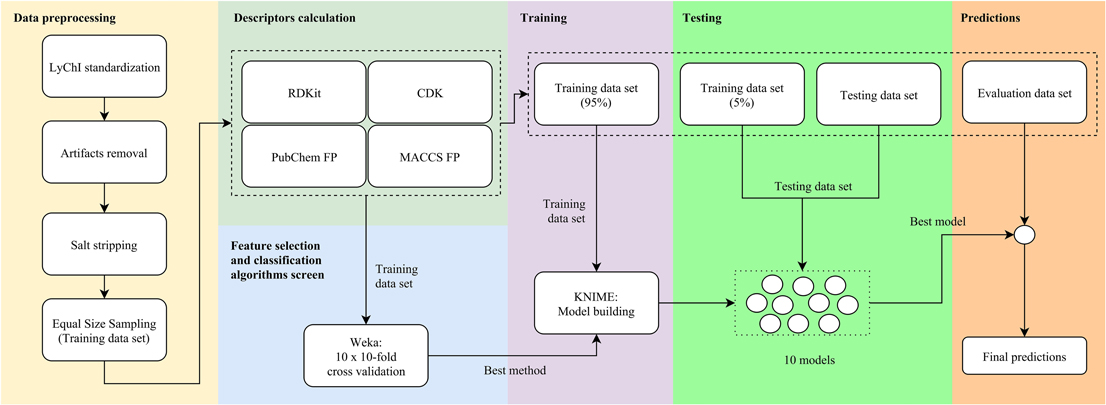
Figure 1. Activity prediction workflow.
Data Preprocessing
The first stage of data preprocessing included data sanitization. First, SMILES were standardized with the LyChi program. For the training dataset, out of 11,764 unique input compounds, 9231 (78%) had fixed structure. Among the most frequent modifications were: unifying aromaticity model, neutralization and small counterions removal. Next, structures containing more than one component were separated and only the biggest component was preserved. This was the most vague reduction of the initial data, but this step was necessary for proper descriptors calculations. Also, an analysis of the most frequently removed components showed that these were mainly inorganic acids, metal ions and water molecules (see Table 1), which are frequent components of pharmaceutical mixtures and should not be treated as a factors determining activity on investigated targets. Finally, each subset of the training data set was downsized such that the activity values are equally distributed. The selection of the majority class members (inactives) was random (see Sections Structures Standardization and Preprocessing: Materials and Methods), which means that the output from this step could influence the results of further predictions. Here, the downsizing was a single-time procedure and the influence of various sets of majority class on models' performance was not investigated. For the initial and final compositions of the training data set (see Table 2).
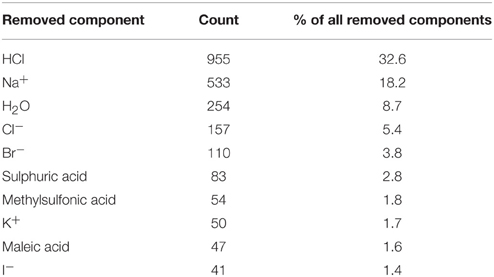
Table 1. Top 10 most frequently removed minor components from an initial training data set.
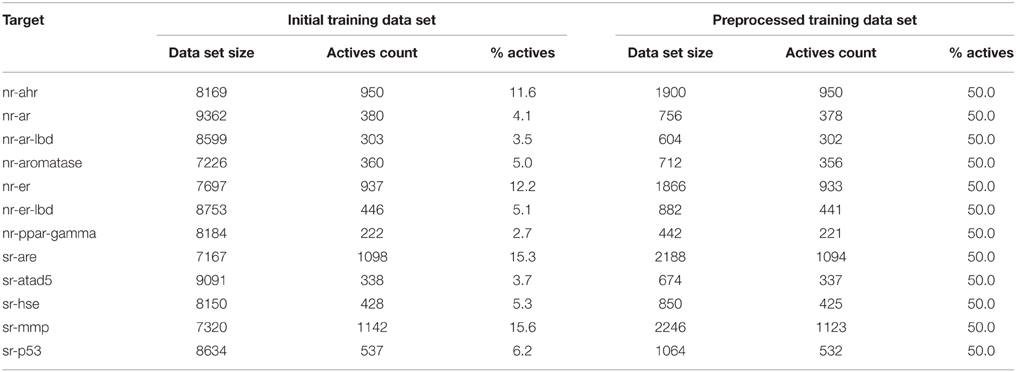
Table 2. Initial and final training data sets composition.
Molecular Descriptors Calculation
Generation of higher-dimensional molecular descriptors (3D, 4D, 5D) is time consuming and may be prone to conformer generation errors. To avoid these shortcomings, low-dimensional (0D, 1D, 2D) descriptors and dictionary-based fingerprints were used here. It was shown earlier that such descriptors may carry the similar information-level to higher dimensional ones (Estrada et al., 2001; Oprea, 2002; Roy and Das, 2014) and can be successfully used in building predictive QSAR models (Roy and Roy, 2009; Garcia et al., 2011; Chavan et al., 2014; Su et al., 2015).
Feature Selection and Classification Algorithms Screen
Various attribute selection, data preprocessing and classification algorithms are available (Witten et al., 2011). It is not known a priori which combination of the above is optimal for the problem under consideration, as for different data sets the accuracy of algorithms varies (Smusz et al., 2013). This is why an initial methods assessment was conducted, evaluating the performance (expressed as the AUROC value) of the combination of:
• Attribute selection methods: two search methods were evaluated: Best First and Rank Search
• Classifiers: 14 classifiers setups were evaluated
Most classifiers were used with default settings. For IBk, four values of k were probed (1, 3, 5, and 10), as this parameter may significantly influence the performance of this classifier. SMO algorithm was probed with three kernels (RBF kernel, polynomial kernel, and normalized polynomial kernel). To validate various modeling approaches, a 10-fold cross validation with 10 repetitions was used. In each run, training data were preprocessed independently (removal of a constant attribute, data standardization, attribute selection). This allowed an estimation of how the procedures under the investigation will generalize to an independent data set. Results of the initial evaluation are summarized in Figure 2 (for values obtained in the initial methods evaluation see Supplementary Table S1).
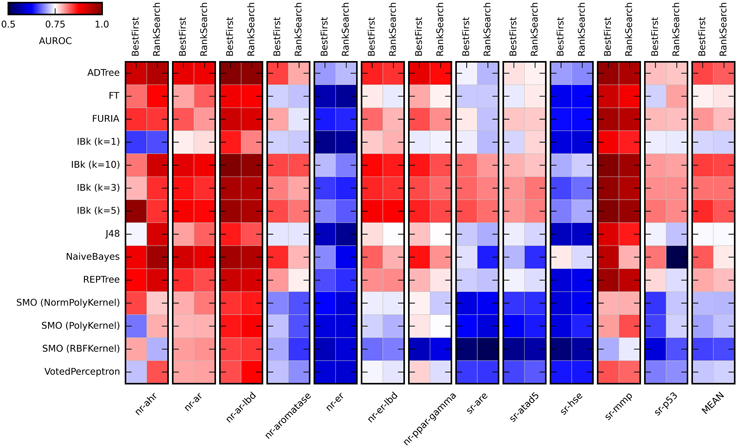
Figure 2. Heat maps presenting results of the initial methods evaluation. Color coded AUROC values are presented for 14 classifiers (Y axis) in combination with two attribute selection methods (top X axis), grouped by the target (down X axis). Additional group presenting mean AUROC values is added for classifiers comparison.
As expected, the performance of evaluated classifiers varied. For the tested set of the descriptors, among the best performing ones were ADTree, IBk, and Naïve Bayes. Performance of IBk classifier varied slightly for various values of k, with better AUROC values for the higher k (5 and 10). The worst performance was observed for SMO (Sequential Minimal Optimization). However, the parameters for these methods (C, gamma) were not optimized and certainly such optimization would increase their performance. As for the attribute selection methods, in most cases there were no significant differences in performance between algorithms. The exception is the Naïve Bayes classifier, where the differences are substantial. Generally, the Best First method was slightly better than Rank Search (mean AUROC for all experiments: 0.778 ± 0.056 and 0.768 ± 0.055, respectively). In the studied descriptors space, the overall “target predictability” also varied. The sr-mmp and nr-ar-lbd are “the most predictable” targets while sr-hse and nr-er are “the least predictable” ones. The latter observation may be caused by the insufficient descriptive power of calculated molecular features to describe the nature of binding small molecule ligands to these targets.
After initial algorithms screen, the four best performing methods (Naïve Bayes, ADTree, and IBk) were evaluated in combination with ensemble methods: Rotation Forest, Decorate, Dagging, Bagging, and AdaBoost. The SMO classifier was treated as the “negative control.” The Best First attribute selection method was used. Results are summarized in Figure 3 (for AUROC values obtained in this experiment see Supplementary Table S2).
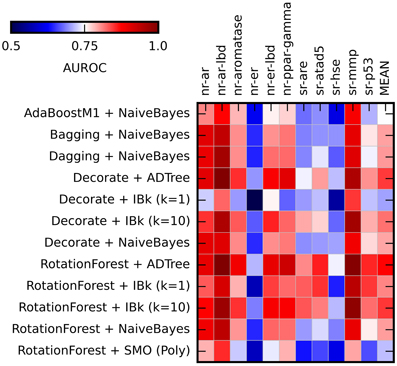
Figure 3. Heat maps presenting results of the ensemble methods assessment. Color coded AUROC values for 12 classifiers (Y axis) for each challenge target (X axis) are shown. Aditional column presenting mean AUROC values is added for classifiers comparison.
The application of the ensemble methods in most cases caused increase of the obtained AUROC values. The average AUROC for all targets for Naïve Bayes classifier increased from 0.79 to 0.80 (when combined with Bagging, Dagging, Decorate and Rotation Forest) but decreased to 0.78 in case of AdaBoostM1. For ADTree, the AUROC values increased from the initial 0.79–0.82 (in combination with Decorate) and 0.83 (for Rotation Forest). For comparison of the performance of the selected ensemble classifiers see Supplementary Table S4. The best and most stable performance for all targets was observed for Rotation Forest ensemble method with two classifiers: ADTree and IBk (k = 10) (Mean AUROC for all experiments: 0.831 ± 0.038 and 0.820 ± 0.038 respectively). Based on these results, the Best First attribute selection method with Rotation Forest/ADTree classifier was used for the final activity predictions for all targets.
Training, Testing, and Final Predictions
For each target, 10 models were built using randomly selected subsets of 95% of the training set. Each model was tested on two sets: the remaining 5% of the training set and the provided testing set. The use of the 5%-random subset, apart from the constant testing set, helped to assure that the performance of the selected model is obtained not due to chance, but by merit inherent to the method. The model with the highest AUROC value was selected for the final predictions on the evaluation set. The performance on the testing and evaluation data sets of selected best models is summarized in Table 3. For AUROC statistics of all generated models see Supplementary Table S3.
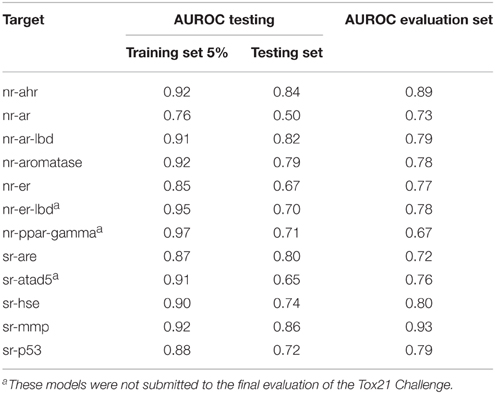
Table 3. AUROC values obtained for the best models selected for final predictions.
The average AUROC value for the final predictions for all 12 targets was 0.784 ± 0.069. The best results were obtained for nr-ahr and sr-mmp (AUROC values: 0.89 and 0.93, respectively). The lowest AUROC value was obtained for nr-ppar-gamma (0.67), despite good performance of the model on the testing sets. As stated earlier, lower performance for some targets may be caused by the insufficient descriptive power of calculated molecular features to describe the complex nature of binding small molecule ligands to these targets.
In general, one can observe the correlation between AUROC values for testing and evaluation data sets. Most prominent examples include sr-mmp and nr-ahr (good performance in both testing and final evaluation) and nr-ar (moderate performance in both cases). On the other hand, for nr-ppar-gamma, the results obtained on the testing data sets are very good, while the final performance is moderate. In this case, one of the reasons could be that the chemical space of the evaluation set is out of the applicability domain of the selected model.
Computational Performance
Descriptors Calculation
The choice of low-dimensional descriptors guaranteed a high speed of calculations. A test run, carried for randomly selected 50 k clean drug like compounds fetched from ZINC database, showed a calculation rate at 12.65 s/1000 compounds (±1.33 s). The workflow for the descriptors calculation may be further optimized by applying a better parallelization scheme and by using all available CPUs on all stages of calculations.
Classification Performance
The biggest influence on the training time has the attribute selection step. Results from initial algorithms assessment (10-fold cross validation with 10 repetitions) shows that, for Best First, the average time of a single run was 10.197 ± 6.359 s, while for Rank Search it was 80.983 ± 66.302 s. Although the differences between these algorithms are high, in many cases training is a one-time procedure and training time is not a main factor for consideration. The average testing time for Best First method was 0.034 ± 0.063 s, while for Rank Search it was 0.119 ± 0.242 s. For the setup used for final evaluation (Best First attribute selection method with Rotation Forest/ADTree classifier) the average training time for all targets was 13.084 ± 8.627 s, while the testing time was 0.042 ± 0.033 s. For training and testing time values see Supplementary Tables S1, S2).
Related Works
Recently, a few papers describing various classification methods applied to the Tox21 dataset have been published. Drwal et al. described a successful approach of applying similarity comparison and machine learning for activity prediction (Drwal et al., 2015). These authors also used two dimensional descriptors sets in the form of 2929 bit-long bitvector, encoding molecular features, properties and connectivity information. The training dataset was enriched by adding activity data fetched from the literature (when available). Various parameters of similarity searching (Tanimoto fingerprint similarity to active or inactive compounds), of machine learning (Naïve Bayes) and of the combination of these methods were evaluated. The established methodology applied to the Tox21 dataset gave comparable results to the ones shown in this work (for four targets, the methods presented here gave better AUROC values, for two, the values were equal).
Deep learning methods were also applied to the Tox21 classification challenge. Unterthiner et al. used deep neural network with 40,000 input features describing molecules (Unterthiner et al., 2015). The presented scheme allowed the team to get the highest AUROC values in most of the Tox21 sub-challenges. The drawback of this methodology is the high demand for computational resources. Ramsundar et al. used simple two-dimensional descriptors and fingerprints in connection with Massively Multitask Networks (Ramsundar et al., 2015). Comparison to other classification algorithms (logistic regression, random forest) showed better performance for the deep learning method. Again, this methodology is computationally very expensive.
Conclusions
The presented method uses fast to calculate, two-dimensional descriptors and, in most cases, shows good predictive performance. Moreover, the use of free and open source tools makes the presented approach widely available for the community. To further improve the described workflow, a wider set of descriptors may be used, including fingerprints basing on connectivity information (like ECFP4 or Morgan fingerprints) or recently presented ToxPrint fingerprint, which cover substructures associated with toxicity (Yang et al., 2015). Also, other classification methods, including ensemble methods and deep learning techniques, should be investigated.
The Tox21 Data Challenge 2014 has offered the opportunity to compare and benchmark various approaches for toxicity prediction. The results clearly show that the very accurate in silico methods are now, or soon will be, at our fingertips. However, there is still a lot of work to be done to improve the quality of models to fully supersede traditional, in vitro assays.
Conflict of Interest Statement
The author declares that the research was conducted in the absence of any commercial or financial relationships that could be construed as a potential conflict of interest.
Acknowledgments
FS was supported by the European Research Council (ERC, StG grant RNA+P=123D project number 261351, to Janusz M. Bujnicki.). I would like to thank Krzysztof Szczepaniak, Grzegorz Lach, Catarina Almeida and Janusz M. Bujnicki for carefully reading the manuscript.
Supplementary Material
The Supplementary Material for this article can be found online at: http://journal.frontiersin.org/article/10.3389/fenvs.2015.00077
References
Bakhtyari, N. G., Raitano, G., Benfenati, E., Martin, T., and Young, D. (2013). Comparison of in silico models for prediction of mutagenicity. J. Environ. Sci. Health C Environ. Carcinog. Ecotoxicol. Rev. 31, 45–66. doi: 10.1080/10590501.2013.763576
Beisken, S., Meinl, T., Wiswedel, B., De Figueiredo, L. F., Berthold, M., and Steinbeck, C. (2013). KNIME-CDK: workflow-driven cheminformatics. BMC Bioinformatics 14:257. doi: 10.1186/1471-2105-14-257
Berthold, M. C. N., Dill, F., Gabriel, T. R., Kotter, T., Meinl, T., et al. (2007). “KNIME: the konstanz information miner,” in Studies in Classification, Data Analysis, and Knowledge Organization, eds C. Preisach, H. Burkhardt, L. Schmidt-Thieme, and R. Decker (Heidelberg: Springer), 319–326.
Chavan, S., Nicholls, I. A., Karlsson, B. C., Rosengren, A. M., Ballabio, D., Consonni, V., et al. (2014). Towards global QSAR model building for acute toxicity: munro database case study. Int. J. Mol. Sci. 15, 18162–18174. doi: 10.3390/ijms151018162
Cheng, F., Li, W., Liu, G., and Tang, Y. (2013). In silico ADMET prediction: recent advances, current challenges and future trends. Curr. Top. Med. Chem. 13, 1273–1289. doi: 10.2174/15680266113139990033
Deeb, O., and Goodarzi, M. (2012). In silico quantitative structure toxicity relationship of chemical compounds: some case studies. Curr. Drug Saf. 7, 289–297. doi: 10.2174/157488612804096533
Drwal, M., Siramshetty, V., Banerjee, P., Goede, A., Preissner, R., and Dunkel, M. (2015). Molecular similarity-based predictions of the Tox21 screening outcome. Front. Environ. Sci. 3:54. doi: 10.3389/fenvs.2015.00054
Durrant, J. D., and Amaro, R. E. (2015). Machine-learning techniques applied to antibacterial drug discovery. Chem. Biol. Drug Des. 85, 14–21. doi: 10.1111/cbdd.12423
Erickson, B. E. (2011). Modernizing toxicity tests. Chem. Eng. News 89, 25–26. doi: 10.1021/cen-v089n029.p025
Estrada, E., Molina, E., and Perdomo-Lopez, I. (2001). Can 3D structural parameters be predicted from 2D (topological) molecular descriptors? J. Chem. Inf. Comput. Sci. 41, 1015–1021. doi: 10.1021/ci000170v
Freitas, A. A., Limbu, K., and Ghafourian, T. (2015). Predicting volume of distribution with decision tree-based regression methods using predicted tissue:plasma partition coefficients. J. Cheminform. 7, 6. doi: 10.1186/s13321-015-0054-x
Garcia, I., Fall, Y., Garcia-Mera, X., and Prado-Prado, F. (2011). Theoretical study of GSK-3 alpha: neural networks QSAR studies for the design of new inhibitors using 2D descriptors. Mol. Divers. 15, 947–955. doi: 10.1007/s11030-011-9325-2
Hall, M., Frank, E., Holmes, G., Pfahringer, B., Reutemann, P., and Witten, I. H. (2009). The WEKA data mining software: an update. SIGKDD Explorations 11, 10–18. doi: 10.1145/1656274.1656278
Huang, R. L., Sakamuru, S., Martin, M. T., Reif, D. M., Judson, R. S., Houck, K. A., et al. (2014). Profiling of the Tox21 10K compound library for agonists and antagonists of the estrogen receptor alpha signaling pathway. Sci. Rep. 4, 1664–1673. doi: 10.1038/srep05664
Judson, R. S., Houck, K. A., Kavlock, R. J., Knudsen, T. B., Martin, M. T., Mortensen, H. M., et al. (2010). In vitro screening of environmental chemicals for targeted testing prioritization: the toxcast project. Environ. Health Perspect. 118, 485–492. doi: 10.1289/ehp.0901392
Knight, A. (2007). Systematic reviews of animal experiments demonstrate poor human clinical and toxicological utility. Altern. Lab. Anim. 35, 641–659. Available online at: http://www.atla.org.uk/systematic-reviews-of-animal-experiments-demonstrate-poor-human-clinical-and-toxicological-utility/
Kola, I., and Landis, J. (2004). Can the pharmaceutical industry reduce attrition rates? Nat. Rev. Drug Discov. 3, 711–715. doi: 10.1038/nrd1470
Low, Y. S., Sedykh, A. Y., Rusyn, I., and Tropsha, A. (2014). Integrative approaches for predicting in vivo effects of chemicals from their structural descriptors and the results of short-term biological assays. Curr. Top. Med. Chem. 14, 1356–1364. doi: 10.2174/1568026614666140506121116
Martin, M. T., Knudsen, T. B., Reif, D. M., Houck, K. A., Judson, R. S., Kavlock, R. J., et al. (2011). Predictive model of rat reproductive toxicity from toxcast high throughput screening. Biol. Reprod. 85, 327–339. doi: 10.1095/biolreprod.111.090977
Omer, A., Singh, P., Yadav, N. K., and Singh, R. K. (2014). An overview of data mining algorithms in drug induced toxicity prediction. Mini Rev. Med. Chem. 14, 345–354. doi: 10.2174/1389557514666140219110244
Oprea, T. I. (2002). On the information content of 2D and 3D descriptors for QSAR. J. Braz. Chem. Soc. 13, 811–815. doi: 10.1590/s0103-50532002000600013
Ramsundar, B., Kearnes, S., Riley, P., Webster, D., Konerding, D., and Pande, V. (2015). Massively multitask networks for drug discovery. arXiv:1502.02072. Available online at: http://arxiv.org/abs/1502.02072
Rouquié, D., Heneweer, M., Botham, J., Ketelslegers, H., Markell, L., Pfister, T., et al. (2015). Contribution of new technologies to characterization and prediction of adverse effects. Crit. Rev. Toxicol. 45, 172–183. doi: 10.3109/10408444.2014.986054
Roy, K., and Das, R. N. (2014). A review on principles, theory and practices of 2D-QSAR. Curr. Drug Metab. 15, 346–379. doi: 10.2174/1389200215666140908102230
Roy, P. P., and Roy, K. (2009). QSAR Studies of CYP2D6 inhibitor aryloxypropanolamines using 2D and 3D descriptors. Chem. Biol. Drug Des. 73, 442–455. doi: 10.1111/j.1747-0285.2009.00791.x
Shanks, N., Greek, R., and Greek, J. (2009). Are animal models predictive for humans? Philos. Ethics Hum. Med. 4:2. doi: 10.1186/1747-5341-4-2
Shockley, K. R. (2012). A three-stage algorithm to make toxicologically relevant activity calls from quantitative high throughput screening data. Environ. Health Perspect. 120, 1107–1115. doi: 10.1289/ehp.1104688
Sipes, N. S., Martin, M. T., Reif, D. M., Kleinstreuer, N. C., Judson, R. S., Singh, A. V., et al. (2011). Predictive models of prenatal developmental toxicity from toxcast high-throughput screening data. Toxicol. Sci. 124, 109–127. doi: 10.1093/toxsci/kfr220
Smusz, S., Kurczab, R., and Bojarski, A. J. (2013). A multidimensional analysis of machine learning methods performance in the classification of bioactive compounds. Chemometr. Intel. Lab. Syst. 128, 89–100. doi: 10.1016/j.chemolab.2013.08.003
Su, B. H., Tu, Y. S., Lin, O. A., Harn, Y. C., Shen, M. Y., and Tseng, Y. J. (2015). Rule-based classification models of molecular autofluorescence. J. Chem. Inf. Model. 55, 434–445. doi: 10.1021/ci5007432
Sun, H. M., Xia, M. H., Austin, C. P., and Huang, R. L. (2012). Paradigm shift in toxicity testing and modeling. Aaps J. 14, 473–480. doi: 10.1208/s12248-012-9358-1
Tice, R. R., Austin, C. P., Kavlock, R. J., and Bucher, J. R. (2013). Improving the human hazard characterization of chemicals: a Tox21 update. Environ. Health Perspect. 121, 756–765. doi: 10.1289/ehp.1205784
Toropov, A. A., Toropova, A. P., Raska, I. Jr., Leszczynska, D., and Leszczynski, J. (2014). Comprehension of drug toxicity: software and databases. Comput. Biol. Med. 45, 20–25. doi: 10.1016/j.compbiomed.2013.11.013
Unterthiner, T., Mayr, A., Klambauer, G., and Hochreiter, S. (2015). Toxicity prediction using deep learning. arXiv. Available online at: http://arxiv.org/abs/1503.01445
Valerio, L. G. Jr. (2013). Predictive computational toxicology to support drug safety assessment. Methods Mol. Biol. 930, 341–354. doi: 10.1007/978-1-62703-059-5_15
Witten, I. H., Frank, E., and Hall, M. A. (2011). “Data mining practical machine learning tools and techniques,” in Morgan Kaufmann Series in Data Management Systems, 3rd Edn., (Burlington, MA: Morgan Kaufmann Publishers).
Keywords: toxicity prediction, machine learning, molecular descriptors, molecular fingerprints, Tox21 Data Challenge 2014
Citation: Stefaniak F (2015) Prediction of Compounds Activity in Nuclear Receptor Signaling and Stress Pathway Assays Using Machine Learning Algorithms and Low-Dimensional Molecular Descriptors. Front. Environ. Sci. 3:77. doi: 10.3389/fenvs.2015.00077
Received: 01 September 2015; Accepted: 16 November 2015;
Published: 01 December 2015.
Edited by:
Ruili Huang, NIH National Center for Advancing Translational Sciences, USAReviewed by:
Keith Shockley, National Institute of Environmental Sciences, USADenis Fourches, North Carolina State University, USA
Costica Nitu, University “Politehnica”Bucharest, Romania
Copyright © 2015 Stefaniak. This is an open-access article distributed under the terms of the Creative Commons Attribution License (CC BY). The use, distribution or reproduction in other forums is permitted, provided the original author(s) or licensor are credited and that the original publication in this journal is cited, in accordance with accepted academic practice. No use, distribution or reproduction is permitted which does not comply with these terms.
*Correspondence: Filip Stefaniak, ZnN0ZWZhbmlha0BnZW5lc2lsaWNvLnBs