 Alessa Hawliczek-Ignarski1
 Helmut Segner
 Jessica Legradi
- 1Centre for Fish and Wildlife Health, University of Bern, Bern, Switzerland
- 2Environment and Health, VU University Amsterdam, Amsterdam, Netherlands
A criterion frequently used to group chemicals in risk assessment is “mode of toxic action” (MoA). Routinely, structure-based approaches are used for the MoA categorization of chemicals, but they can produce conflicting results or fail to classify compounds. Biological activity-based approaches such as toxicogenomics which provide an unbiased overview of the transcriptomic changes after exposure to a compound may complement structure-based approaches in MoA assignment. Here, we investigate whether toxicogenomic profiles as generated after in vitro exposure of an established cell line (C3A hepatoma cells) are able to group together chemicals with an uncoupling MoA, and to distinguish the uncouplers from chemicals with other MoAs. In a first step, we examined whether chemicals sharing the same uncoupling of oxidative phosphorylation (OXPHOS) MoA produce similar toxicogenomic profiles and can be grouped together. In a next step, we tested whether the toxicogenomic profiles discriminate between OXPHOS and chemicals displaying a (polar) narcotic MoA. Experimentally, cells were exposed in vitro to equipotent concentrations of the test compounds and gene expression profiles were measured. The resulting toxicogenomic profiles assigned OXPHOS to one cluster and discriminated between the OXPHOS and the (polar) narcotics. In addition, the toxicogenomics data revealed that one and the same chemical can display multiple MoAs, which may help to explain conflicting results of MoA classification from structure-based approaches. The results strongly suggest the feasibility of MoA grouping of chemicals by using in vitro cell assay-based toxicogenomic profiles.
Introduction
Chemical risk assessment has to deal with a large and ever growing number of chemical substances. At the same time, increasing regulatory demands that are designed to ensure the health and safety of both humans and ecosystems lead to increasing needs for chemical toxicity testing. In this situation, a compound-by-compound evaluation using traditional toxicity testing approaches is hardly feasible given the resources needed in terms of time, labor, and costs, and with respect to ethical considerations, as it would necessitate the use of extensive numbers of experimental animals. Thus, toxicologists are faced with the challenge to develop novel approaches of chemical hazard assessment which reduce testing needs and animal usage while still generating robust safety data (Mantus, 2007; NRC, 2007; ECHA, 2011; Kavlock et al., 2012).
One possibility to increase efficiency of chemical hazard assessment is to categorize chemicals. In such a group-wise evaluation the unknown toxicity of untested compounds can be inferred from the known toxicity of tested compounds. A criterion that is frequently used to group chemicals is their “mode of toxic action” (MoA). MoA is a loosely defined term used in both human toxicology and ecotoxicology, In this article, MoA is referred to as key toxic processes (e.g., chemical binding to a nuclear receptor) (Escher and Hermens, 2002; Vonk et al., 2009; Carmichael et al., 2011; Kienzler et al., 2017). The question is how to recognize that two chemicals have a common MoA, and therefore can be grouped together? One possibility is to assign MoA based on molecular interactions between the chemical and the biological system which initiate specific toxicity pathways like binding to the estrogen receptors, or measuring specific cellular reactions that are indicative for specific effects such as chlorophyll interference in tests with algae (Hamadeh et al., 2002; Escher et al., 2005; Nendza and Wenzel, 2006; Woods et al., 2007; Pereira-Fernandes et al., 2014). Another approach is the grouping of chemicals on the basis of structural rules (Schüürmann, 1998; Verhaar et al., 2000; Enoch et al., 2008; Blackburn et al., 2011). The chemical similarity principle postulates that chemicals with similar structure are likely to be toxicologically similar because they act through similar MOAs (Martin et al., 2002; Enoch et al., 2008). As recently reviewed by Kienzler et al. (2017), various structure-based classification schemes have been developed to group chemicals according to their MoAs, including the Verhaar scheme which classifies chemicals on the basis of correlations between apical toxic endpoints such as lethality and chemical descriptors like octanol-water partition coefficient (kow) (Verhaar et al., 1992), or the ASTER scheme of the US EPA which utilizes, among others, fish behavioral responses for MoA classification (Barron et al., 2015). The results of the different existing classifications schemes may differ. For instance, when comparing the outcome of three MoA classification schemes for 3,448 chemicals, Kienzler et al. (2017) found that only 432 out of the 3,448 chemicals were classified by all three schemes, and only for 42% of these 432 chemicals, the three schemes produced concordant MoA classifications. This illustrates that the structure-based approaches for MoA classification, although being highly useful, also have inherent limitations. Therefore, it has been suggested to extend the structure-based approaches to biological descriptors (Richard, 2006).
The present study examines the potential of toxicogenomic information to augment MoA assignment. Toxicogenomics has been selected as an experimental approach as it enables unbiased, global profiling of the molecular biological response space (Richard, 2006; Edwards and Preston, 2008), without pre-selection of response parameters. For single chemicals, it has been shown that exposure results in chemical-specific, gene expression profiles (Hamadeh et al., 2002; Yang et al., 2007; Kiyosawa et al., 2010; Janssens et al., 2011; Piña and Barata, 2011; Meganathan et al., 2012; Theunissen et al., 2012). The hypothesis tested in the present study is whether specific MoAs have common gene expression profiles that can be used to classify compounds and whether compounds with multiple MoAs can be classified and distinguished from those with only one MoA. As the MoA to be tested in the present study, we selected uncoupling of oxidative phosphorylation (OXPHOS). The biological mechanism of uncouplers is relatively well understood (Terada, 1990; Spycher et al., 2005): they act as protonophores, which dissipate the pH gradient across the proton-impermeable energy-transducing membranes of mitochondria. As a consequence, phosphorylation is uncoupled from the electron transport and from hydrogen transfer. Uncoupling is normally assessed monitoring changes in respiration rate or membrane potential of extracted liver mitochondria or cells (Brand and Nicholls, 2011). Here, we test a number of chemicals which have been classified as uncouplers on the basis of biological mechanistic studies and/or chemical descriptors, and evaluate how similar or dissimilar their toxicogenomic profiles are, and whether these profiles can be discriminated from profiles of chemicals with other MoAs. In order to comply with the aim of reducing animal experimentation in toxicity testing (Pereira-Fernandes et al., 2014), we performed the toxicogenomic studies in an in-vitro test system, the human liver HepG2/C3A cell line.
Materials and Methods
Chemicals
All solvents were of pro analysis (p.a.) quality or better, and purchased from Dr Grogg Chemie AG (Stettlen-Deisswil, Switzerland) unless stated otherwise. Aniline (99%, CAS 62-53-3, Product 132934), Benzo(a)pyrene (BaP) (≥96%, CAS 50-32-8, Product B1760), 4-Chloroaniline (Cl-aniline) (98%, CAS 106-47-8, Product C22415), Dimethyl sulfoxid (DMSO) (99.5%, CAS 67-68-5, Product D4540), Ethylenglycol (1,2-Ethanediol, analytical standard, CAS 107-21-1, Product 85978), Pentachlorophenol (PCP) (98%, CAS 71-23-8, Product 402893), 2,3,4,5-Tetrachlorophenol (TCP) (99.9%, CAS 4901-51-3, Product 442281), were purchased from SIGMA-ALDRICH (Buchs, Switzerland). Carbonyl cyanide 3-chlorophenylhydrazone (CCCP) (99+%, CAS 555-60-2, Product L06932) was purchased from Alfa Aesar (Karlsruhe, Germany). Carbonyl cyanide 4-(trifluoromethoxy)phenylhydrazone (FCCP) (>99%, CAS 370-86-5, Product 0453) was purchased from TOCRIS (Missouri, USA). 6OH-BDE90 was synthesized in the Department of Materials and Environmental Chemistry, Environmental Chemistry Unit, Stockholm University, Sweden (Marsh et al., 1999, 2003). If needed, stock solutions and dilutions of the test substances were prepared in DMSO as vehicle solvent and were added to the culture to give a final DMSO concentration of 0.1% at maximum.
Cell Culture Maintenance
C3A hepatoma cells were obtained from LGC Standards (HepG2/C3A, Hepatocellular Carcinoma, Human (Homo sapiens), ATCC-CRL-10741, Middlesex, UK). C3A is a clonal derivative of the HepG2 cell line. Cells were cultured in 75-cm2 vent cell culture flasks (TPP+, Trasadingen, Switzerland) in Minimal Essential Medium with phenol red indicator (MEM, Gibco, Product 31095, Zug, Switzerland) adding 10% FCS (Fetal Calf Serum, Gibco, Product 10290, Zug, Switzerland), 1% NEAA (MEM Non-Essential Amino Acids, Gibco, Product 11140-035, Zug, Switzerland), 1 mM Sodium Pyruvat (Sigma-Aldrich, CAS 113-24-6, Product P5280, Buchs, Switzerland), and 1% Penicilin-Streptomycin (Penn-Strep) (Sigma-Aldrich, Product P4333, Buchs, Switzerland). Incubation temperature was set at 37°C. Cells were subcultivated (split 1:2) twice weekly. The subculture procedure is described elsewhere (Marsh et al., 1999, 2003; Whitmore et al., 2000). 0.05% trypsin-EDTA was used to detach cells from the flask (Trypsin, Gibco, Product 15400-054, Zug, Switzerland).
For toxicity testing, C3A cells were grown in 75 cm2 culture flasks until ~80% confluency. Cells were then subcultured as quoted above until the uptake of trypsinised cells in media. C3A cells were diluted to reach a final density of 250 000 cells/ml. Two hundred microliters of cell suspension were seeded in the inner 60 wells of a black 96-well plate with clear bottom (Greiner bio-one, Product 655906, Reinach, Switzerland). The outer rows were filled with 200 μl 1x PBS (phosphate buffered saline, Sigma-Aldrich, Buchs, Switzerland). Cells were pre-incubated at 37°C for 24 h. After pre-incubation cells were treated with the test chemicals. Therefore, the test substances were dissolved in DMSO and added to culture medium at a final concentration of 0.1% DMSO to reach the desired test concentration in the test-medium.
Tetramethylrhodaminemethylester (TMRM)-Assay
Tetramethylrhodaminemethylester (TMRM) is a positively charged dye, exhibiting a red color. In cells with intact membrane potential, TMRM accumulates in the active mitochondria, due to their relative negative charge. When the membrane potential collapses, TMRM is no longer retained in the mitochondria and the observed fluorescence decreases. Culture medium was aspirated from the cells and 200 μl exposure medium were gently added. After 2 h incubation, exposure medium was aspirated and TMRM medium was gently added to the wells. The TMRM medium was prepared by adding TMRM [Tetramethylrhodaminemethylester (perchlorate), 99%, CAS 115532-50-8, Product 88065, Anawa, Zürich, Switzerland] at a final concentration of 125 nM to serum- and phenol red-free culture medium (MEM without phenol red, Product 51200, Gibco, Zug, Switzerland). The cells were incubated in TRMR medium for 20 min. Afterwards, TMRM medium was aspirated, and 100 μl of phenol red free medium was added. Fluorescence was measured instantly using the EnSpire® microplate reader (Perkin Elmer, Schwerzenbach, Switzerland) at 540 nm excitation wavelength and 575 nm emission. Solvent controls (0.1% DMSO), positive controls (2.5 μM FCCP) and medium controls were included in all experiments. Per test concentration six well were measured and each experiment was repeated at least three times.
Triphenylphosophonium (TPP+) Assay
The TTP+ assay is measuring changes in the inner mitochondrial membrane potential (ΔΨ) and mitochondrial respiration (O2) in isolated rat liver mitochondrial with help of tetraphenylphosphonium (TPP+) and oxygen sensitive electrodes. The amount of free TPP+ in the reaction medium is a relative measurement of ΔΨ. The experimental animals were sacrificed according to ethical procedures and the rat livers were immediately collected and kept in cold 0.9% NaCl(aq). The tissue was homogenized in isolation medium (0.25 M sucrose, 10 mM HEPES, 3 mM EGTA, 0.2% BSA) and then centrifuged for 6 min at 3,000 rpm 750 g at 4°C (one liver in 50 ml isolation medium). The supernatant was transferred to a clean tube and was centrifuged for 10 min at 10,000 g. Supernatant was removed, and the pellet washed with wash medium (0.25 M sucrose, 5 mM HEPES, 0.1% BSA) and centrifuged for 10 min at 10,000 g. The pellet was resuspended in a small volume of wash medium. For simultaneous measurement of respiration and inner mitochondrial membrane potential (ΔΨ), the mitochondria were incubated at 25°C in reaction medium (85 mM KCl, 20 mM HEPES, 5 mN KH2PO4, 2.3 mM MGCl2, 25 mM creatine, 25 mM phosphocreatine) in a closed and stirred perspex vessel equipped with an oxygen electrode and a TPP+-sensitive electrode (Kamo et al., 1979). Coupling between respiration (O2), inner membrane potential (Δψ) and ATP (Adenosine triphosphate) production in the isolated mitochondria was demonstrated by addition of succinate (1 mM) and ATP (10 mM) to initiate oxidative phosphorylation. Rotenone was also added to block complex I (NADH-UQ reductase) of the electron transport chain (ETC), which allowed us to study inhibitory effects on the ETC as well as protonophoric uncoupling. All test compounds (dissolved in DMSO) were injected into the vessel after the membrane potential was stable (i.e., when state 4-respiration had been reached). For each compound, different concentrations were tested. Due to the complexity of the test n = 1 for the LOEC determination.
Cytotoxicity assay
The cytotoxic action of the test compounds on C3A cells was measured using the resaruzine dye which assesses cell viability. Therefore, the amount of resazurine (non-toxic, non-fluorescent redox active blue dye) that is reduced to resorufin (non-toxic, highly fluorescent, pink dye) by metabolic activity in the cells was measured fluorometrically (Abu-Amero and Bosley, 2005). Therefore, culture medium was aspirated from the cells and 200 μl exposure medium was gently added. Total volume reached 200 μl. After 22 h of exposure, 10 μl of 440 μM resazurine (resazurine sodium salt, CAS 62758-13-8, Product R7017, Sigma-Aldrich, Buchs, Switzerland) was added to the wells. Fluorescence (excitation wavelength 530 nm and emission wavelength at 590 nm) was measured immediately (T0) using EnSpire® microplate reader. After 2 h, fluorescence was measured again (T2). Background fluorescence was subtracted by applying the equation T2h-T0h for each well. Exposure was carried out in six replicates per concentration. Finally, the T2h-T0h fluorescence of each replicate was averaged and the standard deviation calculated. Solvent control (0.1% DMSO) and positive control (0.03% H2O2), as well as a negative control (medium) were incorporated in all experiments. Per test concentration six well were measured and each experiment was repeated at least three times.
Microarray Experiment
C3A cells were exposed for 2 h to substances as described above for the TMRM assay. For microarray analysis, six replicate wells per concentration were pooled. DMSO (0.1%) was used as solvent control. The concentrations used for the exposure were:
Microarray 1: calculated EC50 values from the 2 h TMRM assays, BaP 10 μM.
Microarray 2: calculated EC25 values from the 24 h cytotoxicity assays, i.e., CCCP: 22.8 μM; FCCP 15.7 μM; TCP: 13.8 μM; PCP: 101.7 μM; 6OH-BDE90: 4.2 μM; Aniline: 44.66 mM; Cl-aniline: 6.54 mM; Ethylenglycol: 558.8 mM.
Total RNA was extracted using RNeasy Mini Kit (QUIAGEN, Product 74104, Hombrechtikon, Switzerland) according to manufacturers' instructions. DNA was digested using the RNeasy Mini Kit optional on-column DNase digestion. Quality of extracted RNA was checked via the Nanodrop 1000 spectraphotomoeter V3.7, as well as running the samples on a 1.5% agarose gel.
Total RNA was reverse transcribed to cDNA using 1 μg RNA Template. The reaction mix per sample had a total volume of 25 μl. The reaction mix contained the following products purchased from Promega AG (product number in brackets) (Promega AG, Dübendorf, Switzerland): 0.5 μl RNasin® Plus RNAse Inhibitor (N2611), 1.25 μl 10 mM dNTP (U1201, U1211, U1221, U1231), 1 μl M-MLV Reverse transcriptase (RNase H Minus, Point Mutant) (M3682), 5 μl of 5x Buffer (M3682), 1 μl random primer (C1181), X μl DEPC-water to reach the final volume of 25 μl. After reverse transcription, samples were diluted 10x to prevent inhibition of the PCR reaction by the cDNA synthesis buffer. The diluted cDNA was stored at −20°C until further usage.
For Microarray 1: Each treatment consisted of two biological replicates, the control consisted of three biological replicates. The RNA 6000 NanoChip kit (Agilent Technologies, number 506791511) was used with the Agilent 2100 Bioanalyzer (Agilent technologies) for analysis of total RNA samples. Samples with a RIN (RNA integrity number) above 7 were considered appropriate for consequent microarray testing. For Microarray analysis, Agilent SurePrint G3 Human Gene Expression Microarrays (8x60K) were used in combination with a one-color based hybridization protocol (OneColor RNA Spike-In Mix, Agilent Technologies, number 51885282). All steps were carried out according to the manufacturer's instructions. Fluorescent signal intensities were detected with Scan Control A.8.4.1 Software (Agilent Technologies) on the Agilent DNA Microarray Scanner and extracted from the images using Feature Extraction 10.7.3.1 Software (Agilent Technologies). A quality check as described by the manufacturer was performed (e.g., SpikeIn controls).
For Microarray 2: In order to analyze more compounds in a comparative way we changed that microarray approach as following. Each treatment and controls consisted of three biological replicates. The RNA 6000 NanoChip kit (Agilent Technologies, number 506791511) was used with the Agilent 2100 Bioanalyzer for analysis of total RNA samples following the manual instructions. Samples with a RIN (RNA integrity number) above 7 were considered appropriate for consequent microarray testing. For Microarray analysis Agilent SurePrint G3 Human Gene Expression Microarrays (8x60K) were used (GPL14550). All replicates of the treatments were labeled with Cy5 and all corresponding solvent controls with Cy3. After hybridization, the microarrays were washed using Gene Expression Wash Buffer Kit (Agilent Technologies), and scanned using the Scan Control Software A8.5 with the feature extraction 10.X Software (Agilent technologies) on the DNA microarray scanner G2505C (Agilent Technologies). More detailed description of the design of the microarrays (platform) is available from Gene Expression Omnibus (http://www.ncbi.nlm.nih.gov/geo/) under accession number GPL13607. All microarray data from this study have been deposited in NCBI's Gene Expression Omnibus under the accession number GSE75784. A quality check as described by the manufacturer was performed (e.g., SpikeIn controls).
Microarray Data Analysis
The microarray data was normalized, filtered, and biological replicates averaged. The complete microarray analysis was done using MatlabR2013a.
For the first microarray study a general quality check of the raw array data was performed (spot integrity, signal distribution). The data was normalized using quantile-normalization. Control spots as well as not uniform spots were removed. The solvent control was averaged and the M value (log2FoldChange) calculated. Duplicated spots on the array were averaged before exposure replicates were averaged using the median. This data set was used for further analysis as described in the results.
For the second microarray study a general quality check of the raw data was performed. M values (log2FoldChange) were calculated and LOEWESS and centering normalization applied. Non-uniform and control spots were removed from the data set before duplicated spots on the array were averaged (Median). Then exposure replicates were averaged using median. To identify significantly regulated genes, genes expressed |M|>2 were selected and a t-test performed. Adjusted p-values were calculated using the Bonferroni-Hochberg correction and a cut-off of 0.1 applied. The Pearson correlation coefficient between normalized and averaged replicates was calculated using MaltlabR2013a.
Data Analysis (Cytotoxicity and TMRM)
For the TMRM assay as well as for the cytotoxicity assay, the fluorescence was assessed as described above and dose-response curves were fitted using GraphPad Prism 5 (GraphPad Software Inc., Ca, USA). For dose-response curves, a sigmoidal curve with the formula Y = A + (D-A/(x/EC50)∧b) was used, where A is the minimum effect, D is the maximum effect, x is the chemical concentration, b is the slope was used. Confidence intervals were set at 95%. This formula was used to calculate the EC25 and EC50. Significant differences in response were calculated using the T-test in GraphPad. P-Values were ≤ 0.05.
Results and Discussion
The aim of the present study was to explore the suitability of an in vitro-based toxicogenomic approach for MoA assignment of chemicals. The MoA under consideration in the present study was uncoupling of OXPHOS. It is known that uncoupling can lead to fast transcriptional changes related to the physiological remodeling due to the disruption of ATP generation (Hänninen et al., 2010), and this mechanism may be reflected in the gene signatures of the uncoupler-exposed C3A cells.
Selection of Chemicals with Uncoupling MoA
The selection of chemicals with uncoupling MoA for the experiments of the present study was carried out on the one hand on the basis of biological mechanistic studies and, on the other hand, on the basis of studies applying physico-chemical descriptors. For FCCP and CCCP, several reports describe an interference with proton transfer across the mitochondrial membranes (LeBlanc, 1971; McLaughlin and Dilger, 1980; Terada, 1981; Lim et al., 2001; Stöckl et al., 2007). Since also studies using structural rules identified FCCP and CCCP as uncouplers (Spycher et al., 2005, 2008a), these two compounds were selected as positive controls. In addition, we compiled a list of chemicals that were suggested to have an uncoupling MoA on the basis of structural alerts and physico-chemical descriptors (Schüürmann et al., 2003; Spycher et al., 2005, 2008a,b) which, however, were not proven to act as uncouplers in biological uncoupling assays. From the candidate compounds listed in Table 1, TCP and PCP were selected as compounds with uncoupling MoA mainly based on structural rules. Studies with black lipid bilayer also suggest uncoupling for PCP and TCP (McLaughlin and Dilger, 1980) and experiments with chromophores for TCP (Escher et al., 1996). Finally, chemicals with MoA's other than uncoupling were included as negative controls: BaP as a chemical with a specific MoA (agonist of the arylhydrocarbon receptor), Cl-aniline and aniline as polar narcotics, and ethylenglycol as a narcotic or baseline toxicant (Table 2). The structural information about the applied compounds are shown in Figure 1.
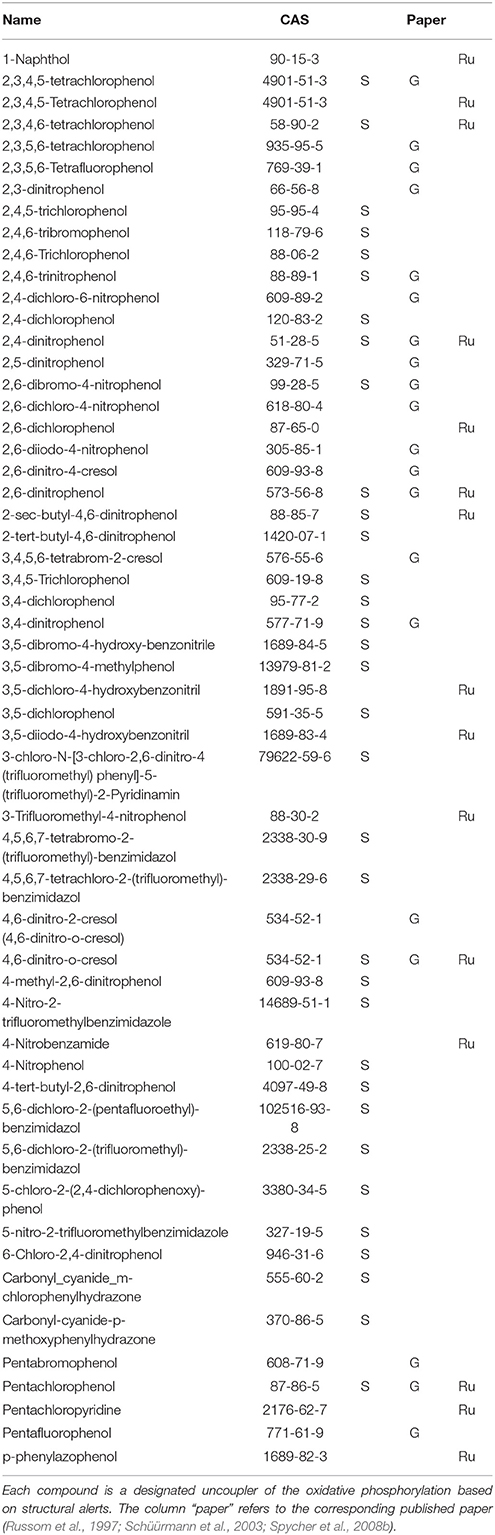
Table 1. Uncoupler of the oxidative phosphorylation candidate compound list.
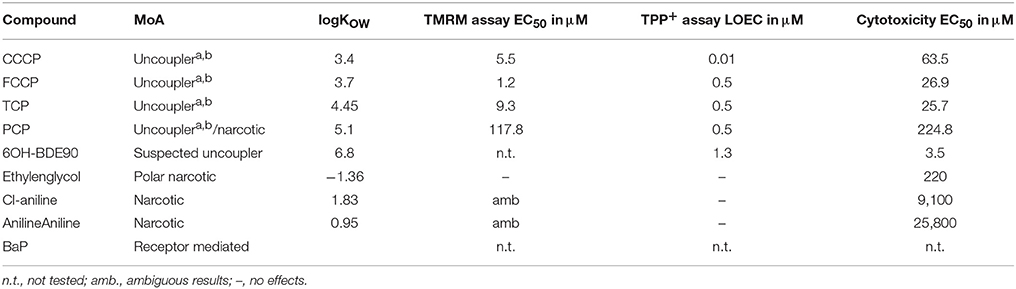
Table 2. Compounds tested in the different bioassyas (TMRM, TPP+ and Cytotoxicity), abiological proven uncoupler, bQSAR designated uncoupler.
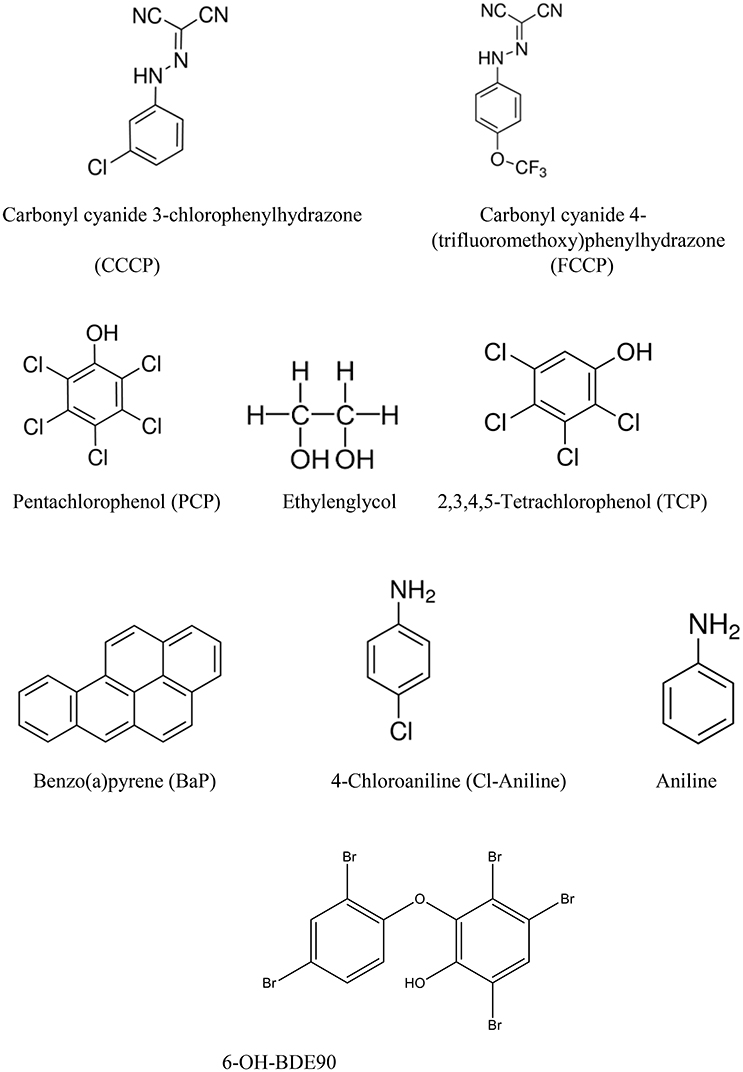
Figure 1. Chemical structures of all the compounds studied.
Biological Assessment of the Uncoupling Activity of the Test Compounds
Two different bioassays were applied to verify if the selected compounds act as biological uncouplers. The hypothesis was that FCCP, CCCP, TCP, and PCP should display protonophoric activity, whereas no such activity should be observed for BaP, the anilines and ethylenglycol. Two bioassays were used for measuring the protonophoric activity: the TMRM assay which is sensitive to alterations of membrane potential (Ehrenberg et al., 1988) was applied to our test system, the mammalian C3A cell line. Additionally, we performed the TPP+ assay which is commonly used to test for uncoupling. The TPP+ assay provides a direct measurement of mitochondrial respiration and membrane potential in isolated rat mitochondria (Lichtshtein et al., 1979). The results are shown in Table 2. Both assays showed that FCCP and TCP have uncoupling activity. CCCP was clearly positive in the TMRM assay, while in the TPP+ assay, first a decrease in oxygen consumption was observed then an increase indicating inhibition of OXPHOS together with uncoupling. The dose-response curves for the TPP+ assay are shown in Figure 2 and the curves for the TMRM assay in Figure 3.
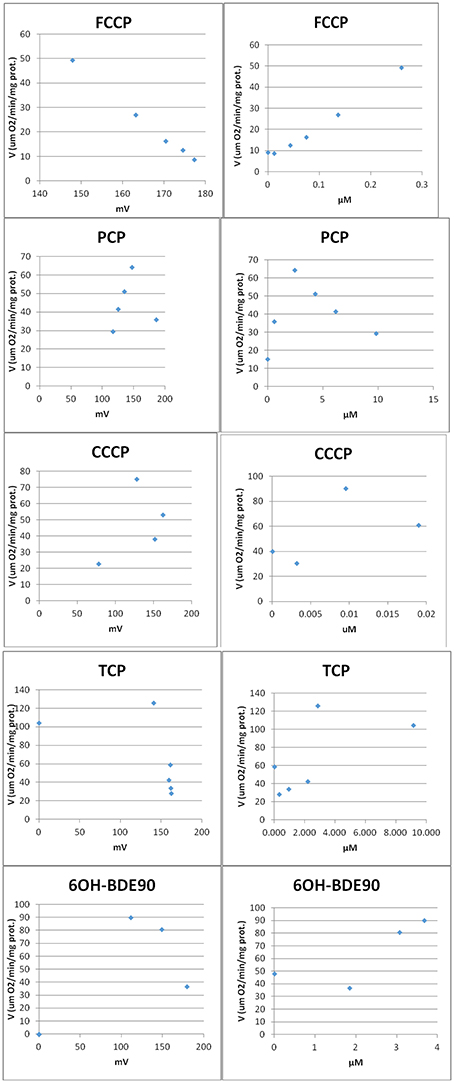
Figure 2. Dose-response curves for single compounds in the TPP+ assay. Measurement of respiration rate (V) vs. mitochondria membrane potential (MMP) (Left). Each point represents the measurements after compound was added to the vessel. After addition of compound the membrane potential decreases (non-disrupted MMP ~180 mv) and the oxygen consumption increases (uncoupling). At higher concentrations, the oxygen consumption starts to decrease indicating inhibition. Measurement of respiration rate (V) vs. concentration of compound (Right). After addition of compound the oxygen consumption increases (uncoupling). At higher concentrations, the oxygen consumption starts to decrease indicating inhibition.
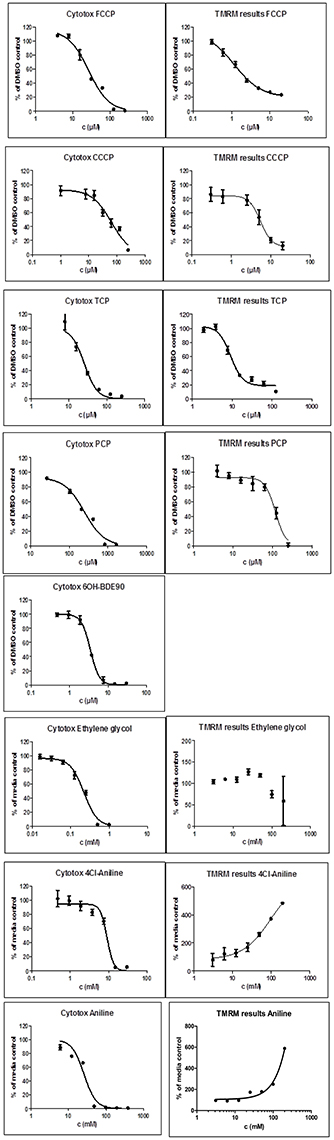
Figure 3. Dose-response curves for single compounds in the cytotoxicity assay (Left) and the TMRM assay (Right). For each experiment six wells per test concentration were averaged and each experiment was repeated three times. Data points present the mean over all measurements and the bars the standard deviation. TMRM graphs for Aniline and Cl-aniline where ambiguous, instead of a decrease an increase of the TMRM signal could be observed. 6OH-BDE90 was not measured in the TMRM assay.
In contrast, for PCP, the TPP+ assay indicated an uncoupling activity at a very low concentration of 0.5 μM, while the TMRM only showed effects at 118 μM with a higher variability between replicates. On the basis of structural descriptors, PCP is classified as uncoupler (Terada, 1981; McKim et al., 1987; Nendza and Müller, 2001; Schüürmann et al., 2003; Spycher, 2005; Spycher et al., 2005, 2008a). The differences of effect concentrations between our assays agrees well with what has been observed by Schüürmann et al. (1997) The authors identified uncoupling by an excess toxicity above the baseline level using 10 different biological test systems. None of the test systems was specific for uncoupling. In this study PCP was not identified as uncoupler. The authors hypothesized that the uncoupling activity of PCP exists but does not yield substantial contributions to its total acute toxicity as quantified by the biological test systems, shown in a very high baseline toxicity. The high lipophilicity of PCP (log Kow of 5.04) leads to relatively high doses and correspondingly high narcotic-type membrane perturbations in the organisms, so that the additional uncoupling activity may not lead to a significant increase in overall toxicity. This means that although chemical descriptors classify PCP as uncoupler, the biological space only partly reflects this activity.
Surprisingly, the two anilines showed an ambiguous response in the TMRM bioassay at very high concentrations (mM). Instead of a decrease of the TMRM an increase of the signal could be observed. This might be due to an interference of the TMRM-dye and the compounds. The TPP+ is more specific for uncoupling activity than the TMRM assay which just measures membrane integrity. Anilines are known to disrupt membranes which might also explain the response in the TMRM assay. Only the polar narcotic compound, ethylenglycol, was clearly negative in both assays. The concentration range tested for the anilines and ethylenglycol are presented in Table 3.
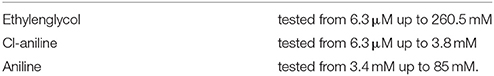
Table 3. Range of the test concentrations for Ethylenglycol, Cl-aniline, and Aniline which did not induce any effects on the oxygen consumption or membrane potential (data not shown).
MoA Specific Gene Expression Profile at Effect Based Concentrations
A first and essential pre-requiste to enable comparison of toxigenomic profiles across compound sis the use of equipotent concentrations of the test chemicals. These concentrations were selected in the preliminary experiments and used for the following experiments. To test whether C3A cells display a toxicogenomic profile that is common for exposure to uncouplers. a proof of principle experiment was performed with the positive control compounds—FCCP, CCCP, and TCP and BaP as a non-uncoupling negative control. To ensure the comparability of the gene expression profiles, the test compounds were applied at equipotent concentrations (Shioda et al., 2006). The chemicals FCCP, CCCP, and TCP were tested at their EC50 values in the TMRM assay, i.e., the concentration which inhibited TMRM uptake by 50%. For BaP, the concentration of 10 μM was used which is high enough to induce a significant biological response of the BaP-specific MoA, i.e., cytochrome P4501A induction via the AhR, while it is low enough to avoid cytotoxicity (Hockley et al., 2009). The Cyp1a1 expression was the highest for the BaP exposed cells with an M value of +3. The M value equals the log2 fold change value. The gene expression profiles induced by the four test compounds were evaluated by means of hierarchical clustering. To this end, the 5000 genes with the highest signal variation over the whole data set were selected (Figure 4A). Each of the test chemicals displayed an individual gene expression profile, CCCP, FCCP, and TCP clustered close to each other, while the BaP profile was clearly separated. In an alternative analysis of the array data, we selected those genes that were regulated with a fold change of >2 or <0.5 (|M| > 1). Also with this analysis, a high degree of similarity of gene expression was evident for the uncouplers (FCCP, CCCP, and TCP) and a clear separation of the non-uncoupler, BaP (Figure 4B). Again, it can be seen that CCCP and FCCP are more closely related in comparison to TCP but all uncouplers are more similar to each other than to BaP. To further demonstrate the similarities between the uncouplers the correlation coefficient between treatments is calculated. TCP, FCCP, and CCCP all have a correlation coefficient above 0.7, whereas BaP only shows a negative correlation with the other compounds below 0.25, for the 500 most varying genes and the most regulated genes (Table 4). The result of a PCA analysis are shown in Figure 5. Also in the PCA a clear separation from the uncoupler and BaP is observable. An overlap of expressed genes showed that only five genes are regulated by all treatments. Whereas, 125 genes are regulated by all of the uncouplers (Figure 6, Table S1). In summary, the gene expression profiles induced by these three compounds clustered closely together, and separated clearly from the “non-uncoupling negative control,” BaP. Importantly, the cluster analysis was not done using genes selected on the basis of mechanistic knowledge, but it simply relied on those genes which showed the strongest variation or regulation. It is not only that similar genes are regulated by these substances, but a majority of the genes is regulated in the same direction indicating the existence of a MoA specific gene expression profile.
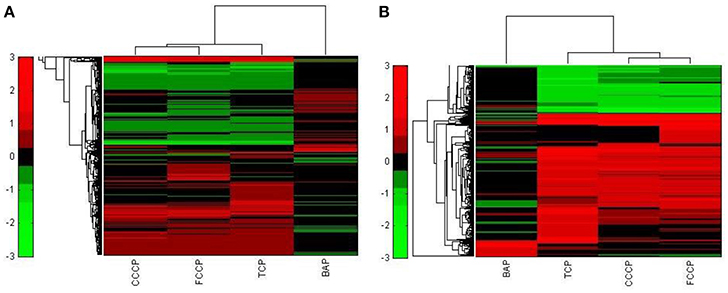
Figure 4. Hierarchical cluster analysis of C3A cells exposed to 3 compounds (FCCP, CCCP, and TCP) with a known uncoupling MoA and BaP). (A) The hierarchical cluster analysis is based on the 5000 most varying genes. (B) The hierarchical cluster analysis is based on the significantly regulated genes (|M| > 1).
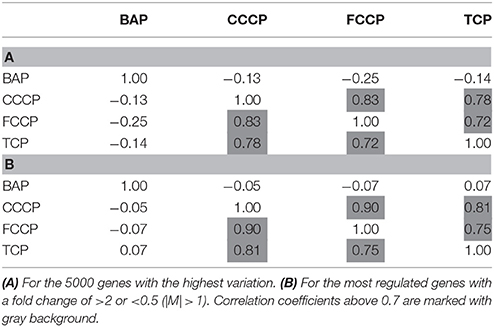
Table 4. Correlation coefficient between treatments for microarray experiment 1.
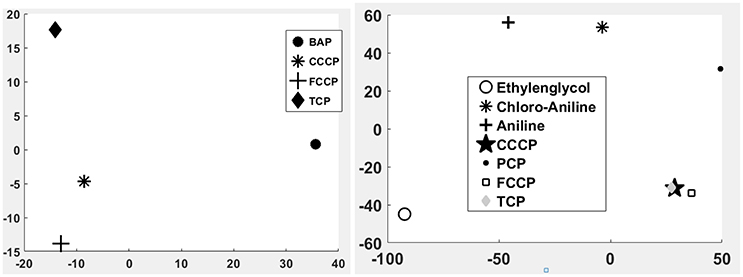
Figure 5. Principle component analysis (PCA) of the 1st microarray experiment (Left) and the 2nd microarray experiment (Right). Clear differences between uncoupler and non-uncoupler can be observed.
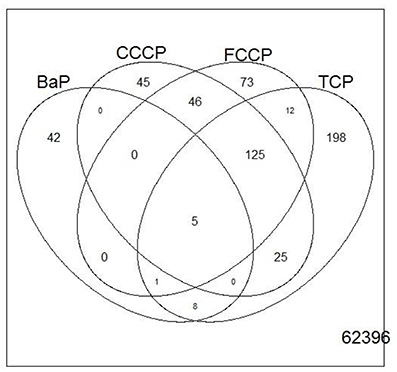
Figure 6. Venn diagram showing the overlap of genes that were regulated with a fold change of >2 or <0.5 (|M| > 1) between treatments of microarray experiment 1. Only five genes overlap between all treatments.
MoA Specific Gene Expression Profile at Cytotoxic Based Concentrations
While the former experiment used two strongly contrasting MoAs—uncoupling vs. AhR activation—in a next experiment we asked if the toxicogenomic profiles of compounds with more similar MoA can be distinguished. To this end, two aniline compounds and PCP were included which are suggested to have a polar narcotic MoA, as well as ethylenglycol, which has a narcotic MoA. Structure-based MoA assignments generate equivocal results concerning the separation between polar narcosis and uncoupling (Schüürmann et al., 1996), with some studies classifying the anilines and PCP as uncouplers, while other studies classifying them as polar narcotics (Russom et al., 1997; Schüürmann et al., 1997; Argese et al., 2001; Spycher et al., 2008a; Janssens et al., 2011; Dom et al., 2012). Since these test chemicals are not unequivocally classified as uncouplers, the TMRM assay could not be used for the selection of equipotent test concentrations. Therefore, a cytotoxicity test was applied to derive EC25 equipotent concentrations (Figure 3). The initial analysis of the gene expression data was conducted using the 5000 most varying genes. The clustering results are shown in Figure 7A. Again, each of the compounds tested induced an individual gene expression profile but additionally similarities between the profiles existed. The most similar expression profiles were shown by CCCP, TCP, and FCCP. Thus, for the uncoupler set, the gene expression profiles confirmed the previous results and indicate that these three compounds cluster together. When comparing regulated genes of the uncoupler set between the first and second microarray experiment, a clear overlap could be seen (Figure 8). As expected, the higher concentrations of the second microarray experiment (EC25 cytotoxicity) altered more genes than the EC50 from the TMRM assay. TCP was applied in both experiments at similar concentrations therefore there was also a high overlap of altered genes. The heat map shows a clearly separated cluster of aniline and Cl-aniline vs. the core uncoupler cluster (CCCP, FCCP, and TCP). The third cluster exhibited by cluster analysis was the narcotic compound, ethylenglycol. When focusing on the most significantly regulated genes, the core uncoupler set clustered together (Figure 7B). Again, PCP clustered together with the uncoupler set but is most distinct. The second cluster can be observed for the narcotics (Aniline and Cl-aniline) tested. The polar narcotic ethylenglycol is clearly separated from the other cluster. The results of the hierarchical clustering are also reflected in the correlation coefficient analysis (Tables 5A,B). The core uncoupler all correlate with a coefficient of above 0.7. The same holds for the anilines. Ethylenglycol does not correlate with any other treatment. The PCA analysis also shows that ethylenglycol is separated from the other treatments (Figure 5B). The number of significantly differently expressed genes for all treatments is shown in Table 6. Aniline, Ethylenglycol and PCP changed the most genes whereas TCP and Cl-aniline altered the least number of genes. This shows that the grouping of compounds is not based on number of regulated genes.
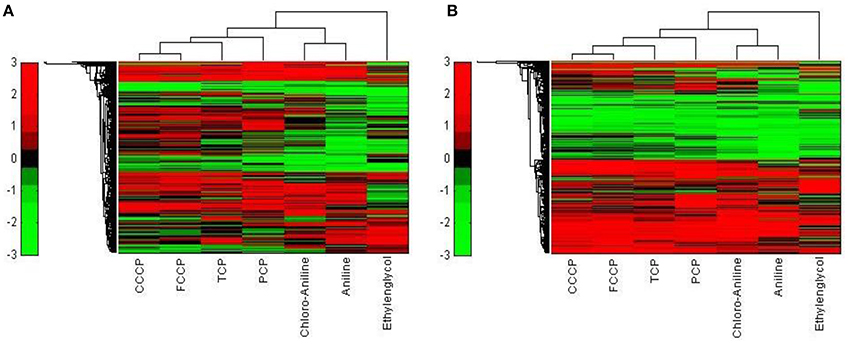
Figure 7. Hierarchical cluster analysis of C3A cells exposed to seven compounds (Ethylenglycol, Cl-aniline, Aniline, PCP, CCCP, FCCP, and TCP). (A) The hierarchical cluster analysis is based on the 5000 most varying genes. (B) The hierarchical cluster analysis is based on the significantly regulated genes (|M| > 2 and padj < 0.1).
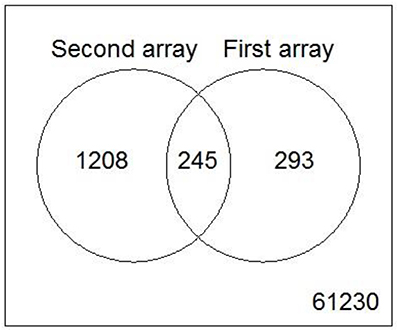
Figure 8. Venn diagram showing the overlap of genes from the core uncoupler set that were regulated in both microarray experiments.
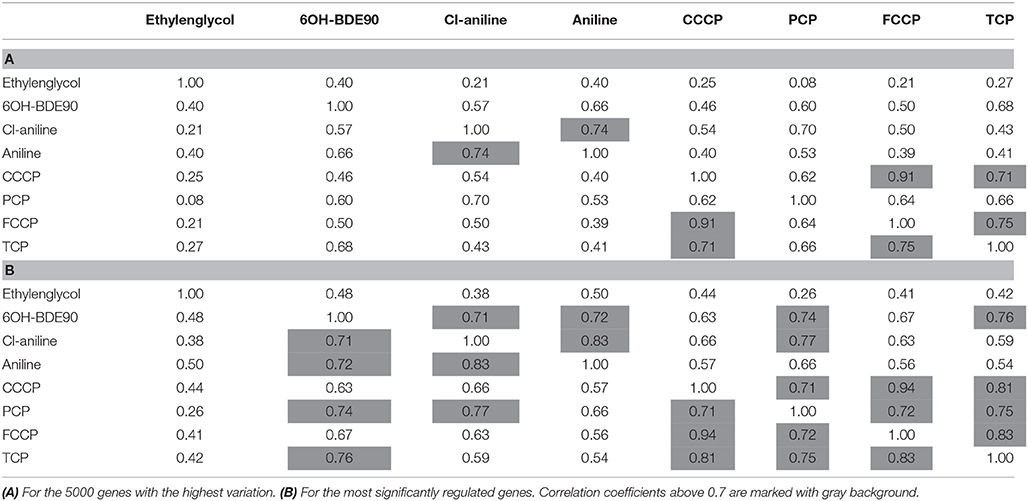
Table 5. Correlation coefficient between treatments for microarray experiment 2.
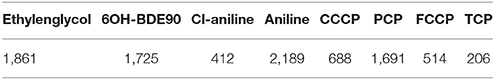
Table 6. Number of genes that are significant gene regulation (|M| > 2 and padj < 0.1) in microarray experiment 2.
Toxiogenomic-Based MoA Assignment of a Chemical with Unknown MoA
In order to test the discrimination power of the toxicogenomic approach, we tested the brominated flame retardant metabolite 6OH-BDE90 for which structural criteria do not allow a MoA assignment, but an uncoupling MoA is suspected on the basis of bioassay data. 6OH-BDE90 clustered together with the narcotics, when the 5000 most varying genes were used (Figure 9A). When analyzed for significant gene regulation (|M| > 2 and padj < 0.1), 6OH-BDE90 clusters together with PCP forming a new cluster group next to the polar narcotics (Figure 9B).
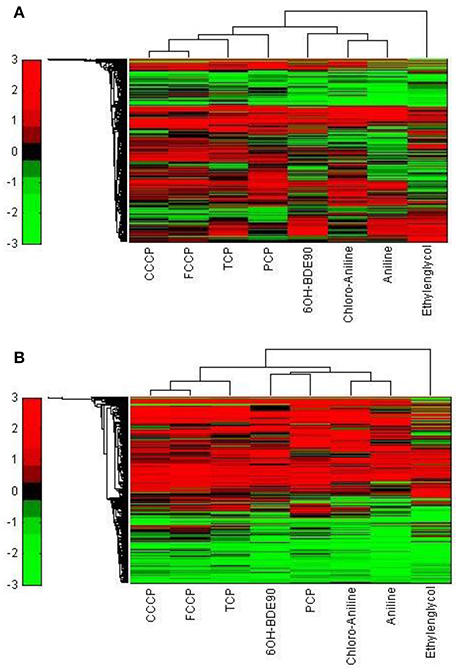
Figure 9. Hierarchical cluster analysis of C3A cells exposed to eight compounds including 6OH-BDE90 (Ethylenglycol, Cl-aniline, Aniline, PCP, CCCP, FCCP, and TCP). (A) The hierarchical cluster analysis is based on the significantly regulated genes (|M| > 2 and padj < 0.1). (B) The hierarchical cluster analysis is based on the 5000 most varying genes.
Other studies confirm the equivocal behavior of PCP and 6OH-BDE90. Tests conducted by Legradi et al. (2014) including PCP, 6OH-BDE90, and FCCP show in regard to the TPP+ assay which does not give a positive response for narcotic substances, PCP and FCCP exhibit a similar LOEC whereas 6OH-BDE90 has a much higher LOEC, presenting a similar potency of PCP and FCCP and a much lower potency for 6OH-BDE90. This finding is in line with our classification analysis based on the 5000 most varied genes (Figure 9A).
However, when comparing the effects of the three substances in the a TMRM assay, which also gives a positive response for uncoupling and narcotic substances, 6OH-BDE90 and PCP both alter the membrane potential in a similar concentration range whereas FCCP proves to be highly more potent (Legradi et al., 2014). In line with our classification analysis based on the significantly regulated genes, where 6OH-BDE90 and PCP from a new sub cluster together next to the polar narcotics (Figure 9B).
It appears that 6OH-BDE90 and PCP have the potential for both uncoupling and polar narcosis, depending on test conditions (concentration, duration) or test species (Sixt et al., 1995; Schüürmann et al., 1997; Legradi et al., 2014). The findings presented in this study suggest that the toxicogenomic approach is able to elucidate differences in MoA. In the case that compounds act via several highly similar MoA, toxicogenomics can reveal this and assign a compound to more than one MoA. Nevertheless, the array has the advantage to demonstrate in one single assay the diverse activity potentials of a compound and this information is a valuable complement to structure-based classification schemes.
In chemical risk assessment, MoA information is critical for proper hazard classification as compounds belonging to the same MoA class should show similar toxicity (Verhaar et al., 2000; Cronin and Livingstone, 2004; Nendza and Wenzel, 2006; Vonk et al., 2009). To date, the assignment of a chemical to a MoA is largely done on the basis of structural rules (Bradbury and Lipnick, 1990; Russom et al., 1997; Schüürmann, 1998). This study explored the potential of toxicogenomic profiles in MoA grouping of chemicals. Classification of chemicals and MoA identification was made purely with discriminative gene expression profiles and without any mechanistic profiling like pathway analysis. The results strongly suggest that transcript profiling indeed is able to identify MoA of chemicals and also is able to distinguish between MoA. Furthermore, as chemicals typically display several MoA, depending on the exposure concentration, duration, biological receptor etc., this ambiguity are well revealed by the array data, since high content methodologies such as toxicogenomics are appropriate tools to deal with such multi-dimensional properties. The present study exemplified this for the cases PCP and 6OH-BDE90 where structural rules yield equivocal results. The applicability of our approach for more MoA and larger chemical sets needs to be further investigated. Proper selection of reference compounds is essential and might be limited. Defining similarity and defining groups might also be more complicated when more MoA are included and advanced statistical analysis necessary. Exposure time could also be adapted to get more specific profiles. For certain MoA a treatment duration of 2 h might not be enough to induce a discriminative profile whereas for other MoA a longer exposure might be too long and mostly general stress response effects visible. Nevertheless, our results indicate that toxicgenomics profiling might be a useful approach for MoA assessment of chemicals.
Author Contributions
AH-I and JeL performed the microarray experiments. AH-I did the cell experiments and JeL the TTP assay. JeL did the microarray analysis. PC did the analysis of the cell data. JuL and HS were involved in the design and managing of the experiments and the interpretation of the data. All authors contributed in the writing of the manuscript.
Conflict of Interest Statement
The authors declare that the research was conducted in the absence of any commercial or financial relationships that could be construed as a potential conflict of interest.
Acknowledgments
The authors thank F. Rustenburg (VU MC) for help with the microarrays and Simon Spycher for helping to select the test compounds.
Supplementary Material
The Supplementary Material for this article can be found online at: https://www.frontiersin.org/articles/10.3389/fenvs.2017.00080/full#supplementary-material
References
Abu-Amero, K. K., and Bosley, T. M. (2005). Detection of mitochondrial respiratory dysfunction in circulating lymphocytes using resazurin. Arch. Pathol. Lab. Med. 129, 1295–1298. doi: 10.1043/1543-2165(2005)129[1295:DOMRDI]2.0.CO;2
Argese, E., Bettiol, C., Agnoli, F., Zambon, A., Mazzola, M., and Ghirardini, A. V. (2001). Assessment of chloroaniline toxicity by the submitochondrial particle assay. Environ. Toxicol Chem. 20, 826–832. doi: 10.1002/etc.5620200418
Barron, M. G., Lilavois, C. R., and Martin, T. M. (2015). MOAtox: a comprehensive mode of action and acute aquatic toxicity database for predictive model development. Aquat. Toxicol. 161, 102–107. doi: 10.1016/j.aquatox.2015.02.001
Blackburn, K., Bjerke, D., Daston, G., Felter, S., Mahony, C., Naciff, J., et al. (2011). Case studies to test: a framework for using structural, reactivity, metabolic and physicochemical similarity to evaluate the suitability of analogs for SAR-based toxicological assessments. Regul. Toxicol. Pharmacol. 60, 120–135. doi: 10.1016/j.yrtph.2011.03.002
Bradbury, S. P., and Lipnick, R. L. (1990). Introduction : structural properties for determining mechanisms of toxic action. Environ. Health Perspect. 87, 181–182.
Brand, M. D., and Nicholls, D. G. (2011). Assessing mitochondrial dysfunction in cells. Biochem. J. 435, 297–312. doi: 10.1042/BJ20110162
Carmichael, N., Bausen, M., Boobis, A. R., Cohen, S. M., Embry, M., Fruijtier-Pölloth, C., et al. (2011). Using mode of action information to improve regulatory decision-making: an ECETOC/ILSI RF/HESI workshop overview. Crit. Rev. Toxicol. 41, 175–186. doi: 10.3109/10408444.2010.541225
Cronin, M. T. D., and Livingstone, D. J. (2004). Predicting Chemical Toxicity and Fate. Boca Raton, FL: CRC Press.
Dom, N., Vergauwen, L., Vandenbrouck, T., Jansen, M., Blust, R., and Knapen, D. (2012). Physiological and molecular effect assessment versus physico-chemistry based mode of action schemes: daphnia magna exposed to narcotics and polar narcotics. Environ. Sci. Technol. 46, 10–18. doi: 10.1021/es201095r
Edwards, S. W., and Preston, R. J. (2008). Systems biology and mode of action based risk assessment. Toxicol. Sci. 106, 312–318. doi: 10.1093/toxsci/kfn190
Ehrenberg, B., Montana, V., Wei, M. D., Wuskell, J. P., and Loew, L. M. (1988). Membrane potential can be determined in individual cells from the nernstian distribution of cationic dyes. Biophys. J. 53, 785–794. doi: 10.1016/S0006-3495(88)83158-8
Enoch, S. J., Hewitt, M., Cronin, M. T., Azam, S., and Madden, J. C. (2008). Classification of chemicals according to mechanism of aquatic toxicity: an evaluation of the implementation of the Verhaar scheme in toxtree. Chemosphere 73, 243–248. doi: 10.1016/j.chemosphere.2008.06.052
Escher, B. I., Bramaz, N., Eggen, R. I. L., and Richter, M. (2005). In vitro assessment of modes of toxic action of pharmaceutical in aquatic life. Environ. Sci. Technol. 39, 3090–3100. doi: 10.1021/es048590e
Escher, B. I., and Hermens, J. L. (2002). Modes of action in ecotoxicology: their role in body burdens, species sensitivity, QSARs, and mixture effects. Environ. Sci. Technol. 36, 4201–4217. doi: 10.1021/es015848h
Escher, B. I., Snozzi, M., and Schwarzenbach, R. P. (1996). Uptake, speciation, and uncoupling activity of substituted phenols in energy transducing membranes. Environ. Sci. Technol. 30, 3071–3079. doi: 10.1021/es960153f
Hamadeh, H. K., Bushel, P. R., Jayadev, S., Martin, K., DiSorbo, O., Sieber, S., et al. (2002). Gene expression analysis reveals chemical-specific profiles. Toxicol. Sci. 67, 219–231. doi: 10.1093/toxsci/67.2.219
Hänninen, S. L., Ronkainen, J. J., Leskinen, H., and Tavi, P. (2010). Mitochondrial uncoupling downregulates calsequestrin expression and reduces SR Ca2+ stores in cardiomyocytes. Cardiovasc. Res. 88, 75–82. doi: 10.1093/cvr/cvq180
Hockley, S. L., Mathijs, K., Staal, Y. C., Brewer, D., Giddings, I., van Delft, J. H., et al. (2009). Interlaboratory and interplatform comparison of microarray gene expression analysis of HepG2 cells exposed to benzo(a)pyrene. OMICS 13, 115–125. doi: 10.1089/omi.2008.0060
Janssens, T. K., Giesen, D., Mariën, J., van Straalen, N. M., van Gestel, C. A., and Roelofs, D. (2011). Narcotic mechanisms of acute toxicity of chlorinated anilines in folsomia candida (Collembola) revealed by gene expression analysis. Environ. Int. 37, 929–939. doi: 10.1016/j.envint.2011.03.012
Kamo, N., Muratsugu, M., Hongoh, R., and Kobatake, Y. (1979). Membrane potential of mitochondria measured with an electrode sensitive to tetraphenyl phosphonium and relationship between proton electrochemical potential and phosphorylation potential in steady state. J. Membr. Biol. 49, 105–121. doi: 10.1007/BF01868720
Kavlock, R., Chandler, K., Houck, K., Hunter, S., Judson, R., Kleinstreuer, N., et al. (2012). Update on EPA's toxcast program: providing high throughput decision support tools for chemical risk management. Chem. Res. Toxicol. 25, 1287–1302. doi: 10.1021/tx3000939
Kienzler, A., Barron, M. G., Belanger, S. E., Beasley, A., and Embry, M. R. (2017). Mode of action (MOA) assignment classifications for ecotoxicology: an evaluation of approaches. Environ. Sci. Technol. 51, 10203–10211. doi: 10.1021/acs.est.7b02337
Kiyosawa, N., Manabe, S., Yamoto, T., and Sanbuissho, A. (2010). Practical application of toxicogenomics for profiling toxicant-induced biological perturbations. Int. J. Mol. Sci. 11, 3397–3412. doi: 10.3390/ijms11093397
LeBlanc, O. H. Jr. (1971). The effect of uncouplers of oxidative phosphorylation on lipid bilayer membranes: carbonylcyanide M-chlorophenylhydrazone. J. Membr. Biol. 4, 227–251. doi: 10.1007/BF02431973
Legradi, J., Dahlberg, A. K., Cenijn, P., Marsh, G., Asplund, L., Bergman, Å., et al. (2014). Disruption of oxidative phosphorylation (OXPHOS) by hydroxylated polybrominated diphenyl ethers (OH-PBDEs) present in the marine environment. Environ. Sci. Technol. 48, 14703–14711. doi: 10.1021/es5039744
Lichtshtein, D., Kaback, H. R., and Blume, A. J. (1979). Use of a lipophilic cation for determination of membrane potential in neuroblastoma-glioma hybrid cell suspensions. Proc. Natl. Acad. Sci. U.S.A. 76, 650–654. doi: 10.1073/pnas.76.2.650
Lim, M. L., Minamikawa, T., and Nagley, P. (2001). The protonophore CCCP induces mitochondrial permeability transition without cytochrome c release in human osteosarcoma cells. FEBS Lett. 503, 69–74. doi: 10.1016/S0014-5793(01)02693-X
Mantus, E. (2007). Alttox.Org Toxicity Testing in the 21st Century. Available online at: http://alttox.org/toxicity-testing-in-the-21st-century
Marsh, G., Hu, J., Jakobsson, E., Rahm, S., and Bergman, Å. (1999). Synthesis and characterization of 32 polybrominated diphenyl ethers. Environ. Sci. Technol. 33, 3033–3037. doi: 10.1021/es9902266
Marsh, G., Stenutz, R., and Bergman, Å. (2003). Synthesis of hydroxylated and methoxylated polybrominated diphenyl ethers – natural products and potential polybrominated diphenyl ether metabolites. Eur. J. Org. Chem. 2003, 2566–2576. doi: 10.1002/ejoc.200300081
Martin, Y. C., Kofron, J. L., and Traphagen, L. M. (2002). Do structurally similar molecules have similar biological activity ? Do structurally similar molecules have similar biological activity ? J. Med. Chem. 45, 4350–4358. doi: 10.1021/jm020155c
McKim, J. M., Bradbury, S. P., and Niemi, G. J. (1987). Fish acute toxicity syndromes and their use in the QSAR approach to hazard assessment. Environ. Health Perspect. 71, 171–186. doi: 10.1289/ehp.8771171
McLaughlin, S. G., and Dilger, J. P. (1980). Transport of protons across membranes by weak acids. Physiol. Rev. 60, 825–863.
Meganathan, K., Jagtap, S., Wagh, V., Winkler, J., Gaspar, J. A., Hildebrand, D., et al. (2012). Identification of thalidomide-specific transcriptomics and proteomics signatures during differentiation of human embryonic stem cells. PLoS ONE 7:e44228. doi: 10.1371/journal.pone.0044228
Nendza, M., and Müller, M. (2001). Discriminating toxicant classes by mode of action: 2. physico-chemical descriptors. Quant. Struct. Activity Relationships 19, 581–598. doi: 10.1002/1521-3838(200012)19:6<581::AID-QSAR581>3.0.CO;2-A
Nendza, M., and Wenzel, A. (2006). Discriminating toxicant classes by mode of action. 1. (Eco)toxicity profiles. Environ. Sci. Pollut. Res. Int. 13, 192–203. doi: 10.1065/espr2006.01.013
NRC (2007). Applications of Toxicogenomic Technologies to Predictive Toxicology and Risk Assessment. Available online at: http://www.ncbi.nlm.nih.gov/books/NBK10219/
Pereira-Fernandes, A., Vanparys, C., Vergauwen, L., Knapen, D., Jorens, P. G., and Blust, R. (2014). Toxicogenomics in the 3T3-L1 cell line, a new approach for screening of obesogenic compounds. Toxicol. Sci. 140, 352–363. doi: 10.1093/toxsci/kfu092
Piña, B., and Barata, C. (2011). A genomic and ecotoxicological perspective of DNA array studies in aquatic environmental risk assessment. Aquat. Toxicol. 105, 40–49. doi: 10.1016/j.aquatox.2011.06.006
Richard, A. M. (2006). Future of toxicology-predictive toxicology: an expanded view of ‘chemical toxicity’. J. Med. Chem. 19, 1257–1262. doi: 10.1021/tx060116u
Russom, C. L., Bradbury, S., Broderius, S. J., Hammermeister, D., Drummond, R. A., and Veith, G. D. (1997). Predicting modes of toxic action from chemical structure: acute toxicity in the fathead minnow (Pimephales promelas). Environ. Toxicol. Chem. 16, 948–967. doi: 10.1002/etc.5620160514
Schüürmann, G. (1998). “Ecotoxic modes of action of chemical substances,” in Ecotoxicology: Ecological Fundamentals, Chemical Exposure, and Biological Effects, eds G. Schüürmann and B. Markert, (John Wiley/Spektrum Akademischer Verlag), 665–749.
Schüürmann, G., Aptula, A. O., Kühne, R., and Ebert, R. U. (2003). Stepwise discrimination between four modes of toxic action of phenols in the Tetrahymena Pyriformis assay. Chem. Res. Toxicol. 16, 974–987. doi: 10.1021/tx0340504
Schüürmann, G., Segner, H., and Jung, K. (1997). Multivariate mode-of-action analysis of acute toxicity of phenols. Aquat. Toxicol. 38, 277–296. doi: 10.1016/S0166-445X(96)00842-9
Schüürmann, G., Somashekar, R. K., and Kristen, U. (1996). Structure–activity relationships for chloro- and nitrophenol toxicity in the pollen tube growth test. Environ. Toxicol. Chem. 15, 1702–1708. doi: 10.1002/etc.5620151008
Shioda, T., Chesnes, J., Coser, K. R., Zou, L., Hur, J., Dean, K. L., et al. (2006). Importance of dosage standardization for interpreting transcriptomal signature profiles: evidence from studies of xenoestrogens. Proc. Natl. Acad. Sci. U.S.A. 103, 12033–12038. doi: 10.1073/pnas.0605341103
Sixt, S., Altschuh, J., and Brueggemann, R. (1995). Quantitative structure-toxicity relationships for 80 chlorinated compounds using quantum chemical descriptors. Chemosphere 30, 2397–2414. doi: 10.1016/0045-6535(95)00111-K
Spycher, S., Escher, B. I., and Gasteiger, J. (2005). A quantitative structure–activity relationship model for the intrinsic activity of uncouplers of oxidative phosphorylation. Chem. Res. Toxicol. 18, 1858–1867. doi: 10.1021/tx050166j
Spycher, S. L. (2005). Classification of Organic Compounds into Modes of Toxic Action. Ph.D. dissertation, Friedrich-Alexander-Universität Erlangen-Nürnberg, Available online at: https://opus4.kobv.de/opus4-fau/frontdoor/index/index/docId/198
Spycher, S., Netzeva, T. I., Worth, A. P., and Escher, B. I. (2008a). Mode of action-based classification and prediction of activity of uncouplers for the screening of chemical inventories. SAR QSAR Environ. Res. 19, 433–463. doi: 10.1080/10629360802348803
Spycher, S., Smejtek, P., Netzeva, T. I., and Escher, B. I. (2008b). Toward a class-independent quantitative structure–activity relationship model for uncouplers of oxidative phosphorylation. Chem. Res. Toxicol. 21, 911–927. doi: 10.1021/tx700391f
Stöckl, P., Zankl, C., Hütter, E., Unterluggauer, H., Laun, P., Heeren, G., et al. (2007). Partial uncoupling of oxidative phosphorylation induces premature senescence in human fibroblasts and yeast mother cells. Free Radic. Biol. Med. 43, 947–958. doi: 10.1016/j.freeradbiomed.2007.06.005
Terada, H. (1981). The interaction of highly active uncouplers with mitochondria. Biochim. Biophys. Acta Rev. Bioenerget. 639, 225–242.
Theunissen, P. T., Robinson, J. F., Pennings, J. L., van Herwijnen, M. H., Kleinjans, J. C., and Piersma, A. H. (2012). Compound-specific effects of diverse neurodevelopmental toxicants on global gene expression in the neural embryonic stem cell test (ESTn). Toxicol. Appl. Pharmacol. 262, 330–340. doi: 10.1016/j.taap.2012.05.011
Verhaar, H. J. M., Van Leeuwen, C. J., and Hermens, J. L. M. (1992). Classifying environmental pollutants 1 : structure-activity relationships for prediction of aquatic toxicity 1. Chemosphere 25, 471–491. doi: 10.1016/0045-6535(92)90280-5
Verhaar, H. J., Solbé, J., Speksnijder, J., van Leeuwen, C. J., and Hermens, J. L. (2000). Classifying environmental pollutants: part 3. external validation of the classification system. Chemosphere 40, 875–883. doi: 10.1016/S0045-6535(99)00317-3
Vonk, J. A., Benigni, R., Hewitt, M., Nendza, M., Segner, H., van de Meent, D., et al. (2009). The use of mechanisms and modes of toxic action in integrated testing strategies: the report and recommendations of a workshop held as part of the European union OSIRIS integrated project. Altern. Lab. Anim. 37, 557–571.
Whitmore, D., Foulkes, N. S., and Sassone-Corsi, P. (2000). Light acts directly on organs and cells in culture to set the vertebrate circadian clock. Nature 404, 87–91. doi: 10.1038/35003589
Woods, C. G., Heuvel, J. P., and Rusyn, I. (2007). Genomic profiling in nuclear receptor-mediated toxicity. Toxicol. Pathol. 35, 474–494. doi: 10.1080/01926230701311351
Keywords: OXPHOS, in vitro, toxicogenomics, microarray, mode of action, uncoupler, chemical risk assessment
Citation: Hawliczek-Ignarski A, Cenijn P, Legler J, Segner H and Legradi J (2017) Mode of Action Assignment of Chemicals Using Toxicogenomics: A Case Study with Oxidative Uncouplers. Front. Environ. Sci. 5:80. doi: 10.3389/fenvs.2017.00080
Received: 28 August 2017; Accepted: 13 November 2017;
Published: 29 November 2017.
Edited by:
Chris Vulpe, University of Florida, United StatesReviewed by:
Keith Houck, Environmental Protection Agency, United StatesChanna Keshava, U.S. Environmental Protection Agency, United States
Copyright © 2017 Hawliczek-Ignarski, Cenijn, Legler, Segner and Legradi. This is an open-access article distributed under the terms of the Creative Commons Attribution License (CC BY). The use, distribution or reproduction in other forums is permitted, provided the original author(s) or licensor are credited and that the original publication in this journal is cited, in accordance with accepted academic practice. No use, distribution or reproduction is permitted which does not comply with these terms.
*Correspondence: Jessica Legradi, SmVzc2ljYS5sZWdyYWRpQHZ1Lm5s
†Present Address: Juliette Legler, Institute for Environment, Health and Societies, Brunel University London, Uxbridge, United Kingdom