 Michael Bock1
 Pierre-Yves Gasser2Wayne W. Pettapiece1Anthony J. Brierley1Andy Bootsma2Peter Schut2Denise Neilsen3
 C. A. Scott Smith3*
- 1Science and Technology Branch, Agriculture and Agri-Food Canada, Edmonton, AB, Canada
- 2Science and Technology Branch, Agricultural and Agri-Food Canada, Ottawa, ON, Canada
- 3Science and Technology Branch, Agriculture and Agri-Food Canada, Summerland, BC, Canada
The Land Suitability Rating System (LSRS) is a rule-based set of algorithms that integrate soil, climate and landscape factors to calculate a classed suitability rating for a given landscape to support commercial field crop production. The attributes used to define each of the factors are based on their proven ability to affect crop growth, their ability to be measured (or estimated by proxy) and their availability in accessible databases. The LSRS was first published in 1995 by Agriculture and Agri-Food Canada as a site-specific, manual calculator for spring-seeded small grains that incorporated sets of attribute point deduction curves based on expert knowledge. Since that time the system has been expanded to include additional crop modules and all data handling and calculations are automated through a set of web-based applications. The current version of LSRS (version 5) is implemented in Ruby on Rails® software as a suite of web services. The system runs against any soil map with standardized Canadian Soil Information Service soil data tables to process soil attributes and calculate limitations to crop growth. A climate factor rating is based on crop-specific agro-climatic indices and thresholds. Climatic indices have historically been calculated from 30-year climate normal periods using monthly data but LSRS can now also utilize daily data records which facilitate trend analyses within annual historic records. The use of available gridded climate datasets enables direct overlay and extraction of climate attributes to the spatial extent of soil map polygons. Lastly, the system incorporates a landscape factor related to land erodibility and constraints to management. Each of the three suitability factors is assigned a class rating between 1 (no limitations) and 7 (unsuitable) with the final overall rating being the most limiting of the three factors. Recent improvements in the ability of the system to process multiple climate datasets mean outputs from Global Circulation Models may also be useful for the LSRS model in assessing possible impacts of climate change on crop suitability. LSRS is used increasingly as a spatial research tool in assessing potential changes in crop distributions at both national and regional scales.
Introduction
The identification of soil landscapes suitable for production of food no doubt began with the dawn of arable agriculture. “Pedology and soil science in general have their rudimentary beginnings in attempts to group or classify soils on the basis of productivity. Early agrarian civilizations must have had some way to communicate differences and similarities among soils.” Ahrens et al. (2002). In the early 1900's, German agronomist A. D. Thaer proposed a scale to describe the intrinsic fertility of soil based on attributes such as soil texture, calcium carbonate content and organic matter content (Feller et al., 2003). These early assessments were very subjective and qualitative based on general observations of features such as topography, stoniness, wetness and tree cover.
As agriculture became more mechanized and intensified in the twentieth century, there was a concomitant increase in scientific research into the agronomic requirements of cultivated crops. The evaluation of production potential became much more specific and quantitative with assessments such as the Storie Index Rating (Storie, 1933). This mathematical treatment of individual parameters such as texture, organic matter and pH was well accepted by the technical community of soil specialists. Ratings based on his procedure were incorporated into numerous soil reports produced as part of the National Cooperative Soil Survey Program in the United States (see, for example, Goodman, 1955; Arroues and Anderson, 1986). In the province of Alberta, Canada, soil survey reports from the late 1930s to the late 1950s included an interpretive land class map derived primarily from the physical characteristics of the study area. When compiling the map, soil physical data (texture, surface color, pH, soil taxon, mode of deposition, and degree of stoniness), landscape data (topographic form and relief) and climate data (rainfall and rainfall variability) were all taken into consideration (Wyatt et al., 1939). Each of these factors was assigned a numeric value for each soil area, and the multiplying together of these values gave the final index rating of the soil area. Using available pasture carrying capacity and wheat yield data, a seven-class productivity grouping of these rated areas was created. Some of the later soil survey reports produced through the end of the 1960s incorporated a stocking rate and/or wheat yield range for each group as an estimate of productivity (see, for example, Bowser et al., 1951; Odynsky et al., 1952).
By the middle of the century with greater intensification and further expansion into the less suitable fringe lands, there was recognition that some of the agricultural practices associated with the push for higher productivity were negatively affecting environmental sustainability (Standing Committee on Agriculture, Fisheries and Forestry, 1984). In Canada, this discussion had started with the wind erosion concerns in the 1920s and 30s. There was increasing competition with other land uses such as forestry, wildlife habitat, and recreation all associated with a growing population. It was into this setting that the broader concept of land capability, which included an aspect of sustainability, was introduced both in the United States (Klingebiel and Montgomery, 1961) and Canada (Agriculture and Rural Development Act, 1965).
The Canada Land Inventory (CLI) was introduced in Canada in the mid-1960s under the program of the federal Agriculture and Rural Development Act. The system used a general comparative capability approach based on severity of limitations for broadly defined land uses, specifically, agriculture, forestry, wildlife, and recreation. In the words of the authors of the first CLI report, the new system “is designed primarily for planning rather than for management. It is of a reconnaissance type, it provides information essential for land development planning at the municipal, provincial and federal levels of government. It does not provide the detailed information required for management of individual parcels of land, nor for land planning in small watersheds, local government units, etc.” (Agriculture and Rural Development Act, 1965) The capability ratings were to be presented on maps at a scale of 1:250,000. At the time of its development, the then relatively new profession of land use planning was becoming important and quickly embraced this new rating system as capability was an intuitive and easily understandable concept. Municipal planners and realtors particularly liked the approach. The classification system incorporated seven classes with Class 1 being the best with no limitation for the intended use, Class 4 being marginal for the use and Class 7 being completely unsuitable. Under the umbrella of a cooperative federal-provincial program, approximately 2.5 million hectares covering all regions of Canada with multiple land use issues associated with agriculture were mapped from 1965 to 1980 using the CLI (Canada Land Inventory, 1998).
The CLI system worked very well for its intended regional development objectives; however, these regional assessments, while based on specific soil and land information still required a significant amount of subjective interpretation, extrapolation and amalgamation and climate was not considered in the ratings. In addition, the capability classes were categorical and while well-suited to land use planning functions they were less useful for more detailed analysis such as assessing the productivity function of soils (Mueller et al., 2010). Many land evaluators and managers required a much more detailed assessment at scales of 1:50,000 or larger (with units as small as several hectares), but in many areas there simply was not a more detailed soil database available. The CLI, however, was not intended for use at detailed or site-specific scales (Alberta Energy and Natural Resources, 1983). Attempts to extend the CLI approach to address the more detailed requirements provided variable results. Over the years, agencies in a number of jurisdictions either modified the original CLI system or developed entirely new systems of land capability classification for a variety of purposes. In other instances, soils specialists with different agencies within a province simply used two parallel systems following the CLI and Storie-type approaches (Alberta Soils Advisory Committee, 1983). If one person or one closely correlated group was providing the interpretations there was at least consistency within a region; however, as more people and agencies became involved, consistent evaluations became a problem (Alberta Soils Advisory Committee, 1987).
The overall result was that by the mid-1980s there were many agricultural rating systems being used across Canada. These included the systems used in the Atlantic Region (Atlantic Advisory Committee on Soil Survey, 1988), Quebec (Mailloux et al., 1984), the Ottawa area (Marshall et al., 1979), Ontario (Brooke and Presant, 1986), Alberta (Alberta Soils Advisory Committee, 1987), and British Columbia (Kenk and Cotic, 1983). With different parameters and thresholds, the same crops could have different absolute ratings under the different systems. The original CLI was also not consistent across Canada as the ratings were based on regionally important crops that differed from one region to another. For example, an area rated as CLI Class 1 for agriculture in Saskatchewan would be based on wheat and other small grains while an area rated as CLI Class 1 for agriculture in Ontario would have to grow corn.
The use of multiple capability classification systems as well as the inconsistent manner in which the CLI was being applied nationally resulted in confusion and disagreement. The topic was raised at the meeting of the Canadian Expert Committee on Soil Survey in 1986. Agriculture and Agri-Food Canada's then Land Resource Research Centre responded by creating an Agronomic Interpretations Working Group (AIWG) in 1987 to pursue the development of a national rating system for Canada. It was asked to address several specific concerns related to the CLI-Soil Capability for Agriculture, namely:
• The proliferation of modifications to the CLI by provincial departments that had resulted in a variety of inconsistent methods used in the classification of land capability for agriculture across Canada;
• The inadequate consideration of the role of climate on land suitability for crop production;
• The omission of organic soils in the CLI, and;
• The lack of specificity in definitions and applications which lead to inconsistent ratings by those applying the system.
The result of the work was the publication in 1995 of the technical bulletin “Land Suitability Rating System for Agricultural Crops: 1. Spring-seeded small grains” (Agronomic Interpretations Working Group, 1995). The spring-seeded small grains report presented the details for the first module of LSRS. While it was anticipated by the original working group that additional crop modules would quickly follow, it would be a full decade before these would be developed.
It is the purpose of this paper then to present the story of the evolution of Canada's Land Suitability Rating System (LSRS) from its beginnings in the 1990's up to 2017. Specifically, the paper outlines the rationale associated with the initial development of LSRS, describes the model's structure and methods of implementation, describes the chronology and nature of upgrades (new versions, new modules) to the system, and presents recent examples of its application at national and regional scales.
System Background and Development
In describing the approach and methods used in the development of LSRS, the differences and usages in the terms land evaluation, land capability and land suitability warrant some discussion. Capability assesses the nature of limitations and degree of limitations imposed on cultivated agriculture by the physical characteristics of a land unit. In the New Zealand Land Use Capability classification system capability of land is defined as “its suitability for productive use or uses after considering the physical limitations of the land” (Lynn et al., 2009). The land capability classification for agriculture in the UK developed by the Macauley Land Research Institute described capability as “the agricultural potential of land based on the degree of limitation imposed by its biophysical properties” (Wright et al., 2006). Land capability classification involves systematically categorizing units of the landscape in a way that reflects the inherent ability to produce sustainably into the future (Lynn et al., 2009). In Canada, the Canada Land Inventory (CLI) series of capability maps have been an important reference for assessing present and potential land use activities and planning across Canada. However, in terms of capability ratings there have been issues related to specificity. The agricultural capability classification rates soils for their ability to sustain production of common crops based on their potentials and limitations. The underlying assumption is that the better the capability rating (i.e., Class 1 vs. Class 4) a wider variety of agricultural crops may be grown; however, the number of crops successfully grown varies from one region of Canada to another. For example, corn may be grown in the CLI Class 1 or 2 areas in southern Ontario, but within the Prairie region areas of equivalent capability cannot sustain equivalent corn crops.
In comparison, the term “land suitability” is an estimate of the fitness of a soil and its landscape for production of a specific agricultural crop (FAO, 1976). As plants have specific requirements related to the functional status of soil, classifications based on production limitations and crop productivity must have a certain stratification or orientation specific to a single crop or groups of related crops (Mueller et al., 2010). Early federal German systems used soil suitability classification terms like “prime wheat soil,” “rye soil,” or “oats soil” to describe the suitability of specific areas (Feller et al., 2003). More recently, the Muencheberg Soil Quality Rating is a soil suitability classification developed as a tool to assess the capacity of land across all scales to produce small grains (Mueller et al., 2007). Similarly, soil suitability rating systems have been developed for a variety of specific land management practices such as reduced tillage or direct drilling (Cannell et al., 1978), irrigation (Alberta Agriculture Food and Rural Development, 2000), the spreading of animal manure (Eilers and Buckley, 2002) and carcass burial (Carcass Burial Site Selection Technical Committee, 2004).
Modern land evaluation systems largely grew out of the older agricultural land capability classification. However, land evaluation is a much broader concept bringing into the assessment aspects of environmental sustainability (Smyth and Dumanski, 1995) and a range of economic and market factors that can influence land use decisions (Rossiter, 1996). Land suitability is typically one component of land evaluation. Methods of land evaluation (including land suitability) have become more sophisticated over time (Sonneveld et al., 2010) and with increased availability of large geographic and production datasets and geographic information systems, evaluations have become more quantitative and process oriented (Triantafilis et al., 2001; Joss et al., 2008; Elsheikh et al., 2013).
Initial Concepts and Assumptions
Development of LSRS was based on an “expert system” approach that made use of existing sources of data and the collective knowledge and experience of professionals from the fields of land and plant science and those familiar with the evaluation of land suitability for crop production. The Agricultural Interpretations Working Group that developed the first version of LSRS was composed of soil surveyors, agronomists and agro-climatologists from across Canada. They examined a number of systems that were being used to rate land for the production of agricultural crops, keeping in mind the need for national consistency and the other concerns raised by the Expert Committee on Soil Survey. Climatic stratifications such as those by Chapman and Brown (1966), FAO (1976), and Williams (1983) were examined.
The initial assessment recommendations were:
1. Retain framework of the seven-class CLI system. It was well established and accepted and formed the basis for land use regulations in several provinces.
2. Rate separately elements of climate, soil and landscape, each of which can independently control land suitability for crop production.
3. Organic soils must be included and rated for suitability as is done with mineral soils.
4. Use only a limited number of key parameters to optimize the rating system (Huddleston, 1984). Using an expert system approach, each should be individually defined and explicitly rated (McCracken and Cate, 1986).
5. The individual parameter ratings should follow scientifically proven relationships and be managed in a mathematical setting leading to a composite index.
6. The system should be developed using the small seeded cereals (wheat, oats and barley) with an emphasis on barley which is the one crop with widespread production in all agricultural regions of Canada.
7. The system must use data that is available across Canada.
The first recommendation provided the overall approach that should be taken while the next four addressed the major weaknesses that had been identified in the CLI approach. The final two recommendations addressed the issue of national consistency and provided further direction for system development.
It may be noted that no mention was made of scale. The reason was that the system was meant to be scale-independent–that it should have the ability to be used at any scale appropriate to the objectives of the project and available data (see section Applications of the Rating System for description of how this applies to the current use of LSRS). Preliminary discussion identified the assumptions or guidelines that were required to provide boundary conditions for the system:
• External economic factors such as distance to market, availability of transportation and size of farm would not be criteria. These are important for municipal property assessments and taxation but would not be part of this natural resource evaluation;
• One-time costs such as clearing of trees or drainage would not be criteria but continuing annual costs. Stone removal and erosion control should be considered in the sustainability considerations;
• Exceptional skills or resources of the farm manager or specific cultural practices would not be considered;
Structure of the Land Suitability Rating System
Classes, Factors and Parameters
The basic structure of the LSRS rating output uses two hierarchical categories–classes and subclasses. Each factor is assigned a class rating. Classes are broad in scope and are based on the degree of limitation of land for production of the specified crop. Seven classes are recognized (Table 1). Areas assigned to the same suitability class are similar only with respect to the degree, and not the kind of limitation. Different management may be required on lands of similar class which can be composed of different soil, climate and landscape.
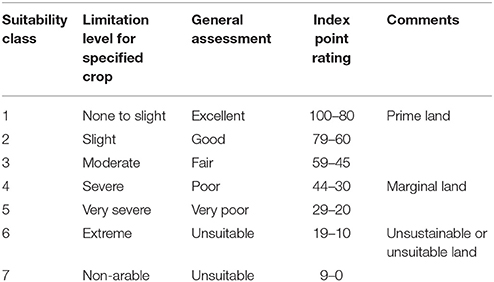
Table 1. The characteristics and index ratings for LSRS classes.
In LSRS, the major rating factors are related to three of the major elements that describe crop production suitability:
• Climate-controls the type and range of crops that can be grown (flexibility of production);
• Soil-controls how well the crops grow (productivity), and;
• Landscape-controls the cost to manage environmental constraints (sustainability).
LSRS assesses the climate, soil and landscape factors independently with a precisely defined index procedure that links the results to the seven-class system. This methodology required the development of clear relationships and guidelines for the assessment of the factors the lead to the assignment of class rating.
LSRS is an interpretive assessment based on the limitations controlling crop specific production. The rating factor that is most limiting ultimately determines the suitability class rating. The components and measurable parameters identified to evaluate the major rating factors were selected from those used in earlier approaches (Huddleston, 1984) and acknowledged to be critical in crop production (Table 2). The following criteria were used in selecting the specific parameters used to characterize the major rating factors used in the LSRS model:
• parameter is known to affect the ability to produce crops;
• parameter is known to affect the ability to respond to abiotic stress (e.g., ability to withstand drought);
• parameter must be measurable or able to be estimated from known relationships (i.e., pedo-transfer functions), and;
• parameter data must be commonly available.
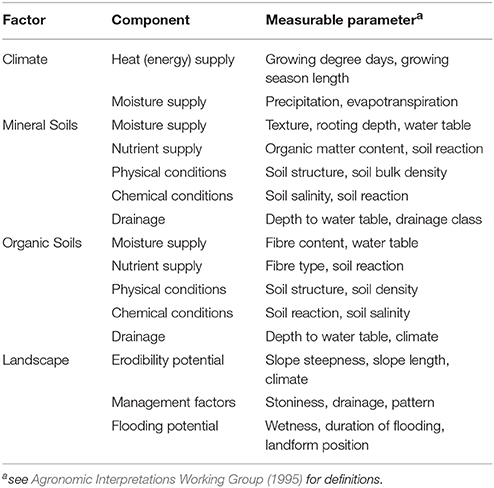
Table 2. The factors, components and parameters used by LSRS to assess land suitability.
Although it is recognized that there are many instances of overlap and synergy between the major factors, there are advantages with respect to simplicity, clarity and the ability to highlight specific limitations by assessing each factor separately. Having built the major climatic-soil interactions into the soil factor, any other remaining discrepancies are considered small. This decision was reasonable given the constraint of available data at that time and the need for national coverage. This approach provided the greatest flexibility to assess various environmental, crop and climatic scenarios.
Each of the major factors is assessed a rating index between 0 (most limiting) and 100 (least limiting). Initially, each factor is assigned an index rating of 100. Limitations are assessed using the specific parameters identified for each factor and point values are deducted from the initial index ratings. The final index rating (i.e., class) assigned is that of the most limiting of the three factors. Subclasses identify the parameters (Table 2) that have the greatest limiting influence on the final class rating. They reflect the kind of climate, soil and landscape limitations that are present. The subclass information is critical for determining conservation and management practices and for land use planning. While Classes are numbered, Subclass designations used in LSRS are letters as follows: climate—temperature/aridity (H) and moisture (A); mineral soil–water supplying ability (M), structure and consistence (D), organic matter content (F), depth of topsoil (E), reaction (V), salinity (N), sodicity (Y), organic (peaty) surface (O), and drainage (W); organic soil—soil temperature (Z), water supplying ability (M), degree of decomposition (B), reaction and nutrient status (V), salinity (N), and drainage (W), and; landscape—basic landform slope (T), stoniness (P), wood content (J), landscape pattern (K), and flooding (I).
A few examples of complete LSRS ratings would therefore be: 2A–a landscape with only slight climatic moisture limitation, or, 4N–a marginal landscape limited by severe soil salinity, or, 6T–a landscape rendered unsuited for crop production due to steep slopes. A class 1 rating (landscape without limitation) would have no subclass denoted.
Linkage of Deductions to the Suitability Class
As productivity is an important consideration in suitability assessments, studies of the relationships of Canada Land Inventory (CLI) classes to the yields of cereals in Alberta (Peters, 1977; Peters and Pettapiece, 1981) and apples in Ontario (van Vliet et al., 1979) provided the initial guidance in developing an assessment of the limitations-based linkage between the prescriptive numerical index ratings (0–100) and the descriptive suitability class. These studies reported a reasonably good correlation for the better classes with Class 1 (none to slight limitation) generally yielding 80% to 100% of the crop maximum. Class 3 areas (moderate limitation but still considered “Good”) generally had yields about 50% of maximum or better. It was also noted that with increasing limitations-particularly landscape limitations, the yield relationships disappeared. That is, landscape features may be difficult or costly to manage but are not directly related to yield. Additional expert opinion suggested that index rating of less than approximately 1/3 of maximum (33 out of 100 points) should be considered a very severe limitation to the long-term sustainability of production.
Using these considerations as a guide, a relationship framework was formulated that provides the conceptual and mathematical linkage between the factor index ratings and LSRS classes. The calculation of LSRS class ratings required the development of the individual parameter indices. Examples of point deduction values for selected climate, soil and landscape parameters as they relate to spring seeded small grains (wheat, oats, barley) are given in Figure 1. The point deduction values were selected through expert opinion designed around class breaks. Originally depicted in tabular format for manual calculation, these “parameter to deduction point” relations were fit to curves to allow automated processing. Although each factor is calculated separately, LSRS is ultimately a most limiting function tool. The final class rating given to a parcel of land is the lowest of the climate, soil or landscape rating.
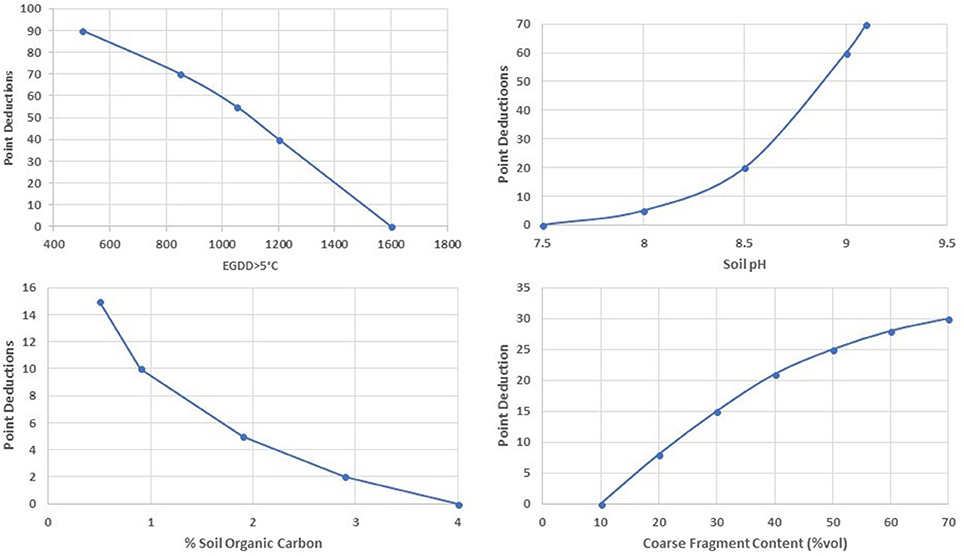
Figure 1. Selected climate and soil parameter deduction curves for spring seeded small grains from Agronomic Interpretations Working Group (1995). Different parameters are set to differing deduction point ranges. Effective growing degree days (EGDD > 5°C) are a key determinant of climate suitability. A value of <900 would result in at least a 70-point deduction, enough to generate an unsuited class rating for grain production. Similarly, a soil pH > 9.0 alone would generate an unsuitable soil rating but sub-optimal soil organic carbon or coarse fragment content deductions typically result in suitability class reductions.
Initially LSRS calculations were made site-specifically based on field observed soil and landscape properties and climate data from the closest weather station. Early calculations were based on climate normal data (30-year averages for temperature and precipitation). Early calibration was based on the period 1951–1980, later updated to 1961–1990. To facilitate the calculation of climate suitability over large areas, national scale maps of growing degree days and climatic aridity (precipitation minus potential evaporation) were constructed specifically for use with LSRS. Details of initial parameter values and the calculation of land suitability class and subclass are given in Agronomic Interpretations Working Group (1995). Over the years, validation efforts have led to many adjustments to the way soil and climate factors are assessed and rated and details of these validation efforts are given in the Supplemental Data.
Recent System Development
Over the last 20 years the LSRS has undergone developments in all aspects of the system (Table 3). The principle enhancements have been the introduction of additional crop modules in version 3, the transformation of the model platform to web-based processing and output (version 4), and most recently, the ability to integrate a range of gridded historic and future scenario climate datasets and calculate climate indices internally within LSRS (version 5). The requirement of the system to handle ever larger climate and soil datasets has led to implementation of more efficient data processing, storage and retrieval technologies and a more effective architecture for developing web services. The key major development areas are described below.
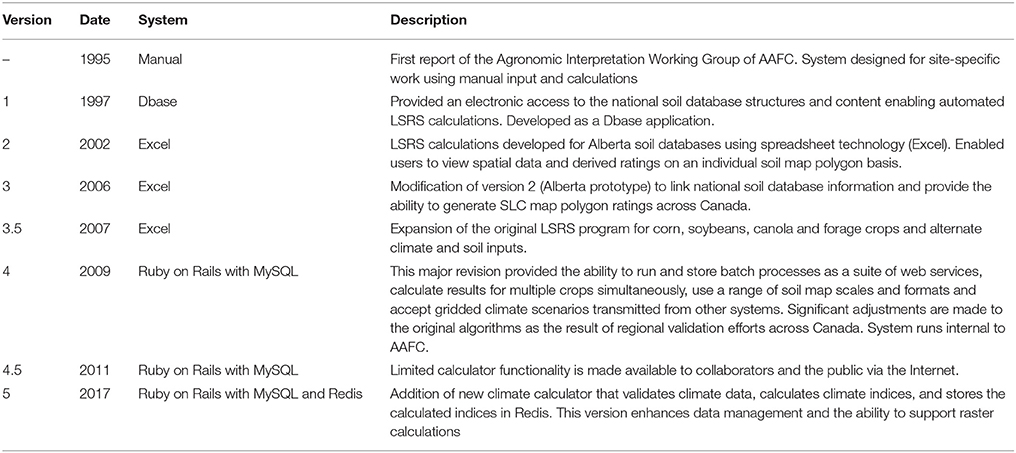
Table 3. Outline of the version history of the land suitability rating system.
Multiple Crop Modules
Crop modules for corn, soybeans, forages (alfalfa, grasses), and canola are part of the current system in addition to the spring-seeded small grains module that was part of the original system described in Agronomic Interpretations Working Group (1995). The development process was similar for each module. Agronomists with crop-specific expertise were consulted to help define climate, soil and landscape parameter values for each crop. The threshold values for class limits were tested against published production figures and calculations were programmed for user access and further testing. For each new crop module, the bulk of the work lay in defining crop-specific climate indices and thresholds (Table 4). For grains and forages, variations of the widely used growing degree-days above 5°C index with adjustments for higher latitude growing areas (termed “effective” growing degree-days) was used to stratify climate requirements. For soybeans and corn, an adaptation of the corn heat unit which we termed “crop” heat unit was used. Some development concepts and improvisations around each of the crop modules follows. Full documentation of crop module development and testing are available as Supplemental Data.
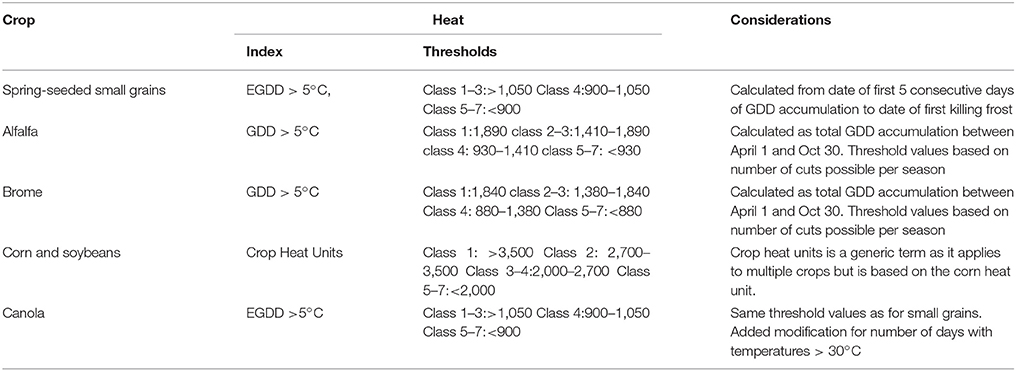
Table 4. Heat indices and thresholds used in the LSRS crop modules.
Corn and soybeans
For both corn and soybeans, the heat index is based on crop heat units (CHU). The average daily values of crop heat units are calculated using the following formula:
Where Ymax and Ymin are the contributions to CHU from average daily maximum (Tmax) and minimum (Tmin) air temperatures respectively and are calculated as
The growing season length and hence the starting and stopping dates for accumulation of the CHU values are based on temperature thresholds. The starting date is based on the average mean daily temperature (Tmean). The stopping date is based on the average mean daily minimum temperature (Tmin). Both thresholds are calibrated to the average historic dates of planting in spring and the probability of killing frost (−2°C) in the fall (Bootsma, 1991; Bootsma et al., 1999, 2005) and are presented in Table 5. The seasonally accumulated CHU index determined in this manner is called “CHUnorm.” The original method for calculating CHUnorm used climate normal records, currently we are making the calculation from 30 years of daily climate data.
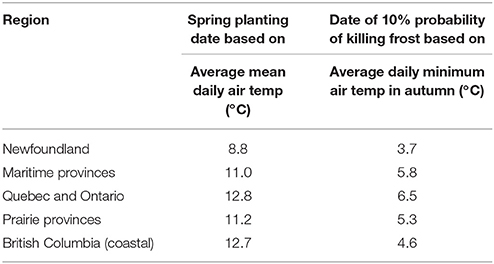
Table 5. Definition of start and finish of the growing season for corn in eastern Canada.
With respect to the climatic moisture assessment, the consensus was that precipitation minus potential evapotranspiration (P-PE) was a reasonable and well accepted index. Given the higher moisture demand to produce corn than cereal grains, the class limits for corn were developed by adjusting the values defined for small grains by about 100 mm.
The corn module rates soil and landscape factors and their point deductions in a similar way to that in the small grains module.
The soybean module development considerations were similar to those for corn. Both are considered warm season crops so heat requirements can be assessed within a CHU framework. Some soybean cultivars can withstand temperature limitations of relatively short, cool growing seasons but temperature requirements for soybeans are nonetheless very similar to those for corn (OMAFRA, 2002). The minimum heat requirement for the commercial production of soybeans is about 2,000 CHU.
Given the above, the agronomic consensus was that the CHU scale be used to rate the heat requirements of the crop with the same rankings as used for corn, and that P-PE should be used to characterize the moisture limitations but with the point deduction set slightly less than that for corn (Figure 2).
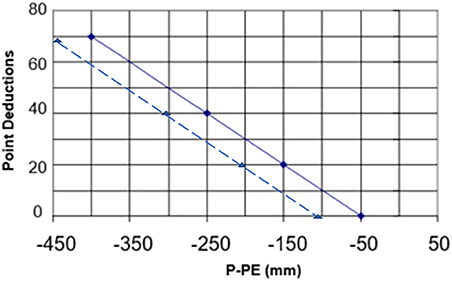
Figure 2. Point deduction scheme for climatic moisture deficit for corn (solid line) and soybeans (dashed line).
Most soil factors for soybean production are rated similarly as those for corn and the spring-seeded small grains. The only exception being the susceptibility to emergence problems relating to crusting. The soil factor therefore has an added deduction related to surface soil structure calculated as a function of the content of soil organic carbon and percentages of sand, silt and clay. The landscape factors are rated the same for soybean as for small grains as the erosion potentials and mechanical limitations are assumed to be the same as for both crops.
Canola
In many respects, canola (Brassica spp.) falls within the general climatic, soils and landscape parameters used to assess small grain limitations. However, there were some refinements made in consideration of requirements for particular Brassica species.
Effective growing degree days (i.e., GDD base 5°C adjusted for latitudes up to 60°N) is used as the temperature index using the same scale used for small grains. The long season, higher yielding (Brassica napus) varieties perform best in the areas with more than about 110 frost free days which correlates with accumulations of greater than about 1,200 effective growing degree days (EGDDs). Brassica rapa is a shorter season variety that performs well down to about 1000 EGDDs. The baseline temperature for Brassica is approximately 4.4°C (Morrison et al., 1989). This corresponds well with the 5°C base temperature used to calculate EGDDs. However, included was a special consideration with respect to growing season heat. Flower abortion associated with temperatures greater than about 30°C is a known phenomenon (Morrison and Stewart, 2002). To address this, a heat index (HI) was calculated as the number of days where daily maximum temperature >30°C during the canola flowering period defined as between the dates of accumulation of 600 and 1100 EGDDs.
As with soybeans, the module takes into consideration the potential for soil crusting and additional deductions for soils with this potential. Otherwise, all other soil and landscape factors were rated the same for canola as for small grains.
Forages
Rating land for forage production has a fundamental difference from ratings for annual grain and oilseed crops. Typically forage crops are harvested multiple times during the growing season, often referred to as “cuts.” Depending on the region of the country, forages may be harvested up to four times in a single season.
Two general types of forages (i.e., legumes and grasses) with somewhat different climatic and soil requirements are recognized within LSRS. A widely grown legume in Canada is alfalfa (Medicago sativa L.) and was chosen as the perennial legume to include in the system. As a perennial crop, there are no concerns with determining dates for spring seeding or for frost damage as with grain. As such, the forages have a longer growing season than the annual crops in other LSRS modules. This extended season is assumed to be the period with mean daily temperatures above 5°C (Bootsma and Boisvert, 1991).
The climatic rating for alfalfa is based on two factors, the accumulated growing degree days >5°C (GDD) and growing season length. Bootsma and Boisvert (1991) estimated about 480 GDDs to produce a first cut of alfalfa with an additional 450 GDDs for crop carryover requirements. Note that for the grass forages, LSRS uses a straight GDD >5 index that is not adjusted for high latitude day length as is the case with the effective growing degree day (EGGD) index used for small grains. Therefore, the minimum heat requirement for alfalfa is about 930 GDDs (480 GDD to obtain a harvest, 430 GDD to ensure carryover for the following year) and was used to establish the class 4-5 configuration point (Table 6). The climatic requirement to produce three cuts per year was used to define the Class 1 configuration point. This translates into (3 x 480) + 450 = 1,890 GDDs. The ability to support two cuts per year, [(2 × 480) + 450 = 1,410 GDDs] was set as the Class 3 threshold. The ability to produce one cut with no carry over (480 GDDs) was set as representing the Class 5-6 boundary. The maximum deduction was set at 90 points.
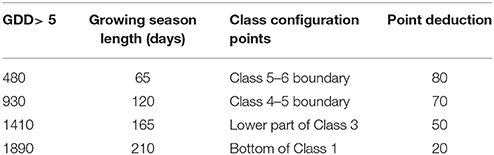
Table 6. Point deductions assigned to GDDs and growing season length for alfalfa.
Length of season requirements were established using monthly climatic data and the GDD requirements for one, two and three cuts of alfalfa. Bootsma and Boisvert (1991) suggested a minimum of 45 days between cuts, 65 days to accumulate the heat to necessary to produce a first cut crop and 55 days carry-over for the crop to store enough energy to survive the winter. The relationship between growing season length and accumulated heat varies across the country. For instance, in coastal British Columbia there is a very long growing season but often insufficient heat to produce more than 2 cuts of hay.
Several soil related parameters required specific modifications for alfalfa. These include soil and subsoil pH. The most favorable soil pH range for alfalfa is between 6.5 and 7.5 (Goplen et al., 1987; Undersander et al., 1991). Therefore, a pH in this range was taken as no limitation and assigned a zero-point deduction. A pH of 5.0 is considered marginal for alfalfa and thus assigned a deduction of 70 points. The class 2 configuration point (and a deduction of 20 points) was set at pH 6.0. The class 3 configuration point (and a deduction of 40 points) was set at pH 5.5. A similar logic and set of deductions was developed for pH above 7.5.
In addition, there were modification in the module to the landscape factors of slope and stoniness. The continuous cover of perennial crops means that the risk of soil erosion is much reduced relative to annual crops. Because there is no annual cultivation requirement, internal soil coarse fragment content is not an issue from a landscape management perspective.
Climatic growth requirements and response is similar for most cool season C3 grasses (Moser et al., 1996). In humid eastern Canada, Timothy (Phleum pretense) is the most common forage grass. The climate of the Great Plains of western Canada is semi-arid and soils can be saline. Under these conditions smooth bromegrass (Bromus inermis L.) is the preferred forage grass. As with alfalfa, about 480 GDDs are required to produce a first cut of timothy with an additional 400 GDDs or so for crop carryover requirements. Carry over heat requirements for grasses are less than for alfalfa but were included for the grass forage module. The minimum heat requirement for grass forages was set at approximately 880 GDDs and was set as the boundary threshold for the class 4-5 boundary, the marginal category. Using the same approach as used for alfalfa, the ability to support two cuts per year of grass forage require 1360 GDDs and for three cuts 1840 GDDs. Point deductions for grass forage follow a similar logic as was used for alfalfa.
Also important in rating land for forage grass production is the growing season length. A literature review indicated that about 65 days of temperatures averaging >5 C are required to mature the crop for cutting and another 55 days are required for carryover into the following year. For two cuts to be achieved, it would require 65 days of initial growth, followed by 55 days of growth for the second cut and another 55 days to achieve the carryover. These counts of days were then used to determine class boundaries and deductions points. The most limiting of growing season degree-day accumulation or growing season length is used to calculate overall climatic heat suitability
Soil requirements for the brome-timothy forage model are the same as for the small grains. This is reasonable considering that these forages, like the small grains, are C3 grasses. The landscape factor deductions are the same for brome-timothy as for alfalfa.
Enhanced Processing of Climate Data and Climate Indices
The current LSRS version (version 5) carries forward all the web-based processing functionality developed in version 4 and adds to it a new climate indices calculator (Table 3). While version 4 could accept climate indices calculated externally, version 5 incorporates the calculation of climate indices and supports raster data processing. Several major new features and improvements are incorporated into this release. Key amongst these is the use of Redis as a data store for climate data. Redis is an open source in-memory data structure store, used as a database, cache and message broker. The climate calculator validates climate data, calculates climate indices, and stores the calculated indices in Redis which simplifies access, and enhances performance and output reliability. The calculator reads climate indices directly from Redis to simplify use and to eliminate a significant source of human errors.
As the map polygon is the unit of calculation for LSRS, it is necessary to assign climate attributes (daily Tmax, Tmin, and Precipitation) to each polygon. The basic conceptual approach is the spatial union between the climate grids and soil map polygons (Figure 3). Depending on the scale of the grids and map polygons, when several climate grid centroids fall into one soil map polygon, these are averaged for the polygon.
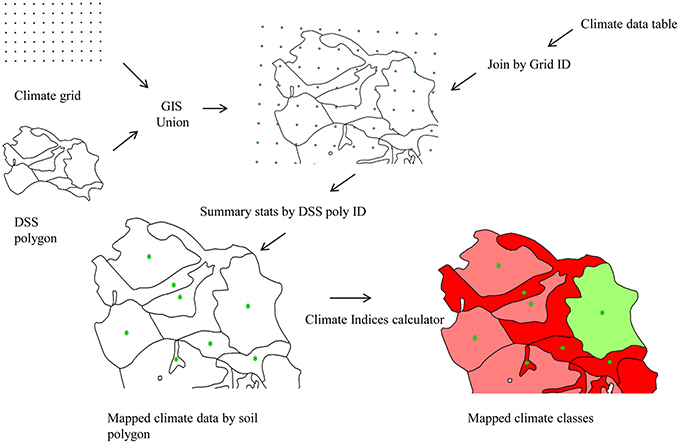
Figure 3. Allocation of gridded climate data to detailed soil survey (DSS) map polygons (adapted from Gasser et al., 2016, reproduced with the permission of the copyright holder, NRC Research Press).
The agro-climatic indices used in LSRS are calculated from mean monthly or average mean daily data for each polygon. The climate data are loaded into LSRS using a custom file format that incorporates both documentation and climate data. The file is divided into two sections. The first section contains the documentation in YAML format, and the second section contains the data as a set of tab-separated values. Index calculation methods are specific to each crop. The climate indices calculator within LSRS version 5 generates the following outputs: growing season start date, growing season stop date, growing degree days >5 C, crop heat unit and P-PE.
Prior to version 5, climate indices had to be calculated outside of LSRS and then imported into the system. Early versions of the system were designed to work with monthly data. Indices requiring daily time steps were calculated by deconstructing monthly values through a curve fitting step (Bootsma and Boisvert, 1991). To date we have not depicted results based on a single year of data (although is this possible) but have stayed with the original concept that LSRS rating are generated from climate averages over multiple years.
Computational Upgrades
Major upgrading of the LSRS system began in 2009 with the rewriting of the core LSRS calculator in Ruby as a suite of web services. The program can run and store batch processes compliant with Web Processing Services (WPS), calculate results for multiple crops simultaneously and utilize a range of map scales and data structures that exist for Canadian soil maps. The complete details of each calculation are visible as a web page (HTML) but data are also output as CSV and GDAS formats, and the system can provide thematic maps via WMS and KML. Significant adjustments were made between 2011 and 2014 to the original crop ratings algorithms as the result of regional validation efforts across Canada.
For most calculations, Version 5 generates ratings directly from class boundary (configuration) points instead of curve formulas. This approach eliminates unintended effects that occurred in earlier version of LSRS at climate extremes, helps to improve consistency with intended class breaks, and simplifies the adjustment of deduction curves.
The internal data access mechanism and LSRS calculation requests are based on a REST (Representational State Transfer) architectural approach to simplify operations and facilitate interoperability with other systems. Our implementation creates separate access for climate, soil and landscape ratings, and stores calculation results in Redis so that the results can be reused in subsequent routines to improve the performance of raster calculations.
Finally, in order to simplify maintenance of the system, version 5 drops XSLT in favor of plain HTML for most human-readable outputs.
Applications of the Rating System
LSRS may be applied at scales based on the scale of the input soil, landscape and climate information. The scale of output is controlled by the scale of the soil map used as input. Ratings are calculated on soil profile attributes for each soil type reported to occur in a map polygon. Typically, results are depicted based on the dominant (spatially most common) soil. Climate indices are calculated from data grids at a variety of scales and intersected with the soil map polygons. LSRS may also be used on-site with attribute data coming from an observed profile, landscape parameters measured on-site and climate data obtained from a near-by weather station. In this case LSRS ratings would be site-specific. Examples of national and regional assessments are presented in the following sections.
National Scale Assessments
LSRS can map a variety of outputs on a soil map polygon basis at regional and national scales. These include climate attributes, agro-climatic indices, and for a particular crop, climate class rating, soil class rating, landscape class rating and an overall LSRS class and subclass suitability rating. This is achieved by integrating climate data with the 1:1,000,000 Soil Landscapes of Canada mapping to produce actual LSRS ratings (Schut et al., 2011).
Outputs at the national scale help to explain historic and future projected shifts in cropping patterns and can help to interpret changes in agri-environmental performance in national policy assessments). Climate change impacts using IPCC AR3 climate scenario data downscaled to a 10 km national climate grid and linked to 1:1,000,000 Soil Landscapes of Canada polygons were assessed for the 1971 to 2000 normal period and three future 30-year periods for three regions of Canada–the Prairie provinces, central Canada (southern Quebec and Ontario) and Atlantic Canada (Chen et al., 2008). Based on suitability rating changes over time the authors speculated that grain and canola production would move onto climatically marginal crop land that is currently under forage production or livestock grazing and where aridity is not a limitation, corn and soybeans could expand into areas now mostly dominated by grain and oilseed production, especially in the northern regions of the Prairie provinces. Perhaps more importantly, was the recognition that seeding and maturity dates will shift earlier into the year as a necessary adaptation to mid-season aridity in western Canada.
LSRS has been used to examine climatic shifts within the agricultural region of the country. Figure 4 depicts slight changes in July maximum temperatures in the agricultural portions of the country between the climate normal periods 1951–1980 and 1981 to 2010. Even though the temperature ranges are depicted at a scale of 1:1,000,000 the extent of July warming during the historical period is obvious.
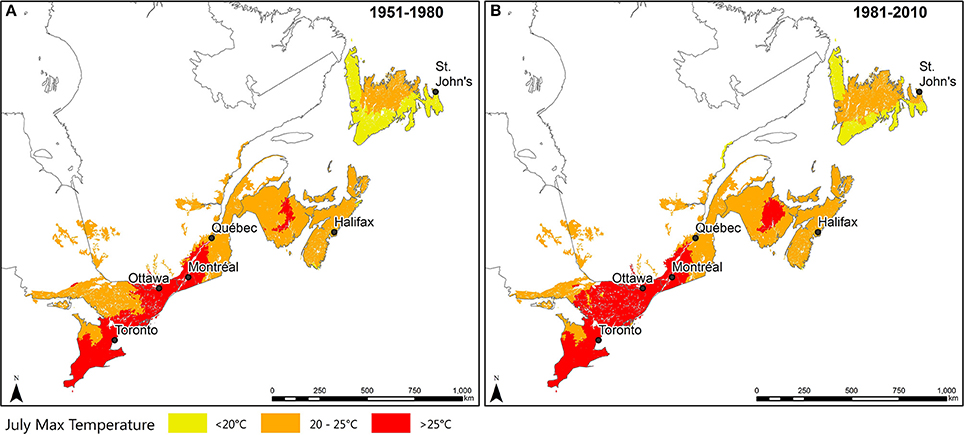
Figure 4. Change in the July maximum temperature in eastern Canada between climate normal periods 1951–1980 (A) and 1981–2010 (B). Expansion of warmer summer temperatures is visible in southern Ontario and Quebec, central New Brunswick and Newfoundland. Climate data were transposed from a national 10 km grid to 1:1,000,000 soil polygons to facilitate subsequent LSRS rating.
Integration of climatic data with the soil and landform attributes contained with the databases linked to the Soil Landscapes of Canada map product, enables crop ratings to be depicted for the dominant soils on the landscape. Figure 5 shows suitability ratings for canola based on climate normal data for the period 1981–2010. Figure 6 illustrates the expansion of LSRS class 2 lands for spring seeded small grains in western Canada for two historical time periods. Due to slight climatic limitations for grain production there is no class 1 in this region of Canada.
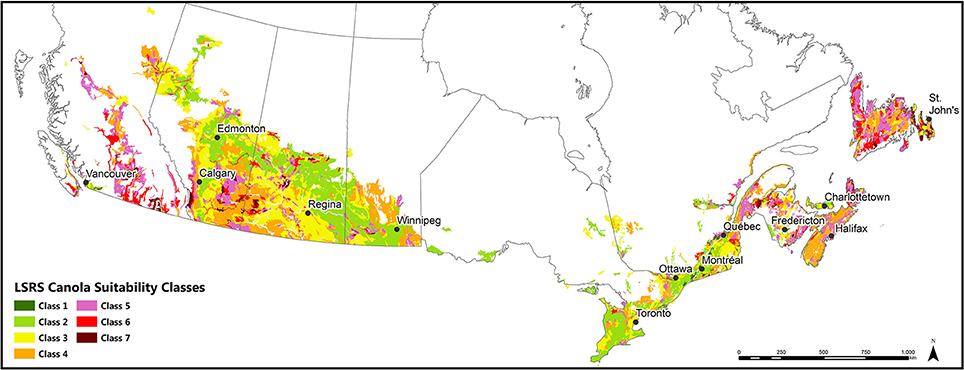
Figure 5. National-scale map of land suitability classes for canola based on dominant soil types and the period 1981 to 2010. Highest suitability classes exist in Prince Edward Island (Charlottetown), in southern Quebec and Ontario and along the northern agricultural region of the Prairie provinces. Lower suitability classes result elsewhere in the country due to aridity in parts of western Canada and cool temperature in the Atlantic region.
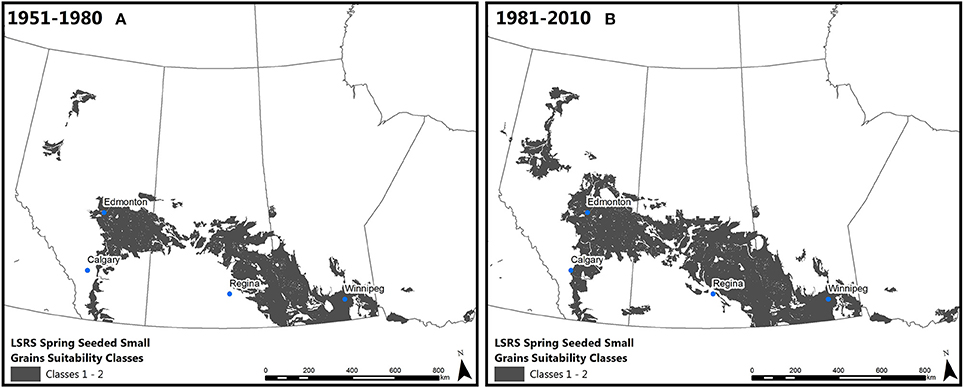
Figure 6. Shaded areas show the expansion of prime land (class 1 and 2) for spring seeded small grains based on the climate normal period 1951–1980 (A) and 1981-2010 (B).
Regional Climate Change Assessments
LSRS has been used locally in many provinces to replace the older CLI capability maps that were drawn based on mid-twentieth century climate conditions. Regional LSRS spatial outputs utilize regional detailed and semi-detailed soil maps as their base. In Alberta, where much of the original LSRS validation work was conducted, a provincial 1: 100,000 scale soil map is used as the base for depicting provincial-scale crop ratings. The baseline for making this comparison was the map for spring seeded small grain (Figure 7). Spatial validation of this type of output was used when designing the early versions of LSRS.
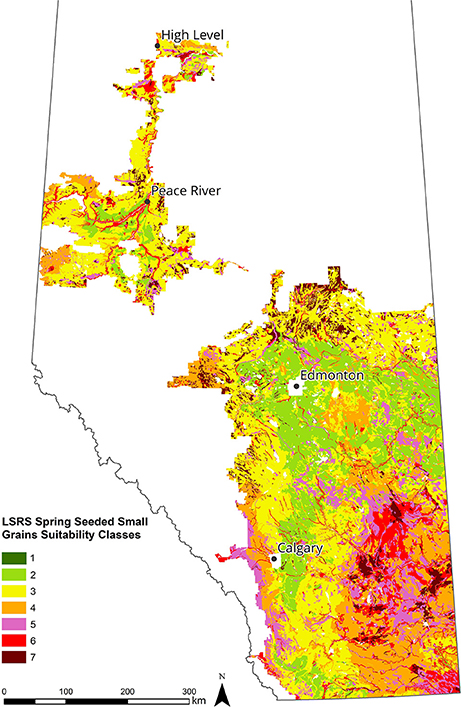
Figure 7. LSRS class ratings for spring-seeded small grains based on the 1981–2010 climate normal intersected and displayed on a:100,000 scale soil map of the agricultural region of Alberta.
Gasser et al. (2016) examined the impact of a range of IPCC AR4 SRES scenarios on future production of corn in coastal British Columbia. In this instance, projected increasing growing season aridity (a subclass of the climate rating) indicated the likely future requirement for the adoption of irrigation much more widely than is currently the practice. In all our climate change impact studies to date, a wide range of suitability outcomes are projected as a function of the model scenarios selected. This range is a measure of uncertainty. Mapped class areas for each scenario are typically summed and plotted over several time periods to see the spread in trends (Figure 8).
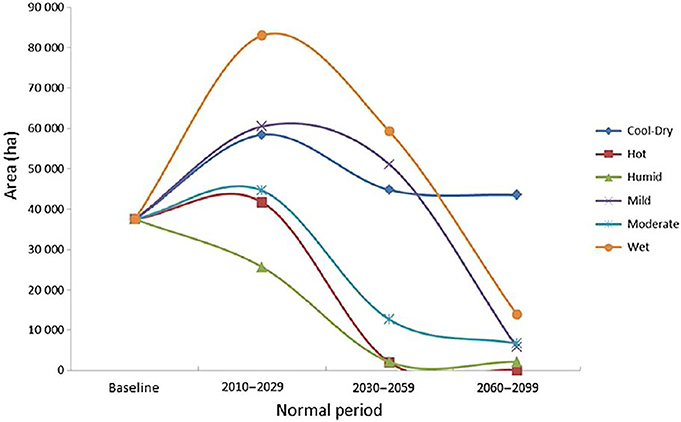
Figure 8. Trends in area of suitability classes 1 and 2 for corn production in the lower Fraser Valley of British Columbia. Six different global circulation models depict a wide range of outcomes (adapter from Gasser et al., 2016, reproduced with the permission of the copyright holder, NRC Research Press).
A recent application of LSRS has helped to evaluate climate change impacts on northern agricultural regions of northwest Canada. Downscaled data (Wang et al., 2016) from a subset of five climate models were selected from the IPCC CMIP5 ensemble (Cannon, 2015) to span the range of projected temperature and precipitation changes in the region. These were then used to drive LSRS for the RCP4.5 and RCP8.5 scenarios. One study area is the Peace River district of northwestern Alberta where earlier national-scale assessments indicated considerable potential change. Grain and oilseeds are the main crops in the region. We analyzed climate over both historic and future time periods. However, as with our work in British Columbia, different model outputs projected vastly different outcomes with respect to agricultural suitability by late century. Figure 9 compares the outputs for two models, the Canadian model CanESM2 and the Russian model INM_CM4. While both models project increasing heat, CanESM2 projects significant aridity such that the extent of prime land for spring seeded grains (without irrigation) is greatly diminished relative to current condition. However, INM_CM4 projects increased precipitation along with the heating such that the extent of prime land is greatly increased relative to the current condition. The LSRS output mapping clearly demonstrates the spatial uncertainty of future land suitabilities and the range of possible crop distribution patterns.
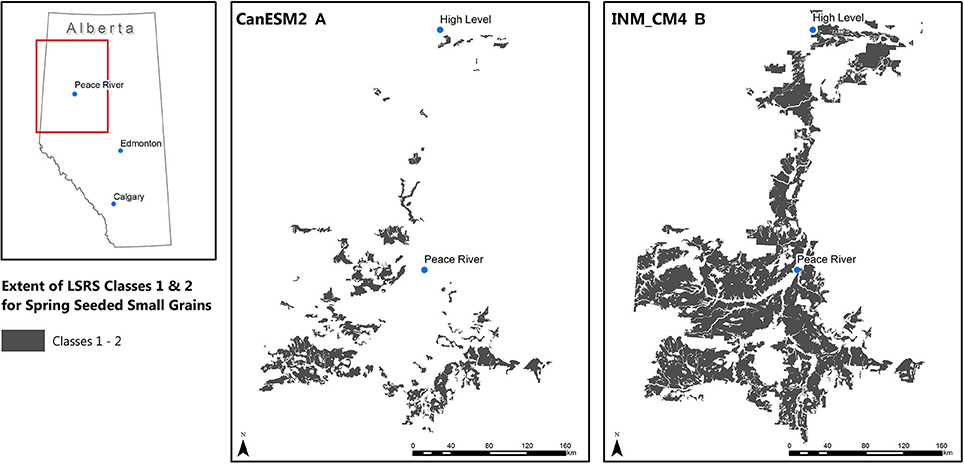
Figure 9. Comparison of future prime land extents in the Peace River district of northwestern Alberta for the period 2041–2070. Shown are results based on climate outputs for RCP4.5 from the CanESM2 (A) and INM_CM4 (B) models intersected with 1:100,000 soil map polygons. The difference shown represents the degree of spatial uncertainty that exists with respect to future land suitability for grain production in the region.
Discussion
LSRS classification remains a largely qualitative pursuit utilizing parametric scores based on expert knowledge to calculate deductions based on measurable climate, soil and landscape attributes. The derived class ratings are relative rankings rather than absolute measures. Rossiter (1996) termed this approach as a “land index,” a simple rating of the goodness of fit of a particular land activity (crop type) for a given land capability. The principle purpose of agriculture land suitability assessment is to predict the potential and limitations of the land for production of a specific crop or crops. LSRS generates a measure of both potential (as a class rating) and a limitation (as a subclass modifier). LSRS contains a set of tools that allow the user to calculate a suite of agro-climatic indices integrated to a soil map to allow spatial assessment at a range of scales. LSRS has evolved to be increasingly useful to climate change studies in that it is able to depict spatially future land use possibilities. While the LSRS modules currently cover only common annual crops and some forages, the suitability concept of integrating climate, soil and landscape attributes in a spatial framework has been extended to examine climate change on potential future extent of sweet cherries in the interior of British Columbia (Neilsen et al., 2017).
Validation of the rating system remains a challenge. Two obvious independent variables, crop yield and crop presence on the landscape are two attributes against which to try to relate to suitability. However, as both of these variables are very much controlled by market/economic factors and management inputs, neither of which are considered in the LSRS computations, finding a strong correlation between an LSRS class rating and crop yield remains elusive. The early development of the system was driven by a need to have LSRS, specifically the spring seeded small grains module, emulate the CLI agriculture capability ratings. This objective was achieved but the LSRS is not a crop yield model nor necessarily a predictor of crop presence. Validation of the outputs remains an area of study.
A drawback of using a class rating structure is the inability to often detect modest changes in point ratings that may be obscured by the relatively wide range of points that constitute any one class. We encountered this problem in our climate change work in British Columbia (Gasser et al., 2016) where in some cases small point changes generated class changes, in other instances relatively large point changes did not generate any class change at all. When analyzing change, it is often better to work with point deduction values directly rather than class values.
The current version of the rating system utilizes web-based technologies that optimize data handling and storage and facilitates user access to the tools and calculators that make up the system. The efficiency in generating agro-climatic indices from both daily and monthly data makes LSRS well suited to climate change studies in Canada where many existing crop production systems are limited by climate (Campbell et al., 2014).
Author Contributions
MB and CS compiled the first draft of the article and CS revised the manuscript following reviewer comments. DN was project lead at Summerland for land suitability research and provided funding and technical input to model developments. WP wrote an earlier version of the introduction and led the development of versions 1, 2, and 3 of LSRS, P-YG and MB conducted GIS work and produced the map figures, AB established the agro-climatic indices for the new crop modules and wrote an earlier version of the crop module section, AJB provided development guidance for version 3 and 4. PS built versions 4 and 5 of LSRS and currently manages the model calculators and model website.
Conflict of Interest Statement
The authors declare that the research was conducted in the absence of any commercial or financial relationships that could be construed as a potential conflict of interest.
Acknowledgments
We would like to acknowledge funding from the Science and Technology Branch of Agriculture and Agri-Food Canada to support the development of the LSRS. We also acknowledge the contributions of the original Agronomic Interpretations Working Group that initiated the develop of the system. We would also like to thank David Lee and Simon Kiley for support and help with preparation of map figures for the paper. Institutional support from the Alberta Agriculture, Food and Rural Development is gratefully acknowledged as well as the contributions of the many contractors, summer students and consultants who provided field testing, expertise, and feedback over the years.
Supplementary Material
The Supplementary Material for this article can be found online at: https://www.frontiersin.org/articles/10.3389/fenvs.2018.00077/full#supplementary-material
References
Agriculture and Rural Development Act (1965). Canada Land Inventory. Objectives, Scope and Organization. The Canada Land Inventory Report No.1. Dept. of Forestry and Rural Development, Ottawa (Reprinted by Dept. of Regional Economic Expansion in 1970). 61.
Agronomic Interpretations Working Group (1995). Land Suitability Rating System for Agricultural Crops: Spring-Seeded Small Grains, ed W. W. Pettapiece. Ottawa, ON: Tech Bull. 1995-6E; Centre for Land and Biological Resources Research, Agriculture and Agri-Food Canada.
Atlantic Advisory Committee on Soil Survey (1988). “A compendium of soil survey interpretive guides used in the Atlantic Provinces,” eds G. T. Patterson and H. W. Rees (Truro, NS: Agriculture Canada, Land Resources Unit), 149.
Alberta Soils Advisory Committee (1983). Systems of rating arable land in Alberta. 200-2-84. Edmonton, AB: Alberta Agriculture. 27.
Alberta Soils Advisory Committee (1987). “Land capability Classification for Arable Agriculture in Alberta,” ed W. W. Pettapiece (Alberta Agriculture), 103. 5 maps.
Ahrens, J. R., Rice, T. J., and Eswaran, H. (2002). Soil Classification: past and present. NCSS newsletter 19, 1–5.
Alberta Agriculture Food and Rural Development (2000). Procedures Manual for the Classification of Land for Irrigation in Alberta. Lethbridge AB: Alberta Agriculture, Food and Rural Development.
Alberta Energy and Natural Resources (1983). Soil Capability for Agriculture: A Summary and Application of Canada Land Inventory Data in Alberta. ENR Technical Report. T/45. Edmonton, AB.
Arroues, K. D., and Anderson, C. H (1986). Soil Survey of Kings County, California. Washington, DC: Natural Resource Conservation Service.
Bootsma, A. (1991). Risk Analyses of Heat Units Available for Corn Production in the Maritime Provinces. Agriculture Canada, Research Branch Tech. Bull. 1991-8E, 49pp.
Bootsma, A., and Boisvert, J. B. (1991). Modeling Methodology for Estimating Forage Yield Potential in Canada. Ottawa: Tech, Bull. 1991-6-E. Research Branch, Agriculture Canada.
Bootsma, A., Gameda, S., and McKenney, D. W. (2005). Impacts of potential climate change on selected agro-climatic indices in Atlantic Canada. Can. J. Soil Sci. 85, 329–343. doi: 10.4141/S04-019
Bootsma, A., Tremblay, G., and Filion, P. (1999). Risk Analyses of Heat Units Available for Corn and Soybean Production in Quebec. Agriculture and Agri-Food Canada, Research Branch, Eastern Cereal and Oilseed Research Centre, Ottawa, Technical Bulletin, ECORC Contrib. No. 991396. 127 pp.
Bowser, W. E., Peters, T. W., and Newton, J. D. (1951). Soil Survey of the Red Deer Sheet. Alberta Soil Survey Report No.16. Edmonton, A. B. 86. 2 maps.
Brooke, M. A., and Presant, E. W. (1986). Site Determination of Soil Capability for General Field Crops in the Regional Municipalities of Haldimand-Norfolk and Niagara. Guelph, ON: Ontario Institute of Pedology Publ. No. 86-4. 20.
Canada Land Inventory (1998). National Soils Database. Agriculture and Agri-Food Canada. Available online at: http://sis.agr.gc.ca/cansis/nsdb/cli/index.html (Accessed March 20, 2018).
Campbell, I. D., Durant, D. G., Hunter, K. L., and Hyatt, K. D. (2014). “Food Production,” in Canada in a Changing Climate: Sector Perspectives on Impacts and Adaptation, eds F. J. Warren and D. S. Lemmen (Ottawa, ON: Natural Resource Canada, Government of Canada), 99–134.
Cannell, R. Q., Davies, D. B., Mackney, D., and Pidgeon, J. D. (1978). The suitability of soils for sequential direct drilling of combine-harvested crops in Britain: a provisional classification. Outlook Agric. 9. 306–316.
Cannon, A. J. (2015). Selecting GCM scenarios that span the range of changes in a multimodel ensemble: application to CMIP5 climate extremes indices. J. Clim. 28, 1260–1267. doi: 10.1175/JCLI-D-14-00636.1
Carcass Burial Site Selection Technical Committee (2004). Natural Suitability Index for Carcass Burial in Alberta. Edmonton, AB: Alberta Agriculture. 36.
Chapman, L. J., and Brown, D. M. (1966). The Climates of Canada for Agriculture. The Canada Land Inventory Report No. 3. Environment Canada.
Chen, K., Hewitt, J., Brierley, T., Chipanshi, A., Hanuta, I., and Zimmer, S. (2008). Assessment of Climate Change Impacts on Agricultural Land-Use Suitability. Ottawa, ON: Agriculture and Agri-Food Canada and Environment Canada.
Eilers, R. G., and Buckley, K. E. (2002). A Methodology for Evaluation Soils, Landscapes and Geology for Nutrient Management Planning in the Prairie Landscape. Tech. Bull. 2001-1E. Ottawa: Land Resource Group, Research Branch, Agriculture and Agri-Food Canada.
Elsheikh, R., Rashid, B. A., Shariff, M., Amiri, F., Ahmad, N. B., Balasundram, S. K., et al. (2013). Agriculture Land Suitability Evaluator (ALSE): a decision and planning support tool for tropical and subtropical crops. Comput. Electron. Agric. 93. 98–110. doi: 10.1016/j.compag.2013.02.003
FAO (1976). A Framework for Land Evaluation. Rome: Soil Bull. 32. UN Food and Agriculture Organization (FAO).
Feller, C. L., Thuries, L. J.-M., Manlay, R. J., Robin, P., and Frossard, E. (2003). “The principles of rational agriculture” by Albrecht Daniel Thaer (1752–1828), An approach to the sustainability of cropping systems at the beginning of the 19th century. J. Plant Nutr. Soil Sci. 166, 687–698. doi: 10.1002/jpln.200321233
Gasser, P.-Y., Smith, C. A. S., Brierley, J. A., Schut, P., Neilsen, D., and Kenney, E. A. (2016). Use of a Land Suitability Rating System to assess climate change, Fraser Valley of British Columbia. Can. J. Soil Sci. 96, 256–269. doi: 10.1139/cjss-2015-0108
Goodman, V. H. (1955). Soil Survey of Waldo County, Maine. Series 1940, No. 16. Washington, DC: Soil Conservation Service.
Goplen, B. P., Baenziger, H., Bailey, L. D., Gross, A. T. H., Hanna, M. R., Michaud, R., et al. (1987). Growing and Managing Alfalfa in Canada. Ottawa, ON: Agriculture Canada Publication 1705/E. Agriculture Canada.
Huddleston, J. H. (1984). Development and use of soil productivity ratings in the United States. Geoderma 32, 297–317.
Joss, B. N., Hall, R. J., Sidders, D. M., and Keddy, T. J. (2008). Fuzzy-logic modelling of land suitability for hybrid poplar across the Prairie Provinces of Canada. Environ. Monit. Assess. 141, 79–96. doi: 10.1007/s10661-007-9880-2
Kenk, E., and Cotic, I. (1983). Land capability classification for agriculture in British Columbia. MOE Manual, I. Victoria, BC: Ministry of Environment and Ministry of Agriculture and Food.
Klingebiel, A. A., and Montgomery, P. H. (1961). Land Capability Classification. Agriculture Handbook No. 210. Washington, DC: Soil Conservation Service, USDA.
Lynn, I., Manderson, A., Page, M., Harmsworth, G., Eyles, G., Douglas, G., et al. (2009). Land Use Capability Survey Handbook–A New Zealand Handbook for the Classification of land 3rd Edn. Hamilton, New Zealand: AgResearch Ltd.
Marshall, I. B., Dumanski, J., Huffman, E. C., and Lajoie, P. G. (1979). Soil Capability and Land Use in 719 the Ottawa Urban Fringe. Ottawa, ON: Research Br. Agriculture Canada.
Mailloux, A., Dube, A., and Tardif, L. (1984). Classement des sols selon leur possibilities d'utilization agricole. Cah. Geogr. Que. 8, 231–249.
McCracken, R. E., and Cate, R. (1986). Artificial Intellegence, cognative science and measurement theory application in soil classification. Soil Sci. Soc. Am. J. 50, 557–561.
Morrison, M. J., McVetty, P. B. E., and Shaykewich, C. F. (1989). The determination and verification of a baseline temperature for the growth of Westar summer rape. Can. J. Plant Sci. 69, 455–464.
Morrison, M. J., and Stewart, D. W. (2002). Heat stress during reproduction in summer rape. Crop Sci. 42, 797–803. doi: 10.2135/cropsci2002.7970
Moser, L. E., Buxton, D. R., and Casler, M. D. (1996). Cool-season forage grasses. Agronomy series No. eds 34. Madison: American Society of Agron.
Mueller, L., Schindler, U., Behrendt, A., Eulenstein, F., and Dannowski, R. (2007). Das Muencheberger Soil Quality Rating (SQR): ein einfaches Verfahren zur Bewertung der Eignung von Boeden als Farmland. Mitt Dt Bodenkundl Ges. 110, 515–516.
Mueller, L., Schindler, U., Mirschel, W., Shepherd, T. G., Ball, B. C., Helming, K., et al. (2010). Assessing the productivity function of soils. a review. Agron. Sustain. Dev. 30, 601–614. doi: 10.1051/agro/2009057
Neilsen, D., Smith, S., Bourgeois, G., Qian, B., Cannon, A., Neilsen, G., et al. (2017). Modelling changing suitability for tree fruits in complex terrain. Acta Hortic. 1160, 207–214. doi: 10.17660/ActaHortic.2017.1160.30
Odynsky, W. M., Wynnyk, A., and Newton, J. D. (1952). Soil Survey of the High Prairie and McLennan Sheets. Edmonton, AB: Alberta Soil Survey No. 17. 2 maps.
Peters, T. W. (1977). Relationship of yield data to agroclimate, soil capability classifications and soil of Alberta. Can. J. Soil Sci. 57, 341–347.
Peters, T. W., and Pettapiece, W. W. (1981). Crop Yields in Alberta: Relationships to Soils Capability for Agriculture and Soil Type. Alberta Institute of Pedology No. M-81-1. University of Alberta.
Schut, P., Smith, S., Fraser, W., Geng, X., and Kroetsch, D. (2011). Soil Landscapes of Canada: building a national framework for environmental information. Geomatica 65, 293–309. doi: 10.5623/cig2011-045
Smyth, A. J., and Dumanski, J. (1995). A framework for evaluating sustainable land management. Can. J. Soil Sci. 75, 401–406.
Sonneveld, M. P. W., Hack-ten Broeke, M. J. D., van Diepen, C. A., and Boogaard, H. L. (2010). Thirty years of systematic land evaluation in the Netherlands. Geoderma 156, 84–92. doi: 10.1016/j.geoderma.2010.02.023
Standing Committee on Agriculture Fisheries and Forestry. (1984). Soil at Risk: Canada's Eroding Future. Ottawa, ON. 129.
Storie, R. E. (1933). An index for rating the agricultural value of soils. University of California Agricultural Experimental Station Bull. 556. Berkley, CA: University of California.
Triantafilis, J., Ward, W. T., and McBratney, A. B. (2001). Land suitability assessment in the Namoi Valley of Australia, using a continuous model. Aust. J. Soil Res. 39, 273–290. doi: 10.1071/sr99087
Undersander, D., Martin, N., Cosgrove, D., Kelling, K., Schmitt, M., Wedberg, J., et al. (1991). Alfalfa Management Guide. Madison: American Society of Agronomy Crop Science Society of America Soil Science Society of America.
van Vliet, L. J., Mackintosh, E. E., and Hoffman, D. W. (1979). Effects of land capability on apple production in Southern Ontario. Can, J. Soil Sci. 59, 163–175.
Wang, T., Hamann, A., Spittlehouse, D., and Carroll, C. (2016) Locally downscaled spatially customizable climate data for historical future periods for North America. PLoS ONE 11:e0156720. doi: 10.1371/journal.pone.0156720
Williams, G. D. V. (1983). Agroclimatic resource analysis-an example using an index derived and applied for Canada. Agric. Meteorol. 28, 31–47.
Keywords: land suitability, climate change, soil maps, agro-climatic indices, Global Circulation Model, agricultural capability
Citation: Bock M, Gasser P-Y, Pettapiece WW, Brierley AJ, Bootsma A, Schut P, Neilsen D and Smith CAS (2018) The Land Suitability Rating System Is a Spatial Planning Tool to Assess Crop Suitability in Canada. Front. Environ. Sci. 6:77. doi: 10.3389/fenvs.2018.00077
Received: 09 March 2018; Accepted: 26 June 2018;
Published: 19 July 2018.
Edited by:
Tracy Ann Porcelli, Independent researcher, CanadaReviewed by:
Jana Mrazova, Deakin University, AustraliaSean Smukler, University of British Columbia, Canada
Copyright © 2018 Bock, Gasser, Pettapiece, Brierley, Bootsma, Schut, Neilsen and Smith. This is an open-access article distributed under the terms of the Creative Commons Attribution License (CC BY). The use, distribution or reproduction in other forums is permitted, provided the original author(s) and the copyright owner(s) are credited and that the original publication in this journal is cited, in accordance with accepted academic practice. No use, distribution or reproduction is permitted which does not comply with these terms.
*Correspondence: C. A. Scott Smith, c2NvdHQuc21pdGgwNTFAZ21haWwuY29t