 Merja H. Tölle
 Marcus Breil
 Kai Radtke3
- 1Department of Geography, Climatology, Climate Dynamics and Climate Change, Justus-Liebig University Giessen, Giessen, Germany
- 2Institute of Meteorology and Climate Research–Troposphere Research, Karlsruhe Institute of Technology, Eggenstein-Leopoldshafen, Germany
- 3Chair of Environmental Meteorology, Brandenburg University of Technology, Cottbus-Senftenberg, Senftenberg, Germany
Previous studies based on observations and models are uncertain about the biophysical impact of af- and deforestation in the northern hemisphere mid-latitude summers, and show either a cooling or warming. The spatial distribution, magnitude and direction are still uncertain. In this study, the effect of three different albedo parameterizations in the regional climate model COSMO-CLM (v5.09) is examined performing idealized experiments at 0.44° horizontal resolution across the EURO-CORDEX domain during 1986–2015. De- and af-forestation simulations are compared to a simulation with no land cover change. Emphasis is put on the impact of changes in radiation and turbulent fluxes. A clear latitudinal pattern is found, which results partly due to the strong land cover conversion from forest- to grassland in the high latitudes and open land to forest conversion in mid-latitudes. Afforestation warms the climate in winter, and strongest in mid-latitudes. Results are indifferent in summer owing to opposing albedo and evapotranspiration effects of comparable size but different sign. Thus, the net effect is small for summer. Depending on the albedo parameterization in the model, the temperature effect can turn from cooling to warming in mid-latitude summers. The summer warming due to deforestation to grassland is up to 3°C higher than due to afforestation. The cooling by grass or warming by forest is in magnitude comparable and small in winter. The strength of the described near-surface temperature changes depends on the magnitude of the individual biophysical changes in the specific background climate conditions of the region. Thus, the albedo parameterization need to account for different vegetation types. Furthermore, we found that, depending on the region, the land cover change effect is more important than the model uncertainty due to albedo parameterization. This is important information for model development.
Introduction
Future strategies for climate change mitigation envision extensive afforestation to stabilize temperature rise due to their role in the global carbon cycle (Popp et al., 2017). A change in forest cover has widespread consequences to the society, economy, and ecology influencing climate and air quality. Forest cover changes exert strong influences on the energy and water balance by modifying the solar and long wave radiation, and atmospheric turbulence. This results in alterations in the fluxes of momentum, heat, water vapor, and CO2 as well as other trace gases, and both anorganic and biogenic aerosols including dust between vegetation, soils, and the atmosphere (Pielke et al., 2011).
In terms of biogeophysical modulations of forest cover change, a major change occurs to the net radiation due to albedo alterations. Depending on the physiological control of the vegetation connected with the environmental conditions in the atmosphere and soil, this net radiation is partitioned between the turbulent fluxes (sensible and latent heat). The amount of energy transferred to the atmosphere depends on the changes in the aerodynamic roughness of the land surface, and ultimately influences the atmospheric boundary layer and climate. Forests have a lower surface albedo, and higher evapotranspiration compared to open lands (Lee et al., 2011; Swann et al., 2012). The outcome of the competition between albedo warming and evapotranspiration cooling, and the specific background climate exerts the climate of the region (Duveiller et al., 2018). The strength of both effects, thus the direction of change, depend on the type of change, and on the interactions with soil conditions (Pielke et al., 2011). As a result, landscape changes due to forests affect the regional/local near-surface air temperature patterns (Tölle et al., 2014), and can be different for mean vs. extreme quantities (Alkama and Cescatti, 2016).
The consequences due to land use changes between latitudes and regions are discussed controversial in the literature based on modeling and observational studies. There are still major uncertainties regarding climate responses in climate models to past land cover changes (Pitman et al., 2009). Not only the magnitude, but also the sign of the land conversion on temperature varies between models on regional and global scales. The impact due to forest cover changes may vary regionally and with latitude based on observation and modeling studies (Davin and de Noble-Ducoudré, 2010; Lee et al., 2011; Li et al., 2015). Increases in near-surface temperature were found due to large-scale deforestation in the tropics (Snyder et al., 2004), whereas a decrease in temperature in the mid- and high-latitudes was found (Li et al., 2016a). The warming in the tropics is explained by reduced evapotranspiration (Tölle et al., 2017). The albedo is increased in temperate and boreal regions leading to reduced shortwave radiation absorption in the cleared land, which explains the cooling there in summer (Cherubini et al., 2018). In addition, the reduction in the snow-masking effect enhance the cooling in the regions, where snow occurs in winter (Bonan et al., 1992). Others based on observational studies considered the impact of afforestation in the northern temperate regions as a weak cooling (Li et al., 2016b). In seasonal terms, Li et al. (2015) found that temperate forests exert a moderate cooling in summer season, in which vegetation is most active in terms of evapotranspiration, and moderate warming in winter. Tang et al. (2018) showed contradictory results based on remote sensing that afforestation warms northeastern Europe north of 45°N and leads to a cooling in other European regions. Thus, there are major uncertainties in mid-latitudes in the spatial distribution, magnitude and direction of climate response due to land cover changes (Alkama and Cescatti, 2016; Perugini et al., 2017).
A robust quantification of biogeophysical impact of land cover change on local and regional scale is hampered by the uncertainty of the different regional climate model responses of such changes. For this, a coordinated effort is formed by the EURO-CORDEX initiative LUCAS (“Land Use and Climate Across Scales”) to benchmark the biogeophysical role of land use changes by various regional climate model and land surface model combinations using standard configurations. The effect of land cover change will be examined in detail with the LUCAS initiative over Europe. Extreme land use change scenarios help to estimate the maximal impact and elucidate processes. The work described here is part of LUCAS.
There is consensus in the scientific community about the impact of land cover change on climate in winter by the snow-masking effect in high latitudes (Bonan et al., 1992). Albeit debated is the spatial distribution, the magnitude and direction of this biogeophysical effect in summer. High uncertainties occur in mid and southern Europe, where the forest proportion is relatively small. Here, afforestation could have a potential high impact. The climatic extent of afforestation in these areas depends on the ratio between the increased net shortwave radiation and the increased aerodynamic roughness/evapotranspiration of forest. This proportion, however, strongly depends on the used regional climate model (RCM) and its model uncertainties. The question, whether these model uncertainties are higher than the potential impact of land cover change, has not yet been investigated. Therefore, we compare the regional climate response due to different albedo parameterizations in the state-of-the-art regional climate model COSMO-CLM (v5.09) with the impact of extreme land use change scenarios. The standard operational albedo configuration is considered in this study, and two modified versions of it. We quantify and compare the relative strength of seasonal and latitudinal biophysical effects from a surface energy balance perspective on the temperature response. Therefore, extreme (drastic) land use transitions are performed across the Euro-CORDEX domain at 0.44° horizontal resolution by converting the land cover to grass- or forestland. The land cover change experiments are compared to the control run with no land cover change. Simulations are carried out during 1986-2015, and the model is forced by ERA-Interim reanalysis data. Results are presented for the summer and the winter season over Europe in section 3, and the manuscript ends with a discussion and conclusion section.
Materials and Methods
Model Description
The climate version COSMO-CLM of the state-of-the-art weather prediction model COSMO in its version 5.09 is used in this study (Rockel et al., 2008). It is a non-hydrostatic limited-area atmospheric model designed for applications for the meso-β to the meso-γ scale (Steppeler et al., 2003). The model describes compressible flow in a moist atmosphere, thereby relying on the primitive thermo-dynamical equations. These equations are solved numerically on a three-dimensional Arakawa-C grid (Arakawa and Lamb, 1977) based on rotated geographical coordinates and a generalized, terrain following height coordinate (Doms and Baldauf, 2015). The model applies a Runge-Kutta time-stepping scheme (Wicker and Skamarock, 2002). The parameterization of precipitation is based on a four-category microphysics scheme that includes cloud, rainwater, snow, and ice (Doms et al., 2011). The physical parameterizations include a radiative transfer scheme (Ritter and Geleyn, 1992), and a turbulent kinetic energy-based surface transfer and planetary boundary layer parameterization.
The lower boundary of COSMO-CLM is the soil-vegetation-atmosphere model TERRA-ML (Schrodin and Heise, 2002). It controls the surface energy and water balances at the land surface and in the ground based on first principles of conserving mass and energy. With that, it provides the surface temperature and humidity as lower boundary conditions for computing the energy and water fluxes between surface and atmosphere (Doms et al., 2011). Evapotranspiration includes bare soil evaporation, plant transpiration, evaporation from the interception storage, and the sublimation of snow. Stomatal conductance is Biosphere-Atmosphere Transfer Scheme (BATS)-based after Dickinson (1984). Radiation fluxes are based on grid scale albedo and temperature. COSMO-CLM requires the leaf area index as input and the vegetation albedo to compute the fraction of photosynthetically active radiation absorbed by vegetation to obtain transpiration. The soil temperature is calculated by the heat conduction equation. The soil hydrology is described by the Richards' equation, which is solved for the multi-layer soil column. It accounts for surface runoff and subsurface runoff when the layer is at field capacity. Ten unevenly spaced vertical soil layers with a total depth of 11.50 m are used. The lowest layer temperature acts as lower boundary condition of the heat conduction equation and is set to a climatological annual mean value. Five snow layers are used for snow calculations. TERRA-ML accounts for partial coverage of snow. Every surface grid is assigned to one single land cover type. Surface input data required for each grid cell include soil type and land cover type. Each vegetation type is assigned a set of time-invariant parameters: optical properties (albedo), morphological properties (roughness, leaf area index, plant coverage, root depth). The leaf area index and root depth follow a seasonal cycle.
Experiment Design
The regional climate model COSMO-CLM runs across the EURO-CORDEX domain at a resolution of 0.44° × 0.44° with 40 atmospheric levels for the period 1986 to 2015 with a spin-up starting at 1979 to achieve balanced soil temperatures and water contents. Hereby, the ERA-Interim reanalysis from the European Centre for Medium Range Weather Forecasts serves as initial and lateral boundary conditions and as the lower boundary over sea (Dee et al., 2011). The configuration is adapted from the EURO-CORDEX initiative (Kotlarski et al., 2014), where the model was evaluated. The time step is set to 300 s, and the convection scheme of Tiedtke is applied (Tiedtke, 1989). For all experiments the same lateral boundary conditions are used. The experiments impose an idealized change to the distribution of trees and grasses across the EURO-CORDEX domain, which are compared to the control run with no land cover change. The control run is called EVALUATION in subsequent analysis.
In the FOREST experiments, all areas in the map of present day vegetation between 30°N and 72°N are converted to forestland (i.e., broad-leaf deciduous or needle-leaf evergreen trees), where trees can grow (Figure 1B). The land transition experiments extract information from the MODIS present-day land cover map at 0.5° geographical resolution (Lawrence and Chase, 2007). This map provides a global distribution of percentages of 17 Plant Functional Types (PFTs). The MODIS map is modified to account for maximum forest cover in the following way. The forest PFTs are rescaled such that they occupy the non-bare soil area (i.e., crop, shrub, or grass) in all grid cells excluding glaciers. Hereby, the different forest type proportions and the fraction of bare soil (including desert areas) are conserved. A zonal average forest composition is chosen if no trees are initially present in a given grid cell. The total area consists of all forest classes together with bare soil and sum up to 100% in all grid cells. The same procedure is applied for the land conversion to grassland. Here, all forested areas from the FOREST map are converted to grassland. The GRASS simulation represents the theoretical maximum grass coverage if grass is allowed to grow all over the land area.
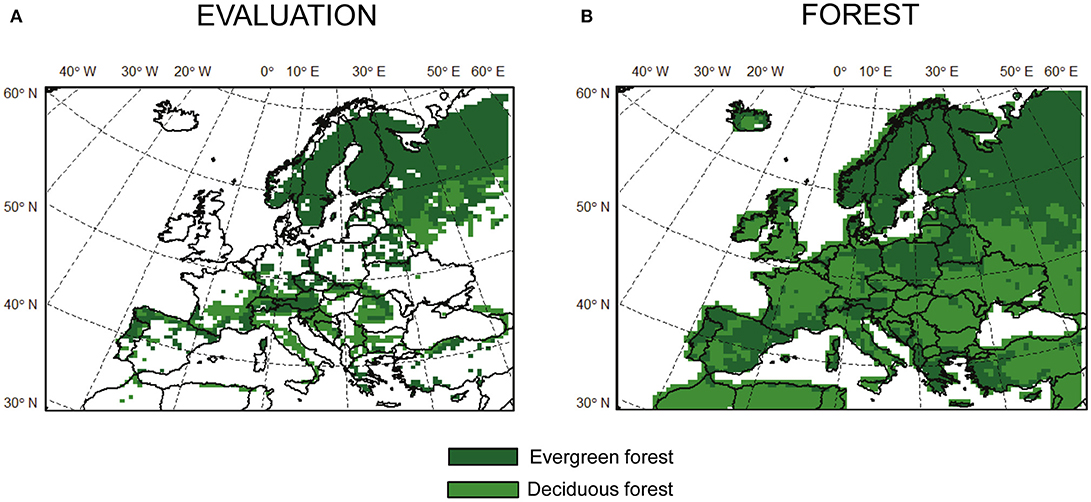
Figure 1. Forest coverage over the EURO-CORDEX domain for the EVALUATION (A) and FOREST (B) simulations. Evergreen (dark green) and deciduous (light green) forest is shown for coverage greater than 50% in a grid cell.
COSMO-CLM distinguishes between less plant categories than provided by the MODIS land cover map. Therefore, similar plant types are further combined into a single category to match the vegetation classification scheme of COSMO-CLM. For example, needle-leaf evergreen tree (temperate or boreal) are combined into a single needle-leaf evergreen tree category. The plant parameters of the new land cover type are derived from the global land cover database GLC2000 (Bartholomé and Belward, 2005). The plant parameters are kept constant throughout the simulation period to maximize model response (Tölle et al., 2014). Urban land units and lakes are not accounted for in the simulations.
Three forestland simulations are conducted, which allow three different types of shortwave albedo parameterizations. Therefore, the simulations are named FOREST1, FOREST2, and FOREST3, respectively. FOREST1 considers the standard operational albedo parameterization, where the albedo α depends on the soil type and soil moisture, and is further modified by plant and snow fraction:
where αs, αv, αso are snow, vegetation and soil albedos. A constant background albedo value of 0.15 is applied for αv with no distinction between different vegetation types. st is the soil type and sm is the soil moisture. fs and fv are the area fraction of snow and vegetation cover. FOREST2 assumes an albedo depending on soil type and moisture, and modified by snow coverage. Further, the albedo is modified by individual vegetation albedo values used for grass, evergreen, and deciduous forest. These categories depend further on the evergreen and deciduous forest fraction. Here, the following is assumed for αv:
where fve and fvd are area fractions of evergreen and deciduous forest cover respectively. αve = 0.1 is the albedo for evergreen forest, αvd = 0.15 is the albedo for deciduous forest, and αvg = 0.2 is the albedo for grass. The difference of FOREST3 to FOREST2 is that the soil albedo αso for FOREST3 does not depend on soil moisture sm. Here, the soil albedo varies between 0.2 and 0.3 depending on soil type. The standard operational albedo parameterization, see equation (1), is assumed for the EVALUATION and GRASS simulations.
The forest cover maps over the EURO-CORDEX domain along with the political boundaries are displayed in Figures 1A,B as used for the EVALUATION and FOREST simulations. If the coverage of either evergreen or deciduous forest is greater than 50% in a grid cell, the grid cell is marked as dark green or light green respectively. The grassland simulation considers grass in all the green grid points of Figure 1B. Obviously different from the EVALUATION simulation is the fraction of broad-leaf deciduous forest in the FOREST simulations, which covers now main open land areas over France, United Kingdom, Germany, Turkey, Hungary, Romania, Bulgaria, Ukraine, parts of western Russia, see Figures 1A,B. Spain, Poland, and Belarus are mainly converted to needle-leaf evergreen forest. Less conversion to forest is seen for the Scandinavian countries compared to the EVALUATION simulation since these countries are already forested. According to Figure 1A main vegetation transitions for GRASS occur over forested regions such as Scandinavia and northern Russia as well as parts of the western European countries.
The relative strength of seasonal and latitudinal biophysical effects is compared and quantified from a surface energy balance perspective on the temperature response. Therefore, anomalies of each energy balance component are calculated as the difference in climate variable between an experiment (FOREST1, FOREST2, FOREST3, GRASS) and control simulation without land cover change (EVALUATION), which is experiment minus control (Δ = experiment – control). The af- and deforestation experiments are extreme cases. Therefore, they do not represent a predicted or realistic scenario. It is intended to investigate how much of climate change is possible due to changes in European vegetation cover given the current configuration of continents. The experimental design with its sensitivity study on albedo gives an opportunity to identify the mechanisms controlling the interaction between climate and vegetation in Europe.
We suggest that the different biophysical forcing of conversion to forest- or grassland may depend on the climate zone. Therefore, we separately perform analysis for three climate zones: the boreal (58°-72°N) called NORTH, the temperate (43°-58°N) called MIDDLE, and Mediterranean (dry summer, 30°-43°N) region called SOUTH hereafter. Here, the fractional area with land cover change differs among the northern (1430 grid points), middle (2178 grid points), and southern (987 grid points) regions.
Results
Changes in Near-Surface Temperature
Contrasting effects occur between land conversion, latitudes, longitudes, and seasons (winter warming/cooling and summer indifferent/warming for changes to FOREST/GRASS), see Figures 2A–D. The largest climate impact of land conversion is depicted for GRASS during summer (Figure 2D, JJA), at a time of maximum incoming radiation. An overall mean increase in near-surface air temperature is about 1.6°C with largest changes up to 4°C over Hungary and Ukraine. Conversely, GRASS shows a cooling by −0.5°C in winter over regions, which experience snow coverage. Up to −1.5°C cooling over northern Russia is depicted. Contradictory, the western European countries turn warmer by +0.5°C in winter.
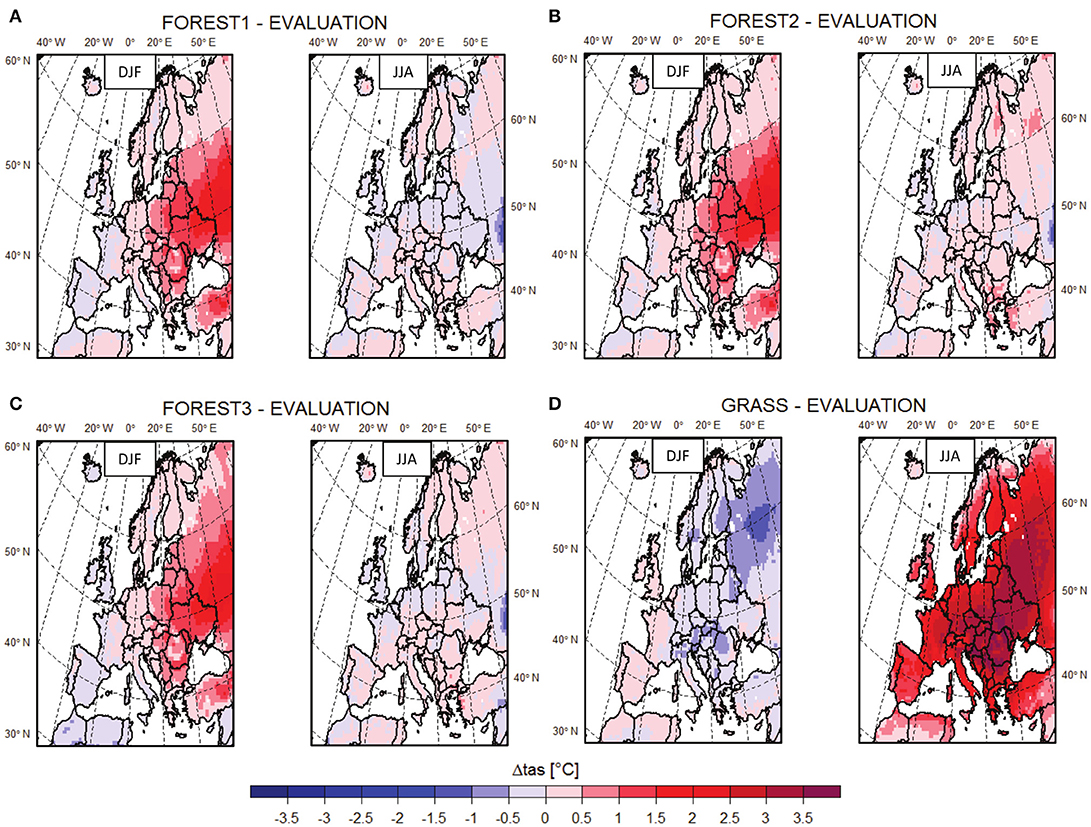
Figure 2. Spatial distribution of mean seasonal near-surface air temperature changes over the EURO-CORDEX domain for the conversion to forest with three different albedo parameterizations [FOREST1 (A), FOREST2 (B), FOREST3 (C)], and to grassland [GRASS (D)] for winter (DJF, left) and summer (JJA, right) for 1986–2015. The difference between experiments and the EVALUATION simulation with no land cover change is displayed.
The largest change toward warmer air temperatures up to +2.5°C occurs in winter for all of the FOREST simulations mainly over the eastern states, west Russia, and Turkey, see Figures 2A–C, DJF). For Portugal and Spain, half a degree Celsius cooling is depicted. FOREST3 displays the strongest warming in winter, followed by FOREST2 and then FOREST1. The FOREST simulations yield similar patterns of change among each other in winter.
Most parts of the inner continental area of the mid-latitudes display minor cooling by half a degree Celsius for FOREST1 in summer. FOREST2 and FOREST3 display half degree warming over the same areas, while FOREST2 also shows +1°C warming in some coastal areas (Greece, western Turkey) and in the northern part (eastern Finland and northern Russia).
Seasonal Cycle of Albedo
The seasonality of the albedo is mainly driven by the seasonal snow coverage, and to a minor extent by the seasonal vegetation coverage, as the albedo values stay constant throughout the time [see Equations (1) and (2) and Figure 3A]. The albedo difference between all of the simulations is evident in all seasons (Figures 3B–D). Although major differences appear in winter (albedo increase for GRASS and decrease for FOREST compared to EVALUATION). The seasonal cycle of the albedo depends further on the latitudinal area (Figures 3B–D). Largest differences occur between the GRASS and the FOREST runs for the northern und mid-latitudes in winter, where the snow masking effect of trees is strongest. In summer, GRASS reflects the most of the incoming radiation followed by EVALUATION and FOREST1, FOREST3, and then FOREST2 (Figure 3A). The soil moisture is not considered in the albedo calculation of FOREST3. This leads to an overestimation of the albedo for moist soil. The albedo parameterization of FOREST1 is the operational one as used for the EVALUATION simulation, and does not depend on different vegetation types. Therefore, the simulated albedo of FOREST1 is similar to that of the EVALUATION simulation in mid-latitudes in summer (Figure 3C). This means that the observed changes in temperature realtive to the EVALUATION run are mainly the result of changes in surface roughness and turbulent flux partitioning. A lower albedo of 1 to 2 percent is depicted for FOREST3 and FOREST2 compared to EVALUATION in mid-Europe in summer (Figure 3C). The associated increase in available energy at the surface for FOREST3 and FOREST2 might contribute to the summer warming seen in Figures 4B–C for mid-latitudes. Further, the albedo differences are higher between the diverse albedo parameterizations than between the different land covers in southern Europe in summer (see FOREST vs. GRASS in Figure 3D). The albedo parameterization is here a high uncertainty factor to estimate the impact of land use/cover change.
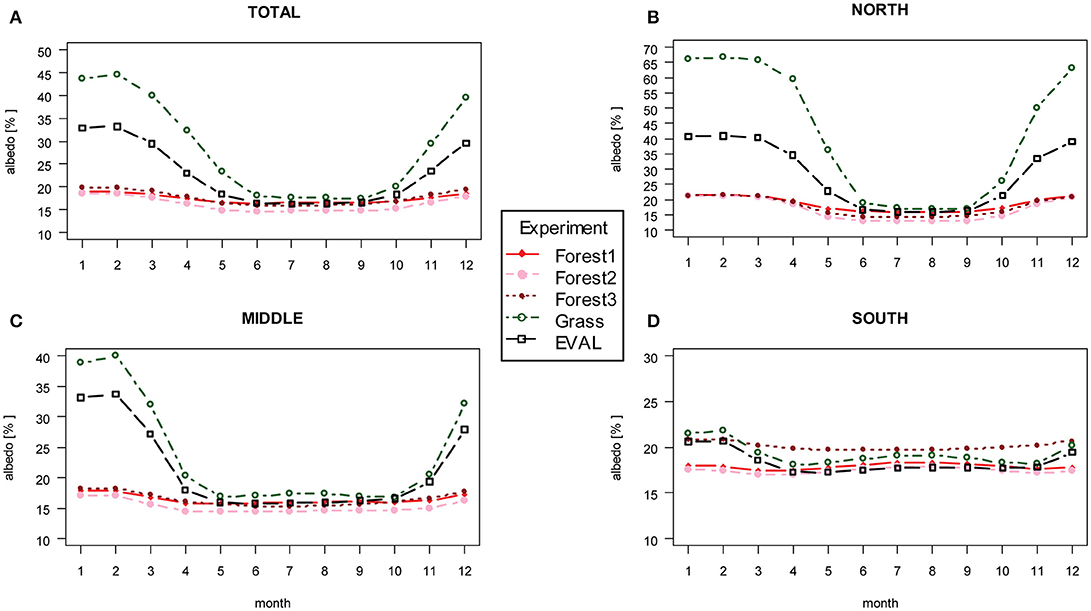
Figure 3. Domain averaged long-term mean seasonal cycle of the albedo of FOREST1 (red), FOREST2 (rose), FOREST3 (dark red), GRASS (dark green), and EVALUATION (black) over all land points only for 1986–2015. Albedo values are displayed for the whole of the domain TOTAL (A), and with latitudinal separation in NORTH (B) for high-latitudes (note the different y-axis scale), MIDDLE (C) for mid-latitudes, SOUTH (D) for the Mediterranean (note the different y-axis scale).
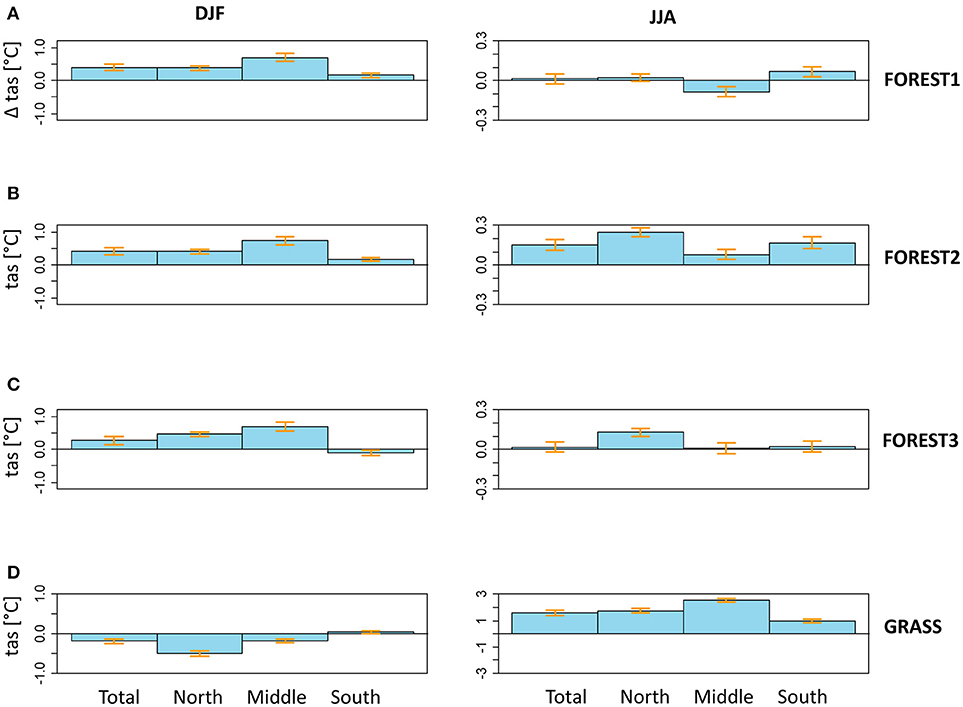
Figure 4. Changes in mean near-surface air temperature compared to the EVALUATION simulation with no land cover change over the EURO-CORDEX domain of three afforestation experiments using a different albedo parameterizations [FOREST1 (A), FOREST2 (B), FOREST3 (C)] and deforestation experiment [GRASS (D)] for the whole of the domain (TOTAL), and with latitudinal separation in NORTH (58°-72°N) for high-latitudes, MIDDLE (43°-58°N) for mid-latitudes, SOUTH (30°-43°N) for the Mediterranean for winter (DJF) and summer (JJA) for 1986–2015. The errorbars represent ± two times the standard error around the mean. Plotted are differences over all land-points only. Note the different y-axis of GRASS in summer.
To summarize, main albedo differences occur due to different vegetation types, and minor albedo differences occur due to the specified parameterization in the model. An exception is southern Europe, where the albedo parameterization is a high uncertainty factor.
Latitudinal and Seasonal Variations in Near-Surface Temperature
We recognize that there is also a west to east gradient, but do not account for this gradient in subsequent analysis, where the latitudinal dependence is discovered. Even though the effect of forests is expected to have high spatial variability within the same climate zone, we still see an overall cooling effect in the mid-latitudes for FOREST1 in summer (Figure 4A, JJA). This cooling effect turns into a warming for FOREST2 (Figure 4B, JJA), and is indifferent for FOREST3 (Figure 4C, JJA). The greatest warming of all regions occurs for FOREST2 in summer, and especially in high latitudes (+0.3°C). All of the FOREST runs display a warming in winter with greatest warming in mid-Europe (+0.7 to +1.0°C, Figures 4A–C, DJF). A minor winter cooling is depicted for FOREST3 in the Mediterranean area.
Grassland has the opposite effect in winter. Here, a cooling (−0.2 to −0.5°C) especially in the high-latitudes is seen (Figure 4D, DJF). No creditable difference is depicted for the Mediterranean. Major warming occurs in summer (up to 3°C in mid–Europe, JJA). The warming is much stronger than that of afforestation.
Seasonal Cycle of Diurnal Temperature Range
Change in the diurnal temperature range is greater for FOREST than for GRASS (Figures A6a–d) owing to the increased roughness length. During summer months, the diurnal cycle is increased for GRASS in the northern region (Figure A6b). Although changes in maximum and minimum temperatures are different among the three climatic zones and seasons (Figures 5A–D). In southern Europe, maximum temperature changes of GRASS is almost the same to that of FOREST. However, the decrease in minimum temperature of GRASS compared to EVALUATION is about 1°C less than that of FOREST in summer (Figure 5D). Changes in maximum and minimum temperatures are higher/lower in summer and to a lesser extent lower/higher in winter for GRASS compared to FOREST in mid-Europe, which explains the reduced diurnal cycle for GRASS here (Figure 5C). The maximum and minimum temperatures are slightly higher for FOREST2 followed by FOREST3 than for FOREST1 for the same region. A steeper seasonal gradient is found for GRASS in northern Europe. Here, the diurnal temperature range is greater for GRASS than for FOREST by half a degree Celsius in summer and to a minor extent in winter, too (see Figure A6b).
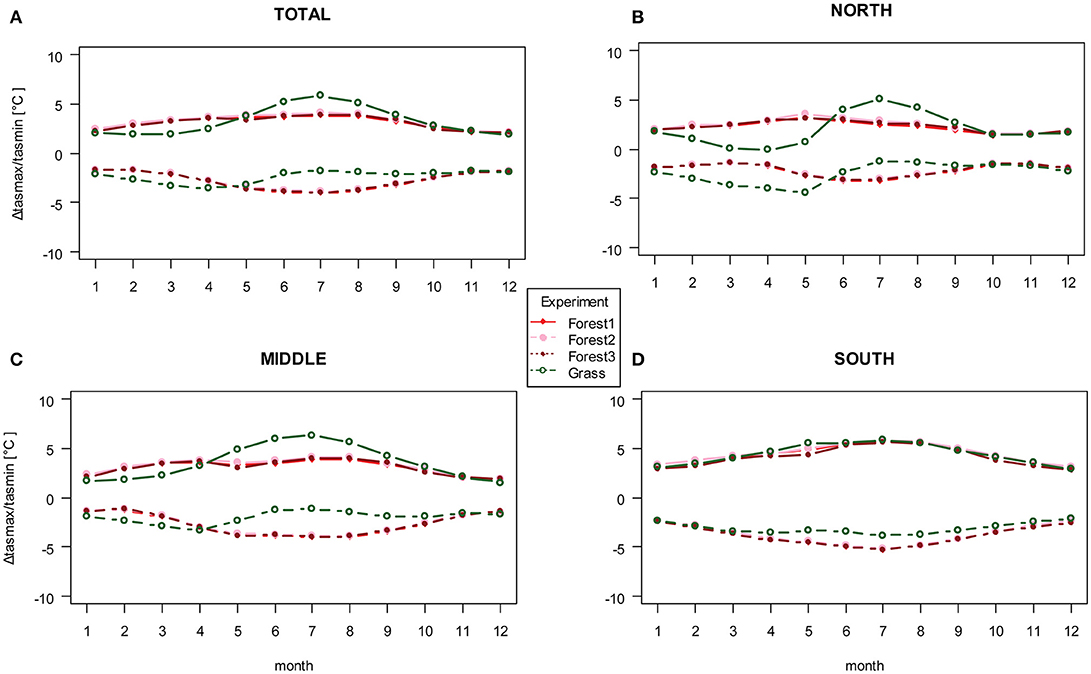
Figure 5. Domain averaged long-term mean seasonal cycle difference of maximum and minimum near-surface temperature of FOREST1 (red), FOREST2 (rose), FOREST3 (dark red), GRASS (dark green) relative to EVALUATION over all land points only for 1986–2015. Values are displayed for the whole of the domain TOTAL (A), and with latitudinal separation in NORTH (B) for high-latitudes, MIDDLE (C) for mid-latitudes, SOUTH (D) for the Mediterranean.
Changes in Turbulent Fluxes
Relative to the EVALUATION run, tree cover increases both latent and sensible heat fluxes, see Figures 6, 7. Latent heat fluxes increase at up to +15 W/m2 over the eastern countries in winter for the forestland simulations owing to the fact of major afforestation in these areas. All other parts display changes of +10 W/m2. In summer, a mixture of increases over the continental areas and decreases over the maritime region is seen. Similarly, sensible heat fluxes are increased over all forestland simulations by +5 to +15 W/m2.
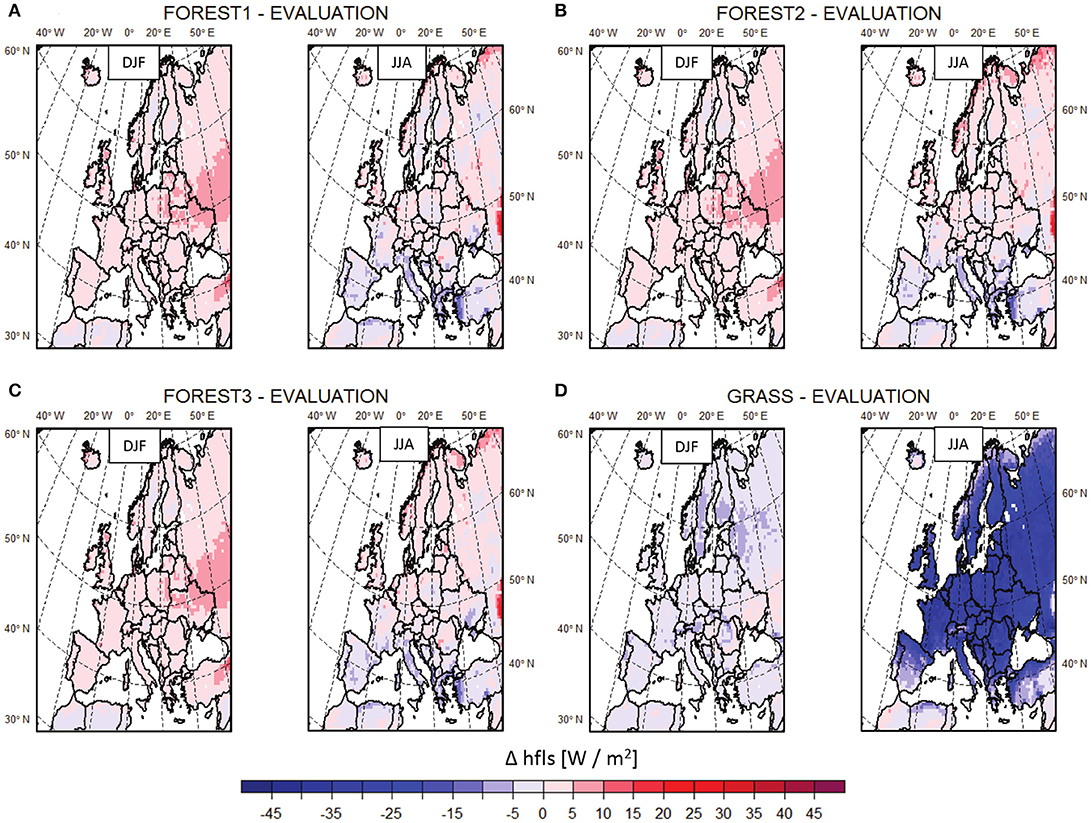
Figure 6. Spatial distribution of mean latent heat flux changes over the EURO-CORDEX domain for the conversion to forest with three different albedo parameterizations [FOREST1 (A), FOREST2 (B), FOREST3 (C)], and to grassland [GRASS (D)] for winter (DJF, left) and summer (JJA, right) for 1986–2015. The difference between experiments and the EVALUATION simulation with no land cover change is displayed over land points only.
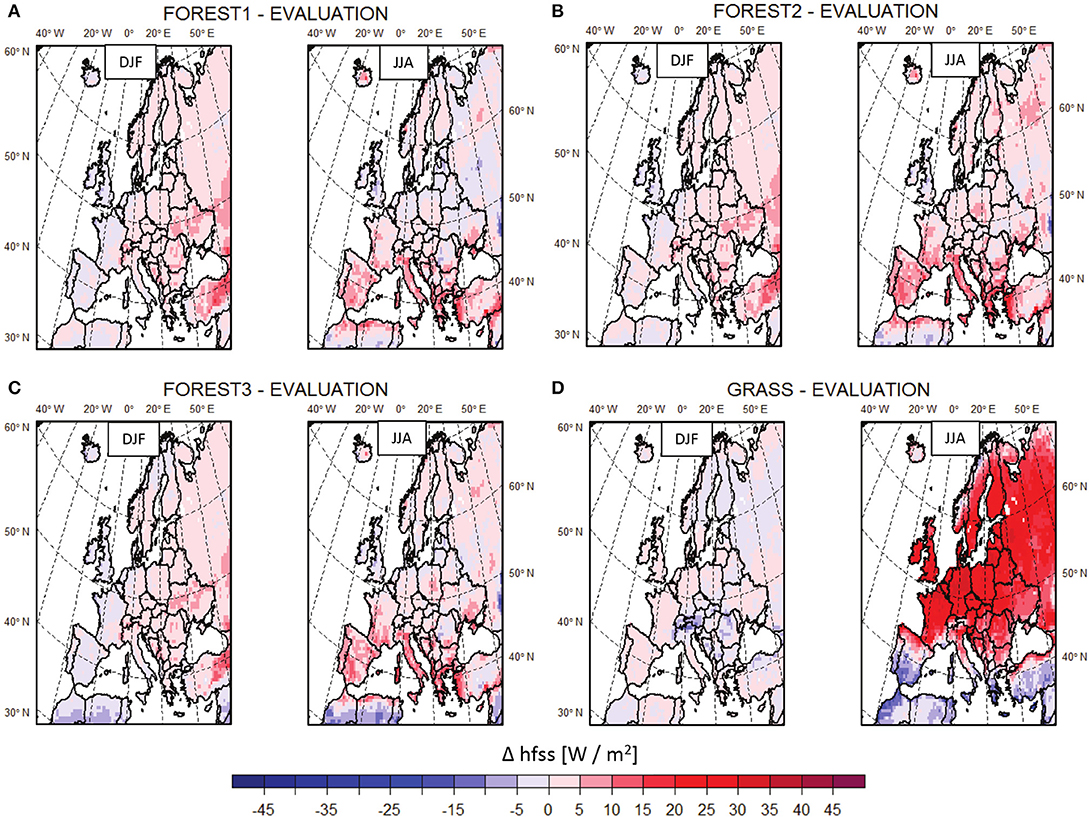
Figure 7. Spatial distribution of mean sensible heat flux changes over the EURO-CORDEX domain for the conversion to forest with three different albedo parameterizations [FOREST1 (A), FOREST2 (B), FOREST3 (C)], and to grassland [GRASS (D)] for winter (DJF, left) and summer (JJA, right) for 1986–2015. The difference between experiments and the EVALUATION simulation with no land cover change is displayed over land points only.
The land cover change to forest is associated with biophysical vegetation characteristic changes via increases in the leaf area index, plant coverage, and roughness length. The actual flux change depends on the roughness length, which redistributes the energy through convection and evapotranspiration. Owing to their high aerodynamic roughness, forests dissipate sensible heat as efficiently to the atmospheric boundary layer as latent heat, see Figures 6, 7. Due to the higher leaf area index and plant coverage, latent heat is increased and removed from the surface via turbulence, which is released above the atmospheric boundary layer by cloud condensation (see increase in total cloud coverage in Figure A5a compared to Figures A5b and A5c).
Major changes in the fluxes are seen for latent and sensible heat for GRASS in summer (Figures 6D, 7D), where almost all over the domain a sharp decrease/increase of latent/sensible heat (up to −40/+20 W/m2) is observed. Decreases of latent heat occur over the Mediterranean area in summer. In this case, reductions of surface roughness and leaf area index/plant coverage reduce the evapotranspirative potential (see reduced seasonal cycle of latent heat flux in Figure A7d). For GRASS, the partitioning between sensible and latent heat flux is different than for forestland (see Figures A1, A7, A8 in the Appendix). Whereas FOREST have comparable latent and sensible heat fluxes, GRASS shows higher sensible than latent heat fluxes during the growing period (Figures A7, A8). This difference in flux portioning is especially apparent in the Mediterranean region (Figures A7d, A8d) due to the limitation of soil moisture availability.
To summarize, latent heat fluxes are increased for FOREST compared to GRASS, but sensible heat fluxes are additionally increased. Major changes occur over areas with strong land conversion. Major changes of the different albedo parameterizations occur during the summer time with strongest changes seen in FOREST2. Characteristic changes (decrease/increase of latent/sensible heat fluxes in summer and of less magnitude in winter) is seen for GRASS.
Changes in Radiation Fluxes
In the FOREST1 run, the net shortwave radiation is decreased by ~4 W/m2 (Figures 8A–C), and the net longwave radiation is increased by ~8 W/m2 (Figures 9A–C) in areas showing summer cooling (see Ukraine, Poland, Belarus, and western Russia in Figure 2A). Whereas for FOREST2, in Scandinavia and eastern countries the net shortwave radiation is increased and net longwave radiation is slightly decreased contributing to the summer warming in this area. This is for a lesser extent visible for FOREST3. The major warming in winter in the afforested areas results due to a sharp increase in net shortwave radiation in that area for all of the FOREST runs (Figures 8A–C).
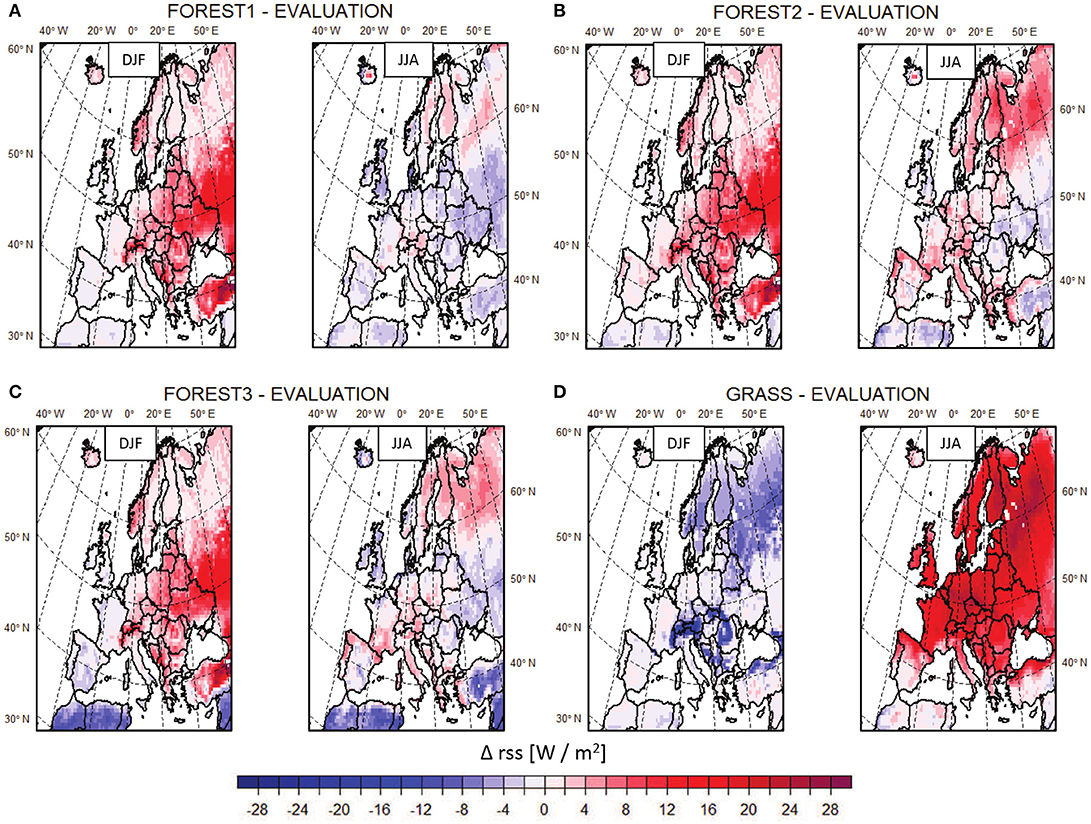
Figure 8. Spatial distribution of mean net shortwave flux changes over the EURO-CORDEX domain for the conversion to forest with three different albedo parameterizations [FOREST1 (A), FOREST2 (B), FOREST3 (C)], and to grassland [GRASS (D)] for winter (DJF, left) and summer (JJA, right) for 1986–2015. The difference between experiments and the EVALUATION simulation with no land cover change is displayed over land points only.
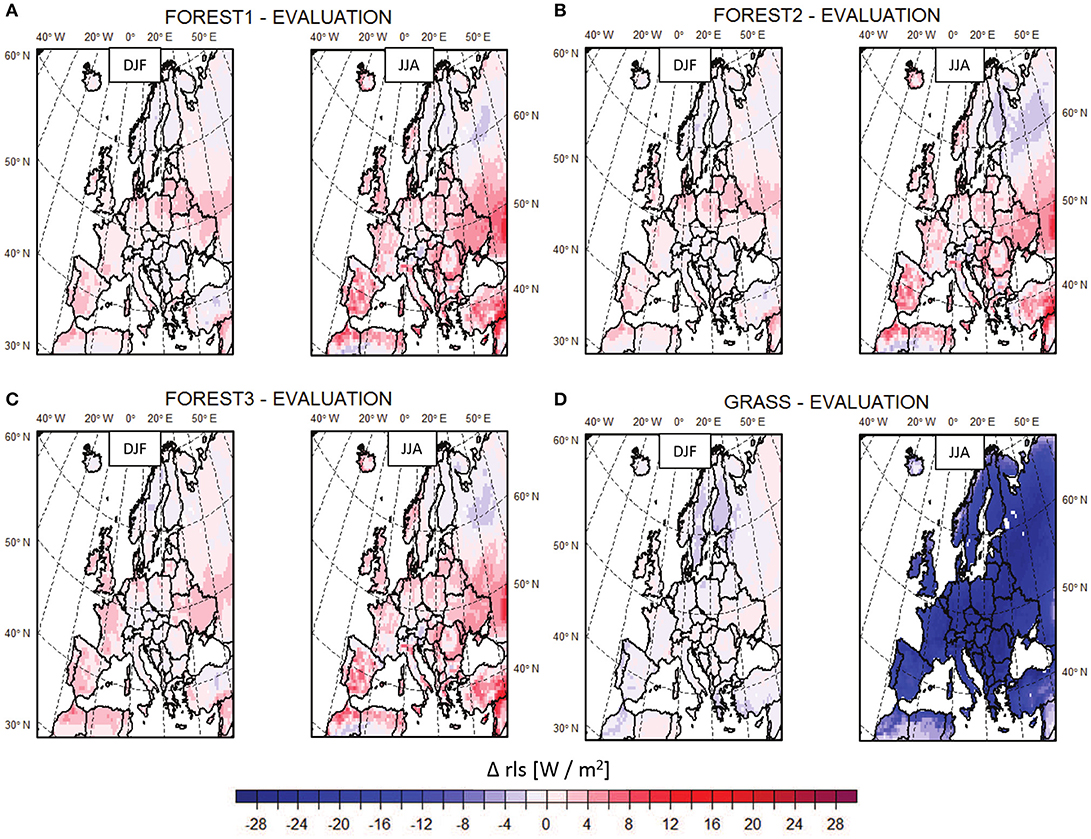
Figure 9. Spatial distribution of mean net longwave flux changes over the EURO-CORDEX domain for the conversion to forest with three different albedo parameterizations [FOREST1 (A), FOREST2 (B), FOREST3 (C)], and to grassland [GRASS (D)] for winter (DJF, left) and summer (JJA, right) for 1986–2015. The difference between experiments and the EVALUATION simulation with no land cover change is displayed over land points only.
Strongest radiation changes occur in the GRASS simulation, where the net shortwave radiation is decreased by 30 W/m2 over the alpine area and northern high latitudes in winter (Figure 8D) obviously leading to the cooling seen in this region (Figure 2D). The replacement of forests with grass in northern latitudes increases surface albedo and reduces absorbed radiation (see Figures A2, A3 in the Appendix). Since the snow-masking effect is less than for FOREST, the winter snow coverage is more effective in reflecting radiation over grassland resulting in a cooling effect. Major summer warming occurs for the conversion to grassland, because of major net shortwave increases and net longwave decreases. Although the albedo is higher for GRASS than for the EVALUATION simulation in summer, the increase in shortwave radiation can be explained by the decrease in total cloud coverage (see Figure A5b).
Changes in Ground Heat Fluxes
The relationship between net radiation and turbulent fluxes between the experiments and the EVALUATION simulation is displayed in Figure 10 as differences of the ground heat flux. Here, the ground heat flux is the residuum of the radiation balance and the turbulent fluxes. If the residual differences between FOREST/GRASS and EVALUATION are positive, more radiative energy is absorbed than transferred to turbulent energy in the experiments relative to EVALUATION and vice versa. Changes in winter temperature for FOREST result due to changes in radiation processes, which are higher by 6 to 8 W/ m2 than the turbulent flux changes (Figures 10A–C). Although turbulent flux changes dominate summer temperature differences. These results can be explained by the magnitude of the land conversion. The area, where the land conversion is the greatest (change of open land to forest in eastern countries), the difference in radiation dominates (see positive values of the change in the energy balance in Figures 10A–C) in winter resulting into a warming since forests have a lower albedo and consequent enhanced absorption of solar radiation. The turbulent flux changes dominate in summer. If soil moisture is present in suitable amounts, trees have a larger latent heat flux. They also dissipate sensible heat as efficiently to the atmospheric boundary layer as latent heat. The turbulent flux effect is here stronger for forestland than for grassland, especially in the higher latitudinal region. We acknowledge that the difference of the energy balance between forestland and grassland is positive in winter, meaning a stronger radiation effect of forest, and negative in summer (see Figure A4 in the Appendix).
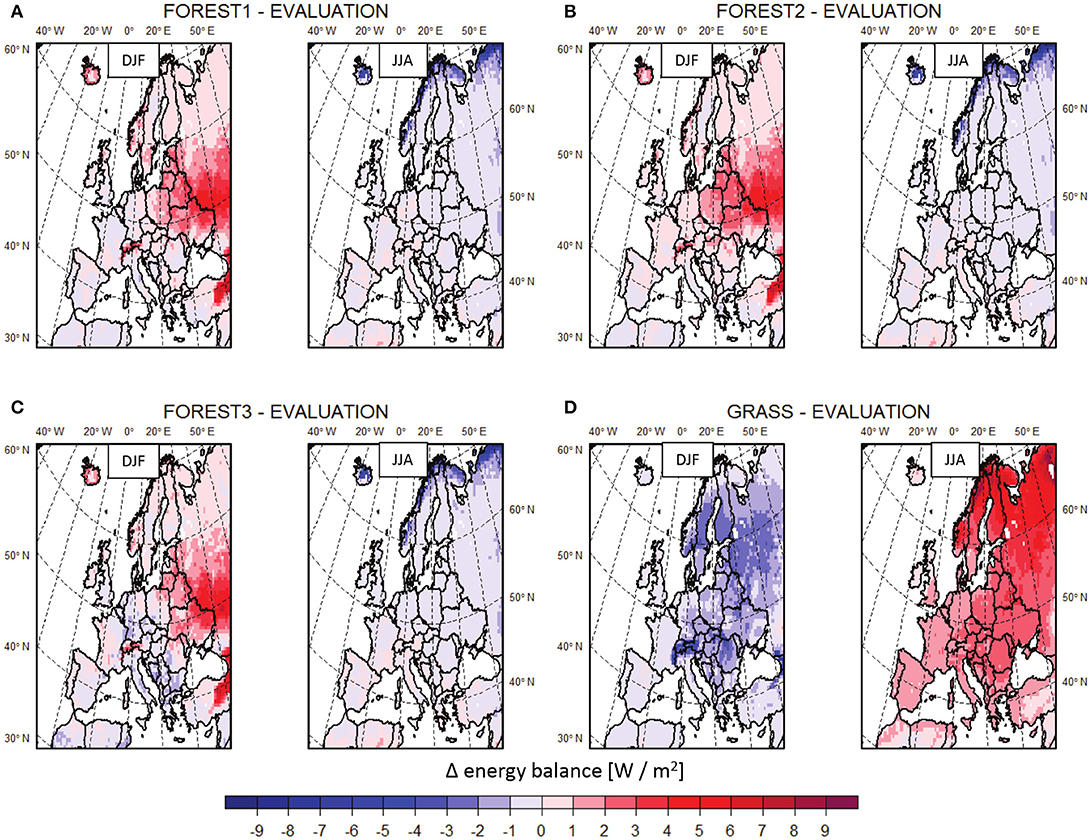
Figure 10. Spatial distribution of temporal mean energy balance changes over the EURO-CORDEX domain for the conversion to forest with three different albedo parameterizations [FOREST1 (A), FOREST2 (B), FOREST3 (C)], and to grassland [GRASS (D)] for winter (DJF, left) and summer (JJA, right) for 1986–2015. The difference between experiments and the EVALUATION simulation with no land cover change is displayed over land points only.
In the case of GRASS, turbulent flux differences are higher in winter and vice versa in summer (Figure 10D). Here, similar argumentation as before can be applied. That the turbulent flux differences are higher than the changes in radiation in winter applies mainly to the northern areas of Scandinavia and northern Russia, the area with former forest and thus greatest land conversion and associated changes in the biophysical characteristics. In summer, the transformation to grassland leads to an increase in net shortwave radiation, a decrease in net longwave radiation, a major decrease in latent heat flux and an increase in sensible heat flux.
Discussion
The previous land cover must be considered in order to interpret the results. The former land cover determines the strength of the conversion to either forest or grass and with that the strength of the biophysical characteristic changes. This is also a function of the vegetation albedo, roughness length, and evapotranspiration potential, if different vegetation types are considered. The latitude is another determinant, which influences the climate change due to land conversion, because of the background climate and snow-masking effect.
Therefore, major winter warming (up to 2.5°C) of the FOREST simulations occurs over areas, which are extensively afforested compared to the EVALUATION simulation, which is true for the eastern countries, west Russia, and Turkey, see Figures 1A,B. Here, forests have a warming effect when the former major land cover was open land and not forest. The conversion to forest leads to a reduction of the albedo for all FOREST simulations in winter, which increases the available energy at the surface. The reflectivity is further reduced due to the snow-masking effect of forest in winter. This results in a winter warming of the eastern countries (Bonan et al., 1992; Bonan, 2008; Tang et al., 2018). Those remaining European regions, which experience snow cover in winter and where the forest fraction is increased, show also a warming effect since the radiative warming dominates the non-radiative cooling (Bright et al., 2017). Only in west-Europe, a winter cooling by half a degree Celsius is depicted, since more evapotranspiration of water occurs, and the sensible heat is decreased. In addition, the net incoming radiation is decreased due to more cloud coverage (see Figure A5 in the Appendix) by higher evapotranspiration. Thus, the warmer regions can suppress the albedo warming effect of forest (Li et al., 2015). This effect is similar for FOREST1, FOREST2, and FOREST3.
A conversion to grassland can be regarded as a strong land cover change effect (deforestation) in the high latitudes. Thus, grassland has a winter cooling effect if the former land cover was forested like in the Scandinavian countries and northern Russia, see Figures 1A,B, and Figure 2D, DJF (Cherubini et al., 2018). These are regions, which experience snow coverage, and the decreased snow-masking effect enhance the cooling there in winter. The western European countries turn warmer in winter. Although the difference between forest and grass also implies the same direction (cooling by grass), see Figure A1 in the Appendix. The regions, which experience snow coverage in winter, get cooler by half a degree Celsius due to the increase in reflectivity associated with the snow-masking effect. Alkama and Cescatti (2016) postulated a sharp reduction in high latitude temperatures due to large-scale deforestation. Although similar changes of temperatures are also seen over Scandinavia in our study, they are only moderate in magnitude. Also a surface cooling by deforestation of the mid and high latitudes of the northern hemisphere was reported before by Douville and Royer (1997). The western European areas turn warmer by half a degree Celsius in winter since the evapotranspiration is reduced and more sensible heat is produced.
Eastern and mid-Europe turn cooler for FOREST1 in summer. The operational albedo parameterization is used for FOREST1, and the summer albedo is similar to the albedo of the EVALUATION run in mid-latitudes, see Figure 3C. Thus, the simulated changes in temperature result from increases in surface roughness and turbulent fluxes. The higher evapotranspiration increases cloud coverage, strengthens the long-wave downward radiation, and reduces the direct incoming radiation, see Figure A10. This results in an additional cooling effect. The cooling effect due to afforestation in mid-Europe is in line with remote sensing and in situ observations (Alkama and Cescatti, 2016; Bright et al., 2017). Contradictory, these regions turn warmer for FOREST2 followed by FOREST3 with a different albedo parameterization depending on the vegetation type. A lower albedo is depicted for FOREST2 and FOREST3 compared to EVALUATION in mid-Europe in summer. The associated increase in available energy at the surface for FOREST2 and FOREST3 contributes to the summer warming in mid-latitudes. The soil moisture is not considered in the albedo calculation of FOREST3. This leads to an overestimation of the albedo for moist soil conditions of FOREST3 compared to FOREST2. Further, climatic changes depend on the strength of daytime warming and nighttime cooling, and is reflected by the differences in maximum and minimum temperature (Figure 5D, Cherubini et al., 2018). Summer warming by afforestation was pointed out by Bonan et al. (1992). The alternate albedo parameterization with vegetation albedo depending on vegetation type leads to a reduction of the albedo compared to FOREST1, and with that to increased net incoming radiation. It is thus how the albedo of the vegetation is treated in the model that determines the response of summer climate to afforestation in mid-latitudes.
All the forest simulations show a warming in southern Europe in summer. Despite the higher evapotranspiration potential due to the higher leaf area index of forest, there is less evapotranspiration. This may be translated to less soil moisture available for evaporation, which is also reduced (Swann et al., 2012). Thus, the Bowen ratio is increased, and more sensible heat is released to the atmosphere, see Figure A9. Sensible heat and net short-wave radiation fluxes show the most variability among the experiments. The results show that the differences in the various vegetation albedos (as for FOREST2 and FOREST3) are more important than the consideration of the soil moisture and type (as for FROEST1 and FOREST2).
For deforestation, the whole of Europe turns warmer by up to 3°C in summer since the latent/sensible heat fluxes are decreased/increased. The total cloud coverage decreases due to the reduced evapotranspiration (see Figure A5b in the Appendix), which is also seen in the reduced long-wave downward radiation. Thereby the net incoming radiation accelerates, see Figures A9 and A10. Most climate models show an average regional cooling from deforestation (Perugini et al., 2017). This is generally confirmed in our study for regions, which experience snow coverage in winter. Although this winter cooling is offset by a dramatic warming in summer. Thus, grassland increases seasonal temperature variation compared to forest. These results highlight the fact that local biophysical processes triggered by afforestation can decrease seasonal temperature variations, further reducing the temperature trends driven by the increasing greenhouse gas concentrations.
Albedo differences turn out to be higher between the FOREST simulations due to the albedo parameterizations than between the land cover types in southern Europe. The high temperature discrepancies between GRASS and the three FOREST simulations in this region thus stem primarily from differences in evapotranspiration rather than from the albedo effect. Therefore, the land cover change impact is higher in this region than the model uncertainty. Thus, an accurate land cover map with characteristic vegetation types is important to include for such kind of studies.
Conclusions
In this study, the effect of three different albedo parameterizations is examined for afforestation experiments at 0.44° horizontal resolution across the EURO-CORDEX domain during 1986-2015. Idealized de- and af-forestation simulations are compared to the simulation with no land cover change. Emphasis is put on the impact of changes in radiation and turbulent fluxes. A clear latitudinal pattern is found, which results partly due to the strong land cover conversion from forest- to grassland in the high latitudes and open land to forest conversion in mid-latitudes. Afforestation warms the climate in winter, strongest in mid-latitudes. Results are indifferent in summer owing to opposing albedo and evapotranspiration effects of comparable size but different sign. Thus, the net effect is small for summer. Depending on the albedo parameterization in the model, the temperature effect can turn from cooling to warming in mid-latitude summers. The summer warming due to deforestation is up to 3°C higher than due to afforestation due the reduced roughness and leaf area index cooling. The cooling by grass or warming by forest is in magnitude comparable and small in winter even though the albedo differences are high.
The strength of the land conversion and associated vegetation type with its biophysical characteristics is the major determinant in changing the climate. Different albedo parameterizations in the model either enhance or suppress the climate change due to land cover change. Even though the difference between the albedo parameterizations is small, they influence the model's outcome of summer climate due to afforestation being either a warming or cooling in the mid-latitudes. Here, we suggest that temperature changes are mainly influenced by the magnitude of individual biophysical changes and the specific background climate conditions, in which the land use change occurs. Thus, the albedo parameterization need to account for different vegetation types. Furthermore, the albedo parameterization is a high uncertainty factor to estimate the impact of land use/cover change in southern Europe. This is important information for model development.
Altering the surface boundary conditions resulted in changes of the total cloud cover amount in this study. Thus, land-atmosphere interactions affect the hydrological cycle, which indirectly feed back on the surface energy balance components. The contribution of horizontal/vertical advections to near-surface air temperature changes would be an important issue to look at next with reconsideration of the cumulus scheme in the model.
Author Contributions
MT: conceptualization, methodology, software, formal analysis, writing-original draft preparation, writing-review & editing, supervision, project administration, funding acquisition, visualization; MT, MB: investigation, interpretation; MT, MB, KR, and H-JP: validation; MT, MB, and KR: data curation.
Conflict of Interest Statement
The authors declare that the research was conducted in the absence of any commercial or financial relationships that could be construed as a potential conflict of interest.
Acknowledgments
Computational resources were made available by the German Climate Computing Center (DKRZ) through support from the Federal Ministry of Education and Research in Germany (BMBF). The FOREST and GRASS vegetation maps were created and provided by Edouard Davin in the context of the LUCAS initiative. We acknowledge the funding of the German Research Foundation (DFG) through grant nr. 401857120. Authors acknowledge the support from BMBF through MiKlip (FKZ: 01LP1518A). We have benefited from the CLM-community (www.clm-community.eu). We thank two reviewers for their useful comments to the manuscript.
Supplementary Material
The Supplementary Material for this article can be found online at: https://www.frontiersin.org/articles/10.3389/fenvs.2018.00123/full#supplementary-material
References
Alkama, R., and Cescatti, A. (2016). Biophysical climate impact of recent changes in global forest cover. Science 351, 600–604. doi: 10.1126/science.aac8083
Arakawa, A., and Lamb, V. (1977). “Computational design of the basic dynamical processes in the UCLA general circulation model,” in Methods in Computational Physics: General Circulation Models of the Atmosphere, ed J Chang (New York, NY: Academic Press) 17, 173–265. doi: 10.1016/B978-0-12-460817-7.50009-4
Bartholomé, E., and Belward, A. S. (2005). GLC: a new approach to global land cover mapping from earth observation data. Int. J. Remote Sens. 26, 1959–1977. doi: 10.1080/01431160412331291297
Bonan, G. B. (2008). Forests and climate change: forcings, feedbacks, and the climate benefits of forests. Science 320, 1444–1449. doi: 10.1126/science.1155121
Bonan, G. B., Pollard, D., and Thompson, S. L. (1992). Effects of boreal forest vegetation on global climate. Nature 359, 716–718.
Bright, R. M., Davin, E., O'Halloran, T., Pongratz, J., Zhao, K., and Cescatti, A. (2017). Local temperature response to land cover and management change driven by non-radiative processes. Nat. Clim. Chang. 7, 296–302. doi: 10.1038/nclimate3250
Cherubini, F., Huang, B., Hu, X., Tölle, M. H., and Strømman, H. A. (2018). Quantifying the climate response to extreme land cover changes in Europe with a regional model. Environ. Res. Lett. 13:074002. doi: 10.1088/1748-9326/aac794
Davin, E. L., and de Noble-Ducoudré, N. (2010). Climate impact of global-scale deforestation: radiative versus non-radiative processes. J. Clim. 23, 97–112. doi: 10.1175/2009JCLI3102.1
Dee, D. P., Uppala, S. M., Simmons, A. J., Berrisford, P., Poli, P., Kobayashi, S., et al. (2011). The ERA-Interim reanalysis: configuration and performance of the data assimilation system. Q. J. R. Meteorol. Soc. 137, 553–597. doi: 10.1002/qj.828
Dickinson, R. E. (1984). “Modeling evapotranspiration for three-dimensional global climate models,” in Climate Processes and Climate Sensitivity, eds J. E. Hansen and T. Takahashi (Washington, DC: American Geophysical Union), 58–72.
Doms, G., and Baldauf, M. (2015). A Description of the Non-Hydrostatic Regional COSMO-Model, Part I: Dynamics and Numerics. Offenbach, Germany: DWD.
Doms, G., Förstner, J., Heise, E., Herzog, H.-J., Mironov, D., Raschendorfer, M., et al. (2011). A Description of the Non-Hydrostatic Regional COSMO-Model, Part II: Physical Parameterization. Offenbach. Germany: DWD.
Douville, H., and Royer, J. F. (1997). Influence of the temperate and boreal forests on the Northern Hemisphere climate in the Meteo-France climate model. Clim. Dyn. 13, 57–74. doi: 10.1007/s003820050153
Duveiller, G., Hooker, J., and Cescatti, A. (2018). The mark of vegetation change on Earth's surface energy balance. Nat. Commun. 9:679. doi: 10.1038/s41467-017-02810-8
Kotlarski, S., Keuler, K., Christensen, O. B., Colette, A., Déqu,é, M., and Gobiet, A. (2014). Regional climate modeling on European scales: a joint standard evaluation of the EURO-CORDEX RCM ensemble. Geosci. Model Dev. 7, 1297–1333. doi: 10.5194/gmd-7-1297-2014
Lawrence, P. J., and Chase, T. N. (2007). Representing a new MODIS consistent land surface in the Community Land Model (CLM 3.0). J. Geophys. Res. 112:G01023. doi: 10.1029/2006JG000168
Lee, X., Goulden, M. L., Hollinger, D. Y., Barr, A., Black, T. A., Bohrer, G., et al. (2011). Observed increase in local cooling effect of deforestation at higher latitudes. Nature 479, 384–387. doi: 10.1038/nature10588
Li, Y., de Noblet-Decoudré, N., Davin, E. L., Motesharrei, S., Zeng, N., Li, S., et al. (2016a). The role of spatial scale and background climate in the latitudinal temperature response to deforestation. Earth Syst. Dynam. 7, 167–181. doi: 10.5194/esd-7-167-2016
Li, Y., Zhao, M., Mildrexler, D. J., Motesharrei, S., Mu, Q., Kalnay, E., et al. (2016b). Potential and actual impacts of deforestation and afforestation on land surface temperature. J. Geophys. Res. Atmos. 121, 14372–14386. doi: 10.1002/2016JD024969
Li, Y., Zhao, M., Motesharrei, S., Mu, Q., Kalnay, E., and Li, S. (2015). Local cooling and warming effects of forests based on satellite observations. Nat. Commun. 6:6603. doi: 10.1038/ncomms7603
Perugini, L., Caporaso, L., Marconi, S., Cescatti, A., Quesada, B., de Noblet-Ducoudré, N., et al. (2017). Biophysical effects on temperature and precipitation due to land cover change. Environ. Res. Lett. 12:053002. doi: 10.1088/1748-9326/aa6b3f
Pielke, Sr A., Pitman, A., Niyogi, D., Mahmood, R., McAlpine, C., Hossain, F., et al. (2011). R Land use/land cover changes and climate: modeling analysis and observational evidence. WIREs Clim. Change 2, 828–850. doi: 10.1002/wcc.144
Pitman, A. J., de Noblet- Decoudré, N., Cruz, F. T., Davin, E. L., Bonan, G. B., Brovkin, V., et al. (2009). Uncertainties in climate response to past land cover change: First results from the LUCID intercomparison study. Geophys. Res. Lett. 36:L14814. doi: 10.1029/2009GL039076
Popp, A., Calvin, K., Fujimori, S., Havlik, P., Humpenöder, F., Stehfest, E., et al. (2017). Land-use futures in the shared socio-economic pathways. Glob. Environ. Change 42, 331–345. doi: 10.1016/j.gloenvcha.2016.10.002
Ritter, B., and Geleyn, J. F. (1992). A comprehensive radiation scheme for numerical weather prediction models with potential applications in climate simulations. Mon. Weather Rev. 120, 303–325. doi: 10.1175/1520-0493(1992)120<0303:ACRSFN>2.0.CO;2
Rockel, B., Will, A., and Hense, A. (2008). The regional climate model COSMO-CLM (CCLM). Meteorolog. Z. 17, 347–348. doi: 10.1127/0941-2948/2008/0309
Schrodin, R., and Heise, E. (2002). The Multi-Layer Version of the DWD Soil Model TERRA-LM, COSMO Tech. Rep. 2. Offenbach: Deutscher Wetterdienst.
Snyder, P. K., Foley, J. A., Hitchman, M. H., and Delire, C. (2004). Analyzing the effects of complete tropical forest removal on the regional climate using a detailed three-dimensional energy budget: an application to Africa. J. Geophys. Res. 109:D21102 doi: 10.1029/2003JD004462
Steppeler, J., Doms, G., Schättler, U., Bitzer, H. W., Gassmann, A., Damrath, U., et al. (2003). Meso-gamma scale forecasts using the non-hydrostatic model LM. Meteorol. Atmos. Phys. 82, 75–96. doi: 10.1007/s00703-001-0592-9
Swann, A. L. S., Fung, I. Y., and Chiang, J. C. H. (2012). Mid-latitude afforestation shifts general circulation and tropical precipitation. PNAS 109, 712–716. doi: 10.1073/pnas.1116706108
Tang, B., Zhao, X., and Zhao, W. (2018). Local effects of forests on temperatures across Europe. MDPI Remote Sens. 10:529. doi: 10.3390/rs10040529
Tiedtke, M. (1989). A comprehensive mass flux scheme for cumulus parameterization in large-scale models. Mon. Weather Rev. 117, 1779–1800. doi: 10.1175/1520-0493(1989)117<1779:ACMFSF>2.0.CO;2
Tölle, M. H., Engler, S., and Panitz, H.-J. (2017). Impact of abrupt land cover changes by tropical deforestation on South-East Asian climate and agriculture. J. Clim. 30, 2587–2600. doi: 10.1175/JCLI-D-16-0131.1
Tölle, M. H., Gutjahr, O., Thiele, T., and Busch, G. (2014). Increasing bioenergy production on arable land: does the regional and local climate respond? Germany as a case study. J. Geophys. Res. Atmos. 119, 2711–2724. doi: 10.1002/2013JD020877
Keywords: land cover change, biophysical effect, albedo parameterization, evapotranspiration, regional climate model, climate, de-/afforestation, surface energy balance
Citation: Tölle MH, Breil M, Radtke K and Panitz H-J (2018) Sensitivity of European Temperature to Albedo Parameterization in the Regional Climate Model COSMO-CLM Linked to Extreme Land Use Changes. Front. Environ. Sci. 6:123. doi: 10.3389/fenvs.2018.00123
Received: 09 July 2018; Accepted: 28 September 2018;
Published: 20 November 2018.
Edited by:
Izuru Takayabu, Meteorological Research Institute (MRI), JapanReviewed by:
Asuka Suzuki-Parker, Rissho University, JapanTomonori Sato, Hokkaido University, Japan
Copyright © 2018 Tölle, Breil, Radtke and Panitz. This is an open-access article distributed under the terms of the Creative Commons Attribution License (CC BY). The use, distribution or reproduction in other forums is permitted, provided the original author(s) and the copyright owner(s) are credited and that the original publication in this journal is cited, in accordance with accepted academic practice. No use, distribution or reproduction is permitted which does not comply with these terms.
*Correspondence: Merja H. Tölle, bWVyamEudG9lbGxlQGdlb2dyLnVuaS1naWVzc2VuLmRl