 Xin Peng1†
 Mary Ann Bruns1,2*
- 1Intercollege Graduate Program in Ecology, Pennsylvania State University, University Park, PA, United States
- 2Department of Ecosystem Science and Management, Pennsylvania State University, University Park, PA, United States
Naturally occurring cyanobacterial growth on soil surfaces with udic moisture regimes has received far less study than biological soil crusts (BSCs) of xeric or aridic biomes. Because they are ephemeral and recurrent on udic soils, we refer to such cyanobacterial biofilms as soil surface consortia (SSCs) to distinguish them from classical BSCs. We assessed the ability of SSCs to fix N2 as well as take up NO3−-N in fertilized soils by testing a cyanobacterial enrichment from a local agricultural field. The metagenome of this consortium, designated DG1, consisted of Cylindrospermum sp. (90%) and genomes of six non-photosynthetic bacteria. We evaluated N2 fixation by DG1 in the presence of inorganic N by measuring biomass uptake of 15N2 during 7-days incubations in a controlled-atmosphere chamber in media containing 0, 62, 124, or 247 mg L−1 NO3−-N. After 7 days, mean 15N atom % excess in DG1 biomass was 0.0143, 0.0029, 0.0037, and 0.0038 at the four NO3−-N concentrations, respectively. Mean 15N atom % excess in dead cell controls was not significantly larger than zero. Mean N2 fixation rates of 101.3, 18.9, 25.6, and 26.6 μg N g−1 dry biomass d−1, respectively, indicated that DG1 continued to fix N2 in the presence of NO3−-N, but at rates 4- to 5-fold lower than in N-free medium. We also assessed the potential for the SSC to retain soil NO3−-N by applying simulated rainfall to soil microcosms inoculated with three levels of DG1 grown for 1, 3, and 7 days at varied NO3−-N concentrations. Overall, inoculation resulted in 50–70% more soil N retained after rainfall (p < 0.001) compared to non-inoculated microcosms. The effect of establishment time was significant (p = 0.043). Since water infiltration rates through microcosms were not significantly affected, we inferred that SSC biomass absorbed and/or immobilized NO3−-N. These results show how SSCs can modulate soil N, either by fixing more N2 under N-limited conditions or by immobilizing inorganic N when concentrations are higher. Thus, naturally occurring or intentionally inoculated SSCs represent potential renewable sources of biologically fixed N and means for soil stabilization and N retention in diverse agricultural systems.
Introduction
Cyanobacteria are recognized as the main N2-fixing organisms in terrestrial cryptogamic covers worldwide, contributing an estimated 49 Tg N2 year−1, or 46% of all biological N2 fixation in natural ecosystems (Elbert et al., 2012). Cyanobacteria have been studied extensively as pioneer colonizers in biological soil crusts (BSCs) of arid and semiarid regions (Belnap and Lange, 2001; Langhans et al., 2009; Strauss et al., 2012) and as N2-fixing symbionts of aquatic plants in rice paddy cultivation (Roger and Ladha, 1992). However, knowledge gaps exist regarding contributions of N and C by naturally occurring cyanobacteria on surfaces of agricultural soils with udic moisture regimes in North America and beyond. With studies reporting up to 28 kg N ha−1 per wheat crop fixed by inoculated cyanobacteria at Rothamsted Experimental Station, Harpenden, U.K. (Witty et al., 1979), cyanobacterial growth in temperate agricultural systems warrants attention because it may be a significant and unaccounted source of reactive N leading to eutrophication (Schindler and Hecky, 2009). On the other hand, surface growth of cyanobacteria in agricultural fields could enhance nutrient supply for crops and help reduce erosion by improving soil cohesiveness (Liqian et al., 2017).
For many years, ephemeral and recurrent cyanobacterial growth has been observed on the surfaces of both tilled and no-till fields of diverse crops in the Northeast United States, particularly after harvest when soils are moister and more exposed to sunlight (Peng, 2016). These cyanobacterial films are often associated with green algae and mosses and are evident even during summers under full crop canopy. To distinguish these ephemeral biofilms from classical BSCs, we propose the term, “soil surface consortia,” or SSCs, for recurrent, cyanobacterially dominated growth on agricultural soils. In a previous study, we evaluated over 100 enrichment cultures from surface soil samples and selected a particularly robust culture, designated DG1 after a 2-year period of alternating transfers in liquid and solid N-free media (Peng and Bruns, 2018).
The present study had two main objectives: to evaluate the potential for DG1 to fix N2 in in the presence of inorganic N and to investigate its retention of soil -N. We hypothesized that N2 fixation by the DG1 consoritum would decrease as environmental -N concentration increased, as has been observed for pure cultures of cyanobacteria as well as natural BSCs (Klubek and Skujinš, 1980; Sprober et al., 2003). Since literature reports of N2 fixation rates by cyanobacteria in agroecosystems vary widely, we aimed to obtain a reasonably accurate estimate of its N contribution in a temperate agroecosystem. Cyanobacterial N fixation estimates in rice production systems, for example, have ranged from 2 to 80 kg N ha−1 with a mean of 27 kg ha−1 (Roger and Ladha, 1992). Such variability is due in part to uncertainties associated with methods for measuring N2 fixation, the most common of which is the acetylene reduction assay (ARA). The ARA method, which is based on the ability of nitrogenase enzymes to convert acetylene (C2H2) to ethylene (C2H4). is inexact, however, because conversion ratios (moles of C2H2 reduced per mole of N2 fixed) range from 3 to 9 in the literature (Montoya et al., 1996). Therefore, we used the stable isotopic 15N2 labeling technique (Montoya et al., 1996; Bei et al., 2013), because it is more sensitive and precise than the ARA method (Witty, 1979; Millineaux et al., 1981; Belnap, 2002).
The second objective of this study was to evaluate the potential for DG1 to mediate another role in soil N cycling, namely uptake of excess inorganic N. To that end, we evaluated short-term growth of DG1 on soils with and without added -N to determine its capacity to retain soil -N. We employed soil microcosms to test the effects of DG1 inoculum size and establishment time on soil -N retention under simulated rainfall. The null hypothesis was that there would be no difference in -N retention with or without inoculation. We also tested for interaction effects between soil -N content, inoculum size, and SSC establishment time.
The metagenome of DG1 was obtained after carrying out experiments to meet the aforementioned objectives. Shotgun sequencing of three independent DG1 cultures showed consistent composition, with 90% of DNA derived from a pangenome of one or more strains of Cylindrospermum sp. and multiple cyanobacterial plasmids (Peng and Bruns, 2018). The remainder of the metagenome comprised four nearly complete bacterial genomes identified as Sphingopyxis alaskensis, Ensifer adhaerens, Reyranella massiliensis, Stenotrophomonas maltophilia and two partial genomes tentatively assigned to Bosea vestrisii and a member of Cytophagales. Because three non-photosynthetic genomes contained nif genes, N2 fixation evaluated in this study could not be attributed exclusively to cyanobacteria. We thus evaluated an SSC comprising both cyanobacteria and non-photosynthetic bacteria for its potential to carry out dual N-cycling functions.
Materials and Methods
Cultivation of DG1 and Biomass Preparation Methods
Prior to these experiments, DG1 was maintained in N-free BG11 medium, prepared as described in Supplementary Materials (Peng and Bruns, 2018). Cultures were grown at 22–23°C with 14–10 h light-dark cycle of illumination (250 Lux) and subcultured monthly by inoculating 1-month-old cells, which were condensed by gravitational settling, to achieve 40–50 mg dry biomass L−1 in fresh medium at each transfer.
For the 15N2 fixation experiment, DG1 was grown in baffled flasks, either with no NaNO3 or with NaNO3 at concentrations of 62, 124, or 247 mg -N L−1. These concentrations were chosen because they reflected the range of inorganic N concentrations (1–413 mg kg−1 soil, mean of 90 mg kg−1) which had been measured in the upper 1-cm of agricultural soils from which SSCs were isolated (Peng, 2016). After 25 days biomass concentrated to achieve cell suspensions with approximate dry biomass densities of 2.5 mg L−1, with a subsample used for gravimetric biomass quantitation (Supplementary Materials). Suspensions (10 mL) were pipetted into 5-cm petri dishes and place in the controlled-atmosphere chamber (described below). Petri plate edges were wrapped uniformly with parafilm to retain moisture during incubation.
For the soil N retention experiment, DG1 was grown in photoreactors (described in Supplementary Materials) containing modified BG-11 medium with one of four -N concentrations (0, 62, 124, and 247 mg L−1). After 14 days, biomass from each reactor was condensed and pooled to obtain at least 200 mL concentrated DG1 cell suspension for each experimental block. Half of the suspension was used for growth measurements after inoculation of soil microcosms, which also served as no-rainfall positive controls. The other half was used in treatments for simulated rainfall tests. For each batch of pooled biomass, four subsamples were dried for gravimetric quantitation of biomass prior to soil inoculation (Supplementary Materials).
15N2 Fixation Experiment
An illuminated, controlled-atmosphere chamber was used for 15N2 isotope labeling based on Holst's method (Holst et al., 2009). The chamber was constructed from a glass desiccator (Figure 1 and Supplementary Materials). A complete randomized experiment was designed with four replicates of DG1 suspensions grown in baffled flasks in medium containing the four -N concentrations To check for the potential of 15N2 gas adsorption to biomass surfaces (De Jonge and Mittelmeijer-Hazeleger, 1996), four replicates of dead cell controls were also placed in the growth chamber for 15N2 labeling. Dead cell controls were prepared by heating the fresh DG1 enrichment at 95°C for an hour. Non-exposure controls of DG1 enrichments (four replicates x four medium N concentrations) were prepared for a separate 7-days incubation without 15N2 under identical experimental conditions.
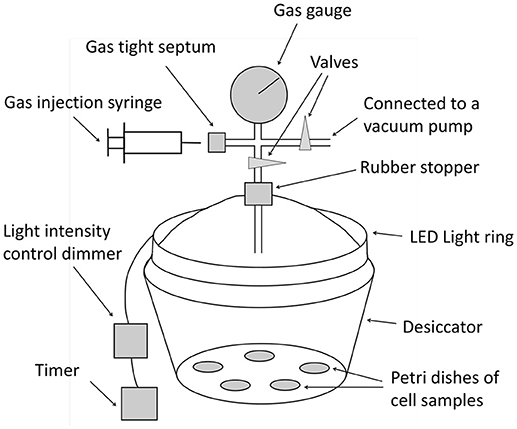
Figure 1. Diagram of the growth chamber used for 15N2 labeling.
All treatment microcosms and dead cell controls were placed randomly in the growth chamber without overlap to include 16 petri dishes containing liquid suspensions of DG1 enrichment cultures and four petri dishes of dead cell controls. A total volume of 300 mL 15N2 gas (chemical purity >99.9%, isotopic enrichment >98%, Cambridge Isotope Laboratories, Inc.) was injected into the growth chamber, which elevated the headspace atom %15N to 1.77%. The DG1 cell suspensions in petri dishes were incubated for 7 days with 14–10 h light-dark cycles (250 Lux). Every other day, a 60-mL sample of headspace air was withdrawn from the test chamber and analyzed with an oxygen analyzer (Quantek Model 901). If the O2% declined in the growth chamber, additional O2 gas (99.8% purity, Medipure) was injected so that the headspace O2 concentration remained at atmospheric level.
Suspensions from each petri dish were quantitatively transferred to centrifuge tubes after the incubation. The biomass in each tube was first concentrated by centrifuging at 6,000 g for 5 min. After the removal of supernatant liquid, the condensed DG1 biomass (volume < 2 mL) was resuspended in 10 mL distilled water and centrifuged (6,000 g, 5 min, and supernatant liquid removed) four times to remove dissolved -N from the samples. This washing procedure was confirmed to have no observable effect on cell integrity by microscopic examination. Condensed and washed biomass samples were transferred to 5-mL polystyrene grinding vials for drying in the dark at 60°C for 7 days. Finally, the dry biomass samples were ground with polystyrene grinding balls (one ball in each vial) for 3 min using a SPEX Sample Prep 8000D Mixer/Mill.
Isotopic Analysis and Calculations
The δ15N, weight %N, and weight %C of all dried and ground DG1 biomass samples were analyzed by elemental analysis-isotope ratio mass spectrometry (EA-IRMS) at the Penn State Laboratory for Isotopes and Metals in the Environment (LIME). Calculations for determining 15N atom % excess, biomass-based N2 fixation rate, and amount of N2-N fixed in each petri dish are presented in Supplementary Materials.
Soil N Retention Experiment
Retention of -N by DG1 was assessed using soil microcosms prepared in 5-cm petri dishes and inoculated as described in Figure S3. Concentrated suspensions were evenly applied onto soil surfaces to achieve initial inoculum densities of 0.88, 1.75, and 3.51 g dry biomass m−2 in soil microcosms. Parafilm-wrapped petri dishes were incubated at 22–23°C under continuous fluorescent illumination (“natural light”) with an average light intensity of 250 Lux.
A randomized complete block design was used to test the effects on DG1 growth (chlorophyll an increase) of -N concentration in growth medium and of inoculum amount. Each of three replicated blocks consisted of all combinations of the following two factors with three levels per factor. Factor one was the biomass amount added to soil surfaces (1, 2, or 4 mL of condensed DG1), while factor two was the culture medium N concentration in microcosms (0, 62, or 124 mg L−1). Combinations of the two factors were randomly applied to soil microcosms in each block.
A total of 27 soil microcosms were set up in every block using half of the concentrated DG1 suspensions, which contained three replicate microcosms for every factor level combination comprising three biomass amounts by three medium N concentrations. After inoculating DG1 onto soils on Day 1, one replicate microcosm was randomly selected for sacrificial harvesting on day 2, Day 4, and Day 8 (corresponding to 1, 3, and 7 days of soil contact time).
Chlorophyll Analysis and Growth Evaluation
Chlorophylls in surface soil samples from each microcosm were extracted using the method of Nayak et al. (2004). Growth of DG1 during incubation from day 2 to day 8 was determined from the percentage increase in chlorophyll a content (% Chl an increase) and adjusted by subtracting absorbances of negative controls, as described in Supplementary Materials.
Rainfall Simulator and Experimental Design
We used a portable rainfall simulator which met standard design specifications (Humphry et al., 2002; Kibet et al., 2014). This simulator was designed to deliver a uniform rainfall volume over a 1-m2 area at a distance of 3 m below the rain-producing nozzle. The simulator was calibrated as described in Supplementary Materials and adjusted to deliver an average rainfall rate of 3.3 cm h−1 over 30 min, representative of a typical natural precipitation event in central Pennsylvania. For rainfall trials, soil microcosms were randomly distributed among flow-collection units arranged in a grid below the simulator, each being fixed onto the top of a flow-collection cylinder (Figure 2). Immediately prior to rainfall application, tape was removed from petri dish bottoms and lids were taken away to expose the surface.
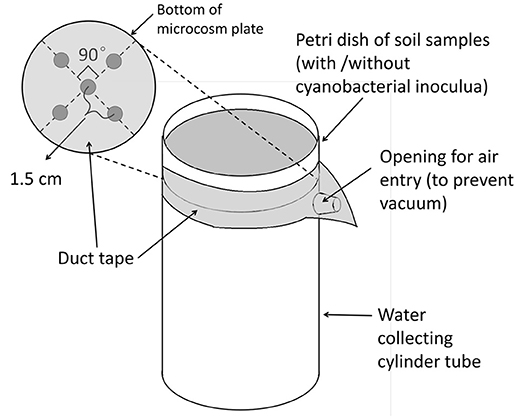
Figure 2. Diagram of a sample collection device for the simulated rainfall treatment.
Experimental Design to Test Retention of Biomass and Soil N (After Rainfall Treatment)
Three factors, each of which had three levels, were studied for their effect on biomass recovery and N retention after application of the DG1 enrichment to soils under simulated rainfall: establishment time after inoculation (1, 3, and 7 day); biomass amount inoculated on the soil surface (1, 2, and 4 mL of 1.7 mg dry biomass mL−1 cell condensates); and medium N concentration in soil microcosms (0, 62, and 124 mg L−1 NO3-N). We designed a split plot experiment containing three replicated blocks, using establishment time as the whole plot factor that divided each block into three subplots. All combinations of biomass amount and medium N content (three by three) were completely randomly arranged in each subplot (array of microcosms receiving simulated rainfall). Here we used previously described microcosms for monitoring cyanobacterial growth as no-rainfall positive controls. In each block, triplicates of negative controls (microcosms with no inoculum) were also prepared with media having 0, 62, and 124 mg L−1 -N, which were incubated and sampled in the same manner as inoculated microcosms. Therefore, each block in the rainfall simulation experiment contained a total of 81 soil microcosms: three sets of nine microcosms (27 microcosms comprising two factors at three levels) for each establishment time (1, 3, and 7 days); 27 negative (non-inoculated) controls; and 27 positive (no-rainfall) controls.
Rainfall simulations were carried out three times in each block, with the three sub-plots comprising the three different SSC establishment times. Besides the no-rainfall positive controls, sub-plot samples were selected randomly from one of the three microcosms (with the same biomass amount and medium N concentration) in each treatment, as well as three of the nine microcosms with the same medium N concentration in each set of negative controls without biomass. Therefore, nine treatments and nine negative control microcosms were subjected to simulated rainfall under each event. The soil microcosms were allowed to stand for 1–2 h following rainfall application until no free water above the soil surface could be observed and until no water drops formed at the bottom drainage holes within 20 s. Surface soil samples (0–3 mm) in treatment microcosms were collected and analyzed for chlorophyll a contents (Supplementary Materials). Water that had flowed through the microcosms into collecting cylinders was transferred to sterile 50-mL centrifuge tubes for volumetric measurements. Nitrate- N concentrations for each liquid sample were analyzed by the Agricultural Analytical Services Laboratory at the Pennsylvania State University.
Calculations
Three properties of each DG1 treatment were evaluated after rainfall events: the adjusted infiltrated water volume, DG1 biomass recovered on the soil surface, and N retained in soil microcosms. First, in order to minimize systematic bias, volume readings of infiltrated water were standardized between different blocks using the following equation:
where adVij and Vij are the adjusted and original infiltrated water volume of sample j in block i, while and are the average water volumes of non-inoculated negative controls in block i and in all blocks. Then, the percent biomass recovered of the DG1 enrichment (Biomass %) was estimated at:
where (Chl a) and (Chl a)no rain are the chlorophyll a contents in the treatment soil samples and its corresponding positive controls.
Finally, -N leached (mg N microcosm−1) was estimated by multiplying the infiltrated water volume by its -N concentration, assuming that the infiltrated water contained all leached soil -N. For each rainfall treatment sub-plot, a background -N content in soil was calculated as the average N leached from negative controls containing N-free medium. N retained in soil microcosms (Nretained) was estimated as:
while the percent N retained in microcosms (N%) was calculated as:
where Nleached, Nmedium, and Nbackground are -N contents in the infiltrated water, the culture medium, and the soil background. Based on the combined medium and soil volumes, the NO3-N contents in the microcosms with medium N concentrations at 62 and 124 mg L−1 N were 0.37 and 0.74 mg N microcosm−1, respectively.
Data Analysis
All data were analyzed by SPSS 16.0 (Norusis, 2008) and shown as mean ± standard error. For the 15N2 labeling experiment, data were analyzed by one-way ANOVA and Tukey's multiple comparisons (p < 0.05), while the 15N atom % excess of the dead cell controls were analyzed by a one-tailed t-test (H0: μ = 0, right tailed). For the soil N retention experiment, general linear models (GLM) were used to analyze results, in which replicate was a random factor and other factors were fixed. The models were simplified by pooling some non-significant interaction effects as error terms, including the two-way interactions of replicate × biomass amount and replicate × medium N concentration, as well as all three- and four-way interactions. ANOVA analysis and Tukey's multiple comparisons (p < 0.05) were applied to these GLM models. For both objectives, the natural log data transformation was performed on response data in the ANOVA analysis if their residuals did not follow a normal distribution.
Results
N2 Fixation by DG1
All DG1 suspensions, except for dead cell controls, remained active during incubation in the growth chamber, as demonstrated by continuous O2 consumption and formation of cohesive biofilms in petri dish containers (Figure 3). The typical appearance of biofilms suggested the presence of extracellular polymeric substances. No differences were observed in biofilm thickness at the four -N concentrations (0, 62, 124, or 247 mg L−1) after being cultured in the respective media for 25 days and subsequently incubated in the chamber.
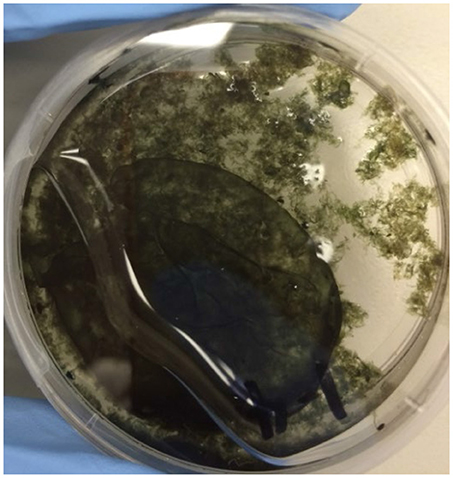
Figure 3. Photo of a typical biofilm formed by the DG1 enrichment after incubation for 7 days in the growth chamber. The petri dish was placed at an angle for photographing to show how the cohesive biofilm moved toward the lower left with the liquid medium.
Enriched 15N was found in all biomass samples, indicating that DG1 was actively fixing N2 from the headspace atmosphere. Fixation of N2 by DG1 was significantly higher in N-free medium (p < 0.0001) than at any of the three -N concentrations (Table 1). The mean 15N atom % excess of biomass grown in N-free medium was 0.0143%, which was 4.9, 3.9 and 3.8 times higher than the means for DG1 at 62, 124, and 247 mg L−1 -N, respectively. The mean N2 fixation rate of DG1 in N-free medium was 101.3 μg N g−1 dry biomass day−1, which was correspondingly 5.4, 4.0, and 3.81 times greater, respectively, than rates in the presence of increasingly higher N. In addition to the large difference in overall means for N2 fixation by DG1 in N-free and N-supplemented media, N2 fixation by DG1 in medium with 247 mg L−1 -N (26.6 μg N g−1 dry biomass day−1) was significantly higher than N2 fixation at 62 mg L−1 -N (18.9 μg N g−1 dry biomass day−1) (Table 1). Finally, possible association of 15N-label with biomass during incubation was assessed by measuring the 15N atom % excess of dead cell controls. Because this value was not larger than zero (p = 0.995), we concluded there was no significant association of 15N cellular material.
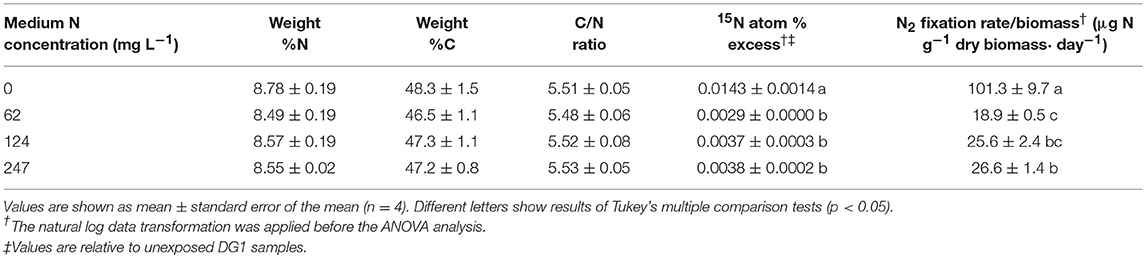
Table 1. N2 fixation by DG1, which was grown in liquid media containing varied -N concentrations and incubated for 7 days in the 15N2 labeled chamber.
Soil -N Retention Under Simulated Rainfall
Cyanobacterial Growth in Soil Microcosms
DG1 biomass increased during 7 days' incubation in soil microcosms at all inoculum amounts and N concentrations, as measured by chlorophyll a contents (Figure 4A). Inoculum size had a significant effect on growth (p = 0.013, Table 2). The smallest inoculum size (1 ml) yielded the largest percentage increase in chlorophyll a from day 2 to 8 (61.3 ± 8.6%), while larger inoculum sizes (2 and 4 ml) resulted in smaller increases of (46.1 ± 0.04%) and (30.0 ± 9.1%), respectively. The percentage increase in chlorophyll a observed with 1-mL inoculum was significantly greater than for the 4-mL inoculum, but not for the 2-mL inoculum (Figure 4A).
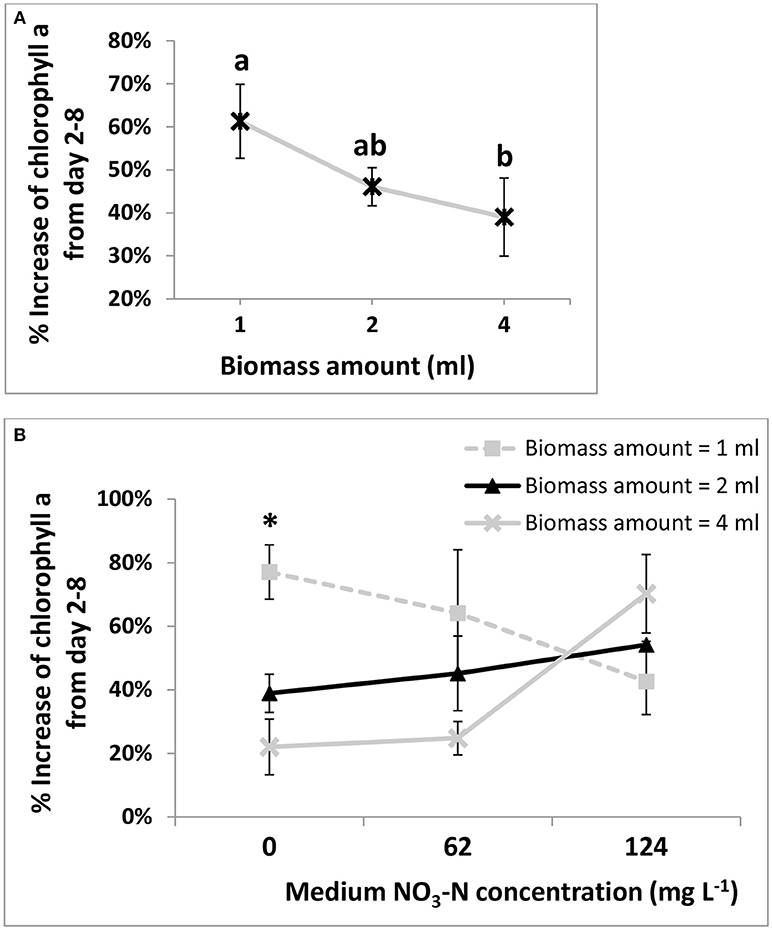
Figure 4. Main effect plot (A) and interaction plot (B) for percent increase of chlorophyll a in soil microcosms from day 2 to 8 under different biomass amounts of the DG1 enrichment inoculum. In both plots, three DG1 inoculum sizes (1, 2, and 4 ml) corresponded to initial biomass densities of 0.88, 1.75, and 3.51 g dry biomass m−2 on soil surfaces, respectively. Error bars are standard errors of the means. In main effect plot (A), different letters show results of Tukey's multiple comparison tests (after the natural log data transformation, p < 0.05). In interaction plot (B), the two interacting variables are biomass inoculum amount and medium -N concentration in soil microcosms. The “*” shows a significant difference within the column based on the Tukey's multiple comparison tests (after the natural log data transformation, p < 0.05).
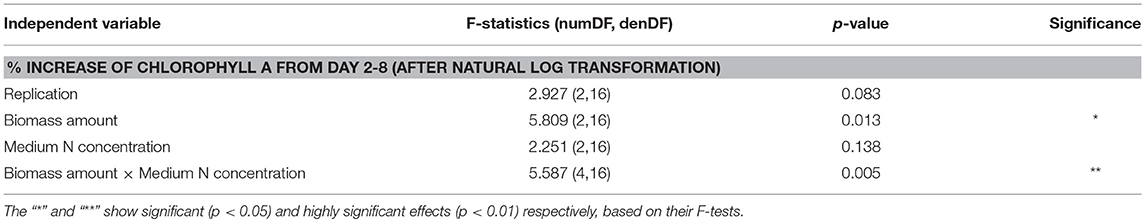
Table 2. ANOVA analysis for % increase of chlorophyll a in soil microcosms from day 2 to 8 after the natural log data transformation.
The -N concentration of the medium in soil microcosms before incubation had no significant effect on growth of DG1 (Table 3). However, a highly significant interaction was observed between -N concentration and inoculum size (p = 0.005). At the -N concentration of zero, the average percentage increase in chlorophyll a from days 2 to 8 was highest in microcosms inoculated with 1-mL DG1 (77.1 ± 0.1%), followed by values observed for 2-mL and 4-mL inocula (38.9 ± 6.0%) and (22.0 ± 8.7%), respectively (Figure 4B). Such differences were less pronounced and even reversed, however, at 62 and 124 mg L−1 -N. For soil microcosms receiving 4-mLinocula, the percentage increase in chlorophyll a was greater as -N concentration increased from 62 to 127 mg L−1. Such significant differences were not observed as the medium N concentration changed for either the 1- or 2-mL inoculum levels.
Table 3. ANOVA analyses for the observations of different responses after the simulated rain: (A) unified infiltrated water volume, (B) % biomass recovered of the DG1 enrichment on the soil surface, and (C) N retained in soil microcosms.
Effect of Cyanobacterial Inoculum on Soil Water Infiltration Under Simulated Rainfall
The volume of infiltrated water was highly variable among different samples after application of simulated rainfall. No significant effect or interaction effect was detected on the infiltrated water volume, indicating that the application of DG1 on soil surface did not influence soil water infiltration under different inoculum sizes or establishment times. After being standardized by the non-inoculated negative controls, the average infiltrated water of the 162 samples was 18.9 ± 0.5 ml, which was about 58% of the total precipitation.
Stability of Cyanobacterial BSCs Under Simulated Rainfall
DG1 biomass remaining in soil microcosms following simulated rainfall was measured from the chlorophyll a content. The establishment time of cyanobacteria had a highly significant effect (p = 0.001) on biomass recovery after simulated rain (Table 3B). The average percent recoveries of biomass were slightly but significantly higher after the 1-day (86.8 ± 2.9%) and 7-day (87.7 ± 2.7%) establishment times than at the 3-day establishment time (76.5 ± 2.4%) (Figure 5). Lower recovery after the 3-day establishment time could have been due to variability in cell acclimation and cohesion to soil particles during the establishment period. In some cases, the biomass percentages recovered from the microcosms were >100%, which could be due to experimental error or a rapid growth response of DG1 upon exposure to air for the rainfall application (Figure 5).
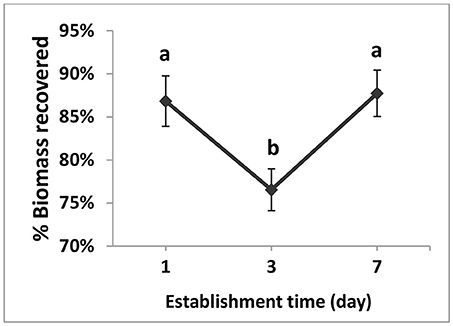
Figure 5. Main effect plot for percent biomass recovered of the DG1 enrichment on soil surface after different establishment times followed by rainfall. Error bars are standard error of the mean. Different letters show the result of Tukey's multiple comparison tests (p < 0.05).
Contribution of DG1 to Soil N Retention
The effect of the presence of DG1 biomass in reducing soil N loss was evaluated based on the amount of -N retained in soil after the simulated rain. The -N in the water from the rainfall simulation nozzle was not detectable (test detection limit of -N was 0.5 mg L−1). The background soil -N contents in microcosms varied from 0.01 to 0.08 mg N microcosm−1, with an average at 0.06 ± 0.01 mg -N microcosm−1. All soil microcosms, with or without the cyanobacterial inoculum, retained a fraction of N when the medium -N concentration was 62 or 124 mg L−1, corresponding to 0.37 or 0.74 mg -N microcosm−1 (Figure 6A).
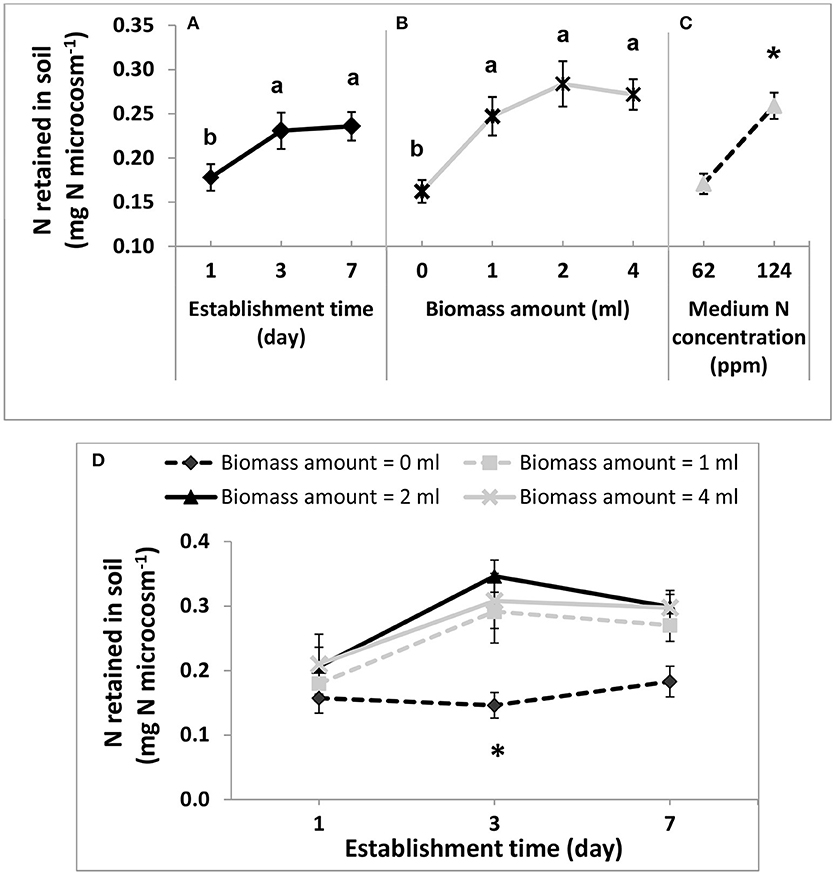
Figure 6. Main effect plots (A–C) and interaction plot (D) for -N retained in soil microcosms after rainfall treatment. In main effect plots, variables include: (A) the establishment time, (B) biomass amounts of DG1 inoculum, and (C) medium -N concentration in soil microcosms. The three DG1 inoculum sizes applied to soil microcosms (1, 2, and 4 ml) corresponded to initial biomass densities of 0.88, 1.75, and 3.51 g dry biomass m−2 on soil surfaces, respectively. In interaction plot (D), the two interacting variables are biomass amount of the DG1 enrichment inoculum and their establishment time. Error bars are standard error of the mean. Different letters or “*” show the result of Tukey's multiple comparison tests (p < 0.05).
All variables, except for replication, had significant or highly significant effects on soil N retention after the simulated rain, including the establishment time (p = 0.043), biomass amounts of DG1 inoculum (p < 0.001) and medium N concentration in soil microcosms (p < 0.001; Table 3C). First, N retained after rainfall by soil microcosms having 1-day establishment time (0.18 ± 0.02 mg N microcosm−1) was significantly lower than N retained by microcosms after 3-day (0.23 ± 0.02 mg N microcosm−1) and 7-day (0.24 ± 0.03 mg N microcosm−1) establishment times (Table 3A). No significant difference in N retention was observed between microcosms after 3- and 7-day establishment times. Second, compared to the non-inoculated negative controls (0.16 ± 0.01 mg N microcosm−1), the average N retained in inoculated microcosms increased by 52 to 76% (Table 3B). With respect to inoculum size, mean N contents retained in soil microcosms were not significantly different. For 1, 2, and 4 mL inocula, N contents were 0.25 ± 0.02, 0.28 ± 0.03, and 0.27 ± 0.02 mg N microcosm−1, respectively. Finally, after the rainfall treatment, inoculated soil microcosms prepared with 124 mg L−1 -N contained significantly higher amounts of soil N (0.26 ± 0.01 mg N microcosm−1), compared to the microcosms prepared with 62 mg L−1 -N (0.17 ± 0.01 mg N microcosm−1) (Table 3C).
The percent and the amount of N retained in soil microcosms had similar trends in the main effect plots of establishment time and biomass amount, as well as in their interaction plots (Figures 6A,B,D). However, because the amount of N retained in soil microcosms only increased 51.5 % as medium N concentration doubled, the percent N retained in microcosms with 124 mg L−1 -N (32.7 ± 1.9%) was actually significantly lower than results from microcosms with 62 mg L−1 -N (40.2 ± 2.7%) (Figure 6C).
In addition to the main factor effects, a significant interaction effect was detected between inoculum size and establishment time (p = 0.04996, Table 3C). Soil microcosms inoculated with 1, 2, or 4 mL all retained significantly more -N after 3-day establishment time (Figure 6). After being treated with rainfall, -N retained in soil microcosms was 99–137% greater in inoculated microcosms than in non-inoculated negative controls (0.15 ± 0.02 mg -N microcosm−1) after being cultivated on soil surface for 3 days. A similar trend was observed in soil microcosms after the 7-day establishment time, where -N contents were 48–63% greater than in non-inoculated controls, although these differences were not statistically significant. Soil microcosms after only 1-day establishment time before rainfall did not show such differences.
Discussion
The N2 fixation rates by the DG1 enrichment in our study were comparable to rates reported for cyanobacterial biomass in previous 15N labeling studies performed under moist conditions. Cyanobacteria, particularly heterocytous species, have long been known to have close associations with other bacteria in freshwater and marine systems (Paerl, 1977). The presence of associated bacteria also has been reported to promote growth and N2-fixation by Anabaena spp. (Lupton and Marshall, 1981).
The mean N2 fixation rate of DG1 in N-free medium, expressed as 4.22 mg N kg−1 dry biomass h−1, was similar to a rate of 6.05 mg N kg−1 dry biomass h−1 reported for naturally occurring cyanobacterial BSCs (Holst et al., 2009). Assuming a typical growing season of 160 days for cyanobacteria in agriculture field (Peng, 2016), DG1 was estimated to fix 0.36–2.2 kg N ha−1 crop−1, which was considerably lower than values reported in previous field studies. DG1 biomass was incubated in liquid medium during exposure to 15N2.. Because such aqueous conditions could have constrained gas exchange in this experiment, DG1 may have exhibited greater N2 fixation rates if it had been growing on soil surfaces.
In another study using 70-day pot incubation of rice paddy soil containing 1.5 g N kg−1, an estimated 0.0235 μg N cm−2 soil surface day−1 was fixed by indigenous cyanobacteria applied to soil in unplanted pots (Bei et al., 2013). In our experiment, the N2 fixation rate of DG1 ranged from 0.0225 to 0.0347 μg N cm−2 day−1 when -N present was in the medium. When the N2 fixation rate was determined on the basis of cell C, the rate showed a decrease from 209.6 μg N mg−1 C day−1 (at 0 mg L−1 N) to 40.6 μg N mg−1 C day−1 (at 62 mg -N L−1). A similar decrease in N2 fixation rate from 110 to 25 μg N mg−1 C day−1 was observed by Spröber et al. with the cyanobacterium Cylindrospermopsis raciborskii when they replaced N-free liquid culture medium with one containing 0.3 mg L−1 -N in a continuous culture reactor (Sprober et al., 2003).
Spröber and coworkers also found that N2 fixation of C. raciborskii ceased at ammonium-N concentrations above 0.3 mg L−1 (testing up to 3 mg L−1 ammonium-N). In our experiment, DG1 was pre-cultured in N-containing media for 25 days, so that the lower 15N atom % excess observed in N-grown biomass could not have been due to cessation of N2 fixation upon addition of mineral N. Therefore, we concluded that DG1 continued to fix atmospheric N2, but at lower rates in the presence of available inorganic N. In both studies, there was no relationship between medium N concentration and cyanobacterial N2 fixation. Instead, availability of mineral N appeared to function as a switch to either decrease or stop N2 fixation. The present study demonstrates that DG1 application in the field could result in its fixing N2 under varied environmental N conditions.
In the present study, growth rates of the DG1 enrichment did not differ in soil microcosms amended with NaNO3 at concentrations of 0, 62, and 124 mg L−1, even though more -N was retained in the soil as the medium N concentration increased (Table 3). Similar growth responses of DG1 in the presence or absence of soil mineral N suggest that DG1 was able to use N from de novo biological N2 fixation as readily as soil inorganic N in satisfying N requirements of growth. In addition, physical immobilization of the DG1 enrichment on soil particles could potentially limit access by DG1 to all soil N despite high overall N concentrations. Such growth constraints of immobilized cyanobacteria have been shown previously in waste water treatment systems using the non-N2-fixer Synechococcus elongatus (Aguilar-May and del Pilar Sánchez-Saavedra, 2009).
We evaluated SSC formation by DG1 after relatively short periods of 1, 3, and 7 days, because these are realistic intervals in udic moisture regimes where rainfall may occur soon after intentional field application of SSC inocula. Three days after inoculation, DG1 showed significant increases in biomass and N retention, and stable BSCs were observed after 1 week. While it is possible that longer periods of SSC development would result in different patterns of water infiltration, biomass increase, and N retention, extended observation periods were beyond the scope of this study. Later stages of SSC development in many agricultural fields, for example, are characterized by abundant growth of green algae and mosses that can alter soil properties further.
To our knowledge, retention of mineral N by cyanobacteria on agricultural soils has not been reported previously. To date, the most comparable research studies have investigated the use of cyanobacteria for N uptake from wastewaters. For example, the non-N2-fixer Synechococcus elongatus removed a total of 7.7–12.9 mg N L−1 after being cultivated in wastewater containing 5.2 mg L−1 -N and 17.9 mg L−1 ammonium-N (Aguilar-May and del Pilar Sánchez-Saavedra, 2009). Applying this concept to our soil microcosms after 1 week of DG1 growth, we calculated average retentions of 16.8 ± 2.5 and 21.6 ± 3.3 mg -N L−1, respectively, in media with 62 and 124 mg L−1 -N, based on total microcosm volumes of 15 mL of soil and water. Accordingly, the average -N retention during the first 3 days of DG1 growth could be expressed as 0.017 ± 0.004 and 0.025 ± 0.006 mM h−1 at medium concentrations of 62 and 124 mg L−1 -N. This result was consistent with the -N uptake rate of 0.02−0.05 mM h−1 by Synechococcus sp. strain PCC 7942 during the first 2 days of ground water treatment (Hu et al., 2000). In that study, -N removal by cyanobacteria increased significantly as the -N concentration increased from 4.5 to 33.0 mg L−1, which is similar to what we observed when increasing -N in growth medium from 62 to 124 mg L−1.
In the present study, the 1-mL inoculum corresponded to a field application rate of 0.88 g dry biomass m−2. Because the 1-mL inoculum performed as well or better than the 2- or 4-mL inocula, this application rate would be more economical and effective for future field applications (Table 4). The lowest application rate in our study was considerably lower than rates used in other studies of N2 -fixing cyanobacterial soil amendments (Nostoc and Anabeana spp.). Assuming a typical cell water content of 80% (Bratbak and Dundas, 1984), reported rates have varied from 10 g fresh biomass per pot (equivalent to 113 g dry biomass m−2) for greenhouse wheat cultivation (Gheda and Ahmed, 2015) to 6 g dry biomass m−2 for corn under field conditions (Maqubela et al., 2009). On the other hand, it has been reported that cyanobacteria (mixture of Nostoc and Anabaena spp.) compensated for 50% urea-N upon use of a small application rate at 6 mg dry biomass m−2 in rice paddy systems (Pereira et al., 2009), indicating the potential feasibility of using lower application rates.
Table 4. Summarized effects of different independent factors on the distinct responses investigated in our study.
In our previous studies, the densest biomass coverage by the DG1 enrichment on N-limited sandy soil surfaces was estimated at 4.96 g m−2 after 84 day cultivation in microcosms (Peng and Bruns, 2018). We consider this biomass density to be a good estimate of the environmental carrying capacity of DG1 on the sandy soil used in our previous experiments, so that the 1-mL application rate of DG1 would represent about 18% of the observed maximum biomass density on coarse-textured soils. The carrying capacities of DG1 on finer-textured agricultural soils are likely to be higher with additional N and greater soil particle surface areas. The difference between this maximum biomass density and the field application rate based on the 1-mL inoculum suggests good potential for growth and N uptake in agricultural systems.
In considering use of DG1 as a soil amendment, it is important to recognize that some terrestrial cyanobacteria produce cyanotoxins in laboratory cultures (Hrouzek et al., 2011). Although toxin production in the environment has been studied mostly in lakes, eutrophic coastal waters, and artificial water impoundments (Bláha et al., 2009), much less is known about the extent of cyanotoxin production in soils and its implications (Sonkoly et al., 2017). Furthermore, it is not clear how soil inorganic N concentrations might affect cyanotoxin production. We note herein that testing of DG1 biomass grown with and without inorganic N gave negative results for saxitoxin, beta-methylamino-L-alanine (BMAA), anatoxin-a, microcystin, and cylindrospermopsin (unpublished results).
Potential N Input for Agriculture
Intentional application of DG1 and other similar consortia is a means to promote SSC formation on agricultural soils. In addition to fixing atmospheric N2, SSCs can reduce N losses from soil by assimilating and immobilizing inorganic N, thereby making it less prone to leaching and denitrification. The N assimilated by SSCs can be stored for subsequent remineralization, which extends the period during which inorganic N can be taken up by crops. The observed rapid growth of naturally occurring SSCs in the field after spring fertilization (Peng, 2016) also supports their role in assimilating N. Therefore, the persistence of DG1 in SSCs following soil application could serve multiple N functions and account for greater net soil N delivery to crops beyond our study's measurements of 15N2 fixation.
This study evaluated the growth of the robust consortium DG1 on agricultural soil surfaces and its potential contribution to modulating soil mineral N in agroecosystems. DG1 continued to fix N2 over a range of soil mineral N concentrations and retained a significant amount of soil -N. Growth of DG1 on soil was affected by application rate; biomass recovery after simulated rainfall was affected by establishment time; and soil -N retention was affected by application rate, establishment time, and -N concentration. After integrating all results in our studies, we concluded that lower application rates (ca. 0.9 g dry biomass m−2) and establishment periods of about 7 day are good recommendations for future agricultural applications. However, additional research is needed to evaluate N contributions by DG1 under the varied soil and weather conditions occurring at field scales.
Author Contributions
Research experiments conceived and designed by XP, research supervised by MB, manuscript written by XP and MB.
Conflict of Interest Statement
The authors declare that the research was conducted in the absence of any commercial or financial relationships that could be construed as a potential conflict of interest.
Acknowledgments
We thank Dr. Todd Sowers, Director of the Laboratory for Isotopes and Metals in the Environment at Penn State, for his helpful advice on constructing the 15N2 labeling growth chamber. We also thank Mark Signs, Director of Shared Fermentation Facility at the Pennsylvania State University, for his assistance with the establishment of photobioreactors; and Louis S Saporito, United States Department of Agriculture (USDA) Agricultural Research Service, for the guidance on rainfall simulator. This research was funded by the Research Applications for Innovation (RAIN) grant from the College of Agricultural Sciences of the Pennsylvania State University. Salary support for MB was provided by USDA-NIFA Hatch project #1003466.
Supplementary Material
The Supplementary Material for this article can be found online at: https://www.frontiersin.org/articles/10.3389/fenvs.2018.00156/full#supplementary-material
References
Aguilar-May, B., and del Pilar Sánchez-Saavedra, M. (2009). Growth and removal of nitrogen and phosphorus by free-living and chitosan-immobilized cells of the marine cyanobacterium Synechococcus elongatus. J. Appl. Phycol. 21, 353–360. doi: 10.1007/s10811-008-9376-7
Bei, Q., Liu, G., Tang, H., Cadisch, G., Rasche, F., and Xie, Z. (2013). Heterotrophic and phototrophic 15N2 fixation and distribution of fixed 15N in a flooded rice–soil system. Soil Biol. Biochem. 59, 25–31. doi: 10.1016/j.soilbio.2013.01.008
Belnap, J. (2002). Nitrogen fixation in biological soil crusts from southeast Utah, USA. Biol. Fertil. Soils 35, 128–135. doi: 10.1007/s00374-002-0452-x
Belnap, J., and Lange, O. (2001). Biological Soil Crusts: Structure, Function and Management. New York, NY: Springer.
Bláha, L., Babica, P., and Maršálek, B. (2009). Toxins produced in cyanobacterial water blooms-toxicity and risks. Interdiscip. Toxicol. 2, 36–41. doi: 10.2478/v10102-009-0006-2
Bratbak, G., and Dundas, I. (1984). Bacterial dry matter content and biomass estimations. Appl. Environ. Microbiol. 48, 755–757.
De Jonge, H., and Mittelmeijer-Hazeleger, M. C. (1996). Adsorption of CO2 and N2 on soil organic matter: nature of porosity, surface area, and diffusion mechanisms. Environ. Sci. Technol. 30, 408–413. doi: 10.1021/es950043t
Elbert, W., Weber, B., Burrows, S., Steinkamp, J., Budel, B., Andreae, M. O., et al. (2012). Contribution of cryptogamic covers to the global cycles of carbon and nitrogen. Nat. Geosci. 5, 459–462. doi: 10.1038/ngeo1486
Gheda, S. F., and Ahmed, D. A. (2015). Improved soil characteristics and wheat germination as influenced by inoculation of Nostoc kihlmani and Anabaena cylindrica. Rendiconti Lincei 26, 121–131. doi: 10.1007/s12210-014-0351-8
Holst, J., Butterbach-Bahl, K., Liu, C., Zheng, X., Kaiser, A. J., Schnitzler, J.-P., et al. (2009). Dinitrogen fixation by biological soil crusts in an Inner Mongolian steppe. Biol. Fertil. Soils 45, 679–690. doi: 10.1007/s00374-009-0378-7
Hrouzek, P., Tomek, P., Lukešová, A., Urban, J., Voloshko, L., Pushparaj, B., et al. (2011). Cytotoxicity and secondary metabolites production in terrestrial Nostoc strains, originating from different climatic/geographic regions and habitats: Is their cytotoxicity environmentally dependent? Environ. Toxicol. 26, 345–358. doi: 10.1002/tox.20561
Hu, Q., Westerhoff, P., and Vermaas, W. (2000). Removal of nitrate from groundwater by cyanobacteria: quantitative assessment of factors influencing nitrate uptake. Appl. Environ. Microbiol. 66, 133–139. doi: 10.1128/AEM.66.1.133-139.2000
Humphry, J., Daniel, T., Edwards, D., and Sharpley, A. (2002). A portable rainfall simulator for plot–scale runoff studies. Appl. Eng. Agric. 18:199. doi: 10.13031/2013.7789
Kibet, L. C., Saporito, L. S., Allen, A. L., May, E. B., Kleinman, P. J., Hashem, F. M., et al. (2014). A protocol for conducting rainfall simulation to study soil runoff. J. Vis. Exp. 86:e51664. doi: 10.3791/51664
Klubek, B., and Skujinš, J. (1980). Heterotrophic N2-fixation in arid soil crusts. Soil Biol. Biochem. 12, 229–236. doi: 10.1016/0038-0717(80)90066-8
Langhans, T. M., Storm, C., and Schwabe, A. (2009). Community assembly of biological soil crusts of different successional stages in a temperate sand ecosystem, as assessed by direct determination and enrichment techniques. Microb. Ecol. 58, 394–407. doi: 10.1007/s00248-009-9532-x
Liqian, G., Bowker, M. A., Xu, M., Sun, H., Tuo, D., and Zhao, Y. (2017). Biological soil crusts decrease erodibility by modifying inherent soil properties on the Loess Plateau, China. Soil Biol. Biochem. 105:49–58. doi: 10.1016/j.soilbio.2016.11.009
Lupton, F. S., and Marshall, K. C. (1981). Specific adhesion of bacteria to heterocysts of Anabaena spp. and its ecological significance. Appl. Environ. Microbiol. 42, 1085–1092.
Maqubela, M., Mnkeni, P., Issa, O. M., Pardo, M., and D'Acqui, L. (2009). Nostoc cyanobacterial inoculation in South African agricultural soils enhances soil structure, fertility, and maize growth. Plant Soil 315, 79–92. doi: 10.1007/s11104-008-9734-x
Millineaux, P. M., Gallon, J. R., and Chaplin, A. E. (1981). Acetylene reduction (nitrogen fixation) by cyanobacteria grown under alternating light-dark cycles. FEMS Microbiol. Lett. 10, 245–247. doi: 10.1111/j.1574-6968.1981.tb06249.x
Montoya, J. P., Voss, M., Kahler, P., and Capone, D. G. (1996). A simple, high-precision, high-sensitivity tracer assay for N (N2) fixation. Appl. Environ. Mcrobiol. 62, 986–993.
Nayak, S., Prasanna, R., Pabby, A., Dominic, T. K., and Singh, P. K. (2004). Effect of urea, blue green algae and Azollaon nitrogen fixation and chlorophyll accumulation in soil under rice. Biol. Fertil. Soils 40, 67–72. doi: 10.1007/s00374-004-0738-2
Norusis, M. (2008). SPSS 16.0 Statistical Procedures Companion. Upper Saddle River, NJ: Prentice Hall Press.
Paerl, H. W. (1977). Role of heterotrophic bacteria in promoting N2 fixation by Anabaena in aquatic habitats. Microb. Ecol. 4, 215–231. doi: 10.1007/BF02015078
Peng, X. (2016). Potential Use of N2-Fixing Cyanobacteria for Establishing Renewable Biological Soil Crusts and Modulating Soil Nitrogen in Agroecosystems. Ph.D. Dissertation, The Pennsylvania State University (University Park, PA).
Peng, X., and Bruns, M. A. (2018). Development of a nitrogen-fixing cyanobacterial consortium for surface stabilization of agricultural soils. J. Appl. Phycol. doi: 10.1007/s10811-1597-9
Pereira, I., Ortega, R., Barrientos, L., Moya, M., Reyes, G., and Kramm, V. (2009). Development of a biofertilizer based on filamentous nitrogen-fixing cyanobacteria for rice crops in Chile. J. Appl. Phycol. 21, 135–144. doi: 10.1007/s10811-008-9342-4
Roger, P. A., and Ladha, J. K. (1992). Biological N2 Fixation in wetland rice fields: estimation and contribution to nitrogen balance. Plant Soil 141, 41–55. doi: 10.1007/BF00011309
Schindler, D. W., and Hecky, R. E. (2009). Eutrophication: more nitrogen data needed. Science 324, 721–722. doi: 10.1126/science.324_721b
Sonkoly, J., Valkó, O., Deák, B., Miglécz, T., Tóth, K., Rodócz, S., et al. (2017). A new aspect of grassland vegetation dynamics: cyanobacterium colonies affect establishment success of plants. J. Vegetation Sci. 28, 475–283. doi: 10.1111/jvs.12503
Sprober, P., Shafik, H. M., Présing, M., Kovács, A. W., and Herodek, S. (2003). Nitrogen uptake and fixation in the cyanobacterium Cylindrospermopsis raciborskii under different nitrogen conditions. Hydrobiologia 506, 169–174. doi: 10.1023/B:HYDR.0000008617.90245.5f
Strauss, S. L., Day, T. A., and Garcia-Pichel, F. (2012). Nitrogen cycling in desert biological soil crusts across biogeographic regions in the Southwestern United States. Biogeochemistry 108, 171–182. doi: 10.1007/s10533-011-9587-x
Witty, J. F. (1979). Algal nitrogen fixation on temperate arable fields. Plant Soil 52, 165–183. doi: 10.1007/BF02184558
Keywords: cyanobacteria, N2 fixation, microbial consortium, nitrate, surface biofilm
Citation: Peng X and Bruns MA (2019) Cyanobacterial Soil Surface Consortia Mediate N Cycle Processes in Agroecosystems. Front. Environ. Sci. 6:156. doi: 10.3389/fenvs.2018.00156
Received: 01 September 2018; Accepted: 12 December 2018;
Published: 04 January 2019.
Edited by:
Victor Satler Pylro, Universidade Federal de Lavras, BrazilReviewed by:
Peter S. Hooda, Kingston University, United KingdomMarcelo Gomes Marçal Vieira Vaz, Universidade Federal de Viçosa, Brazil
Ichiro Tayasu, Research Institute for Humanity and Nature, Japan
Alejandro A. Murillo, EMBL Heidelberg, Germany
Copyright © 2019 Peng and Bruns. This is an open-access article distributed under the terms of the Creative Commons Attribution License (CC BY). The use, distribution or reproduction in other forums is permitted, provided the original author(s) and the copyright owner(s) are credited and that the original publication in this journal is cited, in accordance with accepted academic practice. No use, distribution or reproduction is permitted which does not comply with these terms.
*Correspondence: Mary Ann Bruns, bXZiMTBAcHN1LmVkdQ==
†Present Address: Xin Peng, Beijing GAGO, Ltd., Beijing, China