 Muhammed I. Kulat
 Rabi H. Mohtar
 Francisco Olivera3
- 1Department of Civil Engineering, Middle East Technical University, Ankara, Turkey
- 2Agricultural and Food Sciences, American University of Beirut, Beirut, Lebanon
- 3Zachry Department of Civil Engineering, Texas A&M University, College Station, TX, United States
Nations, particularly those with well-established infrastructure, have started to look for new, innovative solutions to address the expected, inevitable high demand for primary resources. The WEF (water-energy-food) Nexus approach, which holistically considers the dynamic interlinkages between water, energy, and food resources, has come to the forefront within scientific and practice communities. Supporters assert that sustainable solutions can be revealed through the use of this approach, rather than conventional approaches that often overlook the interlinkages. The authors developed a holistic framework to provide sustainable scenarios that include feasible infrastructure interventions. The framework focuses on water and associated links with other resources, includes a unique analytic tool for quantifying scenarios, and ultimately produces a sustainability analysis of each scenario. Optimal scenarios are offered that consider site-specific dynamic resource interlinkages. The platform was applied to the case study of Matagorda County, Texas, identified as one of the most water-stressed regions in the state of Texas by the Texas Water Development Board, the state's executive agency for water resources management. High demands from energy and agriculture sectors in the county and sharp population increase in the upper basins, which include the city of Austin, have put great pressures on the water resources of Matagorda County. Farmers have been forced to change their crops from high to lower water-demand crops, in spite of apparent and relatively abundant local water resources. The findings of the case study present a most sustainable scenario, including infrastructure interventions that will increase the annual income of agriculture sector from $188 million to $239 million. The approach also helps preserve resources while reducing annual water and energy demand by 22 million m3 and 21 million kWh, respectively, and does not sacrifice on-going municipal and industrial water use or energy production in Matagorda, Texas.
Introduction
Under the intertwined influences of population increase, climate dynamics, urbanization, and environmental deterioration, various water issues are emerging into the global arena. Conventional engineering and management decision making processes for water resources tend to primarily consider cost and quantity parameters. However, long term, optimal, sustainable water allocation, and management decisions require a more holistic approach that considers all stakeholders and the associated, interdependent systems, such as energy costs, footprints of water production and distribution, and tradeoffs of water allocation between sectors (agriculture, energy production, and ecosystems).
The case proposed in this study focuses on Matagorda County, Texas, where lucrative rice farms once flourished, but where recent water shortages have caused dramatic shifts in cropping patterns. In addition, Matagorda County is home to one of Texas' two nuclear power plants, which consume approximately one-third of the existing water supply. While recently issued, additional nuclear power plant licenses will more than double energy production, these new plants will also further exacerbate the stresses on Matagorda's natural resources. Consideration of the tradeoffs between these multiple demands is critical to the sustainable management of the County's primary resources: the current water gap is growing and will become worse in the future.
Background and Literature Review
The lack of fresh water and sanitation leads to disease, poverty, and either migration toward more water-abundant valleys or development of local infrastructure solutions, such as surface water conveyance or withdrawal from underground resources (Hassan, 2003). Ancient societies in North Africa, Asia, and the Middle East were situated near fresh water resources, mainly rivers, to ensure easy access for domestic, irrigation, and livestock purposes. The industrial revolution of the eighteenth century brought population booms, rapidly rising living standards, and growing demand for water for industrial, energy, and mining production purposes. Throughout history, developments in material science, such as cast iron, affordable concrete, and pumping technologies, have made it easier to convey water, leading to dramatic increases in the quantities of water used (Duffy, 2013). By the twentieth century, water usage quantities increased dramatically as access to water became easier.
However, this tremendous increase in water use caused new challenges: high demand, environmental deterioration, and allocation issues, and carried complicated influences on various sectors. For example, a farmer accustomed to irrigating an agricultural field only if direct access to water was available (pre twentieth century), could irrigate fields far removed from the water source after the technological innovations of the twentieth century. Many criteria, hydraulic sufficiency, financial capability, adequacy of materials, water quality, water rights, etc. have emerged and must be taken into account. Today, technological opportunities notwithstanding, the issues are more complex.
Pervasive developments and increasing standards in various fields led the scientific community to seek new methods to offer solutions against the complexities (Arnold and Wade, 2015). Thus, the systems thinking and systems theory is applied to real life applications since World War II in an effort to solve complex issues while also considering interlinked parameters and components (Steven, 2011). Systems theory includes the three major pillars of sustainability: economic, social, and environmental, and facilitates an improved understanding of the interlinkages between the three (Cattano et al., 2011). Thus, the water-energy-food (WEF) nexus approach was established using the systems theory.
During the 2010s, the WEF nexus became an important topic in in the scientific literature. As it is a relatively new approach, there is no sound consensus on its definition. FAO describes WEF nexus as “a useful concept to describe and address the complex and interrelated nature of our global resource systems, on which we depend to achieve different social, economic and environmental goals” (FAO, 2014). Securities of the primary resources are central concerns of this nexus (Bizikova et al., 2013). The approach helps promote a more sustainable future by identifying the dynamic inter-relationships between WEF resource systems. The disciplines behind each of these systems are not replaced, but built upon to provide solutions for insecurities in the inextricably linked primary resources (Mohtar and Daher, 2012). Attitudes toward water planning illustrate that the WEF nexus approach can provide an overall increase in the efficiency and sustainability of resource use: the nexus focuses on system efficiency, rather than on the individual sectors comprising the system (Hoff, 2011). From the global United Nations Sustainable Development Goals (SDGs) to regional and local goals, the WEF Nexus has become central to discussions of the potential balance of interests and perspectives between the private and public sectors and civil society regarding the allocation of the same resources (Mohtar and Lawford, 2016).
There has been numerous contributions in recent literature on the development and applications of the water-energy-food (WEF) system in modeling, system integration, data analytics, and governance. Despite the potential, this system approach in managing the complex WEF system there is a lag in implementing and adopting this approach in real life decision making. Beside the lack of appropriate tools, data and knowledge, there is a general skepticism surrounding this approach as to its applicability and ability to save resources and cost saving resulting from adopting these holistic approaches (Daher et al., 2018). There is a general lack of documented cases to this effect showing tangible savings in capital and resources as a result of the WEF nexus approaches. This study sheds some light on these saving using a real case study and attempts to serve as a case study of such benefits.
As specific to the water resources management, the recent trend in public policies indicate that managing water resources systems should be the main focus rather than investing on infrastructure. Supporters of the trend tend to assume that the sustainability can only be achieved when we direct new rules in water resource allocations whereas others claim we still need to improve and build efficient water infrastructure (Kemerink et al., 2016). In this manner, this study associates both approaches and creates an environment to enable optimum water infrastructure investing considering trade-offs between water users.
Overall, this study develops a WEF Nexus model that identifies the causes of water stress, and provides scenarios, including feasible infrastructure interventions, from which to draw sustainable recommendations that take into account the nexus interlinkages unlike conventional methods. In doing so, the study builds an analytic tool to assist quantifying trade-offs and a sustainable analysis system to assess sustainability in the selection of water-related infrastructure projects. A real case study is needed to demonstrate whether the WEF nexus approach model developed here helps save capital and primary resources.
Research Hypothesis
A holistic WEF Nexus approach to water resources planning reduces cost, saves primary resources utilization while providing the same primary resource services. The primary objectives of the study are to:
I. Identify scenarios: consisting of infrastructure interventions that can mitigate risk and vulnerability in securities of primary resources (water, energy, food).
II. Develop a WEF nexus platform: a systems level water-energy-food nexus platform, including a tool to quantitatively assess tradeoffs in developed scenarios.
III. Analyze Sustainability: develop criteria for obtaining optimal scenarios and analyze them based on economic, social, and environmental sustainability, and their tradeoff implications for water, energy and food resources.
Methodology
The methods for achieving these three objectives: (I) identifying scenarios, (II) developing a WEF nexus platform, (III) analyzing sustainability, are generalized to hotspots that experience water scarcity. The framework, as seen in Figure 1, is summarized as an overview of the methodology. The proposed analytical framework relies on the interconnections between primary resources (i.e., water is needed for food production; irrigation requires energy), and consists of the three stated primary objectives. The detailed steps, shown in Figure 1, must be accomplished to reach outcomes. Long-term sustainability projections are based on the analysis of data from a specific year; these are then projected to the year of interest. The case study stated in the following chapter shows how the method is practiced in for a real life case. Assumptions needed and data collected specifically for the case study can be found in Appendix 2.
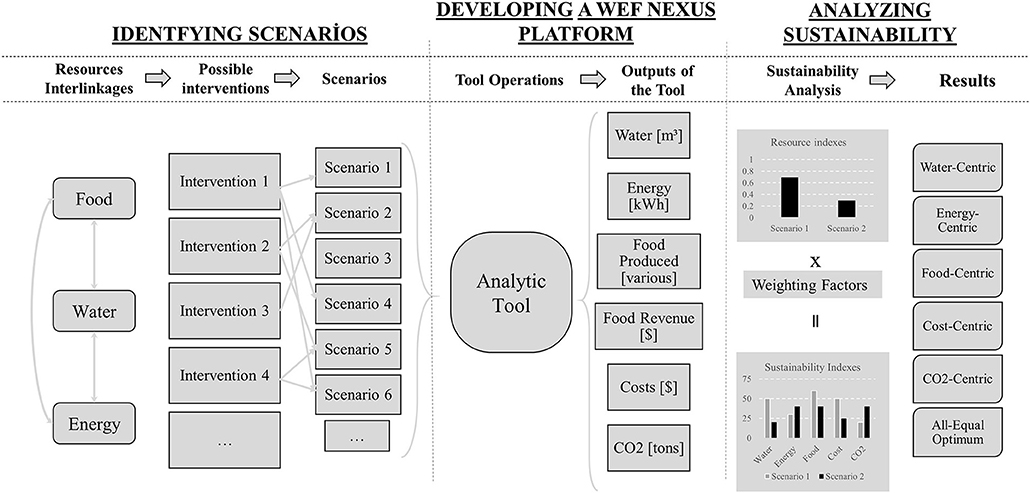
Figure 1. Water—Energy—Food Nexus Framework.
Identifying Scenarios
The water-food, water-energy, and food-energy nexus are reflected in the general resource allocation for the study area, making it possible to analyze the stresses that cause insecurity in water resource availability. Further, investigating these nexus provides a basis for interventions that help improve securities of the WEF resources, thereby ensuring a more sustainable future. The interventions may include on-farm irrigation systems, altered crop patterns, new reservoirs, improved water distribution infrastructure, altered energy plant cooling systems, solar production of energy, and cost of water distribution systems.
Interventions vary with local necessities and availabilities. It should be kept in mind that while an intervention may be feasible, it may also be unsustainable and therefore, not advisable. In this methodology, a holistic, globally applicable nexus model is presented. However, feasible interventions to the vulnerable study region should be determined based on local objectives and restrictions. Also, environmental constraints should be used as limitations for providing sustainable future. For water allocation, environmental flow requirements, and groundwater withdrawal recommendations should not be exceeded in any case scenario.
Possible interventions are used to form scenarios (Table 1). A large number of scenarios can be developed across multiple sectors (agriculture, energy production, water, industry, etc.). For the study area, the number of scenarios is limited due to time and calculation restrictions. For example, if 10 possible interventions were developed for a study area, then “10!” different scenarios can be developed using them. However, selecting a number of scenarios that reflect major possibilities can be sufficient to draw recommendations.
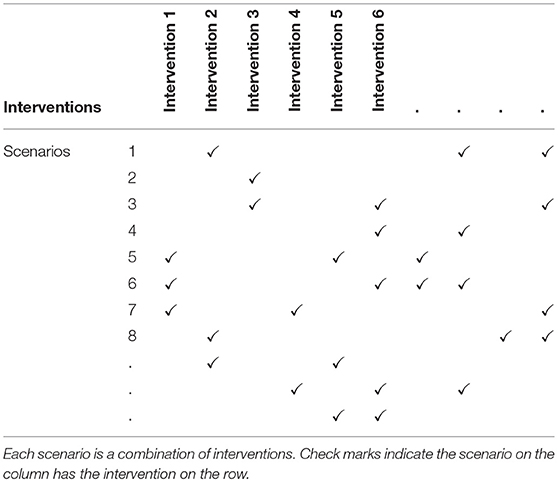
Table 1. Scenarios and interventions.
Developing WEF Nexus Platform
This approach considers the WEF resources to be inextricably linked to one another. Thus, it is imperative that the interlinkages be investigated before the analytics are built. Figure 2 illustrates the layout of the nexus model and its interconnections. Water is needed for food production due to the requirements of irrigation and animal intake. Food production requires energy as pumping is required for irrigation and other farming practices (i.e., tillage, fertilization, planting). Biofuel crops can benefit energy production, but require that land be allocated for their production. Energy is dependent on water: most types of energy require cooling, often provided by freshwater. Energy is essential to the use of water resources: in treatment, distribution, and desalination. Thus, sustainable development of an economy centered on water, energy, and crop resources should focus on the interlinkages of these three and the manner in which they influence each other.
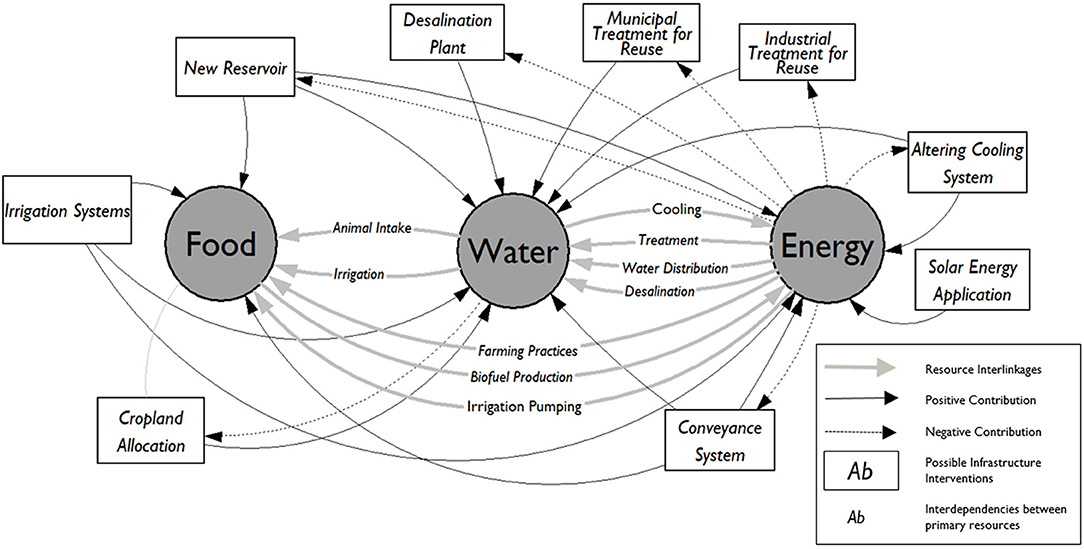
Figure 2. Schematic Overview of the WEF Nexus Model.
These nexus interlinkages must be quantified for further analysis. To this purpose, the authors developed a unique analytic tool based upon input scenarios in which each scenario has a given set of possible interventions that provide the data of study area, such as irrigation applications, selected crops and the lands allocated to grow them, water use and supply, energy production and consumption, food production, farming practices. The tool is capable of providing quantitative results for each scenario in terms of the total water demanded and supplied, energy demanded and produced, agricultural revenue, CO2 emission, and cost of related infrastructure projects (Table 2). The analytics of the tool can be seen in Appendix 1. Sustainability analysis is performed using the quantitative results to help determine the preferred scenarios in accordance with various perspectives of sustainability.
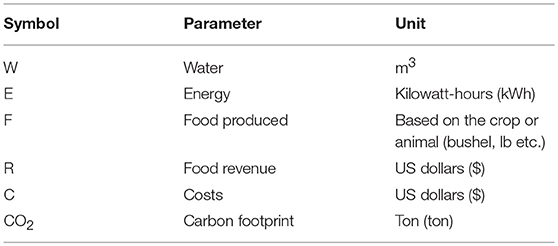
Table 2. Quantitative result parameters obtained from the tool.
Analyzing Sustainability
The sustainability analysis of scenarios consists of two main steps: normalization and stakeholder perspective. First, normalization is necessary to bring diverse outputs and units of the scenario onto a single plane, thus, diverse units are omitted. The quantitative results obtained from the tool are normalized for each scenario to provide resource indices (Appendix 4). Resource indices are ranked from 0 to 1.0 and the outputs normalized considering the largest value of the outputs. Second, the stakeholder perspective must be reflected: stakeholders have divergent views on the resources. All resource indices are multiplied by pre-determined weighting factors (Table 3). Weighting factors, summed to reach 1.0, are applied to the resource indices; higher values are assigned based on given importance of the resource.
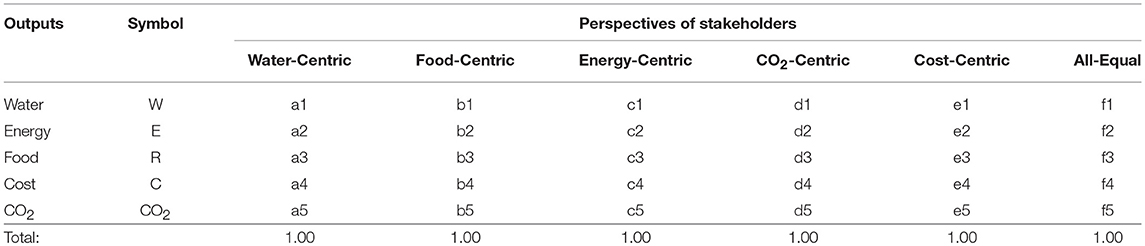
Table 3. Weighting factors.
In this study, the analysis has (1) water-centric, (2) food-centric, (3) energy-centric, (4) CO2-centric, (5) cost-centric, and (6) all-equal perspectives. The subtraction of the sum of multiplication of resource indices and weighting factors from 1.0 provides sustainability indices (see Table 3 for weighting factors). The sustainability indices make it possible to rank scenarios with respect to water-centric, energy-centric, food-centric, cost-centric, CO2-centric, all-equal perspectives. It is important to note that, for a given scenario, it is desirable to lower the demands of water, energy, cost, and carbon-dioxide emissions, whereas agricultural revenue is high in terms of sustainability. The sustainability index formulations shown in the Appendix 4 indicate that resource indices of agricultural revenue become negative in the summation, while other indexed outputs from the tool remain positive. Consequently, water-centric, food-centric, energy-centric, cost-centric, CO2-centric, and all-equal outcomes are presented. The outcomes of the study are the recommended scenarios.
Key Study: Matagorda County
Site and Problem Descriptions
Matagorda County, Texas, sits near the center of the Texas Gulf Coast. Matagorda is surrounded, from a distance, by the major cities of Houston, Austin, and San Antonio. The Gulf of Mexico borders Matagorda County, including Tres Palacios and Matagorda Bay on the western half of the county and the East Matagorda Bay on the eastern half. All are sheltered from the Gulf by the Matagorda Peninsula (TWRI, 2017). The population numbers around 36,598 (US Census Bureau, 2015). The major cities of the county are Bay City and Palacios. The main sectors of employment are agriculture, energy production, and chemical production (MCEDC, 2016).
The Texas Water Development Board (TWDB), a major water-related agency in the state, presents water plans in 5-year cycles. The 2017 State Water Plan (TWDB-2017) indicates an expected shortage of 240 Mm3 in the year 2020 for Matagorda. More than half of the total water demand will be unmet, given existing water supplies. Long-term plans indicate that this gap will continue, making Matagorda County one of the most water stressed among the 254 counties of Texas (TWDB, 2016a).
WEF Nexus Interlinkages in Matagorda
The water shortage in the county is primarily due to the requirements for irrigation and the steam production of electric power, which consume 62 and 31% respectively of Matagorda's total water demand (TWDB, 2016a). Both industries are crucial to the economy of Matagorda County: neither is expected to fade away in the foreseeable future. Matagorda County offers a unique example for a WEF Nexus study, as there is competition for usage of water resources between two sectors: the agriculture and energy industries.
Most of the county's land is allocated for agriculture, either cultivated crops or pastureland (Figure 3) (Homer et al., 2015). Agriculture is the major water consumer in Matagorda County: over 600 ranches and more than a thousand farms operate there. Historically, Matagorda is famous for its rice farms, which consume large quantities of water. Recent droughts, the rising demands from population growth in the surrounding metropolitan areas, and energy production have dramatically influenced crop types: today, farmers in Matagorda grow large quantities of sorghum, cotton, soybeans, and corn rather than rice (MCEDC, 2016).
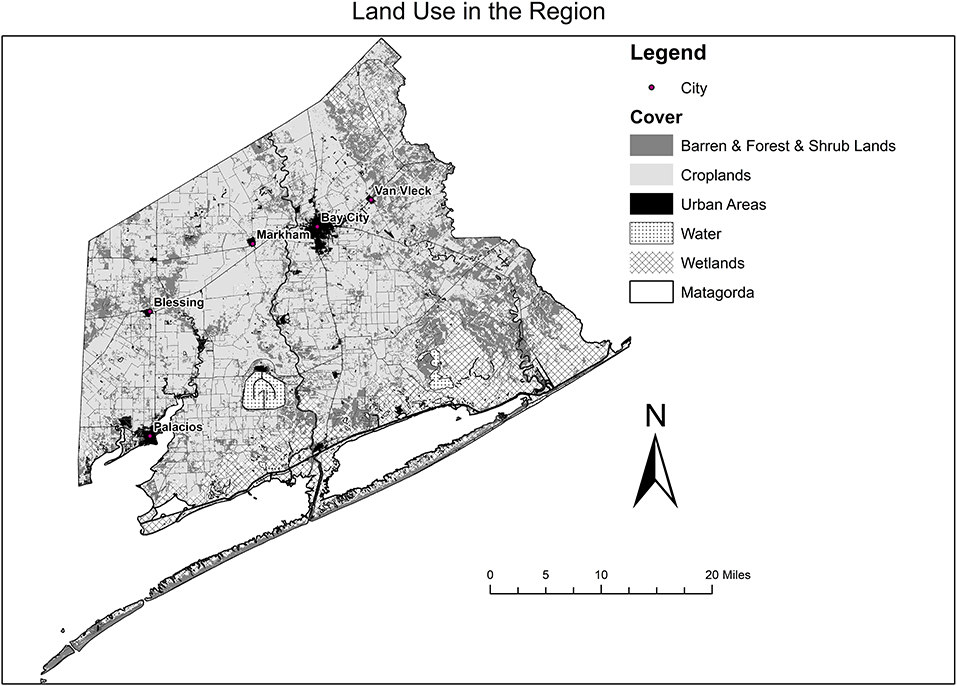
Figure 3. Land Use in the Case Study Region (TNRIS, 2016).
Several water utilities and industries in Matagorda County produce, convey, and utilize the WEF resources of the county. However, the amount of water consumed by municipal and industrial (M&I) users is much less than that consumed by agriculture and energy production. Historical water use estimates of TWDB indicate that municipal water requirements are supplied entirely from fresh groundwater, while industrial water users rely on the Colorado River and the Gulf Coast Aquifer. In 2015, groundwater consumption was 1.75 Mm3 and surface water consumption, excluding power production, was 11 Mm3 (TWDB, 2016,b), making industrial activities the main WEF nexus player in the county. By far the largest industrial company is a nuclear plant, one of two such plants in Texas. The South Texas Project (STP) is the single largest water consumer in Matagorda County and provides power to Houston, Austin, San Antonio and other surrounding areas. By 2020, the county is expected to see the highest demand for water from steam electric power production among the 254 counties of Texas: 130 Mm3 (TWDB, 2016a). This tremendous quantity of water, accounts for one-third of total water resources of the county and is directly consumed by STP for cooling purposes. STP plans to expand the plant in the future (Table 4).
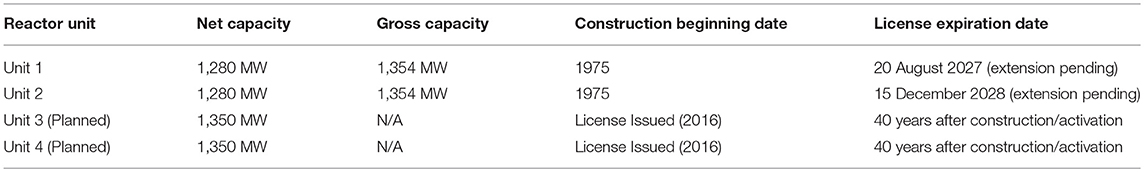
Table 4. The general information of reactors of STP nuclear generation plant [Source: IEAE power reactor information system (IAEA, 2016)].
STP is cooled by a 2,830 ha “Main Cooling Reservoir” (MCR): a constructed cooling reservoir, enclosed by a large ring-dike. The MCR has a volume of 250 Mm3 during normal operation (Wurbs and Zhang, 2014). A pump intake station on the banks of the Colorado River refills the cooling reservoir from losses due to evaporation or seepage. While most of the water needs are supplied by the river, groundwater, and precipitation also contribute. The MCR water is consumed by natural evaporation, induced evaporation due to heat (around two-thirds of produced energy is ejected as heat into the environment), seepage or released back into the river.
General Procedure and Data Collected
While applying the methodology proposed above to the case study, some local and regional adjustments were included. In all scenarios proposed in the case study, the reliability of water allocation for M&I users was determined to be 100% and ensuring that the demands of M&I users, including energy production, will always be met. Agricultural water supply could be lower, and may not meet the anticipated demand of agricultural consumers. The analysis for the case study considers long-term sustainability. The year of 2070 (~50 years forward) was selected and all data for the case study is projected to that year.
Texas legislation requires limitations and constraints in water use (Wurbs, 2015): in this study, existing water rights and permits of users were considered as constraints and were not violated. The other limitations that can be considered environmental for the case study are environmental flow needs for river water use directed by Texas Commission on Environmental Quality (TCEQ) and recommended groundwater withdrawal values by Texas Water Development Board (TWDB) (section A.2).
As the nexus case study needs a comprehensive analysis, various types of data were required. All the details of the data collected can be seen in the Appendices (section A.2) Assumptions specified for this case study are shown in Case Study Assumptions. Thus, the ultimate WEF nexus model for the case study was drawn after analyzing the data and describing the system components, boundaries, stakeholders, and observers. The developed analytic tool was then modified based on the model for the case study.
Scenario Building
Possible interventions related agricultural practices, water resources, and energy resources were identified as solutions to existing and anticipated water shortages for the study area. The following possible interventions are proposed for Matagorda County: alter land allocation, improve on-farm irrigation systems, supply new conventional and unconventional water resources for agricultural consumption and municipal and industrial water reuse, alter cooling systems and supply alternative water resources to the nuclear energy plant, and build a new solar farm in the county. Twenty-five scenarios were developed; each uses a combination of the stated interventions. The base scenario (“business as usual” or BAU) proposes no interventions and is used to compare the developed scenarios. Table 5 shows the embedded interventions, for example, scenario-8 has only intervention 4, while scenario-9 has interventions 1, 3, 4, and 5. The tool was applied to each scenario and quantitative results produced.
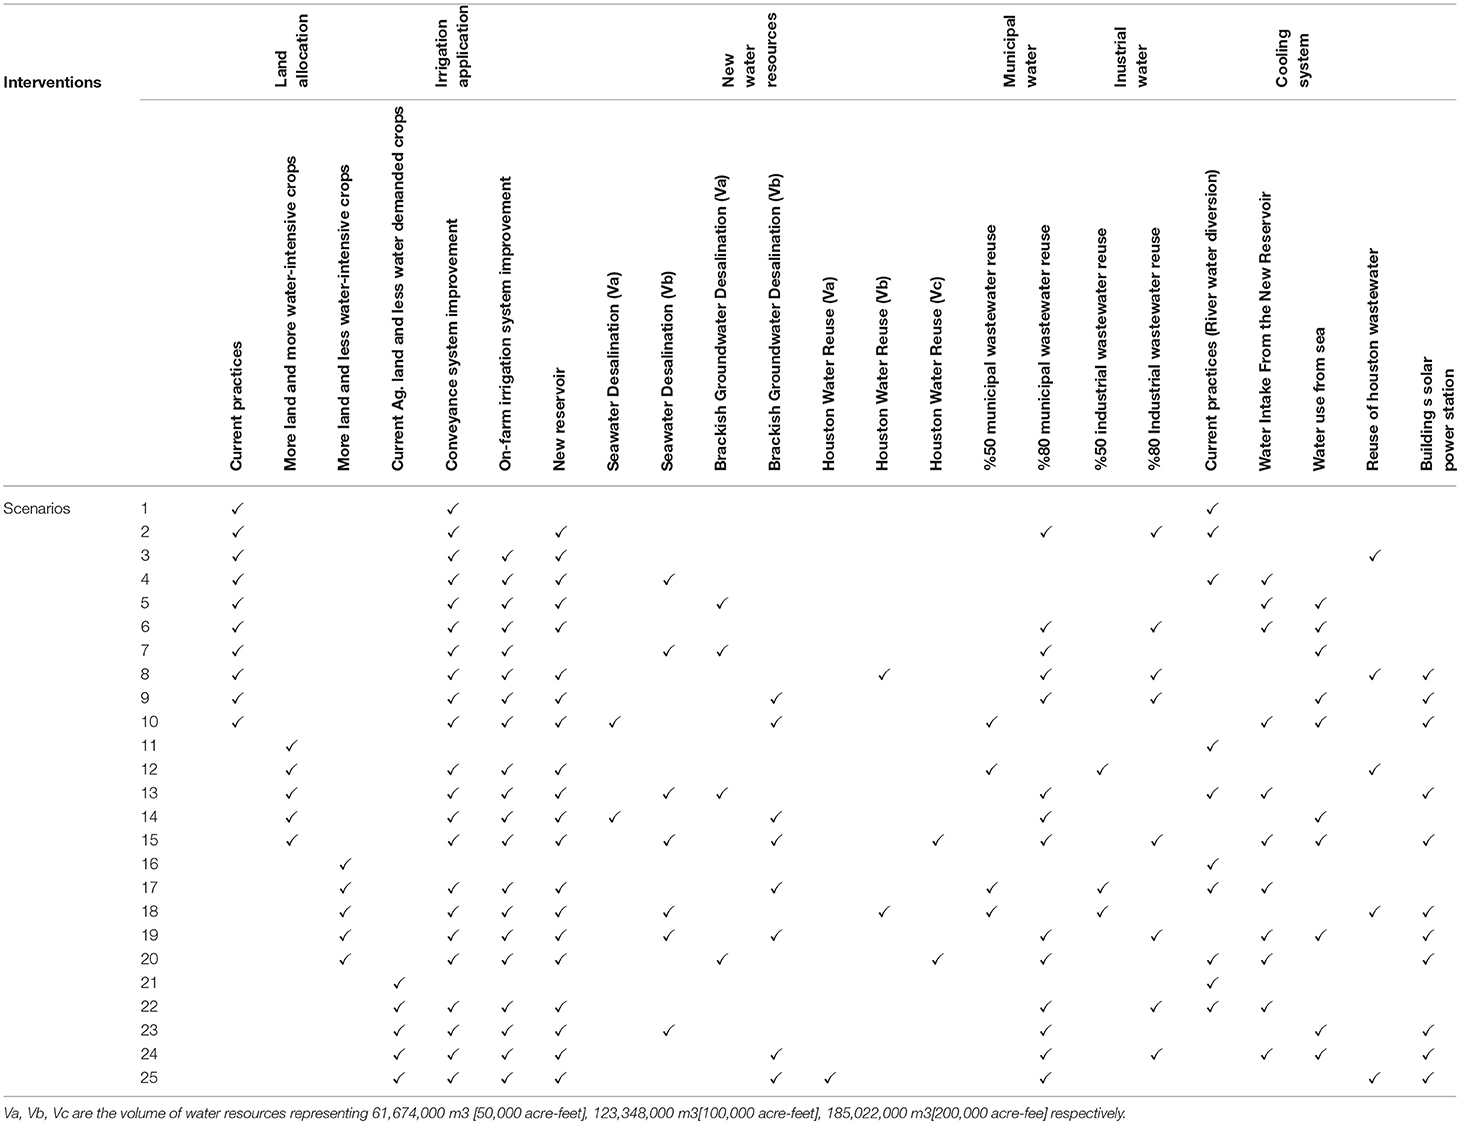
Table 5. Scenarios and possible infrastructure interventions systems embedded in the scenarios.
Sustainability Analysis
Quantitative results were normalized to obtain resource indices as described in the methodology section. The resource indices were then multiplied by weighting factors, as specified for the key study (Table 6). For water-centric, food-centric, energy-centric, cost-centric, and CO2-centric perspectives, the highest value (0.40) was assigned to the highest important outcome. The remaining outputs were weighted equally at 0.15, as their importance was desired to be considered in the nexus study. The sum of each weights of perspectives was 1.0. As for the last perspective, all-equal, all weights were assigned the same: 0.20 for each. Consequently, each analysis accounts for influences of interventions to water, energy, food portfolios, and its financial and CO2 emission costs.
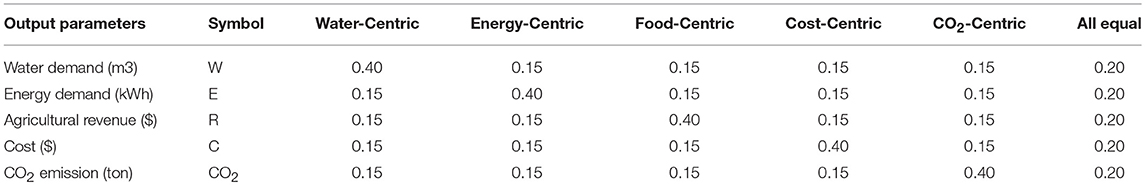
Table 6. Preferred weights for case study.
Results and Discussions
The trade-offs between primary resources are explicit and the required data are relatively accessible for Matagorda County compared to other regions. These enable us to apply the methodology in details. Therefore, we can validate and assess the methods developed. Applying the study elsewhere in the world will require some attentions. First, the application of the study in other regions (especially in developing countries) would require more assumptions regarding data although the methodology of the study is designed to be applicable everywhere. It can reduce the accuracy of the study. Second, some aspects of WEF interlinkages that the case study are does not cover may need to be taken into account such as hydropower and biofuel depending upon the new study area. Next, local and regional legislative constraints should be included. As an illustration, Texas legislations including existing rights that cover Matagorda County played an immense role while determining the constraints of the study. However, other parts of the world will have different legislations that need to be examined before building scenarios. Also, we used existing environmental constraints that have already been applied in the county such as envitonmental flow and groundwater withdrawal values. Specific environmental considerations may be applied to new study areas. Last but not least, existing practices and availabilities are site-specific issues. The current and anticipated practices in farming, water use, energy use etc. should be taken into account when the methodology is applied to other real life case studies from different parts of the world.
Results of the case study are presented in two phases: quantitative results (analytic outputs) of each scenario, and outcomes of the sustainability analyses that indicate rankings of scenarios, based on various perspectives of sustainability. Twenty-five developed scenarios were examined. The WEF nexus analytic tool provided quantitative results for each of these scenarios. Some of the outputs were further analyzed to identify and recommend the most sustainable scenarios (Figure 4). In each graph, the x axis represents the scenarios and the y-axis presents output records.
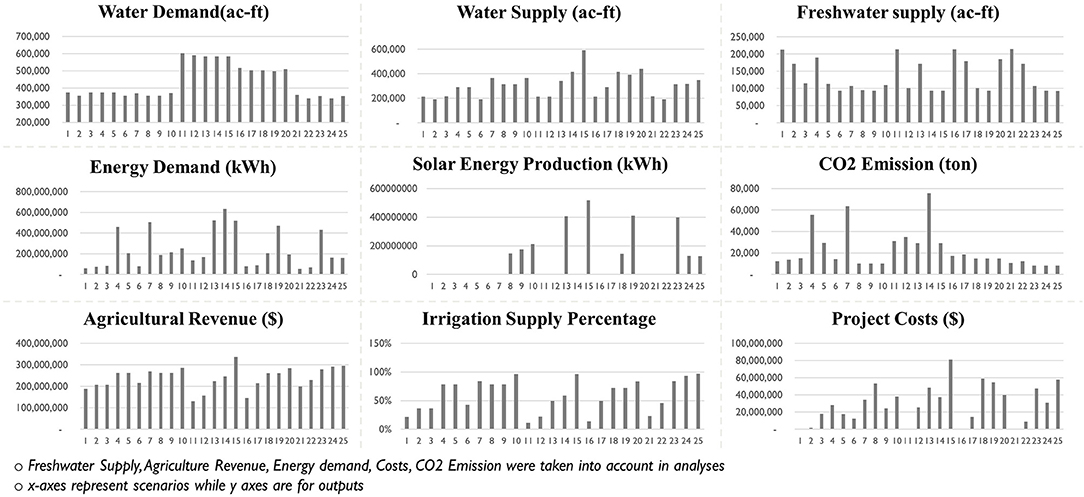
Figure 4. Outputs Obtained from the Tool.
Several kinds of numerical outputs become available for each scenario, as seen in Figure 4. However, only some outputs that have a wide spectrum of reflectance of the water-energy-food nexus were selected for the sustainability analysis. The determined weighting factors (Table 6) were multiplied by the normalized output values to enable stakeholders to reflect their views. After the completing the sustainability analyses, the sustainability indices, ranked from 0 to 1, are produced (Figure 5). Outcomes of the sustainability analysis are the rankings of the scenarios based on sustainability analyses. Scenarios were ranked based on (1) water-centric, (2) food-centric, (3) energy-centric, (4) CO2-centric, (5) cost-centric, and (6) all-equal perspectives.
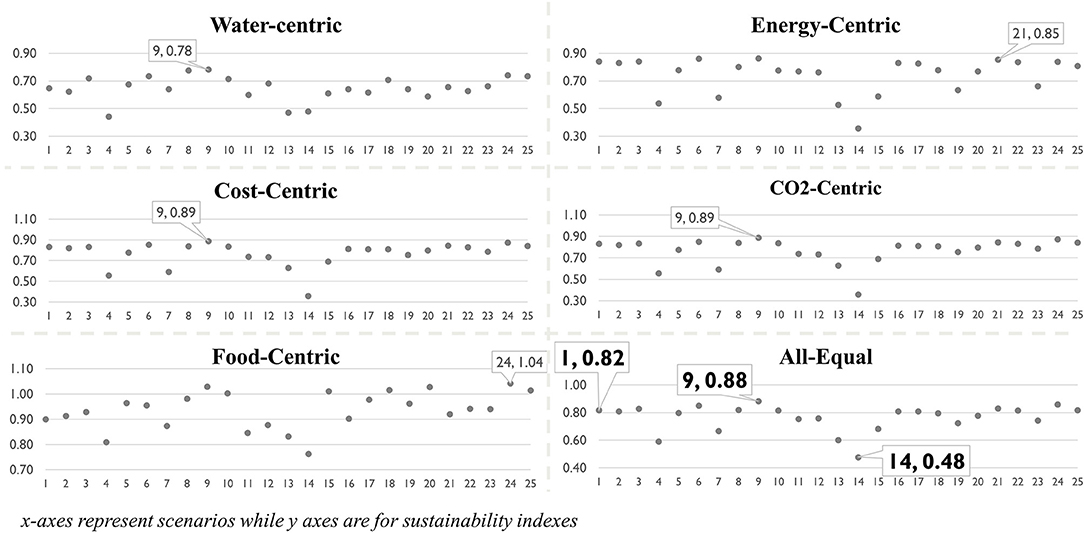
Figure 5. Outcomes of Sustainability Analysis.
The first scenario (S-1), is a base scenario for which there is no new intervention (“business as usual”). The results of sustainability analysis for all-equal perspective, which is an objective perspective, show that scenario 9 (S-9) is the best scenario in terms of sustainability. The least sustainable scenario is S-14. The base scenario (S-1) is also used for validations. The interventions recommended by S-9, S-1, S-14 can be seen from the scenarios (Table 5). Table 7, seen below, presents the quantitative results of sustainability analysis of the 3 main scenarios (best, base, and worst).
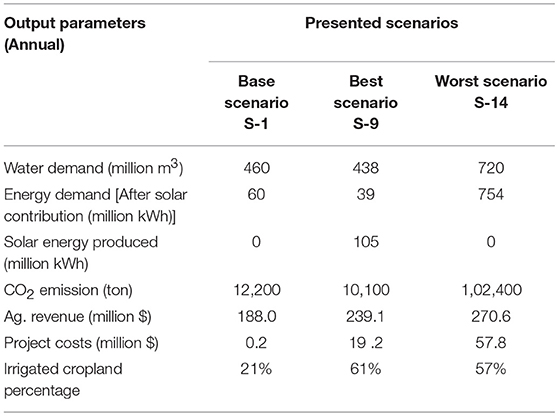
Table 7. Outputs of Best, Worse Sustainable and Base (Business as usual) Scenarios.
Water demand of the county is 460 million m3 for S-1 (the base scenario), while it is 438 M m3 for S-9 (the most sustainable scenario) and 720 M m3 for S-14 (the least sustainable scenario). It is desired for a sustainable scenario to have less water demand, as in S-9.
When it comes to water supply, outputs show that S-14 provides highest water supply, with 678 Mm2. Although it seems that a greater water supply means more sustainability, the water supply sources of S-14 (seawater, brackish groundwater, water reuse within the county), water reuse reduces sustainability because of energy and cost outputs (see Appendix 5 for the amounts of other water supply sources used).
The highest energy demand value can be seen in S-14, which is nearly 13 times higher than the base scenario with more than 750 M kWh. When S-1 and S-9 are examined, it can be seen that S-9 has higher energy demand, 144 M kWh by S-9, 60 M kWh by S-1. However, S-9 proposes a solar farm to supply energy demand and therefore S-9 is the most desirable scenario in terms of energy demand due to lower energy needs from conventional sources. The energy produced by solar farm is 105 M kWh annually and reduces energy demand to 39 M kWh (see Table 7). Comparisons of CO2 emission as an environmental cost in the scenarios show that the less detrimental S-9 is the best scenario: it is a little less than S-1.
Three major stakeholders (agriculture, industry, and municipality) driving WEF resources were analyzed. The agriculture sector suffers from lack of water, which negatively influence the agricultural economy in the count; the other sectors have continued their activities as desired. The interventions provide economic benefits to the agriculture sector. The methodology of the study states that municipal and industrial consumers will continue their activities in any case scenario without any interference (see methodology). Their water and energy requirements for industry and municipal users will be met (water supply firm yield maintained), so the sectors will have the usual expected annual benefits. As a result of financial analysis, S-9 becomes the most sustainable scenario, providing approximately an extra annual $32 million in direct income. This extra income is a direct benefit of the agricultural sector and was calculated after considering costs of interventions. It is significant to note that most of the population depends on agricultural sector in Matagorda County. Therefore, economic well-beings of the other sectors, thus, are expected to grow with external benefits of the annual $32 million.
Overall, this case study prioritizes water security while considering food and energy interlinkages. Thus far, we looked at all-equal analysis that considers all perspectives of stakeholders equally. When it comes to other analyses, the outcomes of the sustainability analysis indicate S-9 is the preferred scenario in terms of cost, CO2 emission, water, and all-equal analyses. From the perspective of energy, one of the main pillars of this study, S-21 ranks as the most sustainable scenario, whereas S-24 is the most sustainable scenario from the food perspective. The study, therefore, asserts different advisable scenarios for the various existing stakeholders or observers in the case of Matagorda County. All the interventions will have financial cost due to the project costs of interventions if/when the outcomes of the study are applied. However, the benefit will be much greater than cost. In fact, agricultural revenue will increase $32 million annually. The annual extra income of S-9, the most sustainable scenario, provides the opportunity for water planners to enhance economic sustainability while preserving WEF resources through better resource allocation.
Conclusions
As one of the solutions to anticipated global and regional high demands for primary resources, a new approach, the water-energy-food nexus approach, has received greater scientific attention. The nexus approach asserts that common conventional approaches to water resources planning do not completely include inextricable dynamic linkages of the resources, thus result in a less sustainable future. The WEF nexus model used in this study helps produce advisable scenarios including possible interventions from which stakeholders, observers, and policy makers can then make informed decisions. The Matagorda County case study is well-suited for a nexus approach model: water resources have been under pressure due to electric power production and agricultural production which suffers from diminishing water availability.
The outcomes of the case study indicate that Scenario-9 (S-9) is the most sustainable scenario. S-9 proposes modernizing irrigation systems, reusing wastewater, building a new structure for water storage, altering the cooling system of the energy plant, treating brackish groundwater, and setting up a solar farm. The interventions embedded in S-9 will undoubtedly bring extra financial cost. Ultimately, the benefits outweigh the costs. In fact, annual income in the county increases by $32 million compared to the current “business as usual” scenario, even under extreme conditions, such as drought and high population increase. This financial gain is in the agricultural sector, which has suffered recently due to lack of water. Prosperous agricultural commerce is expected to strengthen other sectors as well: a considerable portion of the population depends on the agriculture sector in Matagorda. Increased irrigated cropland provides increased food production, which actually provides extra income. Along with the financial benefits, the results of the case study indicate that the WEF nexus approach helps preserve primary resources. The annual energy demand from conventional sources is reduced by 21 million kWh. Also, annual demand for water is reduced by 22 million m3. All these benefits are provided without sacrificing existing and planned industrial activities, electric power production and the municipal water supply. In other words, municipal and industrial water supplies meet the demands in any case scenario. All interventions are performed considering environmental, financial and legislative constraints.
Consequently, this study provides water resource planners an opportunity to quantify the tradeoffs between primary resources, and bring all stakeholders to a single basis regarding the use of financial and WEF resources while also protecting the natural environment. Further contributions to the WEF nexus platform built into the study, such as adding environmental responses including water pollution to possible infrastructure interventions and stakeholder willingness can enhance the sensitivity of the model proposed.
Author Contributions
MK conceived of the presented idea. MK and RM developed the methodology, developed a tool, and performed the computations. MK, RM, and FO contributed to the design of the research, to the analysis of the results and to the writing of the manuscript.
Conflict of Interest Statement
The authors declare that the research was conducted in the absence of any commercial or financial relationships that could be construed as a potential conflict of interest.
Acknowledgments
The authors wish to thank Jordan Buescher for the input to the original scope of the work, Mary Schweitzer for editorial efforts, and Ministry of Agriculture and Forestry of Turkey for their support toward this research. This paper is based in part on a presentation at the XVI World Water Congress in Cancun, Mexico in May 2017, organized by the International Water Resources Association (IWRA) that appeared in the Congress proceedings. We are grateful to the IWRA for permission to use this information.
Supplementary Material
The Supplementary Material for this article can be found online at: https://www.frontiersin.org/articles/10.3389/fenvs.2019.00003/full#supplementary-material
References
Arnold, R. D., and Wade, J. P. (2015). A definition of systems thinking: a systems approach. Proc. Comp. Sci. 44, 669–678. doi: 10.1016/j.procs.2015.03.050
Bizikova, L., Roy, D., Venema, H. D., and McCandless, M. (2013). The Water–Energy–Food Security Nexus: Towards a Practical Planning and Decision-Support Framework for Landscape Investment and Risk Management. Winnipeg: International Institute for Sustainable Development.
Cattano, C., Nikou, T., and Klotz, L. (2011). Teaching systems thinking and biomimicry to civil engineering students. J. Prof. Iss. Eng. Ed. Pract. 137, 176–182. doi: 10.1061/(ASCE)EI.1943-5541.0000061
Daher, B., Mohtar, R. H., Davidson, S., Cross, K., Karlberg, L., Darmendrail, D., et al. (2018). Multi-Stakeholder Dialogue: Water-Energy-Food (WEF) and Implementing SDGs. IWRA Policy Brief No. 2. Paris: IWRA
Duffy, M. (2013). Challenges in the Water Industry: Infrastructure and its Role in Water Supply (White Paper). American Water Company (Accessed November 26, 2016).
FAO (2014). The Water-Energy-Food Nexus: A New Approach in Support of Food Security and Sustainable Agriculture. Policy Support and Governance. Food and Agriculture Organization, Rome.
Hassan, F. A. (2003). “Water management and early civilizations: from cooperation to conflict,” in History and Future of Shared Water Resources, eds F. A. Hassan, M. Reuss, J. Trottier, C. Bernhardt, A. T. Wolf, J. Mohamed-Katerere, and P. van der Zaag (Paris: PCCP Series No 6, UNESCO), 1–14.
Hoff, H. (2011). “Understanding the Nexus,” in Background Paper for the Bonn 2011 Conference: The Water, Energy and Food Security Nexus, (Stockholm: Stockholm Environment Institute).
Homer, C., Dewitz, J., Yang, L., Jin, S., Danielson, P., Xian, G., et al. (2015). Completion of the national land cover database for the conterminous United States -representing a decade of land cover change. Photogramm. Eng. Rem. S. 81, 346–354. doi: 10.14358/PERS.81.5.345
IAEA (2016). “United States of America: Reactors.” Power Reactor Information System - Country Details. Available online at: https://pris.iaea.org/PRIS/CountryStatistics/CountryDetails.aspx?current=US (Accessed May 28, 2016).
Kemerink, J. S., Munyao, S. N., Sxhwartz, K., Ahlers, R., and van der Zaag, P. (2016). Why infrastructure still matters: unravelling water reform processes in an uneven waterscape in rural Kenya. Int. J. Commons 10, 1055–1081.
MCEDC (2016). “Industry.” Matagorda County Economic Development Corporation. Available online at: http://www.mcedc.net/industry/agriculture/ (Accessed September 12, 2016).
Mohtar, R. H., and Daher, B. (2012). “Water, energy, and food: The ultimate nexus,” in Encyclopedia of Agricultural, Food and Biological Engineering, 2nd Edn. (Abingdon, UK: Taylor & Francis), 1–15. doi: 10.1081/E-EAFE2-120048376
Mohtar, R. H., and Lawford, R. (2016). Present and future of the water-energy-food nexus and the role of the community of practice. J. Environ. Stud. Sci. 6, 192–199. doi: 10.1007/s13412-016-0378-5
Steduto, P., Hsiao, T. C., Fereres, E., and Raes, D. (2012). Irrigation and Drinage Paper no. 66: Crop Yield Response to Water. Rome: FAO.
Steven, J. (2011). Systems, Experts, and Computers: The Systems Approach in Management and Engineering, World War II and After, edited by A. C. Hughes and T. P. Hughes. Inform. Soc. 18, 69–70. doi: 10.1080/01972240252818252
TNRIS (2016). “Political Boundaries”. Texas Natural Resources Information System, Available online at: https://tnris.org/data-catalog/entry/political-boundaries/ (Accessed April 20, 2016).
TWDB (2016). “GIS Data - Major Rivers”. Texas Water Development Board. Available online at: http://www.twdb.texas.gov/mapping/gisdata.asp (Accessed July 20, 2016).
TWDB (2016a). “2017 State Water Plan”. Texas Water Development Board. Available online at: http://www.twdb.texas.gov/waterplanning/swp/2017/ (Accessed February 13, 2016a).
TWDB (2016b). “Historical Water Use Estimates”. Texas Water Development Board. Available online at: https://www.twdb.texas.gov/waterplanning/waterusesurvey/estimates/ (Accessed August 13, 2016b).
TWRI (2017). “Matagorda Basin.” Texas Water Resources Institute. Available online at: http://matagordabasin.tamu.edu/ (Accessed February 13, 2017).
US Census Bureau (2015). “Matagorda County Community Facts.” American FactFinder - Results, Data Access and Dissemination Systems (DADS) of US Census Bureau. Available online at: https://factfinder.census.gov/faces/tableservices/jsf/pages/productview.xhtml?src=CF (Accessed February 13, 2017).
Wurbs, R., and Zhang, Y. (2014). River System Hydrology in Texas (Technical Report No. 461). College Station, TX: Texas Water Resources Institute.
Wurbs, R. A. (2015). Sustainable statewide water resources management in Texas. J. Water Resour. Plan. Manage, 141, 1–10. doi: 10.1061/(ASCE)WR.1943-5452.0000499
Notation List
C: Total costs ($)
CO2ag: CO2 emission happen in agriculture (ton)
CO2co:CO2 emission happen because of cooling water conveyance (ton)
CO2m&i: CO2 emission because of M&I water use (ton)
Ci: Annualized cost of each strategy project ($)
: Project cost index
Cj: Project cost for scenario j ($)
CO2: Total CO2 emission (ton)
: Carbon-dioxide index
CO2j: Carbon-dioxide amount for scenario j (ton)
E: Total energy requirements (kWh)
Eag = Energy requirement for all agricultural activities (kWh)
Eag: Energy need for agriculture sector (kWh)
Ecw = Energy need for treating and conveying city water (kWh)
Edesal Energy need for desalinating and conveying sea or brackish water resources (kWh)
Een: Energy need for water transportation for cooling (kWh)
Een−cw: Energy need for conveying city wastewater (kWh)
Een−gw: Energy need for conveying groundwater water (kWh)
Een−sea: Energy need for conveying seawater (kWh)
Een−sw: Energy need for conveying surface water (kWh)
Efo: Energy requirements for farming operations (kWh)
Egw = Energy requirement for pumping groundwater resources from underground (kWh)
Ei: Various energy consumptions in the nexus (kJ)
Ein: Energy needed for industrial water supply (kWh)
: Energy index for scenario j
Ej: Energy demand for scenario j (kWh)
Em&i: Energy need for municipal and industrial water supply (kWh)
Em&i: Total energy needed for municipal and industrial water supply (kWh)
Emu: Energy needed for municipal water supply (kWh)
Epu−in: Energy needed for pumping industrial water supply (kWh)
Epu−mu: Energy needed for pumping municipal water supply (kWh)
Esw = Energy requirement for transporting surface water from river or reservoir to farm (kWh)
Etr−in: Energy needed for treating industrial water supply when reuse process applied (kWh)
Etr−mu: Energy needed for treating municipal water supply when reuse process applied (kWh)
Fi: Total yield of a specific crop type (miscellaneous unit)
Fi: Yield of a specific crop (miscellaneous unit)
max(W): Maximum water demand among all scenarios (m3)
max(E):Maximum energy demand among all scenarios (kWh)
max(R): Maximum agricultural revenue among all scenarios ($)
max(C): Maximum project cost amount among all scenarios ($)
max(CO2): Maximum Carbon-dioxide amount among all scenarios (ton)
Li: Land allocated for a specific crop (m2)
Ui: Unit of projected market value ($/miscellaneous unit)
Pop :Population of the study area in a projected year (person)
Pi: Precipitation received during the growing period (m)
Ri: Revenue of a certain crop ($)
R: Total agricultural revenue ($)
: Agricultural revenue index
Rj: Agricultural revenue for scenario j ($)
Si: Seasonal irrigation requirement for a specific crop (m)
W: Total Water Requirements (m3)
Wh: Water evaporated due to heat dissipation (m3)
Wag: Total agricultural water requirement (m3)
Wc: Total water need for all of the crops totally for irrigation scheduling (m3)
Wcw: Volume of city water used for irrigation (m3)
Wdesal: Volume of desalinated water used for irrigation (m3)
Wen: Water need for energy production (m3)
Wgi: Green water for a specific crop (m3)
Wgw: Volume of groundwater used for irrigation (m3)
Wi: Water need for a specific crop (m3)
Wii: Water need for irrigation scheduling for a certain crop (m3)
Win: Annual industrial water use (m3)
: Water index for scenario j
Wj: Water demand for scenario j (m3)
Wl: Total annual livestock water requirements (m3)
Wld: Daily drinking water per head (m3)
Wlo: Other daily water requirements of livestock (m3)
Wm&i: Annual municipal and industrial water use (m3)
Wmu: Municipal water use (m3)
Wne: Water amount due to natural evaporation from the pond (m3)
Wre: Released water from the cooling pond (m3) (it is assumed zero due to missing data)
Wse: Water goes to groundwater through seepage (m3)
Wsw: Volume of surface water used for irrigation (m3)
Wt: Total irrigation need (m3)
Wwpc: Annual municipal water use per capita (m3 / person)
YProjected: Regulated trend of unit values for a certain crop yield (miscellaneous unit/m2)
Yi: Unit of projected yield value for a specific crop (miscellaneous unit/m2)
Ymax :Maximum historic unit yield values for a specific crop (miscellaneous unit/m2)
Ytrend :Linear trend of unit yield values for a specific crop (miscellaneous unit/m2)
Δ: Tons of CO2 per kJ energy (ton/kJ) (Varies depending upon the energy source.
α = Energy needed for unit volume of water, which might include desalination and treatment process depending on water type (kWh/m3).
Keywords: water planning, resource security, infrastructure interventions, interlinkages, sustainability, resource allocation, nexus modeling, tradeoffs
Citation: Kulat MI, Mohtar RH and Olivera F (2019) Holistic Water-Energy-Food Nexus for Guiding Water Resources Planning: Matagorda County, Texas Case. Front. Environ. Sci. 7:3. doi: 10.3389/fenvs.2019.00003
Received: 30 August 2018; Accepted: 04 January 2019;
Published: 12 February 2019.
Edited by:
Hong Yang, Swiss Federal Institute of Aquatic Science and Technology, SwitzerlandReviewed by:
Nidhi Nagabhatla, United Nations University Institute for Water Environment and Health, CanadaXingcai Liu, Institute of Geographic Sciences and Natural Resources Research (CAS), China
Copyright © 2019 Kulat, Mohtar and Olivera. This is an open-access article distributed under the terms of the Creative Commons Attribution License (CC BY). The use, distribution or reproduction in other forums is permitted, provided the original author(s) and the copyright owner(s) are credited and that the original publication in this journal is cited, in accordance with accepted academic practice. No use, distribution or reproduction is permitted which does not comply with these terms.
*Correspondence: Rabi H. Mohtar, bW9odGFyQGF1Yi5lZHUubGI=