 Jayati Sinha1
 Naresh Kumar2*
- 1Department of Marketing & Logistics, Florida International University, Miami, FL, United States
- 2Department of Public Health Science, University of Miami Miller School of Medicine, Miami, FL, United States
Ambient air pollution alone accounts for more than 3 million premature deaths worldwide. Low and Middle Income Countries (LMIC) account for most (~87%) of this disease burden. Air pollution in the megacities of these countries has risen to the levels of public health hazards forcing the cities to take emergency measures, such as issuing red alerts and vehicle-rationing interventions (VRI). Using in-situ and high-resolution satellite data, this research examines the efficacy of VRI in Delhi and Beijing, two of the most polluted cities of LMIC. This research shows that VRI reduced particulate matter (PM) ≤ 2.5 μm in aerodynamic diameter (PM2.5) in Beijing during the 2008 Summer Olympics. However, such interventions implemented in 2015 and 2016 in Beijing and in 2016 in Delhi were ineffective in improving air quality. Moreover, the effects of such interventions were short lived, for example 54% of the cleaning in Beijing disappeared within 2 weeks after the Olympics, and Delhi witnessed a 34% increase in PM2.5 during the 2 weeks after the interventions. Both cities observed excess cardiopulmonary mortality even during the interventions. Short- and long-term preventive and mitigation strategies are needed to manage the air pollution disease burden.
Introduction
Our image of rising smoke from chimneys, once used to be a symbol of prosperity, began to shatter with the discovery and understanding of its hazardous health effects. For example, the 1952 London Smog is believed to have cause more than 4,000 excess deaths (Hunt et al., 2003; Bell et al., 2004). Although events like the 1952 London Smog proved catastrophic to human health, such events led to the establishment of legislation (for example, the Clean Air Act in 1956 in the United Kingdom and in 1970 in the United States) to improve air quality. Ambient air quality in high income countries (HIC) has improved dramatically, e.g., airborne particulate matter ≤ 2.5 μm in aerodynamic diameter (PM2.5) in the US declined by 41% from 2000 to 2017 (EPA, 2018). However, events similar to the 1952 London Smog have been frequently observed in the cities of developing countries in recent years (CNN, 2014a; WHO, 2014; The Guardian, 2015).
A recent study showed that ambient air pollution alone accounts for more than 3 million premature deaths worldwide (Lelieveld et al., 2015; WHO, 2016). However, Low and Middle Income Countries (LMIC) account for most (~87%) of this disease burden (WHO, 2016). Air pollution in the megacities of these countries has risen to the levels of public health hazards forcing the cities to take emergency measures, such as issuing red alerts and vehicle-rationing interventions (VRI) (CNN, 2014a,b, 2016). For example, Delhi and Beijing are two of the most polluted cities, where annual average concentration of PM2.5 was many-fold higher than the WHO standards (WHO, 2014). These two cities have implemented interventions in recent years in attempts to mitigate the alarmingly high level of ambient air pollution. Using high-resolution satellite data and data from American Embassy in Beijing and Delhi, this research evaluates the efficacy of VRI in improving air quality and reduction in the associated mortality burden.
Policy Options and Implications
Attempts are being made to improve air quality in Delhi and Beijing. For example, at the turn of the 21st century, Delhi enforced the conversion of all gasoline- and diesel-based public transport vehicles to compressed natural gas (CNG), and closure of polluting industries (Narain and Krupnick, 2007). These interventions were not sustainable in reducing air pollution largely because of an unabated increase in emission sources (Kumar et al., 2016). Continuous deterioration of air quality forced the government of Delhi to take emergency measures in recent years. The city introduced a VRI (also known as even-odd formula) during the first 2 weeks of January 2016 (Table 1), followed by VRI during April 16 to 30, 2016. The VRI mandated that even and odd number plate vehicles drive on alternate days, restricting the number of vehicles plying the roads to half. Similarly, air pollution posed a significant health concern and put China's attempt to host the 2008 Beijing Olympics at risk. In order to host the Olympics, Beijing instituted radical measures to improve air quality. Like the Delhi intervention, VRI were implemented in Beijing in December 2015 and 2016 due to hazardous levels of air pollution (Table 1) (Chen et al., 2012). However, the efficacy of these interventions are not fully understood due to limited coverage of air pollution. Leveraging high resolution satellite data and limited in-situ monitored data, this research examines the effects of VRI on air pollution (re)distribution in two of the most polluted cities of the world.
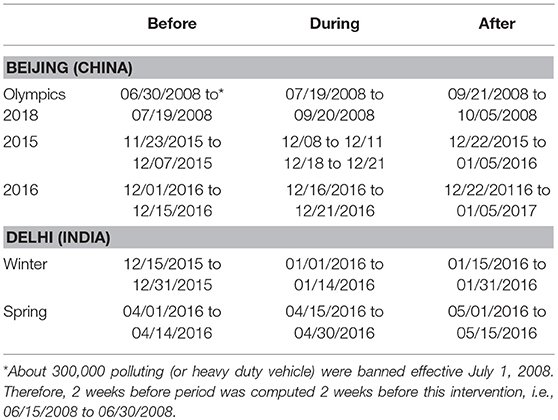
Table 1. Trial dates.
Methods and Materials
This research relied on data from three different sources: in-situ monitored hourly PM2.5 data at the American Embassies in Beijing and Delhi, NASA's satellite-based Aerosol Optical Depth (AOD) data, and in-situ monitored hourly meteorological data from the National Climatic Data Center.
AOD Retrieval
MODIS (or MODerate Resolution Imaging Spectroradiometer) data were acquired from NASA for both cities from 2000 to 2016. For this research, MOD04_3K products (Version 6.0) were used to extract AOD over land and ocean. The spatial resolution of these data is ~3 km at nadir. Methodological details concerning the retrieval of AOD using radiative transfer models are detailed elsewhere (Levy et al., 2007).
NCDC Data
Integrated Hourly Surface meteorological data were acquired from the National Climatic Data Center (NCDC) (NCDC, 2015).
AOD-NCDC Integration
Given low intra-city variability in weather conditions at a given point in time, all AOD data points ± 1.5 h timestamp of meteorological data were assigned the same value.
Data Integration for Empirical Model
Federal Reference Method (FRM) approved instruments are deployed at the American Embassies in Delhi and Beijing, which monitor and record data in real-time (AirNow, 2017). The instruments have been operational since 2008 in Beijing, and since 2014 in Delhi. AOD-NCDC data were collocated with the PM2.5 data from the instruments deployed at the American Embassies. All AOD data points within 0.015° (~1.5 km) distance of the monitoring site (i.e., American Embassy in respective cities) and 1 h time interval of PM2.5 time interval were averaged to match the temporal resolution of PM2.5 data. Given overpass time of Terra satellite is about 10:30 a.m. and Aqua satellite 1:30 p.m., only 1 h PM2.5 was matched for each day's AOD. This resulted in 66 matched data points for Delhi and more than 600 data points for Beijing. Likewise, hourly metrological data acquired from NCDC were collocated with the AOD-PM2.5 data. Since most meteorological conditions that are correlated with AOD are collinear, factor analysis was conducted to group them into factors of correlated meteorological conditions. As shown in Table S1, the first two factors alone accounted for ~97% of the total variability. Therefore, these two factors were used for developing an empirical relationship between ground monitored PM2.5 and satellite-based AOD. The first factor is dominated by dew point and surface temperature, which has high inverse loading (of its correlation with the factor) for sea level atmospheric pressure in Delhi. Generally, this combination is considered as a proxy of boundary layer height and degree of air pollution dispersion. The second factor is dominated by relative humidity and provides information on water vapor concentration that can greatly affect AOD (Kumar et al., 2007), and account for column abundance of water vapor component of AOD. For Beijing, surface temperature has high positive loading and relative humidity has high negative loading.
AOD-PM2.5 Empirical Model
Employing the city-specific autoregressive model [implemented using the xtreg procedure in Stata (STATA, 2015)], observed PM2.5 was predicted with respect to AOD, two factors of meteorological conditions, adjusting for monthly trend. Given temporal variability in AOD and metrological data, day-specific random effects were introduced to account for intra-day clustering., as
where yit ~ PM2.5 concentration at ith site at tth time; τit is AOD at ith site on tth day; Mit is the matrix of factor (two factors in this research) scores of meteorological conditions; and m is month number of the year (1 = January and 12 ~ Dec) used to account for seasonal dependence of PM2.5; u ~ νi + Θt + εit, which has three components: νi is site-specific random effect; Θt is day specific random effects, and εitis white noise ~ (0; σ2). These models have been tested and cross-validated using in-situ (or ground monitored PM2.5 data) in both high and low pollution environment, such as Cleveland, OH (USA) and Delhi (India).
Two models were run separately for each city. AOD, factors of meteorological conditions and seasonality accounted for 71% and 67% variability in PM2.5 in Delhi and Beijing, respectively (Table S2). Given the focus of research on short-term changes in air pollution, land-use and land-cover (LULC) as these are unlikely to change within short period of time, and certainly not within weeks and months. Predicted and observed PM2.5 for both cities are shown in Figures 1A,B. Using the parameters of these empirical models, daily PM2.5 was predicted using AOD and meteorological conditions from 2000 to 2016 for both cities under the assumption that the empirical relationship between PM2.5 and AOD observed at American Embassy is applicable to all areas around each city included in the analysis.
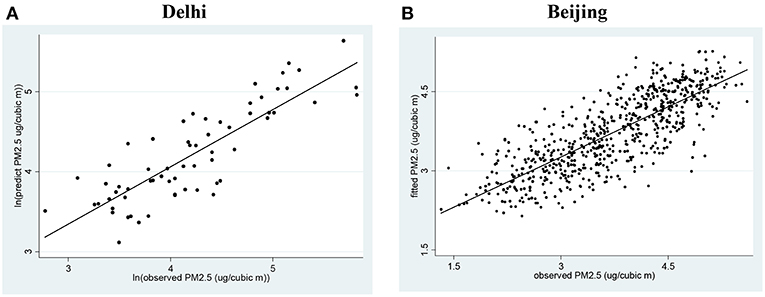
Figure 1. Hourly observed and predicted PM2.5 in Delhi and Beijing. (A) Based on 2014–15 PM2.5 data monitored at American Embassy in New Delhi, India. (B) Based on 2008–2015 PM2.5 data monitored at American Embassy.
Assessing Mortality Burden
Based on the meta-analysis of epidemiological studies, WHO has developed cardiovascular morality burden with respect to airborne PM2.5 (WHO, 2016), which suggests a 0.5% increase in mortality with every 10 μg/m3 increase in PM2.5 from the base line 24 h average threshold of PM2.5 established by WHO, i.e., 25 μg/m3. Using these guidelines, excess mortality (from the baseline) was computed as:
Where Δy is % excess mortality; x is observed PM2.5 and α ~ 24 h average WHO threshold of PM2.5.
Approaches for Assessing the Efficacy of VRI
Two approaches were used to assess the efficacy of VRIs: a) longitudinal: comparison of PM2.5 in the city 2 weeks before, during and 2 weeks after the intervention, and b) cross-sectional: comparison of PM2.5 within the city (i.e., ≤ 25 km from the city center) with the PM2.5 outside the city (i.e., areas between 25–50 km and 50–75 km), which were outside the jurisdiction and scope of the intervention. The main assumption is that the intervention will have the highest impact inside the city, moderate impact in the transition zone (i.e., 25 and 50 km), and little impact in the areas outside the city, which were not subject to these interventions, adjusting for meteorological conditions.
Results
The annual average concentrations of PM2.5 monitored at the American Embassies in Delhi and Beijing in 2014–15, were 117.5 and 90.5 μg/m3, respectively. There is a strong seasonal pattern in PM2.5 distribution in both cities as well as daily variability (Figure 1). For example, the daily average concentration of PM2.5 can exceed 400 μg/m3 especially in December and January in both cities. While winter monthly PM2.5 is significantly lower in Beijing than in Delhi, summer PM2.5 in Delhi is lower than that in Beijing (Figure 1A). Meteorological conditions, mainly higher temperature (and low atmospheric pressure) in Delhi that facilitates dispersion can be partly responsible for lower concentration of PM2.5 in summer as compared to Beijing. Moreover, frequent high levels of rain in Delhi during Monsoon can scavenge (drain) airborne particles during summer (Kumar et al., 2007).
Both cities have implemented VRIs several times (Table 1). Partial vehicle interventions in Beijing began on July 1, 2008, banning about 300,000 heavy-duty polluting vehicles. Air pollution in Beijing was examined for four periods: (a) 2 weeks before the intervention, (b) partial intervention, (c) during the Olympics (07/19/2008 to 09/20/2008), and (d) 2 weeks after the Olympics. Since AOD retrievals using satellite data were not possible due to extreme foggy conditions in Beijing during winter months, only in-situ monitored data from the American Embassy were used to examine PM2.5 before, during and after the interventions implemented during winter months in 2015 and 2016.
VRI in the City Center Using in-situ Data
The average PM2.5 level at the American Embassy in Beijing during the partial intervention before the Olympics (i.e., June 30 to July 19, 2008) was 108 μg/m3, which accounted ~4.2% excess mortality (Table 2A). Two weeks before the introduction of full fledged interventions, PM2.5 concentration declined 32%, which further declined to 70.9 μg/m3 during the Olympics. PM2.5 levels in the city were still about three times higher than the daily and annual average PM2.5 thresholds (i.e., 25 μg/m3) established by the World Health Organization (WHO). PM2.5 levels 2 weeks after the Olympics were higher than those 2 weeks before the Olympics. This increase however was 8.3%. However, during the 2015 and 2016 VRI, PM2.5 in the city increased, which accounted for 7.5 and 11.8% excess mortality in 2015 and 2016, respectively.
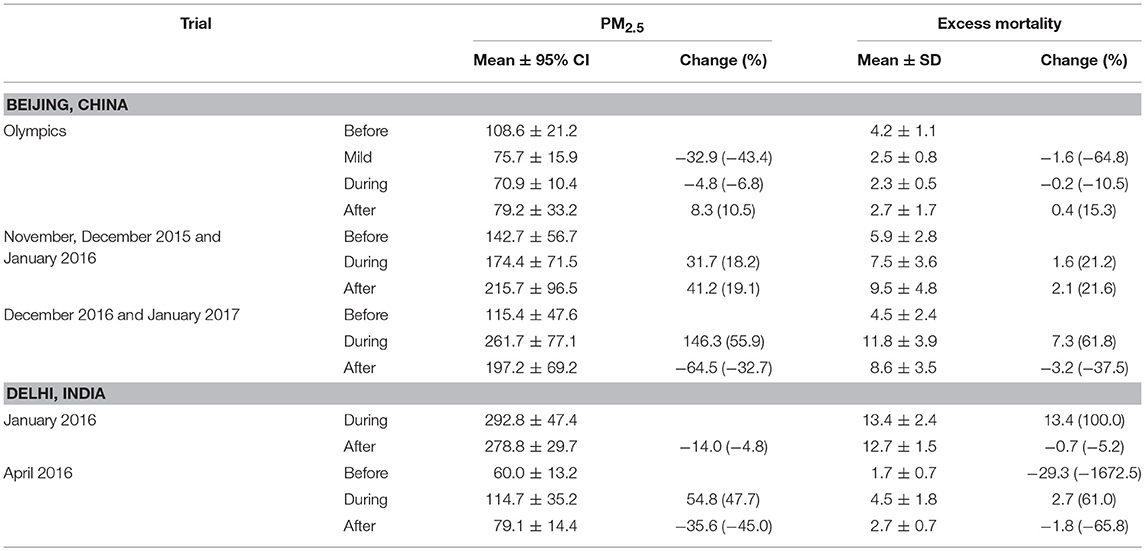
Table 2A. Average PM2.5 (measured in μg/m3) in Beijing and Delhi 2 weeks before, during and 2 weeks after the vehicle rationing intervention.
PM2.5 level in Delhi (at the American Embassy) were not available 2 weeks before the January 2016 intervention. However, PM2.5 in Delhi during the intervention was 292.8 μg/m3, which was significantly higher than the concentration observed 2 weeks after the intervention. Nonetheless, the excess mortality burden in the city during and after the January 2016 was 13.4 and 12.7%, respectively. The April 2016 intervention was also ineffective, because PM2.5 level before the intervention was 60 μg/m3, which almost doubled (i.e., 114.7 μg/m3; excess mortality burden ~4.5%) (Table 2A). PM2.5 in the city declined to 79 μg/m3 after the intervention period, but still accounted for 2.7% excess mortality.
VRI Inside and Outside the City Using Satellite Data
PM2.5 estimates derived using the satellite data were computed before, during and after VRI within 25 km, 25–50 and 50–75 km distance from the city center in both cities. In Beijing, PM2.5 concentration 2 weeks before the VRI (during the Olympics) was 50 μg/m3, which declined to 39.2 μg/m3 (or 52% reduction) during the intervention period (i.e., 2008 Olympic period 07/19/2008 to 09/17/2008) (Figures 3, 4A and Table 2B). Although this decline was significant, PM2.5 concentration was still higher than the 24 h threshold of PM2.5 (i.e., 25 μg/m3), translating to 0.7% excess cardiopulmonary mortality (Lim et al., 2012) (Table 2B and Figure 2). Longitudinal comparison suggests that the average PM2.5 within 25 km inside the city increased from 39.2 μg/m3 (during Olympics) to 59.8 μg/m3 2 weeks after the Olympics, suggesting that 21% of the cleaning during the Olympics disappeared within 2 weeks after the interventions during the Olympics. The effect of intervention was more prominent in the areas within 50–75 km outside the city (average concentration of PM2.5 was ~26.9 μg/m3 during the Olympics), suggesting city pollution could be one of the contributing factor in the areas outside the city (Figure 4A).
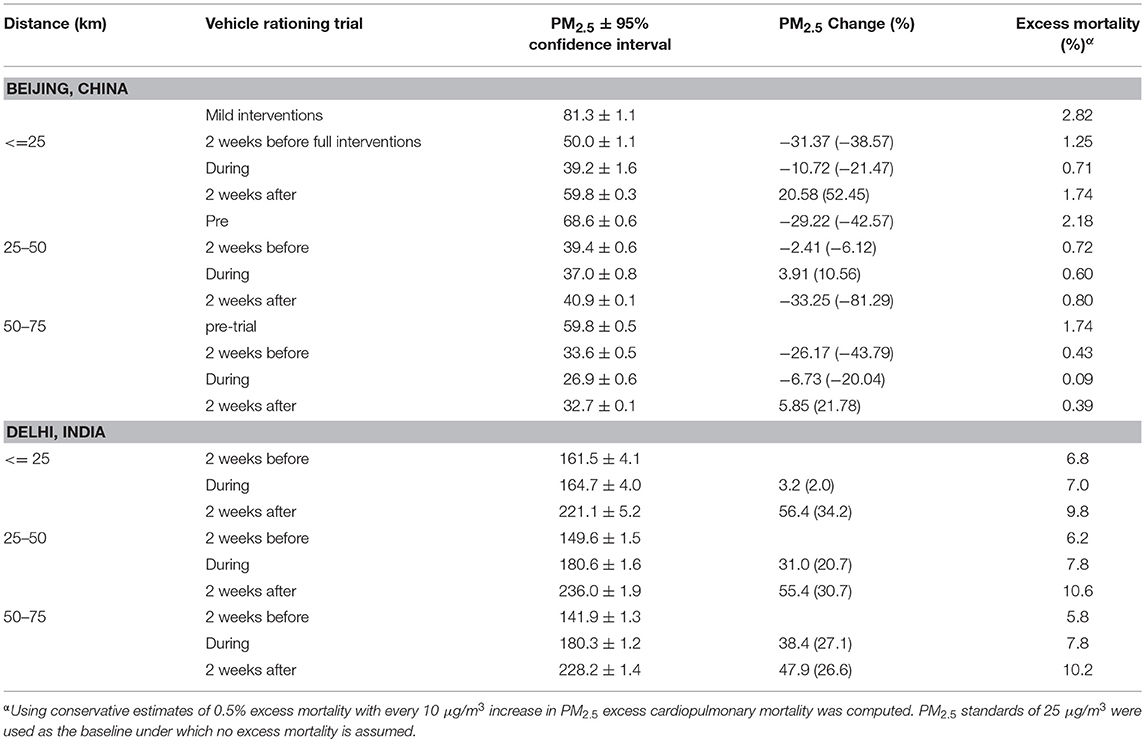
Table 2B. Average PM2.5 (measured in μg/m3) in Beijing (June 30 to October 5, 2008) and Delhi 2 weeks before, during and 2 weeks after the vehicle rationing intervention in 2015–2016 winter (i.e., December 15, 2015 to January 31, 2016).
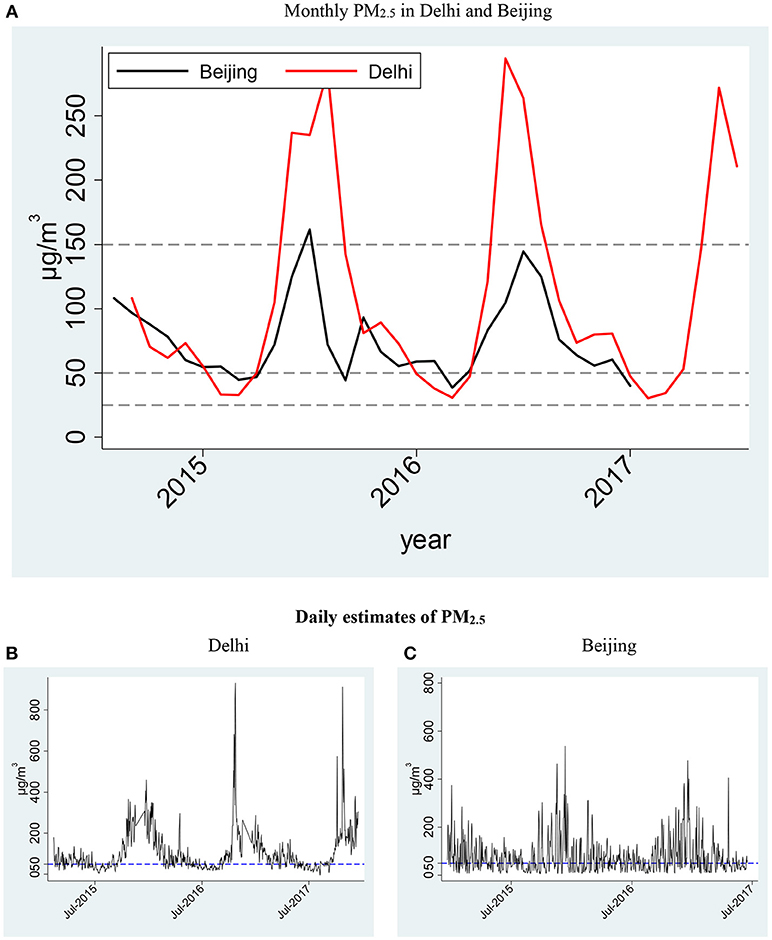
Figure 2. (A) Monthly concentration of PM2.5 monitored in American Embassy Premise in Delhi (B) and Beijing (C).
In Delhi, the average PM2.5 concentrations within 25 km around the city before, during and after the intervention were >160 μg/m3, six times higher than the 24 h WHO standards. In contrast to Beijing, there was a small increase of 2% instead of decrease in Delhi during the intervention, and 34% increase during 2 weeks after the intervention (Table 2B). The difference in the baseline (i.e., 2 weeks before the trial) PM2.5 inside and outside Delhi was 20 μg/m3 (Figures 3B, 4B). The areas outside the city (i.e., 50–75 km away from the city center and outside the jurisdiction of the city and outside the scope of the intervention) witnessed a 27% increase in PM2.5 during the intervention in Delhi (Figure 3B). If the rate of increase outside the city is extrapolated to the areas inside the city, the levels of PM2.5 in the city could have been 208 μg/m3 without the VRI. Thus, the intervention in Delhi contained a 25% (i.e., 27% increase in areas outside the city−2% increase in the city), or 44 μg/m3, increase in PM2.5. The PM2.5 concentration monitored at the American Embassy in Delhi was higher than that average concentration within 25 km around the city center. The concentration in the city (within 25 around the city center) increased to 221 μg/m3 (34% increase) during 2 weeks after the intervention (i.e., January 16–31, 2016), which could have been responsible for 9.8% excess mortality due to cardiopulmonary mortality (Beelen et al., 2014b) (Table 2B).
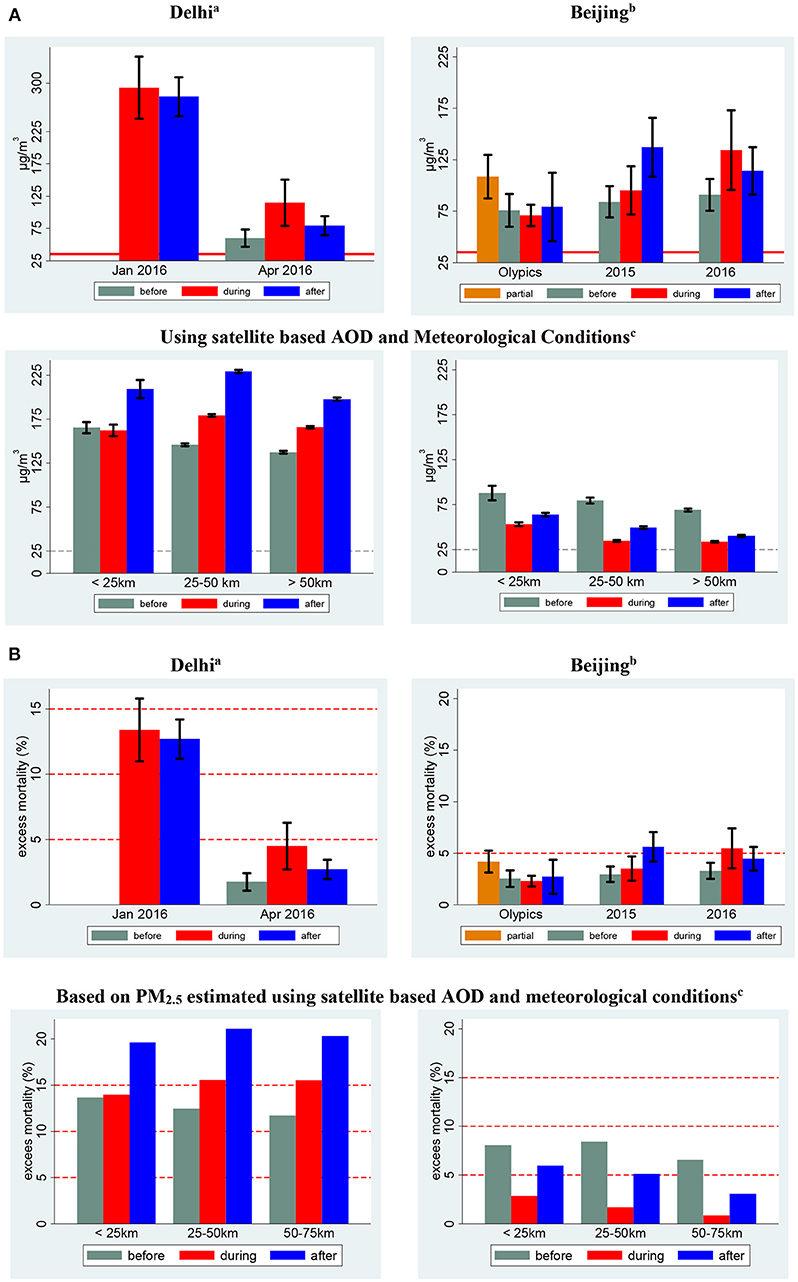
Figure 3. (A) PM2.5 (μg/m3) concentration before, during and after vehicle rationing programs in Beijing and Delhi. (B) Mortality burden of airborne PM2.5 concentration before, during and after the VRI. aMonitoring trial dates in Delhi refer to the following time frames: January−01/01/2016 to 01/14/2016; April−04/15/2016 to 04/30/2016. bMonitoring trial dates in Beijing refer to the following time frames: 2015−12/08/2015 to 12/11/2015, 12/18/2015 to 12/21/2015; 2016−12/16/2016 to 12/21/2016. cSatellite based estimates for Delhi were computed December 2015 and January 2016 and for Beijing before (06/30/2008 to 07/19/2008), during (07/19/2008 to 09/20/2008) and after (09/21/2008 to 10/05/2008) the 2008 Olympics.
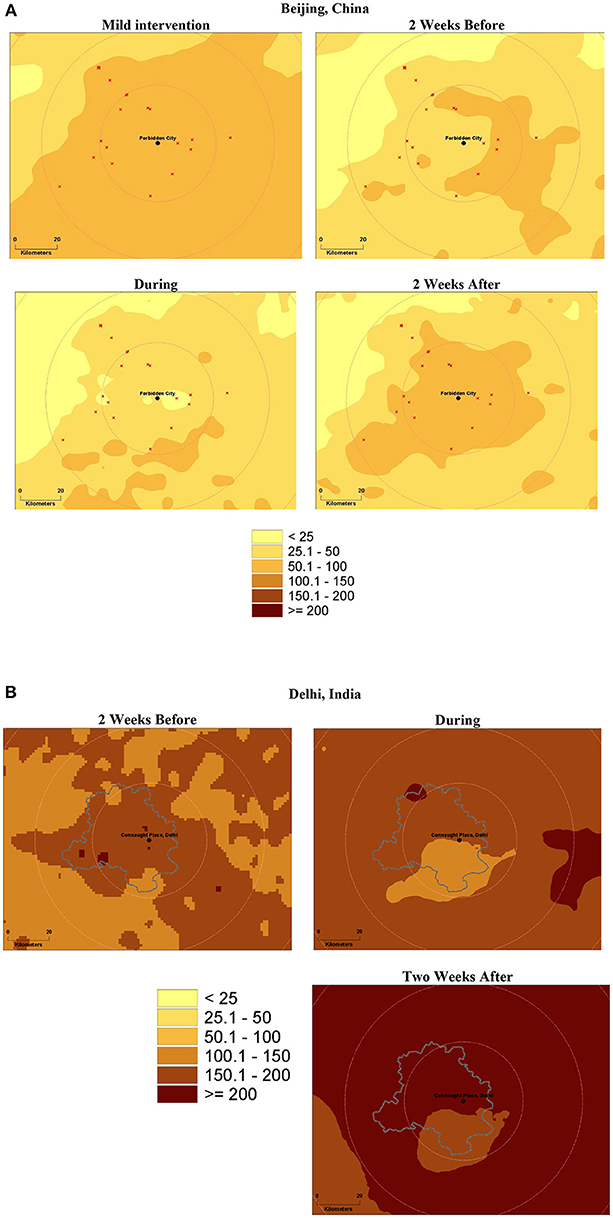
Figure 4. PM2.5 (μg/m3) distribution 2 weeks before, during and two after the even-odd traffic rationing programs and Delhi, India (A) Beijing, China (B).
Discussion
Both cities witness hazardous levels of PM2.5, especially during winter months, which accounts for a significant burden of excess mortality and morbidity. Exposure to PM2.5 (one of the measures of air pollution) initiates oxidative stress, thus activating innate responses and a downstream cascade of biophysiological changes, including inflammation and lipid peroxidation (Donaldson et al., 2005; Borm et al., 2007; Costa et al., 2014; Newby et al., 2015; Ambroz et al., 2016). A vast body of literature provides overwhelming evidence that both short- and long-term PM2.5 exposure accounts for a significant burden of cardiopulmonary mortality and morbidity (Pope et al., 2002; Beelen et al., 2014a). While ad-hoc interventions have been introduced to reduce air pollution, their effects are short-lived. Both cities in this study witnessed excess cardiopulmonary mortality even during the winter interventions.
The effects of vehicle related policies on air pollution have been subject to research scrutiny (Cai and Xie, 2011; Chen et al., 2012; Gallego et al., 2013; Yao et al., 2013; Kumar et al., 2017). This paper makes a novel contribution by quantifying the effects of VRI on air pollution at fine spatiotemporal scales and its associated disease burden in two of the most polluted cities in the world. The findings of this research are consistent with the literature on effects of VRI in Beijing, suggesting a decline in air pollution during the interventions in Beijing, and increase in air pollution after the Beijing Olympics (Chen et al., 2012). A study in Delhi showed an increase in air pollution (both PM2.5 and PM10) in Delhi during the pre-trial days, and but improvement during the peak hours (Kumar et al., 2017), which is inconsistent with the findings of this research. Nonetheless, the data types and their spatiotemporal scales of these studies are different, which can explain the inconsistency in these findings.
Policy Implications
The results reported in this study have important policy implications.
First, as documented in the WHO report, 2.6 million (87%) of 3 million (ambient) air pollution-related deaths are expected to be in LMIC, which represent 82% of the world population (WHO, 2016). Ambient PM2.5 exposure accounts for 40, 40, 11, and 6% of the mortality caused by ischemic heart disease, stroke, chronic obstructive pulmonary disease (COPD), and lung cancer, respectively (WHO, 2016). This disease burden may have been underestimated because once PM2.5 enters the circulatory system, it can distribute to most organs, including the brain. Furthermore, both fine and coarse particles (PM2.5 and PM10) can make their way to the digestive tract when trapped in saliva, and can be deposited onto the ocular surface as well. Therefore, restricting the PM2.5 burden to cardiopulmonary diseases alone is likely to underestimate the mortality and morbidity burden of PM2.5. Second, both cities have been introducing interventions to improve air quality since 2001. However, as demonstrated in the literature ad-hoc VRIs do not yield long-term improvements in air quality (Chen et al., 2012).
Actionable Recommendations
Emission Mitigation
Mitigation strategies must target all sources, including combustion sources (such as industries, thermal plants, and automobiles) and informal activities (e.g., discouraging solid fuel usage, and trash and crop burning) that promote air pollution (Zhang et al., 2017). Since fossil-fuel based combustion powers automobiles, thermal plants, electricity generation, and manufacturing, LMIC need to invest in infrastructure that relies on cleaner and greener energy sources, such as use of electric public transport and harnessing solar and wind energy. A dramatic decrease in air pollution is unlikely to be achieved in short-term because implementing these strategies will require time to develop and enact legislations, and capital investment. However, preventive strategies can be developed and implemented in the short-term.
Preventive Strategies
Real-time air pollution surveillance and associated (individual- and disease-specific) risk is essential for developing preventive strategies. Attempts are being made to improve air pollution monitoring worldwide. For example, American Embassies monitor air pollution in India and China. On January 25, 2015, the U.S. Government committed to implementing the EPA's AIRNow-International program (showing PM2.5 levels, Air Quality Index and associated health hazard index on hourly bases), focusing on the dissemination of information to help urban residents in LMIC to reduce their exposure to harmful levels of air pollution, and enable urban policy planners to implement corrective strategies for improving ambient air quality (The White House, 2015).
Satellite based-AOD and optimal interpolation techniques can be used to develop location-specific estimates of air pollution (Kumar et al., 2013). Using this approach, daily estimates of ambient PM2.5 and AOD were computed in and around Delhi and Beijing, and were made available to the general public and other stakeholders using a user-friendly interactive online system: precise.miami.edu. Such data can formulate bases for computing short- and long-term ambient air pollution exposure needed to develop disease-specific risk estimates, which are critically important for engaging individuals and communities in taking measures that can avoid/reduce their exposure when the anticipated risk is high. We propose various policy measures. However, the validity of such measures in LMIC is yet to be tested.
Limitations
The results reported in this study must be interpreted in the light of the following limitations. First, results from Delhi and Beijing are not comparable to each other, not only because intervention seasons (especially for the 2008 Summer Olympics) were different, but also because Beijing took many other measures to clean the air, including relocation of major manufacturing plants before the Olympics (Chen et al., 2012). Second, mortality burden presented in the paper can be biased for two reasons: (a) GDB was derived based on meta-analyses, which are biased toward research conducted in HIC and (b) the air pollution mortality burden is restricted to cardiopulmonary mortality only. However, emerging literature suggests systematic toxicity of airborne particulate matter given PM2.5 contains a significant fraction of nano-particles (Figure S1), which have potential to pass blood brain barriers and the fraction of PM mass trapped in salvia is ingested and implicated in the modification of gut microbiome and intestinal inflammatory processes (Salim et al., 2014). Third, mortality burden estimate can be subject to bias given empirical model used to develop this burden accounted for about two-thirds of the total variances. Fourth, the empirical model was developed based on time-series data at one location (i.e., American Embassy) in each city, which can be subject to bias due to variations in aerosol types from different emission sources and their relationship with the in-situ monitored PM2.5 (Kumar et al., 2007). However, these biases are likely to remain constant in the assessment of PM2.5 and associated morality burden within short time intervals, because the location of emission sources is likely to be the same in pre-, during-, and post-VRI periods except the transported sources. Therefore, the results of this study must be interpreted in the light of this limitations, especially in the areas farther away from the city center of each city. Finally, PM2.5 measurement at a given location and time is the net outcome of location- and time-specific sources of emission, dispersion and transport of air pollution. While interventions directly target emission (from sources), the rate of dispersion and transport (to and from) is largely affected by meteorological conditions and urban morphology. Therefore, 2-week long VRI is too short to adequately assess their net effects, because these effects can spill over beyond 2 weeks especially for dispersion and regional and long-distance transport of air pollution often observed across Atlantic and Pacific oceans.
Conclusions
While VRI to host the 2008 Beijing Olympics were effective, the interventions implemented in 2015 and 2016 in Beijing and in 2016 in Delhi were short-lived and ineffective to improve air quality. Given unabated increase in air pollution in Delhi and Beijing, air pollution in these cities poses a major health-hazard. Short- and long-term preventive and management strategies, such as emission mitigation and real-time air pollution monitoring tools, are needed to improve air quality and protect public health.
Author Contributions
All authors listed have made a substantial, direct and intellectual contribution to the work, and approved it for publication.
Funding
This work, in part, was supported by the National Institute of Health (NIH) grants # R21 ES014004 and R01EY026174.
Conflict of Interest Statement
The authors declare that the research was conducted in the absence of any commercial or financial relationships that could be construed as a potential conflict of interest.
Supplementary Material
The Supplementary Material for this article can be found online at: https://www.frontiersin.org/articles/10.3389/fenvs.2019.00015/full#supplementary-material
References
AirNow (2017). AirNow Department of States. Available online at: https://airnow.gov/index.cfm?action=airnow.global_summary (Accessed October 10, 2016).
Ambroz, A., Vlkova, V., Rossner, P., Rossnerova, A., Svecova, V., Milcova, A., et al. (2016). Impact of air pollution on oxidative DNA damage and lipid peroxidation in mothers and their newborns. Int. J. Hyg. Environ. Health 219, 545–556. doi: 10.1016/j.ijheh.2016.05.010
Beelen, R., Raaschou-Nielsen, O., Stafoggia, M., Andersen, Z. J., Weinmayr, G., Hoffmann, B., et al. (2014a). Effects of long-term exposure to air pollution on natural-cause mortality: an analysis of 22 European cohorts within the multicentre ESCAPE project. Lancet 383, 785–795. doi: 10.1016/S0140-6736(13)62158-3
Beelen, R., Stafoggia, M., Raaschou-Nielsen, O., Andersen, Z. J., Xun, W. W., Katsouyanni, K., et al. (2014b). Long-term exposure to air pollution and cardiovascular mortality an analysis of 22 European cohorts. Epidemiology 25, 368–378. doi: 10.1097/EDE.0000000000000076
Bell, M. L., Davis, D. L., and Fletcher, T. (2004). A retrospective assessment of mortality from the London smog episode of 1952: the role of influenza and pollution. Environ. Health Perspect. 112, 6–8. doi: 10.1289/ehp.6539
Borm, P. J., Kelly, F., Künzli, N., Schins, R. P., and Donaldson, K. (2007). Oxidant generation by particulate matter: from biologically effective dose to a promising, novel metric. Occup. Environ. Med. 64, 73–74. doi: 10.1136/oem.2006.029090
Cai, H., and Xie, S. (2011). Traffic-related air pollution modeling during the 2008 Beijing Olympic Games: the effects of an odd-even day traffic restriction scheme. Sci. Total Environ. 409, 1935–1948. doi: 10.1016/j.scitotenv.2011.01.025
Chen, Y. Y., Jin, G. Z., Kumar, N., and Shi, G. (2012). Gaming in air pollution data? Lessons from China. B. E. J. Econ. Anal. Pol. 12. doi: 10.1515/1935-1682.3227. [Epub ahead of print].
CNN (2014a). Top 20 Most Polluted Cities in the World. Available online at: https://www.cnn.com/2014/05/08/world/asia/india-pollution-who/ (Accessed May 10, 2014).
CNN (2014b). When Air Becomes a Public Health Hazard. Available online at: https://www.cnn.com/2014/05/04/opinion/farber-air-pollution/index.html?hpt=hp_t4 (Accessed May 4, 2014).
CNN (2016). Delhi Residents Give Up Cars to Stop Toxic Air Pollution. Available online at: https://money.cnn.com/2016/01/01/news/delhi-india-cars-autos-air-pollution/index.html (Accessed February 26, 2016).
Costa, L. G., Cole, T. B., Coburn, J., Chang, Y. C., Dao, K., and Roque, P. (2014). Neurotoxicants are in the air: convergence of human, animal, and in vitro studies on the effects of air pollution on the brain. Biomed. Res. Int. 2014:736385. doi: 10.1155/2014/736385
Donaldson, K., Mills, N., MacNee, W., Robinson, S., and Newby, D. (2005). Role of inflammation in cardiopulmonary health effects of PM. Toxicol. Appl. Pharmacol. 207, 483–488. doi: 10.1016/j.taap.2005.02.020
EPA (2018). Our Nation's Air. Available online at: https://gispub.epa.gov/air/trendsreport/2018/#home (Accessed December 2, 2018).
Gallego, F., Montero, J. P., and Salas, C. (2013). The effect of transport policies on car use: evidence from Latin American cities. J. Public Econ. 107, 47–62. doi: 10.1016/j.jpubeco.2013.08.007
Hunt, A., Abraham, J. L., Judson, B., and Berry, C. L. (2003). Toxicologic and epidemiologic clues from the characterization of the 1952 London smog fine particulate matter in archival autopsy lung tissues. Environ. Health Perspect. 111, 1209–1214. doi: 10.1289/ehp.6114
Kumar, N., Chu, A., and Foster, A. (2007). An Empirical Relationship between PM2.5 and Aerosol Optical Depth in Delhi Metropolitan. Atmos. Environ. 41, 4492–4503. doi: 10.1016/j.atmosenv.2007.01.046
Kumar, N., Liang, D., Comellas, A., Chu, A. D., and Abrams, T. (2013). Satellite-based PM concentrations and their application to COPD in Cleveland, OH. J. Exposure Sci. Environ. Epidemiol. 23, 637–646. doi: 10.1038/jes.2013.52
Kumar, N., Linderman, M., Chu, A., Tripathi, S., Foster, A. D., Liang, D., et al. (2016). Environmental interventions and air pollution (re)distribution in Delhi, India. Environ. Pol. Law 46, 77–96.
Kumar, P., Gulia, S., Harrison, R. M., and Khare, M. (2017). The influence of odd-even car trial on fine and coarse particles in Delhi. Environ Pollut. 225, 20–30. doi: 10.1016/j.envpol.2017.03.017
Lelieveld, J., Evans, J. S., Fnais, M., Giannadaki, D., and Pozzer, A. (2015). The contribution of outdoor air pollution sources to premature mortality on a global scale. Nature 525, 367–371. doi: 10.1038/nature15371
Levy, R. C., Remer, L. A., and Dubovik, O. (2007). Global aerosol optical properties and application to Moderate Resolution Imaging Spectroradiometer aerosol retrieval over land. J. Geophys. Res. Atmos. 112. doi: 10.1029/2006jd007815. [Epub ahead of print].
Lim, S. S., Vos, T., Flaxman, A. D., Danaei, G., Shibuya, K., Adair-Rohani, H., et al. (2012). A comparative risk assessment of burden of disease and injury attributable to 67 risk factors and risk factor clusters in 21 regions, 1990-2010: a systematic analysis for the Global Burden of Disease Study 2010. Lancet 380, 2224–2260. doi: 10.1016/S0140-6736(12)61766-8
Narain, U., and Krupnick, A. (2007). The Impact of Delhi's CNG Program on Air Quality. Washington, DC: Resources of for the Future.
NCDC (2015). NOAA National Operational Model Archive & Distribution System. Available online at: https://nomads.ncdc.noaa.gov/ (Accessed February 12, 2015).
Newby, D. E., Mannucci, P. M., Tell, G. S., Baccarelli, A. A., Brook, R. D., Donaldson, K., et al. (2015). Expert position paper on air pollution and cardiovascular disease. Eur. Heart J. 36, 83–93b. doi: 10.1093/eurheartj/ehu458
Pope, C. A., Burnett, R. T., Thun, M. J., Calle, E. E., Krewski, D., Ito, K., et al. (2002). Lung cancer, cardiopulmonary mortality, and long-term exposure to fine particulate air pollution. JAMA 287, 1132–1141. doi: 10.1001/jama.287.9.1132
Salim, S. Y., Kaplan, G. G., and Madsen, K. L. (2014). Air pollution effects on the gut microbiota: a link between exposure and inflammatory disease. Gut Microbes 5, 215–219. doi: 10.4161/gmic.27251
The Guardian (2015). Beijing's Smog ‘Red Alert' Enters Third Day as Toxic Haze Shrouds City. Available online at: https://www.theguardian.com/world/2015/dec/21/beijings-smog-red-alert-enters-third-day-as-toxic-haze-shrouds-city (Accessed January 6, 2016).
The White House (2015). U.S. and India Climate and Clean Energy Cooperation. Available online at: https://www.whitehouse.gov/the-press-office/2015/01/25/fact-sheet-us-and-india-climate-and-clean-energy-cooperation (Accessed May 3, 2015).
WHO (2014). Ambient (Outdoor) Air Pollution in Cities Database 2014. Available online at: https://www.who.int/phe/health_topics/outdoorair/databases/cities/en/ (Accessed May 10, 2014).
WHO (2016). Ambient Air Pollution: A Global Assessment of Exposure and Burden of Disease. Geneva: World Health Organization.
Yao, Z., Zhang, Y., Shen, X., Wang, X., Wu, Y., and He, K. (2013). Impacts of temporary traffic control measures on vehicular emissions during the Asian games in Guangzhou, China. J. Air Waste Manag. Assoc. 63, 11–19. doi: 10.1080/10962247.2012.724041
Keywords: air quality, health hazards, environmental interventions, particulate matter, health disparities, systematic toxicity
Citation: Sinha J and Kumar N (2019) Mortality and Air Pollution Effects of Air Quality Interventions in Delhi and Beijing. Front. Environ. Sci. 7:15. doi: 10.3389/fenvs.2019.00015
Received: 01 November 2018; Accepted: 21 January 2019;
Published: 26 February 2019.
Edited by:
Jens Borken-Kleefeld, International Institute for Applied Systems Analysis, AustriaReviewed by:
Eleni Drakaki, National Technical University of Athens, GreeceEduardo Landulfo, Instituto de Pesquisas Energéticas e Nucleares (CNEN), Brazil
Copyright © 2019 Sinha and Kumar. This is an open-access article distributed under the terms of the Creative Commons Attribution License (CC BY). The use, distribution or reproduction in other forums is permitted, provided the original author(s) and the copyright owner(s) are credited and that the original publication in this journal is cited, in accordance with accepted academic practice. No use, distribution or reproduction is permitted which does not comply with these terms.
*Correspondence: Naresh Kumar, bmt1bWFyQG1pYW1pLmVkdQ==; Website: precise.miami.edu