- 1Centro de Investigaciones del Mar y la Atmósfera, Consejo Nacional de Investigaciones Científicas y Técnicas, Universidad de Buenos Aires, Buenos Aires, Argentina
- 2Departamento de Ciencias de la Atmósfera y los Océanos, Facultad de Ciencias Exactas y Naturales, Universidad de Buenos Aires, Buenos Aires, Argentina
- 3Instituto Franco Argentino sobre Estudios de Clima y sus Impactos (IFAECI-UMI3351), Centre National de la Recherche Scientifique, Buenos Aires, Argentina
Changes in the summer rainfall and 200-hPa zonal winds (U200) in the South American Altiplano are studied from 1902 to 2018 using three different reanalysis datasets and simulations from 14 climate models of the fifth phase of the Coupled Model Intercomparison Project (CMIP5). No significant trend in rainfall was identified from GPCC reanalysis data over that period. On the other hand, regional U200 trends estimated from 20C and ERA20C reanalyses and from CMIP5 Historical simulations are significant and positive over the 1902–2005 period. However, the trends seem to be dependent on the reanalysis dataset and period considered. While no significant U200 trend is detected in simulations forced only by external natural sources, the mean trend is positive and significant in simulations forced only by the increment of anthropogenic greenhouse gas emissions. Therefore, a signal associated with the anthropogenic forcing of climate change has been detected in U200 trends in the Altiplano, but it is weak as compared with the internal climate variability. Singular value decomposition analyses based on both reanalyzed and simulated data were performed to describe the co-variability between rainfall in the Altiplano, regional U200 and global sea surface temperature (SST). The analysis confirms that negative rainfall anomalies in the Altiplano, associated with positive U200 anomalies, are related with positive SST anomalies mainly in the tropical Pacific-Indian Oceans. Simulations can reproduce observed relationships and confirm that natural variability explains the observed year-to-year variability. Simulations also confirm that anthropogenic forcing is a necessary condition to explain the positive trends detected in the co-variability between tropical SST and regional U200 anomalies. However, the large influence exerted by the South American Monsoon over the region can also affect sign and magnitude of the changes in the Altiplano. No significant relationship was found from CMIP5 simulations between poleward displacements of the global Hadley cell and regional U200 changes. Instead, South American Hadley cell displacements are significantly correlated with regional U200 changes. The latter might be an additional evidence of the combined influence of both tropical surface ocean and South America Monsoon on the circulation changes in the Altiplano in the global warming context.
Introduction
The South American Altiplano is characterized as a plateau of more than 4,000-m altitude, located in the Andes between 15° and 25°S. A distinctive seasonal cycle characterizes the rainfall in this region, with a wet season during austral summer (December-January-February, DJF) in association with the South American Monsoon System (e.g., Vera et al., 2006). Easterly moisture influx from the Amazon region into the Altiplano has been identified as the main moisture source (e.g., Garreaud, 1999). Rainy and dry episodes can be explained by circulation anomalies driven locally by the conditions of the Bolivian High, part of the South American Monsoon System, or remotely driven by tropical convection (Garreaud, 1999). Rainfall in this Andean region also exhibits significant variability on interannual, decadal, and interdecadal timescales. Rainfall anomalies are strongly related to upper-level wind anomalies, which in turn are at least partially explained by sea surface temperatures (SST) anomalies over the tropical sectors of both Pacific and Indian Oceans, including the El Niño-Southern Oscillation (ENSO) (e.g., Garreaud and Aceituno, 2001; Segura et al., 2016).
Tree-ring based rainfall reconstructions have documented that since the 1930s the large year-to-year rainfall variability over the Altiplano has been combined with a persistent negative trend that is unprecedent in the record (Morales et al., 2012). On the other hand, no consistent trend has been identified over the last 100 years from instrumental rainfall records (e.g., Neukom et al., 2015, and references therein). The lack of sufficiently dense enough networks of long-term instrumental observations has limited the long-term trend studies in the region. Despite these limitations, recent studies have used the well-known relationship between upper-level tropospheric zonal wind anomalies and precipitation anomalies in the Altiplano to assess climate changes in the region, using either reanalysis or climate model simulations (e.g., Minvielle and Garreaud, 2011; Neukom et al., 2015).
The lack of observational records of zonal winds at 200 hPa (U200), that is upper levels, over periods longer than 60 years, also prevents the study of its variability and trends. Nevertheless, such study can be done using long-term climate model simulations. Diaz and Vera (2018) assessed the ability of a set of climate models from the fifth phase of the Coupled Model Intercomparison Project (CMIP5, Taylor et al., 2012) to represent the differences in the climate conditions over the Altiplano between the paleoclimatic period between 1650 and 1699, and the recent Global Warming Period (1951–2000). While models have limitations in describing the Altiplano precipitation changes identified in previous studies (e.g., Morales et al., 2012), they can to some extent simulate the regional upper-level wind changes. Combining paleoclimatic reconstructions, instrumental observations, gridded datasets, and CMIP5 model simulations, Neukom et al. (2015) confirmed a significant relationship between precipitation anomalies in the Altiplano and U200 anomalies in the present climate (1965–2002), and also projected a precipitation reduction in future climate change scenarios.
The main physical processes explaining climate changes in the Altiplano are not fully understood. Some studies (e.g., Vuille et al., 2008) suggest a relationship between an intensification of the Hadley cell identified during the last part of twentieth century over South America and enhanced descending motion in the subtropics. However, considering the large influence that SST variability in the tropical oceans exerts on the regional climate in the Altiplano and that SST exhibit significant positive trends in association with global warming (e.g., IPCC, 2013), it is an open question whether changes in SST-related processes have an influence on climate trends in the Altiplano. In addition, there is high confidence in the expansion of the South America monsoon area in global warming scenarios (Christensen et al., 2013). However, it is not evident yet how those projected monsoon changes could affect the Altiplano region.
The 5th Climate Change Assessment Report of the Intergovernmental Panel on Climate Change (IPCC AR5) concludes that both atmosphere and ocean have significantly warmed during the Twentieth and Twenty-First centuries (IPCC, 2013). The recent global warming, combined with natural climate variability, has therefore significant implications for the water cycle at both global and regional scales. Through the assessment of different numerical experiments available in the CMIP5 dataset, the IPCC (2013) concluded that the recently observed global warming is likely related to the increasing anthropogenic emissions of greenhouse gases (GHG). However, it is still not clear why a negative precipitation trend would be expected in the Altiplano in association with an anthropogenically forced global warming. To our knowledge, no attribution studies of the anthropogenic forcing on the climate changes detected in the Altiplano have yet been made.
Therefore, the purpose of this paper is to study the changes in rainfall and U200 in the Altiplano during austral summer described by reanalysis datasets and CMIP5 simulations during the twentieth century and the beginning of the Twenty-First century. The study includes an assessment of the role of both anthropogenic and natural climate forcing in explaining the regional changes. In addition, an exploration is carried out on the role of the climate drivers in the Altiplano associated with tropical ocean conditions, as well as with the South American Monsoon System and Hadley cell, in explaining the changes. The paper is organized as follows: Data and Methods are discussed in section Data and Methods, section Trends describes the trend assessment, section Leading Patterns of Co-Variability discusses the leading patterns of co-variability between regional climate and tropical ocean conditions, while the changes in the mode activity are discussed in section Changes in Leading Patterns of Co-Variability. The influence of Hadley cell changes on regional climate is discussed in section Hadley Cell Changes, and conclusions are presented in section Discussion and Conclusions.
Data and Methods
Data
The study is based on global gridded monthly means of tropospheric zonal and meridional winds from 1949 to 2018 with a spatial resolution of 2.5° obtained from NCEP-NCAR reanalysis datasets (Kalnay et al., 1996) as well as monthly mean precipitation fields from 1902 to 2018 derived from the Global Precipitation Climatology Centre (GPCC) dataset with a spatial resolution of 1° (Schneider et al., 2011). An exploration of the historical precipitation records assimilated in the GPCC gridded dataset over the Altiplano region shows that it includes very few observations during the early decades of the period under study (Figure S1). Therefore, caution is taken in its use at local scales. Nevertheless, previous studies (e.g., Vera and Díaz, 2015) showed that this dataset can describe the main features of precipitation variability and change in South America reasonably well. Global gridded monthly-mean SST from the NOAA/ERSSTv5 dataset (Huang et al., 2017) from 1902 to 2018 are considered to describe surface ocean conditions with a spatial resolution of 2°.
Previous works have identified the regional U200 anomalies as a reliable proxy of rainfall anomalies in the Altiplano (e.g., Minvielle and Garreaud, 2011). Therefore, U200 anomalies are also used in this study as a proxy of Altiplano precipitation anomalies. Considering the limitations that reanalysis data can exhibit in describing the winds in the Altiplano, because it is a region with few available meteorological stations and with a very complex topography, two additional reanalysis datasets have been considered besides NCEP-NCAR reanalysis: ECMWF twentieth century reanalysis (ERA 20C, Poli et al., 2016), available from 1902 to 2010 with a spatial resolution of 1°, and the Twentieth century Reanalysis (20CR, Compo et al., 2011), available from 1902 to 2014 with a spatial resolution of 2°. The comparison among the results obtained with the three reanalysis datasets provides a better assessment of the uncertainty levels associated with the estimation of observed changes. However, it is important to consider that different numerical methodologies have been used to develop each of these reanalysis datasets that influence the spatial and temporal evolution of the reanalyzed U200 wind data. NCEP-NCAR reanalysis assimilates observations of winds, geopotential heights, surface pressure and temperature from in-situ stations, rawinsondes, and satellites, into an ocean-atmosphere fully coupled model. 20C reanalysis dataset only assimilates surface pressure observations into an ensemble Kalman filter based on an atmospheric model constrained by precomputed global estimates of SST and sea-ice concentrations. ERA20C reanalysis only assimilates observations of surface pressure and marine surface winds into an atmospheric general circulation model. It is then evident that NCEP-NCAR reanalysis is based on actual wind observations while ERA20C and 20C are not. On the other hand, while ERA20C and 20C reanalyses are extended over more than 100 years, NCEP-NCAR reanalysis encompasses 70 years only.
Climate Model Simulations
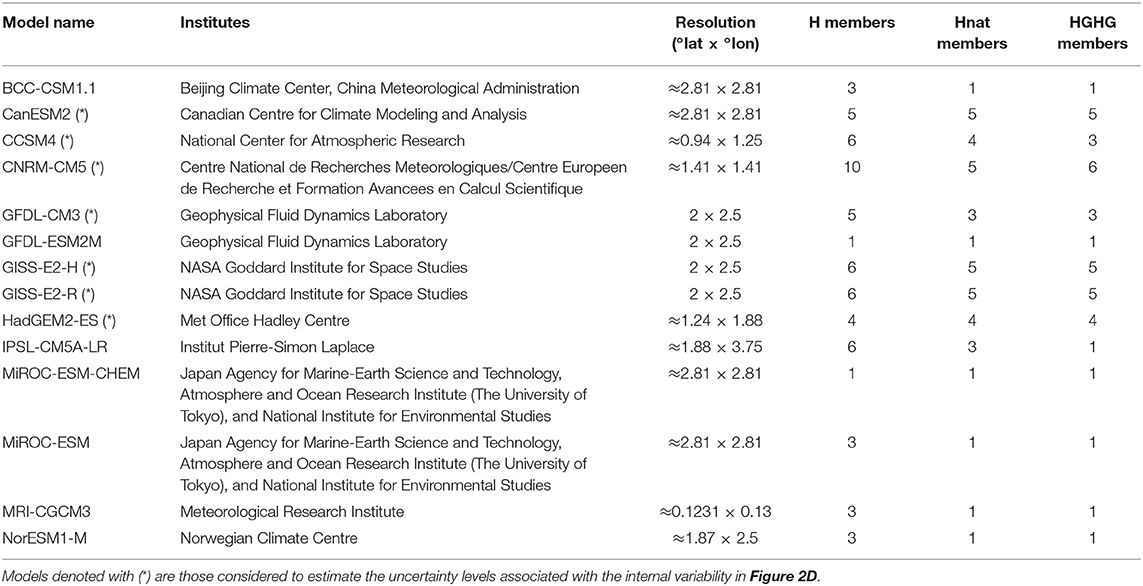
Global climate simulations resulting from different CMIP5 numerical experiments are also used. The experiments considered are as follows: (i) “Historical,” forced by both natural sources and anthropogenic sources (consistent with observed estimations of anthropogenic emissions of greenhouse gases and aerosols, and of land-use change); (ii) “HistoricalGHG,” forced by the same varying GHG emissions as in Historical (iii) “HistoricalNat,” forced by the same varying natural sources as in Historical. The simulations resulting from the three experiments are available over the period 1850–2005. As in Vera and Díaz (2015), 14 different CMIP5 models with their corresponding available members were considered to quantify the uncertainties resulting from both model differences and internal climate variability, respectively (Table 2).The inter-model dispersion is computed as the standard deviation of the model trends with respect to the multi-model ensemble mean (MEM) trend. To determine the uncertainty associated with the internal variability of the climate system for each model, the variance associated with the model member trends is first computed. These variances are then averaged over all those models with more than one member per experiment (Table 2), and the corresponding square root is considered to describe the overall uncertainty associated with the internal variability.
All simulations considered are or have been interpolated into a regular grid with a spatial resolution of 2.5°. The study is based on austral summer conditions described by DJF means. The term “anomalies” refers to DJF seasonal anomalies, and each year is named based on that corresponding to February.
Variability and Trends
Long-term trends are estimated through linear regression analysis and their associated significant levels are tested using the Student's t-test. The co-variability between U200 and/or regional precipitation anomalies with global SST anomalies are explored through singular value decomposition (SVD) analyses. The temporal variability of each mode is described by the time series of the expansion coefficients obtained for each variable considered in the SVD analysis (hereinafter called SVD time series).
Results
Trends
The temporal evolution of precipitation anomalies derived from the GPCC dataset is analyzed in the Altiplano region (22.5–12.5°S, 85°-75°W, green box in Figure 1A) from 1902 to 2018. Figure 1B shows that precipitation anomalies exhibit considerable interannual and decadal variability throughout the period considered, in agreement with previous studies that considered similar or different periods of the instrumental record (e.g., Neukom et al., 2015 and references therein). On the other hand, the estimated linear trend is 0.3 mm/season/decade which is not significant (p-value = 0.75). In agreement, Neukom et al. (2015) concluded that no spatially consistent trend can be derived from the instrumental precipitation datasets available in the region.
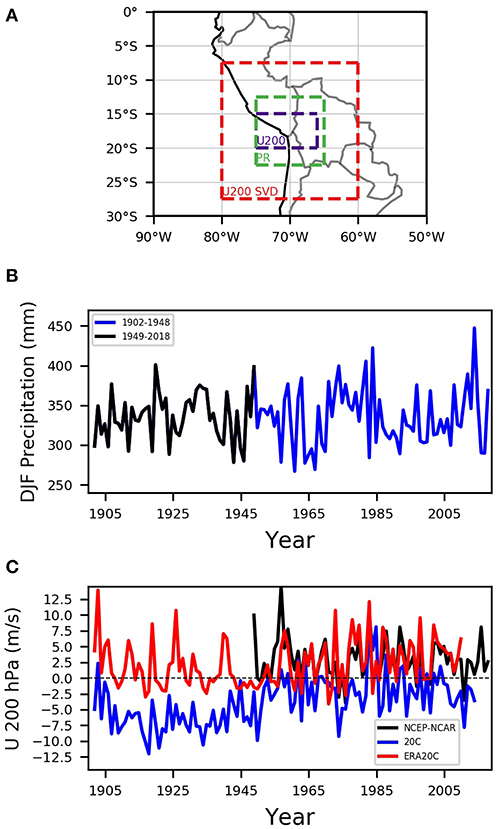
Figure 1. (A) Regions identified for the analysis: Central Andes region from Segura et al. (2016) (purple box), region used to compute SVD for precipitation anomalies in Altiplano (green box) and region considered to compute SVD for U200 anomalies (red box). (B) Temporal evolution of DJF precipitation anomalies, derived from GPCC dataset, in the Altiplano region. Black line indicates 1902–1948 period and blue line indicates 1949–2018 period. Units in mm. (C) Temporal evolution of DJF U200 anomalies, computed from NCEP-NCAR (black), 20C (blue), and ERA20C (red) reanalyses over the purple box displayed in (A). Units in m/s.
The temporal evolution of U200 anomalies, as depicted by the three reanalysis datasets considered, has also been analyzed in the Altiplano. U200 anomalies were averaged over the area encompassed between 15°-20°S, and 73°-63°W (blue box, Figure 1A), which was previously used by Segura et al. (2016) to study the hydroclimatic variability in the region. Figure 1C depicts the U200 anomalies over the longest period available for each of the three datasets. All of them exhibit considerable year-to-year variability. A multitaper singular spectrum analysis (Ghil, 2002) identifies dominant periodicities at around 2–3 years and on multidecadal timescales.
The correlation values among the three timeseries were computed over the longest periods in which they are coincident, and all of them are statistically significant (20C-NCEP = 0.54, ERA20C-NCEP = 0.58, 20C-ERA20C = 0.52). However, important differences are evident among the different datasets regarding the magnitude and sign of the anomalies. The latter could be related with the differences in the methodologies and input observations that have been used to develop each dataset (briefly described in the previous section).
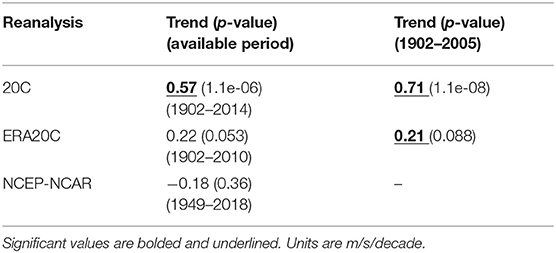
Linear trends of U200 anomalies were first estimated considering the longest period available for each reanalysis dataset (Table 1). The U200 timeseries derived from 20C reanalysis is the longest available, extended over 113 years and the associated positive trend is statistically significant. On the other hand, the trend derived from ERA20C timeseries that encompasses 109 years is positive but not statistically significant. Furthermore, the timeseries derived from NCEP-NCAR reanalysis over 70 years has a non-significant negative trend. It is then evident that the U200 trends estimated from reanalyzed data strongly depend on both the reanalysis dataset and the period considered.
The U200 trends were also estimated over the period 1902–2005 considering the 62 simulations from the 14 different climate models described in Table 2. Figure 2A shows that the mean trend resulting from the multi-model ensemble mean (MEM) for the Historical experiment is positive, that means eastward, with a significant magnitude of 0.039 m/s/decade (p-value = 0.0088). Although there is a large dispersion in the magnitude of the trends among members and models, 77% of the individual simulations display a positive trend. The simulated trends were compared with those derived for the same period but using the reanalysis datasets. Table 1 shows that the trends derived from 20C and ERA20C are positive and significant over the period 1902–2005. While all simulated trends (Figure 2A) are smaller than that resulting from 20C (Table 1), few of them are comparable to that derived from ERA20C (Table 1).
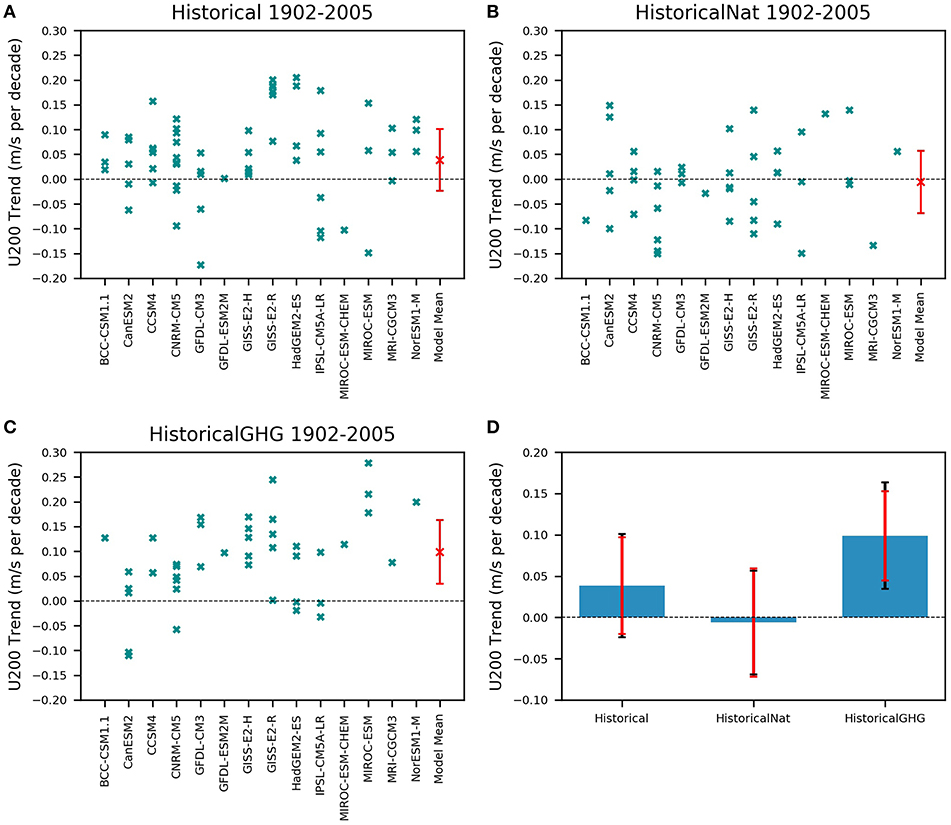
Figure 2. Central Andes region U200 trends (units in m/s/decade −1) for all CMIP5 model simulations considered (cyan crosses) and multi-model mean (red cross), for (A) Historical simulations, (B) HistoricalNat simulations and (C) HistoricalGHG simulations. Red bar in multi-model mean indicates the dispersion between models. (D) Simulations multi-model means U200 trends (blue bars), inter-model dispersion (black bars), and the uncertainty due to internal climate variability (red bars), computed as described in section Data and Methods.
The influence of the anthropogenic climate forcing on the U200 trend was assessed using the other two types of CMIP5 numerical experiments described in section Data and Methods. It was found that the U200 trend resulting from the ensemble of HistoricalNat simulations (Figure 2B) is negligible, meaning that natural climate forcing by itself cannot explain the eastward U200 trend. On the other hand, 88% of the U200 trends resulting from the ensemble of HistoricalGHG simulations are positive, with a statistically-significant mean value of 0.099 m/s/decade (p-value = 3.05e-07) (Figure 2C).
The mean trend and associated dispersion ranges for the three experiments are further compared in Figure 2D. The trends derived from the Historical simulations (that is, all forcings considered) are not statistically different from those forced only by natural sources at 95% significant level, but they are significantly different at 90% significant level. Trends derived from HistoricalGHG simulations are statistically different from those obtained from HistoricalNat simulations and from Historical simulations at 95% significant level. It can be then concluded that the anthropogenic forcing due to GHG increase is a necessary condition to explain the eastward U200 trends and, consequently, the negative rainfall trend in the Altiplano. However, these results also point out the importance of simulating correctly the internal variability of the climate system.
Leading Patterns of Co-variability
The influence of the variability and trend of the global surface ocean on climate anomalies in the Altiplano is studied by considering the leading modes identified from different SVD analyses computed over the 1949–2018 period (Table 3). The variables considered for the SVD analysis are: (i) SST anomalies averaged in the 45°N−45°S domain, (ii) U200 anomalies (from NCEP-NCAR reanalysis) averaged over the red box in Figure 1A (U200 SVD box), and (iii) precipitation (PR) anomalies averaged over the green box in Figure 1A. The U200 anomalies over the U200 SVD box essentially display the same variability as that found in the smaller box considered in the previous section (purple box in Figure 1A). The correlation between both time series is 0.97 (significant at 95% level).
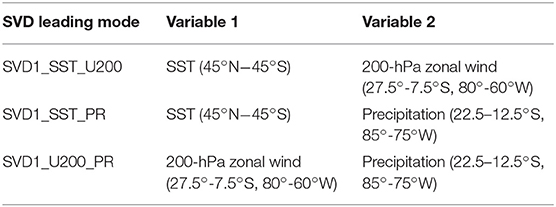
Table 3. List of SVD analyses performed including the variables and domains involved and the names given to each leading mode.
The three SVD analyses considered (Table 3) are intended to describe different aspects of the remote and local sources of regional climate variability. The leading mode resulting from the SVD analysis between SST and PR anomalies (hereafter called SST_PR mode) describes the remote tropical ocean influence on regional precipitation, as the SVD mode between SST and U200 anomalies (hereafter called SST_U200 mode) does for the ocean influence on the regional upper-level winds. On the other hand, the leading mode from the SVD analysis between U200 and PR anomalies (hereafter called U200_PR mode) describes mainly the local relationship between circulation and precipitation variability.
Figure 3 shows for each leading SVD mode (Table 3) its temporal evolution and spatial distribution. The latter is described by using maps of homogeneous and heterogeneous correlation, defined as the linear correlation computed between the SVD expansion coefficients of a given variable against the anomalies of that the same variable, and against those of another variable, respectively. Significant interannual, decadal, and multi-decadal variability dominates the activity of the three modes between 1949 and 2018, with no significant trend (Figures 3A–C). In agreement with the results of the previous section, the 70-year period considered in this analysis based on the availability of NCEP-NCAR reanalysis data seems too short to describe any significant trend. However, it was decided to use this dataset for this exploration considering that this reanalysis is the only one from the three reanalyses considered that uses as input the largest and most comprehensive set of observations from different variables including upper-level winds.
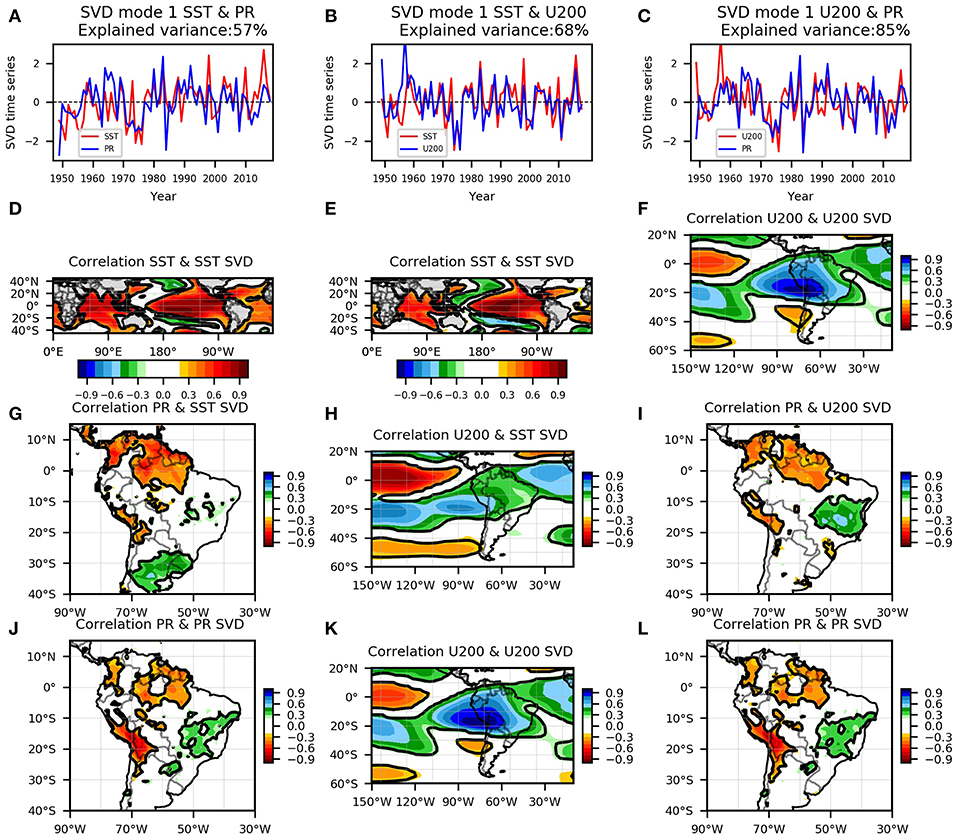
Figure 3. (A) SVD time series of SST (blue) and rainfall anomalies (red) over Altiplano from reanalysis datasets for the period 1949–2018. (D) Homogeneous correlation map between the SVD time series of SST and SST anomalies. (G) Heterogeneous correlation map between the SVD time series of SST and rainfall anomalies. (J) Homogeneous correlation map between the SVD time series of rainfall and rainfall anomalies. (B,E,H,K) same as (A,D,G,J), but for SVD time series of SST (blue) and U200 anomalies (red) over Altiplano. (C,F,I,L) same as (A,D,G,J), but for SVD timeseries of U200 (blue) and rainfall anomalies (red) over Altiplano. Contours indicate 95% significance level.
The SST_PR mode (Figure 3A), explaining 57% of the co-variance, describes negative precipitation anomalies in the Altiplano in association with a generalized surface ocean warming at tropical latitudes, which maximizes over the central-eastern Pacific and Indian Oceans (Figure 3D). The mode signal in the precipitation anomalies in the Altiplano that is explained by the SST variability (Figure 3G) is significant but weaker than that explained by the local precipitation variability itself (Figure 3J). The latter might indicate that other factors besides those associated with SST anomalies explain the regional precipitation variability.
The SST_U200 mode (Figure 3B), that explains 68% of the co-variance, is associated with a similar pattern of SST anomalies (Figure 3E) as the previous mode. The latter confirms not only the well-known influence of the tropical Pacific Ocean over the Altiplano, but also that the mode describes a significant role of the SST anomalies in the tropical Indian Ocean. Moreover, the mode signal in the U200 anomalies explained by the SST variability is positive westward of the Altiplano and part of an alternant-sign correlation pattern extending across the South Pacific from equatorial to subpolar latitudes (Figure 3H). The latter resembles the Pacific-South American (PSA) pattern, a name usually given in the literature to the atmospheric teleconnections that can develop in the circulation anomalies of the South Pacific (e.g., Mo, 2000). The teleconnections originated individually from tropical Pacific and Indian Ocean basins can synergistically or destructively influence the circulation anomalies in the vicinity of the Altiplano. On the other hand, the mode signal in U200 anomalies explained by the regional U200 variability shows a similar spatial distribution over the South Pacific, except over the Altiplano, where it exhibits a larger and more extended positive correlation center over the region and a negative center poleward (Figure 3K). The latter essentially describes variations of the Bolivian High circulation that have been previously identified as a local source of precipitation variability in the Altiplano on interannual time scales (Garreaud and Aceituno, 2001). Therefore, this mode shows that U200 anomalies influencing the Altiplano can be modulated by the tropical Pacific-Indian Ocean interannual variability and by the variations of the Bolivian High, in turn directly related to the activity of the South America Monsoon System (Vera et al., 2006). The U200_PR mode (Figure 3C), that explains 85% of the co-variance, confirms the strong relationship between large zonal-wind anomalies associated with the Bolivian High variations (Figure 3F) and precipitation anomalies in the Altiplano (Figure 3I).
The comparative analyses among the three modes confirm a significant relationship between positive SST anomalies in the central-eastern tropical Pacific and western tropical Indian Oceans with positive U200 anomalies and negative precipitation anomalies in the Altiplano. But it also shows that variations in the South America monsoon circulation can reinforce or weaken the tropical SST remote influence.
The SST_PR mode was also computed over a more extended period (1902–2018) and displayed in Figure 4. The mode exhibits a similar spatial distribution of both SST anomalies and regional precipitation anomalies to that obtained for the shorter period (Figure 3B) but superposed with a generalized global surface ocean warming signal (Figure 4B). Both time series exhibit large year-to-year variability, but the SST time series is the only one exhibiting a significant trend (Figure 4A). The latter agrees with IPCC AR5 showing that while global-warming related trends are being detected in surface temperature and at global domains, regional climate trends are more difficult to detect because of the large internal climate variability (Bindoff et al., 2013).
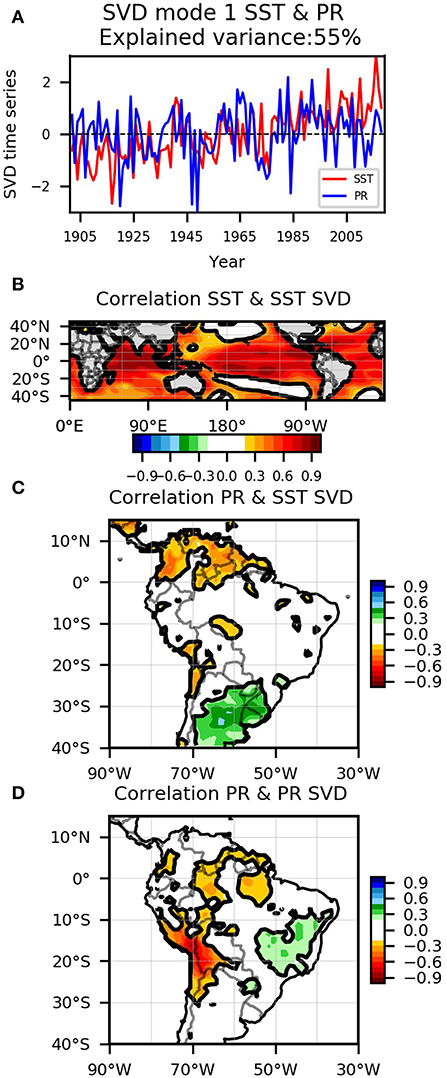
Figure 4. (A) SVD time series of SST (blue) and rainfall anomalies (red) over Altiplano from reanalysis datasets for the period 1902–2018. (B) Homogeneous correlation map between the SVD time series of SST and SST anomalies. (C) Heterogeneous correlation map between the SVD time series of SST and rainfall anomalies. (D) Homogeneous correlation map between the SVD time series of rainfall and rainfall anomalies. Contours indicate 95% significance level.
It is worth pointing out that the heterogeneous correlation map between precipitation anomalies and SST SVD time series associated with SST_PR mode displays positive values in southeastern South America (Figure 4C). That relationship agrees well with the results of Díaz et al. (2017), providing additional confidence in the SVD analysis results despite the low-quality of GPCC precipitation data in the Altiplano.
Changes in Leading Patterns of Co-variability
IPCC AR5 concluded that the skill of climate models in simulating the large-scale climate phenomena has increased. Therefore they provide a better understanding of the processes related which in turn enhances reliability on simulated regional climate changes (Christensen et al., 2013). In agreement, previous studies confirm that the climate models can reproduce to some extent the main features associated with the large-scale wind anomalies in the vicinity of the Altiplano (e.g., Minvielle and Garreaud, 2011; Diaz and Vera, 2018).
The leading SVD mode describing the co-variability between large-scale SST anomalies and U200 anomalies in the Altiplano region was further analyzed over the period 1902–2005 using the CMIP5 experiments. The poor model performance in representing the variability and change of precipitation anomalies in the Altiplano (e.g., Diaz and Vera, 2018) prevents us from including simulated precipitation in the study. Following Díaz et al. (2017), each climate model is represented by the average of the standardized anomalies computed from their corresponding members.
The SST_U200 mode obtained from the Historical experiment (Figure 5B) shows essentially the same spatial distribution of SST anomalies as that obtained from reanalysis data over the period 1948–2018 (Figure 3B) but with a stronger global warming signal superposed. The corresponding modes estimated from HistoricalNat and HistoricalGHG (Figure 5, middle and right column, respectively), also show similar SST spatial distributions. The main difference is the lack of the global warming signal in the SST homogenous correlation map derived from the HistoricalNat experiment (Figure 5E).
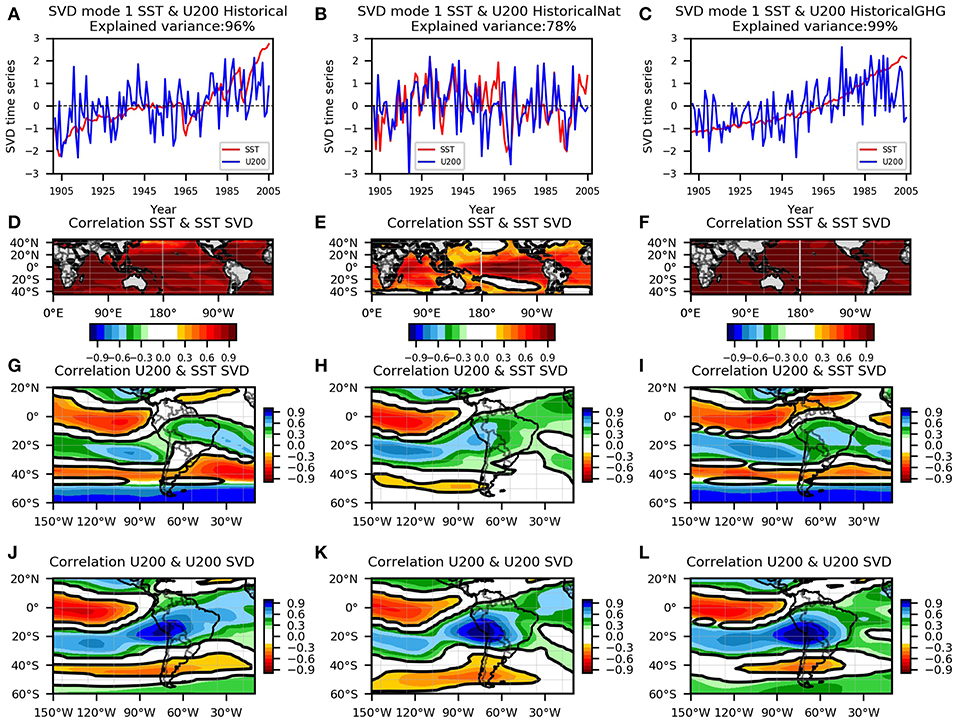
Figure 5. (A) SVD time series of SST (blue) and U200 anomalies (red) over Altiplano for Historical simulations multi-model ensemble for the period 1902–2005. (D) Homogeneous correlation map between the SVD time series of SST and SST anomalies. (G) Heterogeneous correlation map between the SVD time series of SST and U200 anomalies. (J) Homogeneous correlation map between the SVD time series of U200 and U200 anomalies. (B,E,H,K) same as (A,D,G,J), but for HistoricalNat simulations. (C,F,I,L) same as (A,D,G,J), but in HistoricalGHG simulations.
The trends identified in the mode time series for both SST and U200 from the three experiments are depicted in Figures 6A,B, respectively. Trends are significant and positive for both Historical and HistoricalGHG experiments, while they are negligible and not significant for the HistoricalNat experiment. These results confirm that the anthropogenic forcing associated with GHG increase is necessary to explain the trends simulated in both global SST and regional U200 anomalies influencing the Altiplano.
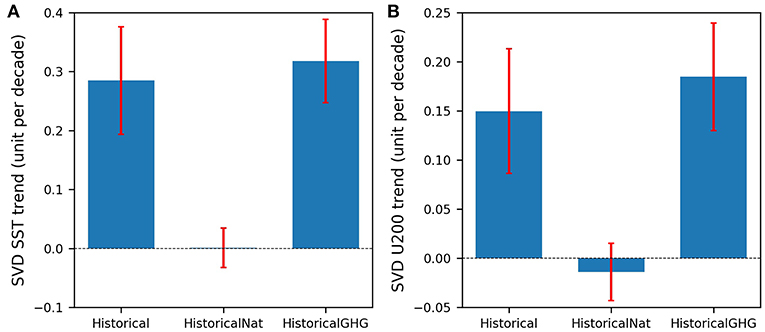
Figure 6. (A) Mean trends of SVD time series of SST (units per decade) estimated from multi-model ensemble for the three CMIP5 numerical experiments (blue bars), model uncertainty (red bars). (B) same as (A), but for mean trends of SVD time series of U200.
A comparison of the U200 trends obtained from the full anomalies (Figure 2D) and those U200 trends derived from the leading SVD mode (Figure 6B) shows that the latter are larger than the former for both Historical and HistoricalGHG experiments. These differences could be due to the fact that trends computed by the full U200 anomalies include not only the contribution of the leading mode but also that of the other modes of regional variability, in which internal climate variability might be dominating.
Hadley Cell Changes
There is high confidence that global zonally-averaged Hadley circulation has expanded during the last decades due to both the anthropogenically forced global warming and ozone depletion (e.g., IPCC, 2013). Moreover, Tao et al. (2015) show that CMIP5 Historical simulations can reproduce the observed poleward expansion of the global Hadley cell, although simulated changes are weaker than observed. However, Kim et al. (2017) found large geographical differences in the local Hadley cell changes simulated by CMIP5 Historical experiments during austral summer.
Southern Hadley cell displacements between 1902 and 2005 are analyzed in this study using CMIP5 simulations. The Hadley circulation is described considering the zonal-mean mass flux streamfunction, defined as the vertical integration between 500 and 10 hPa of the zonally averaged meridional wind (Ceppi and Hartmann, 2013). The poleward edge of the southern Hadley cell is determined in this study as the first latitude in which the streamfunction at 500 hPa becomes zero. Timeseries were smoothed through a 5-year moving average to improve depiction of the longer-period variations.
Displacements are estimated for the Global Hadley cell (defined averaging across all longitudes) as well as for the hereafter called South America Hadley cell (defined averaging only over the 110°W−50°W longitudinal band) and displayed in Figure 7. Between 1902 and around 1970, the southern edge of the global Hadley cell, as described by the CMIP5 Historical experiments, remains roughly at around 35.1°S with no significant trend, while after the 1970s it experiences a significant negative trend, leading to a location south of 36°S by 2005 (Figure 7A). Tao et al. (2015) estimated similar changes in the location of the southern edge of the global Hadley cell for the period 1970–2005, also using CMIP5 Historical simulations. The analysis of the displacements of the South America Hadley cell shows that between 1902 and the seventies its edge is located roughly at around 40°S, and subsequently shifts poleward. The poleward shifts identified in both global and South America Hadley cell during the last decades are not present in the CMIP5 simulations including natural forcing only (Figure 7B).
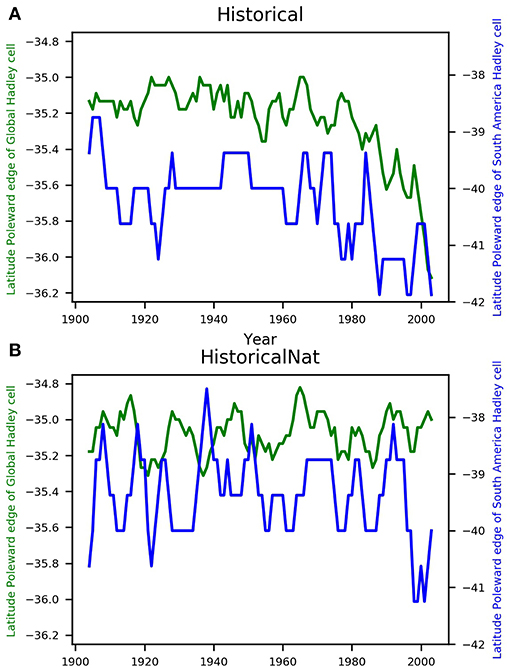
Figure 7. Latitude of the poleward edge of the Global southern Hadley cell (green line) and South America Hadley cell (blue line) for the CMIP5 (A) Historical, and (B) HistoricalNat Simulations. Timeseries have been smoothed with a 5-year moving average.
The assessment of the contribution of Hadley cell displacements to explain U200 changes is very difficult since it is not the only source of regional circulation changes. In both reanalysis datasets and climate model simulations the Hadley cell influence on regional atmospheric circulation is mixed with that generated by other sources of variability. One methodology to assess the individual contribution of one of those sources is the linear regression analysis. Wilks (2011) identifies the linear regression analysis as one of the objective methods for statistical estimation of a certain variable (denoted as predictand or Y) from the knowledge of another one (denoted as predictor or X). Marshall et al. (2006) applied this methodology to assess the contribution of the changes of the Southern Annular Mode (SAM) to surface air temperature changes in Antarctic Peninsula. Therefore, in this study the contribution of Hadley cell displacements to the explanation of the U200 trends identified from the CMIP5 Historical simulations between 1902 and 2005 (Figure 2) is estimated using a set of linear regressions. The U200 timeseries averaged over the green box in Figure 1C was considered as the predictand (Y). The displacement of both global Hadley cell and South America Hadley cell (Figure 7) were considered separately as predictors (X). Regression coefficients (B) were derived from detrended data (Table 4). The regression equation, defined as Y = A + BX, provides a minimum value for the regressed coefficients as it assumes that there is no link between linear trends in predictors and predictands (Marshall et al., 2006). The regression equations were then applied to the undetrended predictor time series to assess the contributions of the long-term changes of predictor to the U200 changes in the Altiplano. The correlations between the U200 anomalies in the Altiplano and those reconstructed by the linear regression equations derived based either on the global Hadley cell changes or that of the South America Hadley cell (Table 4) provide a measure of their relative contribution to explain regional U200 changes.
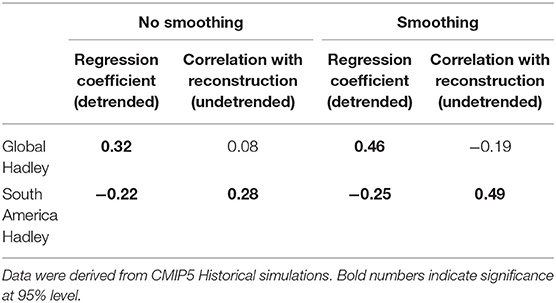
Table 4. Regression Coefficient between detrended Hadley displacements and detrended U200 anomalies, and correlation between undetrended Hadley displacement and U200 anomalies, for both no-smoothed and smoothed (with 5-year moving average) normalized data.
Figure 8 displays U200 anomaly time series in the Altiplano and the corresponding reconstructions derived from the linear regressions based separately on the displacements of the global Hadley cell (Figure 8A) and the South America Hadley cell (Figure 8B), respectively. Both regressed coefficients are significant, although the correlation between the undetrended U200 anomalies and the two reconstructions are only significant for the South America Hadley cell (Table 4). In both cases the regressed values do not represent correctly the magnitude of the U200 anomalies. It is evident that U200 anomalies are associated with large year-to-year variability that limits the analysis of the slower variations detected over the decades. Therefore, detrended timeseries of predictand and predictors were smoothed through a 5-year moving average before computing the linear regression equation to reduce the noise associated with the short-period variability. The fact that the timeseries are first smoothed and then normalized prevents a direct comparison with the nonsmoothed ones. The regressed coefficients obtained from the smoothed data are both significant, but again the undetrended U200 anomalies are significantly correlated only with the reconstruction based on the South America Hadley cell displacements (Figures 8C,D; Table 4).
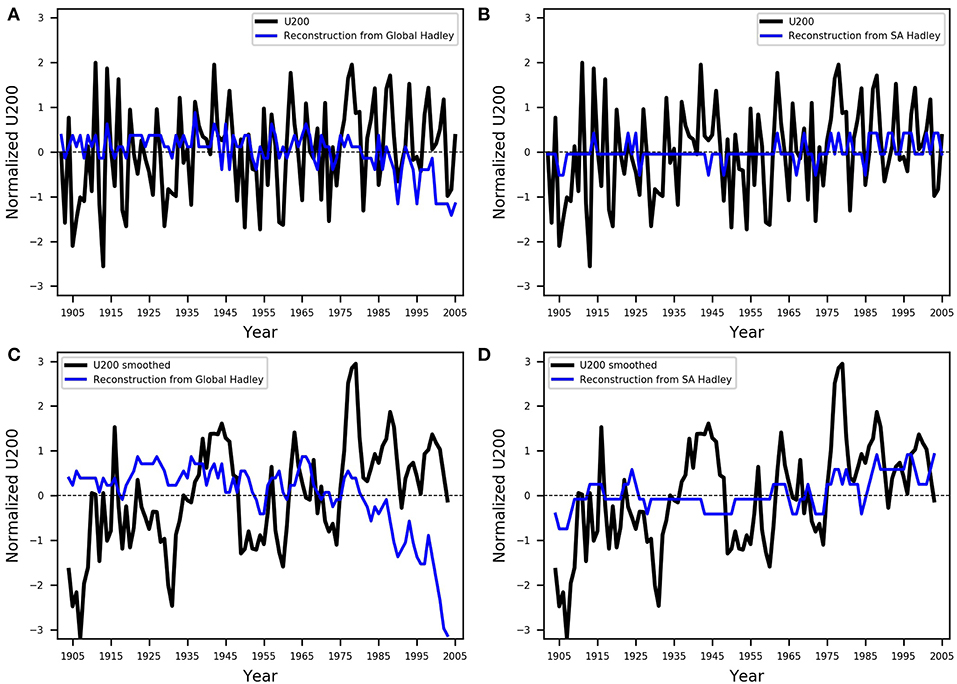
Figure 8. Normalized U200 anomaly time series in the Altiplano (black) and those reconstructed by linear regressions(blue)based on Hadley cell displacements computed either globally (A) or over South America only (B). (C,D) same as (A,B), but for smoothed series. Data were derived from CMIP5 Historical simulations.
The fact that the positive U200 trends in the Altiplano are significantly related to the South America Hadley cell changes and not with those of the global Hadley cell, might imply that other mechanisms independent of the global tropical expansion are taking place. It is evident that the evolution of the South America Hadley cell exhibits large year-to-year variability (Figure 7A), in agreement with Saurral et al. (2017) that analyzed it from NCEP/NCAR reanalyses. It seems then that variability and trends of the Hadley cell over South America could be driven by local sources associated with the South American Monsoon System, as well as remotely by variations associated with the tropical oceans.
Discussion and Conclusions
An assessment of the changes experienced between 1902 and 2018 by rainfall and U200 in the Altiplano during DJF was made using both reanalysis data and CMIP5 simulations. The study is very complex because of the presence of topography that is challenging for climate models and because it is a region associated with a very sparse network of poor-quality meteorological observations. In addition, the amplitude of the climate variability in this region is quite large and that challenges the detection and attribution of anthropogenically-induced long-term trends in the regional climate.
The limitations to detecting trends in present climate and attributing it to human influences at local scales have been extensively assessed in IPCC AR5 (Bindoff et al., 2013). The report concluded that while human-caused warming is already becoming locally obvious in tropical land regions, local trends associated with other variables than land surface temperature (e.g., precipitation and winds) are still very hard to detect because in most locations the variability is quite large. More recently, the IPCC special report on 1.5°C global warming concluded that the detection of anthropogenically-induced signals for precipitation is still very ambiguous in many regions of the world, and especially in the monsoon regions (Hoegh-Guldberg et al., 2018).
Considering the uncertainties associated with the internal variability as well as with the errors associated with both observations and models, the IPCC AR5 concludes that multiple evidences resulting from different observations datasets, different model simulations, and knowledge about the large-scale climate influence at local regions can be combined to assess the human influence on local climate during the last century (Mastrandrea et al., 2011; Bindoff et al., 2013). Accordingly, the approach followed in our study was to assess the trends of precipitation and winds in the Altiplano, considering different reanalysis datasets (NCEP-NCAR, ERA20C, 20C), and different multi-model multi-member ensembles of CMIP5 simulations. The study is based on the significant relationship previously identified, and confirmed here, between precipitation anomalies and U200 anomalies in the region, and complemented by a deep analysis of the physical processes associated with local and remote sources of regional variability.
No significant trend has been identified in precipitation anomalies derived from the GPCC dataset over the Altiplano from 1902 to 2018, in agreement with previous assessments of instrumental databases over the region (Neukom et al., 2015). Moreover, a large spread was found between the U200 anomaly trends estimated from the three reanalysis datasets. Trend estimations seem to strongly depend on both the reanalysis dataset and period considered. Nevertheless, U200 trends calculated from 20C and ERA20C over the period 1902–2005 are both positive and significant (although the latter is not significant over the period 1902–2010). Furthermore, 77% of the 62 simulations considered from the CMIP5 Historical experiment (that is, all climate forcing simulations) exhibit positive trends over the 1902–2005 period and the ensemble mean trend is statistically significant. Therefore, through a collective analysis of the multiple trends estimated from reanalyses and model simulations, the study provides a stronger basis to support a positive U200 trend. Although the signal is still associated with high levels of uncertainty.
The CMIP5 experiments that simulate the response, either only to natural forcing or only to GHG increases, are important for the attribution of climate change, as they provide a physically consistent representation of processes at all scales involved (Bindoff et al., 2013). It was found that most of the U200 trends estimated from simulations forced only by GHG increase are positive. Moreover, the associated mean trend is significantly different of that obtained from the simulations forced by natural sources only. Therefore, a signal associated with the anthropogenic forcing of climate change has been detected in the U200 trends in the Altiplano, but is not strong, as compared with the internal climate variability.
The analysis of the large-scale climate influence exerted by global SST anomalies on both winds and precipitation anomalies in the Altiplano was made using reanalysis data. In agreement with previous studies (e.g., Garreaud and Aceituno, 2001), it was confirmed that rainfall and U200 anomalies in the Altiplano exhibit significant year-to-year variability, in turn strongly related with that observed over the tropical Pacific Ocean. In addition, the SVD analyses clearly show that the variability of SST in the tropical Indian Ocean can influence the region in an equivalent or opposite way with the influence produced by the tropical Pacific Ocean (including ENSO). Moreover, SVD analyses show that such remote SST influence can also be modulated by the variability associated with the Bolivian High that, in turn, is related with the activity of the South American Monsoon System. The SVD analysis clearly shows that negative precipitation anomalies are linked to positive regional U200 anomalies, that are induced by positive SST anomalies in both the tropical Pacific and Indian Oceans as well as by a weakened monsoon. Considering that not all the monsoon variability is explained by the tropical SST anomalies, it is evident that both sources of variability, the remote one associated with the tropical SST and the regional one associated with the South American Monsoon, can work synergistically or not, affecting the sign and magnitude of the changes in the Altiplano.
The physical mechanisms linking global SST anomalies and regional U200 anomalies were further explored using CMIP5 experiments. Results show that model simulations can reproduce the remote and local drivers of U200 variability and change associated with tropical SST and South American Monsoon System, respectively. Furthermore, the U200 trends derived from the leading SVD mode timeseries are positive and significant for both Historical and HistoricalGHG experiments but not for HistoricalNat. This result supports the conclusion that the anthropogenic forcing associated with GHG emission increase is a necessary condition to explain the positive trends identified during the last decades in the co-variability between tropical surface ocean conditions and U200 anomalies in the Altiplano. Moreover, it was also found that for both all-forcing and GHG-forcing experiments, the U200 trends associated with the leading SVD mode are larger than those trends derived from the full U200 anomalies. It can be speculated that the anthropogenically-forced signal in the U200 anomalies is strongly related with that of the leading mode but weakened by the activity of the other modes in which the internal climate variability might be strongly dominating. Therefore, this result has important implications for the determination of the uncertainty levels associated with the internal climate variability and with uncertainties associated with both observations and models.
The potential role of Hadley cell displacements in explaining the positive U200 changes identified from CMIP5 Historical simulations was also assessed from CMIP5 simulations. It was found that changes in the global Hadley cell are not significantly related with the regional U200 changes. Instead, South America Hadley cell displacements are significantly correlated with U200 changes in the Altiplano. However, the identification of the physical mechanisms that might explain such a relationship is beyond the scope of this study. The fact that it is the local Hadley cell and not the global one that significantly influence the regional changes allows speculation that physical processes related with the asymmetric component of the circulation response to global warming might be acting.
In summary, an attribution study is presented for the first time confirming the influence of the anthropogenic climate forcing in explaining the positive U200 trends, and, indirectly the negative rainfall changes detected in the Altiplano, during the last decades. The study also provides significant evidence of the combined influence of both remote (tropical ocean conditions) and local (South American Monsoon System) climate drivers on rainfall changes in the Altiplano. The latter confirms the complexity of physical processes involved and the need of addressing them holistically without excessive simplification.
Author Contributions
CV designed the study, LD and RS contributed to it. LD organized database performed statistical analysis and prepared the figures. CV wrote the first draft of the manuscript. CV, LD, and RS contributed to manuscript revision, read and approved the submitted version as well as the revised version.
Funding
Estudio de las variaciones climáticas observadas en la Pampa Húmeda durante los siglos 20 y 21 y desarrollo de su proyección para las próximas décadas. CONICET-PIP 11220120100526CO. Argentina.
Monitoreo y pronóstico climático para la prevención de desastres hídricos en Argentina (CLIM.AR), PIDDEF 2014/2017 Nro. 15. MINDEF. Argentina.
Climate Services Through Knowledge Co-Production: A Euro-South American Initiative For Strengthening Societal Adaptation Response to Extreme Events (CLIMAX), Belmont Forum/ANR-15-JCL/-0002-01. France.
Interacciones entre patrones climáticos de gran escala y su impacto en el sur de Sudamérica. UBACYT 20020170100428BA. University of Buenos Aires, Argentina.
Conflict of Interest Statement
The authors declare that the research was conducted in the absence of any commercial or financial relationships that could be construed as a potential conflict of interest.
Acknowledgments
We acknowledge the World Climate Research Programme's Working Group on Coupled Modeling, which is responsible for CMIP, and we thank the climate modeling groups for producing and making available their model output. For CMIP the U.S. Department of Energy's Program for Climate Model Diagnosis and Intercomparison provides coordinating support and led development of software infrastructure in partnership with the Global Organization for Earth System Science Portals. The research was supported by Consejo Nacional de Investigaciones Científicas y Técnicas (CONICET) PIP 112-20120100626CO, UBACyT20020170100428BA, PIDDEF 2014/2017 Nro 15, and the CLIMAX Project funded by Belmont Forum/ANR-15-JCL/-0002-01.
Supplementary Material
The Supplementary Material for this article can be found online at: https://www.frontiersin.org/articles/10.3389/fenvs.2019.00087/full#supplementary-material
References
Bindoff, N. L., Stott, P. A., Achuta Rao, K. M., Allen, M. R., Gillett, N., Gutzler, D., et al. (2013). “Detection and attribution of climate change: from global to regional,” in Climate Change 2013: The Physical Science Basis. Contribution of Working Group I to the Fifth Assessment Report of the Intergovernmental Panel on Climate Change, eds. T. F. Stocker, D. Qin, G.-K. Plattner, M. Tignor, S. K. Allen, J. Boschung, A. Nauels, Y. Xia, V. Bex, and P. M. Midgley (Cambridge; New York, NY: Cambridge University Press, 867–952
Ceppi, P., and Hartmann, D. L. (2013). On the speed of the eddy-driven jet and the width of the hadley cell in the southern hemisphere. J. Climate 26, 3450–3465. doi: 10.1175/JCLI-D-12-00414.1
Christensen, J. H., Krishna Kumar, K., Aldrian, E., An, S.-I., Cavalcanti, I. F. A., de Castro, M., et al. (2013). “Climate phenomena and their relevance for future regional climate change,” in Climate Change 2013: The Physical Science Basis. Contribution of Working Group I to the Fifth Assessment Report of the Intergovernmental Panel on Climate Change, eds. T. F. Stocker, D. Qin, G.-K. Plattner, M. Tignor, S. K. Allen, J. Boschung, A. Nauels, Y. Xia, V. Bex, and P. M. Midgley (Cambridge; New York, NY: Cambridge University Press, 1217–1310
Compo, G. P., Whitaker, J. S., Sardeshmukh, P. D., Matsui, N., Allan, R. J., Yin, X., et al. (2011). The Twentieth Century reanalysis project. Q. J. R. Meteorol. Soc. 137, 1–28. doi: 10.1002/qj.776
Diaz, L. B., and Vera, C. S. (2018). South American precipitation changes simulated by PMIP3/CMIP5 models during the Little Ice Age and the recent global warming period. Int. J. Climatol. 38, 2638–2650. doi: 10.1002/joc.5449
Díaz, L. B., Vera, C. S., and Saurral, R. I. (2017). Observed and simulated summer rainfall variability in Southeastern South America. CLIVAR Exchanges 71, 13–16.
Garreaud, R. (1999). Multiscale analysis of the summertime precipitation over the Central Andes. Mon. Wea. Rev. 127, 901–921. doi: 10.1175/1520-0493(1999)127<0901:MAOTSP>2.0.CO;2
Garreaud, R., and Aceituno, P. (2001). Interannual rainfall variability over the South American Altiplano, Climate J. 14, 2779–2789. doi: 10.1175/1520-0442(2001)014<2779:IRVOTS>2.0.CO;2
Ghil, M. (2002). Advanced spectral methods for climatic time series. Rev. Geophys. 40:1003. doi: 10.1029/2000RG000092
Hoegh-Guldberg, O., Jacob, D., and Taylor, M. (2018). “Impacts of 1.5oC global warming on natural and human systems,” in Global Warming of 1.5 °C, an IPCC Special Report on the Impacts of Global Warming of 1.5 °C Above Pre-industrial Levels and Related Global Greenhouse Gas Emission Pathways, in the Context of Strengthening the Global Response to the Threat of Climate Change. Available online at: http://report.ipcc.ch/sr15/pdf/sr15_chapter3.pdf (accessed October 29, 2018).
Huang, B., Peter Thorne, W., Banzon, V. F., Boyer, T., Chepurin, G., Lawrimore, J. H., et al. (2017). Extended Reconstructed Sea Surface Temperature version 5 (ERSSTv5), Upgrades, validations, and intercomparisons. J. Climate 30, 8179–8205. doi: 10.1175/JCLI-D-16-0836.1
IPCC (2013). “Long-term Climate Change: Projections, Commitments and Irreversibility,” in Climate Change2013: The Physical Science Basis, Contribution of Working Group I to the Fifth Assessment Report of the Intergovernmental Panel on Climate Change, eds. T. F. Stocker, D. Qin, G.-K. Plattner, M. Tignor, S. K. Allen, J. Boschung, A. Nauels, Y. Xia, V. Bex, and P. M. Midgley (Cambridge; New York, NY: Cambridge University Press), 1029–1136.
Kalnay, E., Kanamitsu, M., Kistler, R., Collins, W., Deaven, D., Gandin, L., et al. (1996). The NCEP/NCAR 40-yearreanalysis project. Bull. Am. Meteorol. Soc. 77, 437–471. doi: 10.1175/1520-0477(1996)077<0437:TNYRP>2.0.CO;2
Kim, Y.-H, Min, S.-K., Son, S.-W., and Choi, J. (2017). Attribution of the local Hadley cell widening in the Southern Hemisphere. Geophys. Res. Lett. 44, 1015–2024. doi: 10.1002/2016GL072353
Marshall, G. J, Orr, A., van Lipzig, N. P. M., and King, J. C. (2006). The impact of a changing Southern hemisphere annular mode on Antarctic Peninsula summer temperatures. J. Climate 19, 5388–5404. doi: 10.1175/JCLI3844.1
Mastrandrea, M. D., Mach, K. J., Plattner, G. K., Edenhofer, O., Stocker, T. F., Field, C. B., et al. (2011). The IPCC AR5 guidance note on consistent treatment of uncertainties: a common approach across the working groups. Climatic Change 108:675. doi: 10.1007/s10584-011-0178-6
Minvielle, M., and Garreaud, R. (2011). Projecting rainfall changes over the South American Altiplano. Climate J. 24, 4577–4583. doi: 10.1175/JCLI-D-11-00051.1
Mo, K. C. (2000). Relationships between low-frequency variability in the southern hemisphere and sea surface temperature anomalies. Climate J. 13, 3599–3610. doi: 10.1175/1520-0442(2000)013<3599:RBLFVI>2.0.CO;2
Morales, M. S., Christie, D. A., Villalba, R., Argollo, J., Pacajes, J., Silva, J. S., et al. (2012). Precipitation changes in the South American Altiplano since1300ADreconstructed by tree-rings. Clim. Past 8, 653–666. doi: 10.5194/cp-8-653-2012
Neukom, R., Rohrer, M., Calanca, P., Salzmann, N., Huggel, C., Acuña, D., et al. (2015). Facing unprecedented drying of the Central Andes? Precipitation variability over the period AD 1000–2100. Environ. Res. Lett. 10:084017. doi: 10.1088/1748-9326/10/8/084017
Poli, P., Hersbach, H., Dee, D. P., Berrisford, P., Simmons, A. J., Vitart, F., et al. (2016). ERA-20C: an atmospheric reanalysis of the Twentieth Century. Climate J. 29, 4083–4097. doi: 10.1175/JCLI-D-15-0556.1
Saurral, R. I., Camilloni, I. A., and Barros, V. R. (2017). Low-frequency variability and trends in centennialprecipitation stations in southern South America. Int. J. Climatol. 37, 1774–1793. doi: 10.1002/joc.4810
Schneider, U., Becker, A., Finger, P., Meyer-Christoffer, A., Rudolf, B., and Ziese, M. (2011). GPCC Full Data Reanalysis Version 6.0 at 2.5°: Monthly Land-Surface Precipitation From Rain-Gauges Built on GTS-Based and Historic Data. doi: 10.5676/DWD_GPCC/FD_M_V6_05
Segura, H., Espinoza, J. C., Junquas, C., and Takahashi, K. (2016). Evidencing decadal and interdecadal hydroclimatic variability over the Central Andes. Environ. Res. Lett. 11:094016. doi: 10.1088/1748-9326/11/9/094016
Tao, L., Hu, Y., and Liu, J. (2015). Anthropogenic forcing on the Hadley circulation in CMIP5 simulations. Climate Dyn. 46, 3337–3350. doi: 10.1007/s00382-015-2772-1
Taylor, K. E., Stouffer, R. J., and Meehl, G. A (2012). An overview of CMIP5and the experiment design. Bull. Am. Meteorol. Soc. 93 485–98. doi: 10.1175/BAMS-D-11-00094.1
Vera, C., Higgins, W., Amador, J., Ambrizzi, T., Garreaud, R., Gochis, D., et al. (2006). Toward a unified view of the American monsoon systems. J. Climate 19, 4977–5000. doi: 10.1175/JCLI3896.1
Vera, C. S., and Díaz, L. (2015). Anthropogenic influence on summer precipitation trends over South America in CMIP5 models. Int. J. Climatol. 35, 3172–3177. doi: 10.1002/joc.4153
Vuille, M., Francou, B., Wagnon, P., Juen, I., Kaser, G., Mark, B., et al. (2008). Climate change and tropical Andean glaciers: past, present and future. Earth Sci. Rev. 89, 79–96. doi: 10.1016/j.earscirev.2008.04.002
Keywords: Andes, Altiplano, rainfall, climate change, sea surface temperature, wind, CMIP5
Citation: Vera CS, Díaz LB and Saurral RI (2019) Influence of Anthropogenically-Forced Global Warming and Natural Climate Variability in the Rainfall Changes Observed Over the South American Altiplano. Front. Environ. Sci. 7:87. doi: 10.3389/fenvs.2019.00087
Received: 17 December 2018; Accepted: 27 May 2019;
Published: 13 June 2019.
Edited by:
Brian H. Luckman, University of Western Ontario, CanadaReviewed by:
Eduardo Zorita, Helmholtz Centre for Materials and Coastal Research (HZG), GermanyPedro Miguel Sousa, University of Lisbon, Portugal
Copyright © 2019 Vera, Díaz and Saurral. This is an open-access article distributed under the terms of the Creative Commons Attribution License (CC BY). The use, distribution or reproduction in other forums is permitted, provided the original author(s) and the copyright owner(s) are credited and that the original publication in this journal is cited, in accordance with accepted academic practice. No use, distribution or reproduction is permitted which does not comply with these terms.
*Correspondence: Carolina S. Vera, Y2Fyb2xpbmFAY2ltYS5mY2VuLnViYS5hcg==
 Carolina S. Vera
 Leandro B. Díaz
 Ramiro I. Saurral