 Lena Norbäck Ivarsson1*
 Thomas Andrén1
 Matthias Moros2
 Thorbjørn Joest Andersen3Mikael Lönn1,4
 Elinor Andrén1
- 1School of Natural Sciences, Technology and Environmental Studies, Södertörn University, Huddinge, Sweden
- 2Leibniz Institute for Baltic Sea Research Warnemünde, Rostock, Germany
- 3Department of Geosciences and Natural Resource Management, University of Copenhagen, Copenhagen, Denmark
- 4Department of Electrical Engineering, Mathematics, and Science, Faculty of Engineering and Sustainable Development, University of Gävle, Gävle, Sweden
Sediment cores from three sites along the east-coast of Sweden, north-western Baltic Proper, have been studied with respect to lithologies, geochemistry, and diatom assemblages to trace and date early human impact with emphasis on nutrient discharge. The three sites Bråviken, Himmerfjärden, and Ådfjärden, have been impacted to various degree during the last millennia by multiple stressors like excessive nutrient discharge and hazardous substances, leading to coastal hypoxia, eutrophication, and pollution. These stressors are mainly caused by drivers in the drainage area as increased human population, changed land use, and point sources as industries and a sewage treatment plant. Even though their detailed history differs, the results show similar general patterns for all three sites. We find no evidence in our data from the coastal zone supporting the hypothesis that the extensive areal distribution of hypoxia in the open Baltic Sea during the Medieval Climate Anomaly was caused by human impact. Timing of the onset of man-made eutrophication, as identified from δ15N and changes in diatom composition, differs between the three sites, reflecting the site specific geography and local environmental histories of these areas. The onset of eutrophication dates to ~1800 CE in Bråviken and Himmerfjärden areas, and to ~1900 CE in the less urban area of Ådfjärden. We conclude that the recorded environmental changes during the last centuries are unique in a thousand year perspective.
Introduction
The Baltic Sea is a brackish water basin with a large and densely populated catchment area. Strong salinity gradients, both vertically and horizontally, set the preconditions for all life in this sea. Since the Baltic Sea is semi-enclosed and has a water residence time of about 30–40 years it is especially sensitive to stressors like chemical pollution, nutrient discharge, and overfishing (Snoeijs and Andrén, 2017). The ca 85 million people living in the drainage area are causing a severe pressure on the ecosystem resulting in environmental deterioration and one of the most polluted seas in the world (Leppäranta and Myrberg, 2009). Increased anthropogenic nutrient loads during the twentieth century have led to eutrophication of the Baltic Sea manifested in e.g., altered species composition, more intense cyanobacterial blooms, decreased secchi-depth, and increased sea bottom hypoxia in the open parts of the Baltic Sea (Elmgren, 2001; Gustafsson et al., 2012). Since the 1950s, hypoxia has also increased in the Baltic Sea coastal zones (Persson and Jonsson, 2000; Conley et al., 2011).
Some of the recorded changes resulting from present eutrophication are not new phenomena for the Baltic Sea. Pigment analyses in sediments have shown cyanobacteria blooms to be natural features of the open Baltic Sea for the last ca 8000 years (Bianchi et al., 2000). A compilation of laminated sediment sequences used as proxy for hypoxia show evidence for three time periods with extensive areal distribution of hypoxia in the open Baltic Sea; 8000–4000 years before present (BP), 2000–800 years BP, and from 1800 CE to present (Zillén et al., 2008).
The hypoxic event 2000–800 years BP coincide with a climatic event named the Medieval Climate Anomaly, MCA, including the Roman Warm Period, and has been suggested to be caused by an increase in human population and large scale changes in land use in the drainage area at this time (Zillén and Conley, 2010). Around the turn of the last millennium a series of technological innovations, including the iron plow, promoted an expansion of agricultural land (Myrdal, 1999). The favorable climate conditions during the MCA, with temperatures similar to those of today, also enabled a demographic expansion (Myrdal and Morell, 2011; Ljungqvist et al., 2012). It has also been suggested (Kabel et al., 2012) that the warmer climate during this time caused intensified cyanobacterial blooms and stronger stratification resulting in hypoxia. The following oxygenation of the bottom waters in the open Baltic Sea has been explained both by the onset of the Little Ice Age, LIA, (Kabel et al., 2012), and by the drastic decrease in population due to the plague (Zillén and Conley, 2010). Throughout the present paper, when we refer to the climatic events Medieval Climate Anomaly and Little Ice Age, we use the definitions by Mann et al. (2009), which means the MCA = 950–1250 Common Era (CE), and the LIA = 1400–1700 CE.
There is a need to improve our understanding of the natural variability of the Baltic Sea and its response to climate, as well as human induced forcing. Paleoecology can fill the gap when long term data is lacking, and provide us with a scientific base on past environmental conditions (Willis and Birks, 2006; Renberg et al., 2009; Saunders and Taffs, 2009). Whilst the open Baltic Sea has been extensively studied with respect to Holocene natural climate variability and environmental change (e.g., Andrén et al., 2000a,b; Bianchi et al., 2000), this is not the case in the coastal zone, where studies on long-term trends in hypoxia and its causes have not been performed (Conley et al., 2011). Land use changes will most likely influence the coastal zone before possible effects are registered in the open Baltic Sea, and these areas should consequently be more carefully studied. There are several studies from the Baltic Sea coastal zones focusing on changes in eutrophication and nutrient reconstructions the last century, for example in the Oder estuary (Andrén, 1999), the Roskilde fjord in Denmark (Clarke et al., 2006) and from the Gulf of Finland (Weckström, 2006). Recently, Ning et al. (2018) reported from a coastal site at the Swedish east-coast that the onset of eutrophication can be traced back to the nineteenth century, identifying intensified land use as the main driver. A multiproxy study from the Archipelago Sea, northern Baltic Proper, indicates an onset of eutrophication at ca 1900 CE (Jokinen et al., 2018).
A long-term perspective concerning how environmental changes affect the marine system will provide us with a deeper knowledge of possible future scenarios, highly important for the management of the Baltic Sea (Kotilainen et al., 2014). In this paper we present a multiproxy study using diatom stratigraphies and geochemistry data from three carefully selected coastal sites in the northwestern Baltic Proper. The aim of the study is to investigate and date long-term environmental changes in these coastal regions. Our results will be discussed both in a local and a regional perspective and we aim to put the present severe environmental situation in the Baltic Sea, in terms of nutrient loads and external forcing, in a thousand year perspective.
Study Sites
The three sites chosen for this study are located along the Swedish east-coast, north-western Baltic Proper (Figure 1, Table 1). This area has been, and still is, affected by the last glaciation, resulting in an isostatic rebound of ca 3–4 mm/year (Harff and Meyer, 2011). None of the cored sites have thresholds shallow enough for the isostatic rebound to have affected the water circulation in the basins during the time covered by this study. The seafloor at all three sites consists of glacial and postglacial clays, with large areas of gaseous sediments (Swedish Geological Survey, 2018).
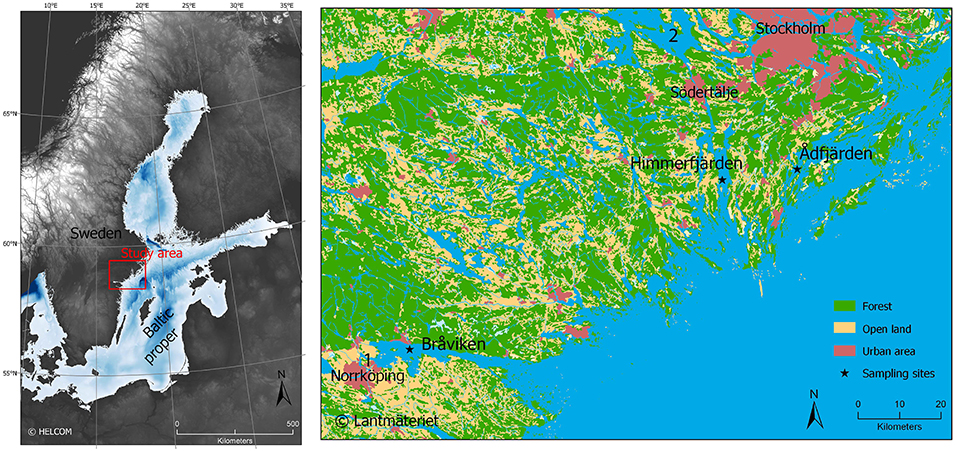
Figure 1. Maps showing the location of the three investigated sites Bråviken, Himmerfjärden, and Ådfjärden in the Baltic Sea. Number 1 is Motala ström and number 2 is Lake Mälaren.
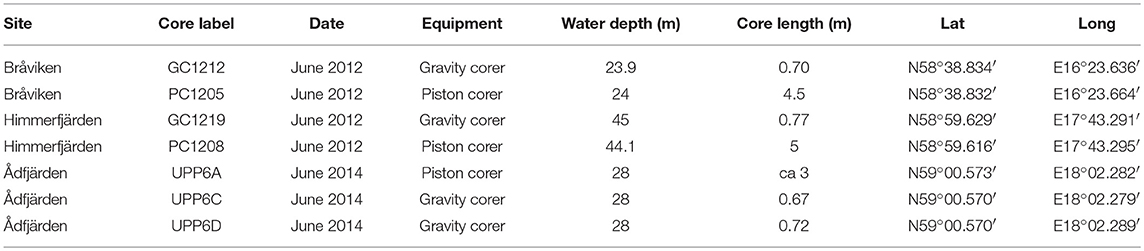
Table 1. Retrieved sediment cores from Bråviken, Himmerfjärden, and Ådfjärden.
Bråviken
Bråviken (N58°38.828′, E16°23.630′) is a long, ca 50 km, and narrow bay of 130 km2, with a threshold depth of 16 m. There are several small streams that drains into Bråviken, but by far the largest input comes from the river Motala ström. The mean discharge between years 1991–2018 was 93 m3/s (Swedish Metrological Hydrological Institute, 2018). In the inner, southern part of Bråviken, the city of Norrköping is located, for which Bråviken is recipient. Salinity in bottom waters of Bråviken is ca 6–6.5. Surface waters salinity fluctuates a lot, fresher during winter months (ca 1–3) and more saline during summer and autumn months (ca 4–5). The drainage area is large and covers 15,480 km2, most of which consists of cultivated glacial and postglacial clays (Swedish Geological Survey, 2018). The northern shore of Bråviken consists of a fault, which also constitutes the rim of the drainage area. The shoreline on this side is steep and the vegetation is dominated by coniferous forest. The water depth along the northern shore is ca 30 m, with a maximum depth of 36 m. The southern side of Bråviken is flat and shallow (<5 m) and the adjacent land is used for agriculture. In these shallow parts the seafloor vegetation is dominated by green algae, mostly Cladophora and Ulva spp., and seaweed such as Potamogeton perfoliatus, Zostera marina, Zannichellia palustris, Stuckenia pectinate, and Myriophyllum spicatum. The deeper parts are dominated by the thalloid red algae Hildenbrandia and an extensive distribution of barnacle, Amphibalanus improvisus. Epiphytic filamentous brown algae like Ectocarpus and Pylaiella spp. are common in Bråviken, both in shallow and deeper parts (Swedish Metrological Hydrological Institute, 2018).
According to the Swedish Maritime Administration, 2800 commercial ships passes through Bråviken, to the harbor in Norrköping, every year. To enable this there has been extensive dredging of the seafloor and dumping of sediments about 8 km from our sampling site. We consider 8 km to be enough of a buffer zone not to disturb our cored site. Norrköping has a long history of industries, starting with iron and weapon manufactories in the seventeenth century. During the eighteenth century the metal industry was declining due to the peace, while the textile and paper industries were on the rise (Gejvall-Seger, 1978). These two industries dominated the area during the nineteenth century, with several paper mills located in Norrköping and its surroundings (Sjunnesson and Wahlberg, 2003). Norrköping has continued to be an important industrial city during the twentieth century. Today, the ecological status of the outer part of Bråviken is moderate, while the inner parts are considered having poor ecological status (Vatteninformation Sverige, 2018), and hence heavily affected by eutrophication.
Himmerfjärden
Himmerfjärden (N58°59.616′, E17°43.295′) is an estuary of ca 30 km2, located ca 40 km south of Stockholm. The bathymetry of Himmerfjärden is steep since the estuary is the result of a tectonically induced fault in the bedrock. Threshold depth at the inlet is ca 15 m, and the maximum and mean water depths are 45 and 17 m, respectively. Salinity is ca 6–7 in the surface, with slightly more saline bottom waters. In 2011, macrophyte cover was investigated at several sites in Himmerfjärden (Swedish Metrological Hydrological Institute, 2018). At 2 meters depth Cladophora spp. were dominating, and below 3 meters filamentous brown algae (Ectocarpus/Pylaiella spp.), attached to Fucus vesiculus were covering the seafloor.
The third largest lake in Sweden, Lake Mälaren, has its main outlet in Stockholm, but is also drained through a lock in Södertälje, into the Himmerfjärden estuary (Elmgren and Larsson, 1997). The lock opened in 1819, and was rebuild in 1924 (Nordström, 1968). Prior to the opening of the lock, Lake Mälaren was isolated from the Baltic Sea since around 1200 CE (Douglas Price et al., 2018). The drainage area for Himmerfjärden is 1,286 km2, of which ca 20% is arable land (Elmgren and Larsson, 1997). Södertälje is the major urban area, located upstream from Himmerfjärden estuary. During the nineteenth century several industries were established in Södertälje and they expanded and became more numerous in the early twentieth century. This enabled population growth in Södertälje and the vicinities, especially during the 1940s (Nordström, 1968). Today Södertälje has a population of ca 70,000 residents. According to the Swedish Maritime Administration, 2700 commercial ships and 9000 leisure boats passes through Himmerfjärden, in and out of Lake Mälaren, every year.
In 1974 the sewage treatment plant, Himmerfjärdsverket, opened with ca 90,000 people connected, using the Himmerfjärden estuary as recipient. Since the opening, there has been several full-scale experiments with nutrient discharge in the bay, and the water quality in Himmerfjärden has been closely studied in the environmental monitoring of the recipient, with respect to e.g., nutrient levels, redox conditions of bottom waters, and phytoplankton biomass (Elmgren and Larsson, 1997; Savage et al., 2002). Today the sewage treatment plant serves ca 314,000 people and most of the wastewater from the southern suburbs of Stockholm end up here (Winnfors, 2009). Himmerfjärden is at present affected by eutrophication and is classified as having moderate ecological status (Vatteninformation Sverige, 2018).
Ådfjärden
Ådfjärden (N59°00.573′, E18°02.282′) is located in the southern part of Stockholm archipelago, ca 30 km south of Stockholm. This water basin has an area of ca 5 km2, a maximum water depth of 30 m, and thresholds in the north and south are 12 and 19 m, respectively. Salinity in the basin is ca 6, with more freshwater surface waters during winter and spring months. The national environmental monitoring program has no site in Ådfjärden, and therefore there is almost no such data available for this site. Epibenthos was investigated once in 2011 on the eastern side of Ådfjärden. At 7 meters depth Blue mussels, Mytilus edulis, and the red algae Coccotylus truncatus were dominating the seafloor (Swedish Metrological Hydrological Institute, 2018).
Ådfjärden is surrounded by mainland and islands, which are characterized by a thin soil cover and bare bedrock. The vegetation is typical for the archipelago with sparse, mixed forests and some, not extensive, agricultural land. There are no urban areas within the drainage area nor fairway through Ådfjärden, which means it is relatively unaffected by boat traffic. This site is sheltered with about 10 km of archipelago separating it from the open Baltic Sea. Also Ådfjärden is classified as having moderate ecological status and is thus affected by eutrophication (Vatteninformation Sverige, 2018).
Materials and Methods
Sediment Coring and Handling
The geographic locations of the sites were selected based on the bathymetry of the basins i.e., the deepest part of a basin is assumed to have recorded the most expanded and complete sediment sequence. All sites cored were positioned by the ships (R/V Skagerak and M/S Fyrbyggaren) GPS position system (Table 1). The long cores from each site (PC1205, PC1208, and UPP6A) were retrieved by a 3 or 5-meters long piston corer (PC) using 20 to 30 kg of lead weights and a freefall of 0.5 meter. PVC liners with an inner diameter 4.6 cm were used. After retrieval the cores were cut into 1 m (respective 1.25 m) long sections, sealed with end caps, marked and stored cold for later analyses in the laboratory.
To also recover the topmost soft and unconsolidated sediments the long piston cores were supplemented using a short, 1 m long, gravity corer (GC) with an inner diameter of 8 cm (GC1212, GC1219, UPP6C, and UPP6D, Table 1). The GC's were sliced into 1 cm slices, marked and stored in plastic Ziploc bags. For Ådfjärden, a second short core (UPP6D) was collected and pushed out on deck, where it was documented by photography. The number of laminas were estimated by counting of the laminas visual to the naked eye.
All sediment core sections were stored in the cold room before opening. In the laboratory, the piston core liner sections were opened by cutting them lengthwise. One half of the core was placed into a core tray for visual inspection and documentation, both as written core description and by photography. This core section was then put back into the cold room and stored as a reference half. The other half of each core section was used for sub-sampling for radiocarbon dating, diatom stratigraphy, and geochemistry.
Dating, Core Correlation, and Age-Depth Modeling
Sediment samples were sieved using a mesh size of 250 μm for datable macrofossils. Found macrofossils were examined under a stereo microscope when needed, determined to species, or genus level when possible and dried in an oven at 40°C before dating. A total of 13 macrofossil samples, both terrestrial and marine, have been dated by radiocarbon accelerator mass spectrometry (AMS) at the Radiocarbon Dating Laboratory, Lund University, Sweden and at Beta Analytical, USA. The results are summarized in Table 2. Sample LuS11138 from Bråviken was excluded from the age-depth modeling as it was impossible to calibrate due to its young age.
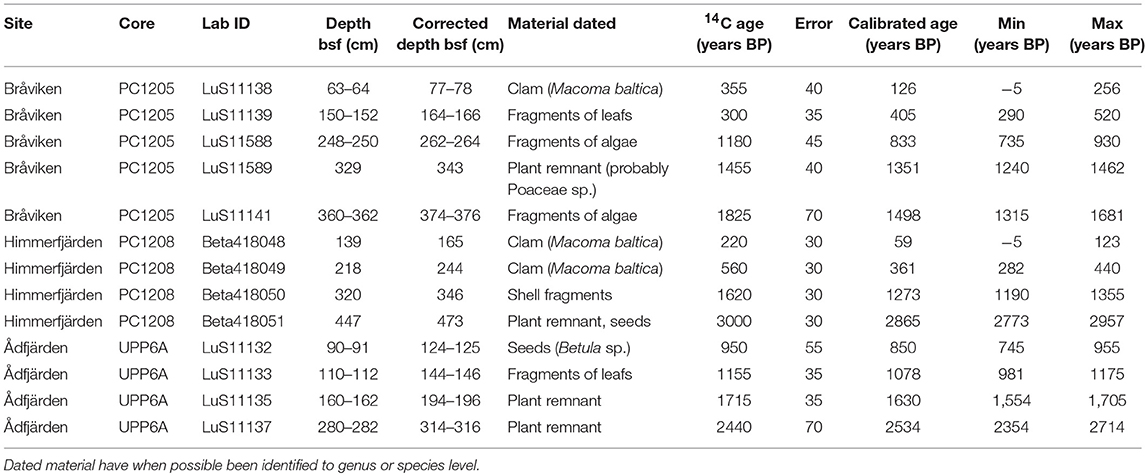
Table 2. Dating results.
The age-depth modelings were performed using the age-modeling software CLAM version 2.2 (Blaauw, 2010) by the means of applying a smooth spline curve between dated levels with 10,000 iterations. The marine samples were calibrated using a custom-built calibration curve with a ΔR of −135 ± 40 to compensate for the regional offset from the Marine13 calibration dataset (Reimer et al., 2013). The chosen ΔR is a mean based on the values for ΔR for clams, both suspension and deposit feeders, in three study sites relatively close to Bråviken, Himmerfjärden, and Ådfjärden as reported in the Marine Reservoir Correction Database (http://calib.org/marine/), Map No 1710, 1717, and 1718 (Lougheed et al., 2013). In the case of Bråviken and Himmerfjärden with both marine and terrestrial macrofossils in the dataset, radiocarbon ages derived from terrestrial macrofossils were calibrated separately using CLAM and the IntCal13 calibration dataset (Reimer et al., 2013) and entered as calendar years at the age-depth modeling. Ådfjärden contained only terrestrial macrofossils and was therefore age-depth modeled using the IntCal13 calibration dataset.
Gamma Dating Center, Institute of Geography, University of Copenhagen has analyzed the short gravity cores for the activity of 210Pb and 137Cs via gamma spectrometry. The measurements were carried out on Canberra ultralow-background Ge-well-detector. 137Cs measurements of cores UPP6A, PC1205, and PC1208 were carried out at the Leibniz Institute for Baltic Sea Research Warnemünde (IOW) using Canberra detectors (GCW4021-7500SL-RDC-6-ULB).
Constant Rate of Supply (CRS) method was applied for the upper parts of the cores using the modified method by Appleby (2001). Apart from the 137Cs signal deriving from the Chernobyl accident in 1986 CE we have also included the increase in 137Cs-curve attributed to the nuclear weapons testing dated to ca 1960 CE in the age determination. The lower parts of the cores were dated by a linear regression assuming constant sediment accumulation.
For mercury measurements at the IOW we used a DMA-80 analyzer from MLS Company. Data were calibrated against CRM (BCR) 142R certified reference material and SRM 2709 soil standard using 5 concentration steps covering a range from 5 to 500 ng Hg. Sample weights were between 20 and 100 mg. For further analytical details and details regarding quality assurance see Leipe et al. (2013).
Correlations and estimations of offsets between long and short cores are based on matching of the mercury (Hg) and the 137Cs profiles in both the short gravity cores and the long piston cores (Figure 2). To further strengthen this correlation we used two 137Cs markers, 1960 CE and 1986 CE, as fix-points in addition to the Hg-curve, an approach successfully applied to offshore Baltic Sea sediments (Moros et al., 2017). It was then possible to construct a complete splice sediment sequence for each site. Based on this splice sequence the ages from the 210Pb dating were added to the age dataset and entered into CLAM as calendar years and thus been included in the age-depth models. Using these 210Pb ages it has been possible to determine the sediment accumulation rate in the upper part of the sediment sequence which is too young for the radiocarbon dating method, and to achieve similar sedimentation rates in the overlapping intervals. These correlations show that between 14 and 34 centimeters of the very soft water saturated sediments were “lost” in the top of the long piston cores. All ages discussed in the following refer to calibrated ages in years CE.
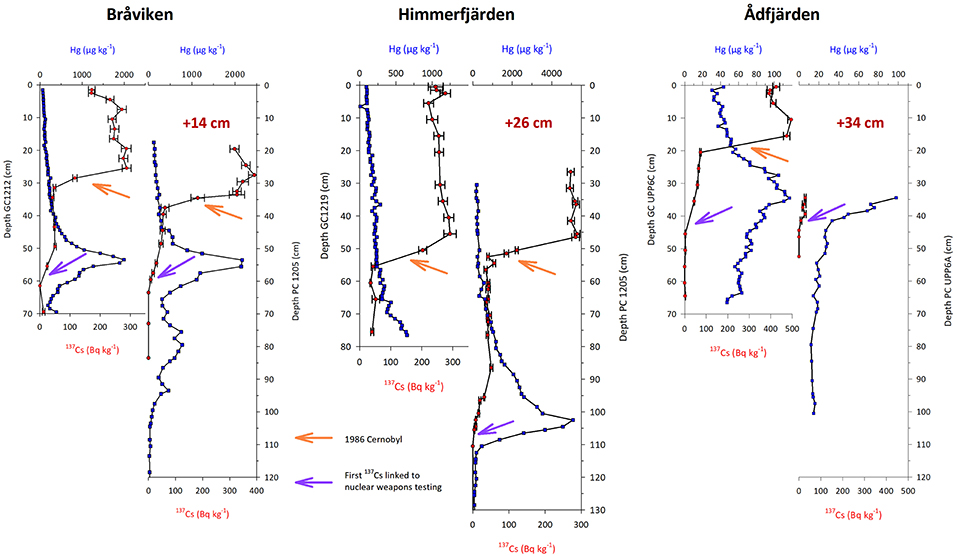
Figure 2. Correlation between the short gravity cores (GC) and the long piston cores (PC) from the sites Bråviken, Himmerfjärden, and Ådfjärden. Marker levels used as fixpoint for the correlations, 137Cs increase linked to the nuclear weapons testing at c. 1960 and the 1986 Cernobyl accident, indicated by purple and orange arrows, respectively. Offset between the gravity cores and the piston cores indicated in red text.
Geochemical Analyses
For the analyses of organic carbon (Corg), nitrogen (N) and stable isotopes δ13C and δ15N all samples were run twice to detect carbonates in the sediment. However, no carbonates were detected in any of the samples. A quantity of 7–8 mg of freeze-dried, grinded, and homogenized sediment were put in tin and silver capsules. The tin capsules were immediately sealed. In the silver capsules, ca 100 μl of 2M HCl was added to remove carbonates, and the samples were dried overnight at 60°C. The silver capsules were then sealed the next day. The samples were analyzed in a Finnigan DeltaV advantage mass spectrometer connected to a CarloErba NC2500 elemental analyzer through a ConfloIV open split interface. The carbon and nitrogen isotope measurements were normalized to the Vienna PeeDee Belemnite and atmospheric N according to (%0) = [(Rsample - Rstandard) / Rstandard] × 1,000. Accuracy of the Corg and N measurements was 0.01%, and the precision was +/−0.09 and +/−0.02% for Corg and N, respectively. Precision of the stable isotopes δ13C and δ15N measurements was +/−0.15%0, and the accuracy was 0.04 and 0.05%0 for δ13C and δ15N, respectively. The same methods as well as similar instruments and pretreatment of samples have previously been used for Baltic Sea sediments (e.g., Voss et al., 2000; Jokinen et al., 2018; Ning et al., 2018). A total of 50 subsamples were analyzed from Bråviken, 55 subsamples from Himmerfjärden and 35 subsamples from Ådfjärden.
The δ13C values were corrected for the depletion in atmospheric δ13C since 1840 CE due to fossil-fuel burning, the so called “Suess effect” (Keeling, 1979). We used the equation from Verburg (2007) to calculate the modeled δ13Catm for a given year, which was then subtracted from the modeled δ13Catm for the year 1840 CE. This time-dependent depletion of δ13Catm was then added to the measured δ13Corg of our samples. The geochemical analyses were carried out at the Stable Isotope Lab, Department of Geological Sciences at Stockholm University.
Diatom Analysis
For each subsample, a quantity of ca 0.1 g freeze-dried sediment was prepared according to standard procedures (Battarbee, 1986). After the last rinse 1 ml of a microsphere stock solution with a concentration of 5.5603 × 10⁶ microspheres/ml was added. Diatoms were analyzed under light microscope using differential interference contrast and magnification × 1,000 with oil immersion. Counting of diatom valves was carried out according to the method described by Schrader and Gersonde (1978). A minimum of 300 diatom valves were counted at each level. Floras used for identification include Cleve-Euler (1951–1955), Krammer and Lange-Bertalot (1986–1991), Snoeijs (1993–1998), and Witkowski et al. (2000). Concentration of diatom valves was calculated according to the method described by Battarbee (1986). A total of 33 subsamples were prepared and analyzed from Bråviken, 24 subsamples from Himmerfjärden and 33 subsamples from Ådfjärden.
Due to a large amount of broken valves, Epithemia adnata, Epithemia sorex, and Epithemia turgida were merged into Epithemia aggregate. This will not affect the interpretation, since all these Epithemia species have similar ecology in terms of life form (epiphytic) and salinity tolerance (brackish to brackish-freshwater) (Snoeijs, 1993–1998). Diatoma moniliformis and Diatoma tenuis are both common in coastal waters of the Baltic Sea. Diatoma moniliformis is an epiphyte, while Diatoma tenuis constitutes a large part of the coastal plankton (Snoeijs and Potapova, 1998). Our samples showed a gradual transition between these two species and it was in many cases not possible to assign the valves either as Diatoma moniliformis or Diatoma tenuis. These taxa are also known to hybridize (Snoeijs and Potapova, 1998), and many of the valves in our samples were possible hybrids. We have chosen to present them as Diatoma aggregate. Based on data from the environmental monitoring we know that Diatoma tenuis is found in the plankton of Bråviken, and we have therefore chosen to interpret this species complex as pelagic. This interpretation also fits well with the other results since the increase in Diatoma aggregate is simultaneous to increases in other pelagic taxa. Vegetative cells of Skeletonema and Chaetoceros spp. were counted when possible but left out from the base sum of diatom relative abundance because of mass blooms in some levels and fluctuating preservation due to their very thin frustules.
The diatom results were assembled and cluster analyses were performed using the software Tilia and CONISS (Grimm, 1987). To detect trends and compositional changes in the diatom dataset over time, a Detrended Correspondence Analysis (DCA) was performed on the relative abundance data for each core for taxa with more than 3% in a single sample, using the rioja package (Juggins, 2015) in R 3.5.1 (R Core Team, 2018). Species richness was calculated using rarefaction analysis in the vegan package (Birks and Line, 1992; Oksanen et al., 2015).
Results
Age-Depth Modeling
It has been possible to construct calendar years age-depth models based on the splice sediment sequences and by merging the 14C and the 210Pb ages together in the calibration dataset (Figure 3). No apparent hiatuses have been detected and the splice records can therefore be considered having recorded a continuous sedimentation throughout their respective time span. The highest sedimentation rate, 15–20 mm/year, is recorded in the upper part of the core from site Himmerfjärden but also Bråviken displays a high (ca 10 mm/year) sediment accumulation rate in the upper part. The recorded sediment accumulation rate at site Ådfjärden is lower, 6 mm/year. Downcore, from ca 50–100 cm, the sediment accumulation rates decrease significantly and varies between 1 and 3 mm at all sites.
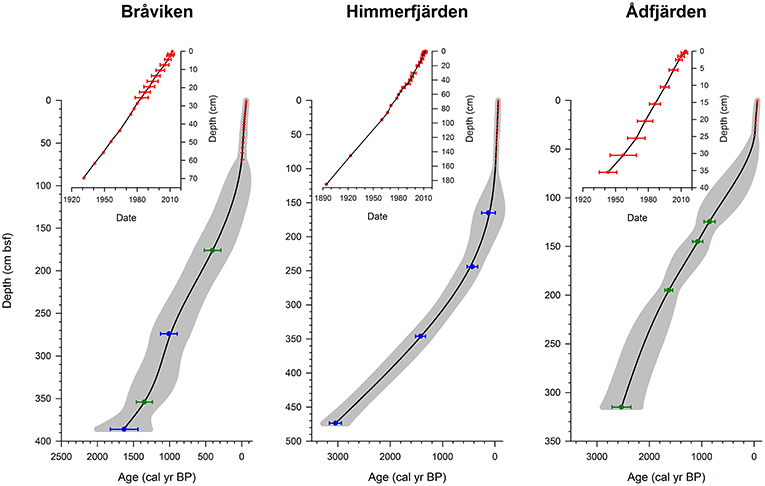
Figure 3. Age-depth plots based on 210Pb (upper panel) and 14C (lower panel). The age-depth 14C curves are spline smoothed and the gray shaded area indicates the uncertainty (1 sigma) in the modeling. Samples marked in green are terrestrial macrofossils calibrated with IntCal13 and samples marked in blue are marine macrofossils calibrated with Marine13.
Lithology
The lithologies of the sediment cores from Bråviken, Himmerfjärden, and Ådfjärden are illustrated in Figure 4. Bråviken (PC1205) consists of mud, laminated the upper ca 80 cm below sea floor (bsf), and homogeneous down to ca 210 cm bsf. The rest of the core is laminated to sulfide banded/stained. Himmerfjärden (PC1208) consists of distinctly laminated mud in the upper ca 120 cm, the laminae thickness varies between a few mm to 2 cm. The following meter is weakly/diffusely laminated (laminas on mm-scale). From ca 220 cm bsf the sediment is homogeneous with increased amount of silt downcore. Ådfjärden (UPP6A) consists of mud, distinctly to weakly laminated the upper ca 80 cm bsf, and very weakly to diffusely laminated further downcore. The 72 cm long parallel gravity core sampled in Ådfjärden (UPP6D) was laminated throughout, and the laminas were visually counted to 120 ± 10.
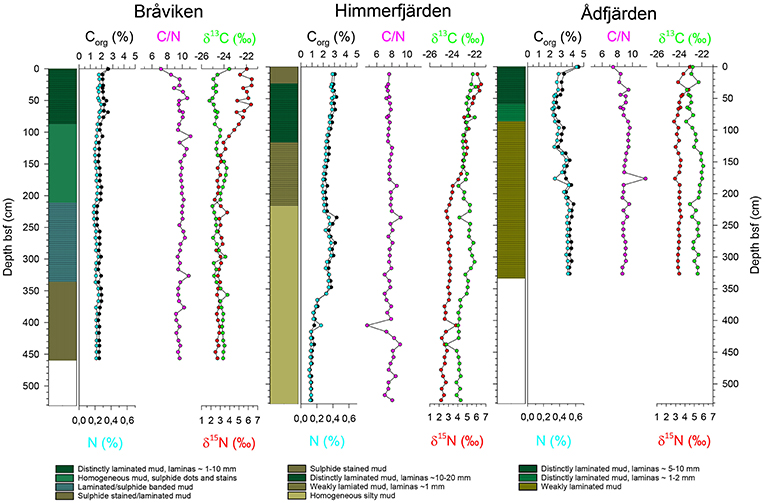
Figure 4. Lithologies and geochemical profiles for Bråviken, Himerfjärden, and Ådfjärden. Geochemistry parameters are organic carbon (Corg), nitrogen (N), organic carbon/nitrogen (C/N) ratio, and stable isotopes of δ13C and δ15N.
Geochemical Analyses
The results from the geochemical analyses (Corg, N, C/N ratio, and stable isotopes δ13C and δ15N) are plotted vs. depth cm bsf in Figure 4. Corg varies between 1 and 3% in all cores. Bråviken shows stable values of ca 2% throughout the core. Himmerfjärden displays values of 1–2% in the bottom part of the core, and higher values of ca 3% from 350 cm bsf. Ådfjärden shows values of 3.5%, with lower values of ca 2.5% from ca 150 cm bsf. As for nitrogen, Bråviken shows stable values of 0.2% throughout the core. Himmerfjärden displays values of ca 0.1% in the bottom part of the core, and higher values of ca 0.3–0.4% from 350 cm bsf. Ådfjärden shows values of ca 0.5 %, with lower values of ca 0.4% from ca 150 cm bsf. C/N ratios in all cores ranges between ca 7 and 11, with decreasing values toward the top in Bråviken and Ådfjärden, from ca 9–10 to 7–8. Stable isotope δ13C shows relatively stable values in Bråviken of ca −24%0, with slightly lower values of ca −25%0 from ca 150 cm bsf. In Himmerfjärden there is an increasing trend throughout the core, from values of ca −24 to −22%0 in the top. Ådfjärden shows values of ca −22%0, and from ca 130 cm bsf lower values of ca −23%0. Stable isotope δ15N shows the same pattern in all three cores with values of ca 3%0 in the bottom part of the core, and then an increasing trend toward the top. In Bråviken, the increasing trend starts at ca 150 cm bsf with values of 6 to 7%0 toward the top. In Himmerfjärden, the increasing trend is visible from ca 200 cm bsf with values of ca 6%0 in the top. In Ådfjärden this increasing trend starts at 50 cm bsf and continues to values of ca 4%0.
The Diatom Records
In total 177 taxa were identified in Bråviken, 116 in Himmerfjärden and 160 in Ådfjärden (Supplementary Tables 1–3). The time resolution for diatom samples varies between sites and with depths in the stratigraphies, from <10 years to 100–200 years (244 years is the maximum time between two samples). The taxa occurring with a relative abundance of at least 5% in one level are divided into benthic and pelagic taxa and plotted in order of first appearance in Figures 5–7. Based on the cluster analyses and visual inspection of the taxa in the diagrams, each stratigraphy is divided into two local diatom assemblage zones (Brå 1-2, Him 1-2, and Åd 1-2). Site by site these zones are described below.
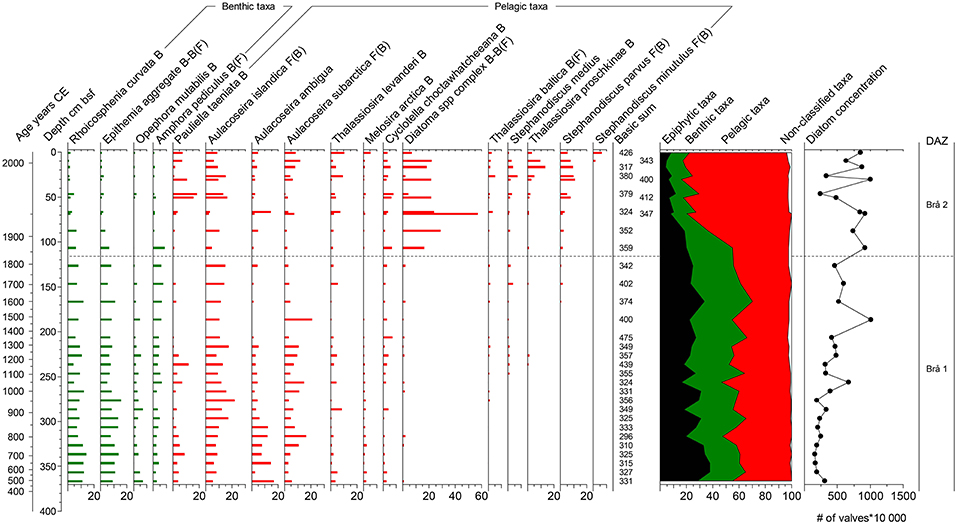
Figure 5. Diatom diagram for the site Bråviken. Taxa are grouped into benthic and pelagic taxa and plotted in order of first appearance. The linear scale is a depth scale and the secondary scale is an age scale in calendar years CE. The summary diagram shows all taxa grouped by life-form. The epiphytes constitutes a part of the benthic community. Diatom concentration are given in # of valves *100,000 per gram dry weight sediment. Salinity distribution (F = Freshwater; B = Brackish; BF = Brackish-freshwater; BM = Brackish-marine) from Snoeijs (1993–1998).
Bråviken
This site is dominated by benthic taxa up to about 120 cm bsf (~ 1800 CE), where the diatom composition changes to being dominated by pelagic taxa (Figure 5). The concentration of diatom valves show an increasing trend throughout the stratigraphy.
Brå 1, 367–115 cm bsf, ~500–1830 CE: This part of the stratigraphy is dominated by benthic taxa, for example Rhoicosphenia curvata, Epithemia aggregate, Opephora mutabilis, and Amphora pediculus. The pelagic taxa are dominated by Aulacoseira species; A. ambigua (which shows a decreasing trend), A. islandica and A. subarctica. Pauliella taeniata is present in this zone with two peaks at 360 and 270 cm bsf, followed by a decline. Other pelagic taxa present in this zone include for example Thalassiosira levanderi, Cyclotella choctawhatcheeana, and Melosira arctica.
Brå 2, 115-0 cm bsf, ~1830–2012 CE: This zone shows a dramatic decrease in benthic taxa, simultaneously to an increase in pelagic taxa, consisting mostly of Diatoma aggregate. This species complex shows a maximum of 60% at ca 70 cm bsf. Benthic taxa that decrease throughout this zone includes for example R. curvata and Epithemia aggregate. In the upper ca 70 cm bsf small pelagic taxa such as Thalassiosira proshkinae, Stephanodiscus medius, Stephanodiscus parvus, and Stephanodiscus minutulus are increasing. Also, P. taeniata increases to relative abundances similar to those before the decrease in zone Brå 1. A. subarctica show higher relative abundances toward the top of the stratigraphy.
Himmerfjärden
This site is dominated by pelagic taxa, with the exceptions in three levels at 170–210 cm bsf (~1520–1730 CE) (Figure 6). The concentration of diatom valves shows an increasing trend upwards throughout the stratigraphy.
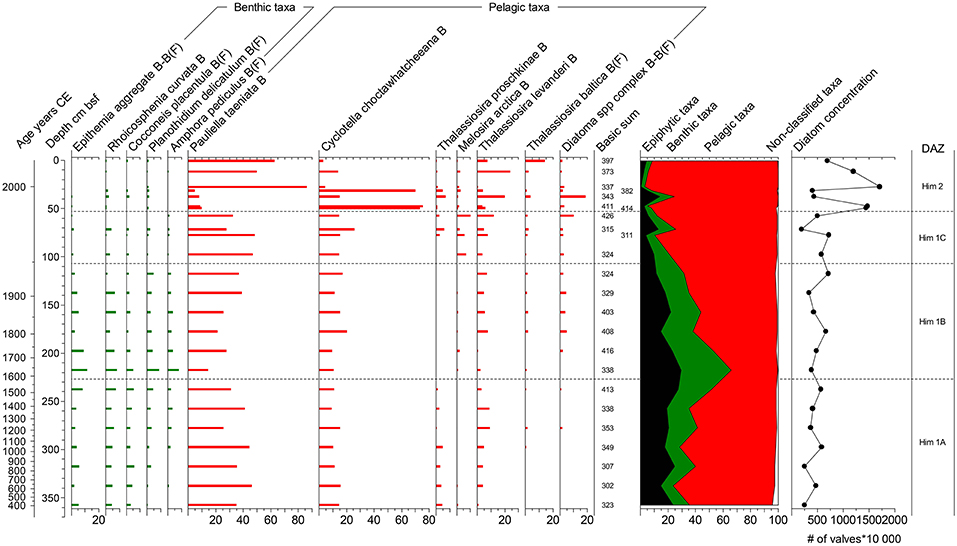
Figure 6. Diatom diagram for the site Himmerfjärden. For details see legend to Figure 5.
Him 1A, 359–227 cm bsf, ~400–1570 CE: P. taeniata dominates this zone with relative abundances of ca 20–50%. C. choctawhatcheeana is present with relative abundances of ca 15–20%. T. levanderi shows an increasing trend followed by a decrease in this zone. T. proshkinae is also present in this zone with relative abundances of ca 2–5%. Benthic taxa present in this zone is for example Epithemia aggregate, R. curvata, Cocconeis placentula, A. pediculus, and Planothidium delicatulum.
Him 1B, 227–110 cm bsf, ~1570–1950 CE: At the bottom of this zone many benthic species show a maximum in their relative abundance, for example Epithemia aggregate, R. curvata, C. placentula, A. pediculus, and P. delicatulum. From the peak of benthic taxa at ca 220 cm bsf, these taxa show a continuous decrease throughout this zone, simultaneous with an increase in pelagic taxa. The pelagic assemblage is dominated by the same taxa as in Him 1A but with slightly higher relative abundances of M. arctica, and Diatoma aggregate.
Him 1C, 110–53 cm bsf, ~1950–1984 CE: The decrease in benthic taxa continues in this zone, while pelagic taxa such as T. levanderi, T. proshkinae and Diatoma aggregate increases. The ice associated species M. arctica has its maximum occurrence in this zone.
Him 2, 53–0 cm bsf, ~1984–2012 CE: The topmost part of the Himmerfjärden stratigraphy is characterized by a drastic increase in C. choctawhatcheeana. The relative abundance of P. taeniata co-varies with C. choctawhatceeana, and also shows maximum values in this zone. Thalassiosira baltica, T. levanderi, and T. proschkinae are present and show their maximum relative abundances in Him 2, as well as Diatoma aggregate. All benthic taxa are decreasing and/or disappearing in this zone.
Ådfjärden
This site is dominated by benthic taxa up to Åd 2, which is then instead dominated by pelagic taxa (Figure 7). The concentration of diatom valves shows relatively stable values up to Åd 2, where the concentration dramatically increases.
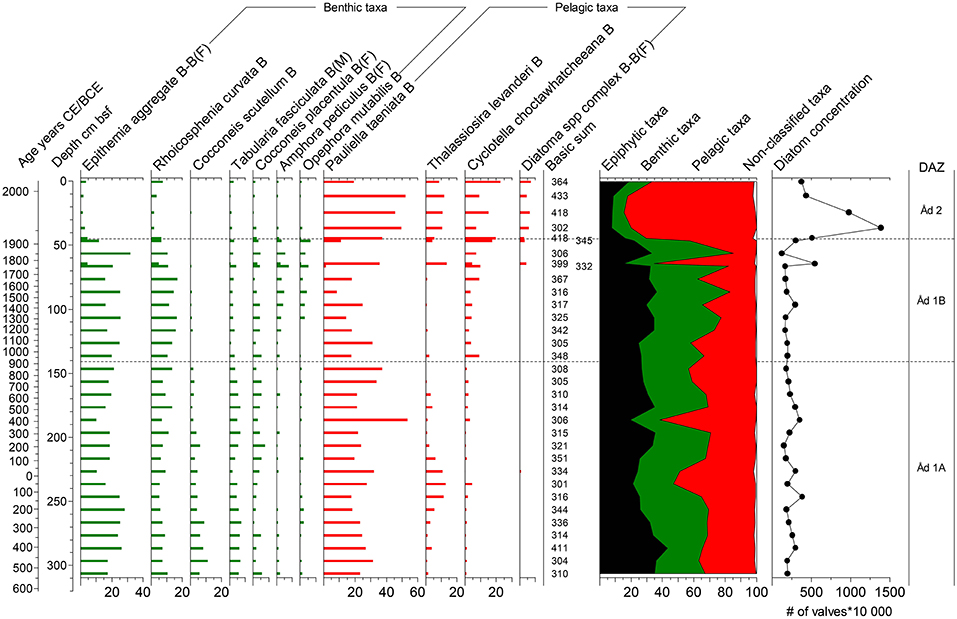
Figure 7. Diatom diagram for the site Ådfjärden. For details see legend to Figure 5.
Åd 1A, 310–140 cm bsf, ~530 BCE −800 CE: This zone is dominated by benthic taxa, for example Epithemia aggregate, R. curvata, Cocconeis scutellum, C. placentula, and Tabularia fasciculata. P. taeniata is present with relative abundances of ca 20–40%. T. levanderi shows an increase followed by a decrease from ca 230 cm bsf. C. choctawhatcheeana is present in this zone with relative abundances of ca 0–5%.
Åd 1B, 140-45 cm bsf, ~800–1920 CE: In this zone A. pediculus and O. mutabilis show their maximum occurrence. Simultaneously C. scutellum and T. fasciculata have decreased compared to zone Åd 1A. Toward the top of this zone several pelagic taxa are increasing, e.g., T. levanderi, C. choctawhatcheeana, and Diatoma aggregate. C. choctawhatcheeana also shows a minor increase already at the bottom of this zone.
Åd 2, 45–0 cm bsf, ~1920–2014 CE: The topmost part of the Ådfjärden stratigraphy is characterized by a drastic decrease in benthic taxa, e.g., Epithemia aggregate and R. curvata. Up to this level, benthic taxa have been dominating with percentages of ca 50–70%. This now drops to values of ca 20–30%. The pelagic taxa dominating this zone are P. taeniata, T. levanderi, and C. choctawhatcheeana. This shift in the diatom assemblage is simultaneous with the increase in concentration of diatom valves in the sediment.
Discussion
Geochemical Proxies and Lithologies
In the Baltic Sea stable nitrogen isotope (δ15N) values at the sediment surface are generally higher in coastal areas (5–13%0) than in the open Baltic Sea (3–5%0) (Voss et al., 2000, 2005). The cause for the elevated values in coastal areas is suggested to be anthropogenic nitrogen delivered by rivers and diffuse runoff (Voss et al., 2005). Our results show that all three sites have low values of ca 2–3%0 until a point from which they start to increase toward present day (Figures 4, 8). In Bråviken and Himmerfjärden an early slight increase is recorded already from ca 1700 CE and 1600 CE, respectively. A more pronounced increase starts ca 1800 CE at these two sites and continues to values of ca 6%0 toward present day. In Ådfjärden an increase in sedimentary δ15N is visible from ca 1900 CE. However, at this site the values never exceed 5%0, which suggests that this site is to a lesser degree impacted by anthropogenic nitrogen. Savage et al. (2010) have studied the drivers of eutrophication in an embayment in the northern part of Himmerfjärden. Their core dates back to ca 1800 CE, and records elevated δ15N values from early nineteenth century. The early changes in our record from Himmerfjärden with respect to δ15N are not captured in their study, since the values from 1800 CE are interpreted as background levels.
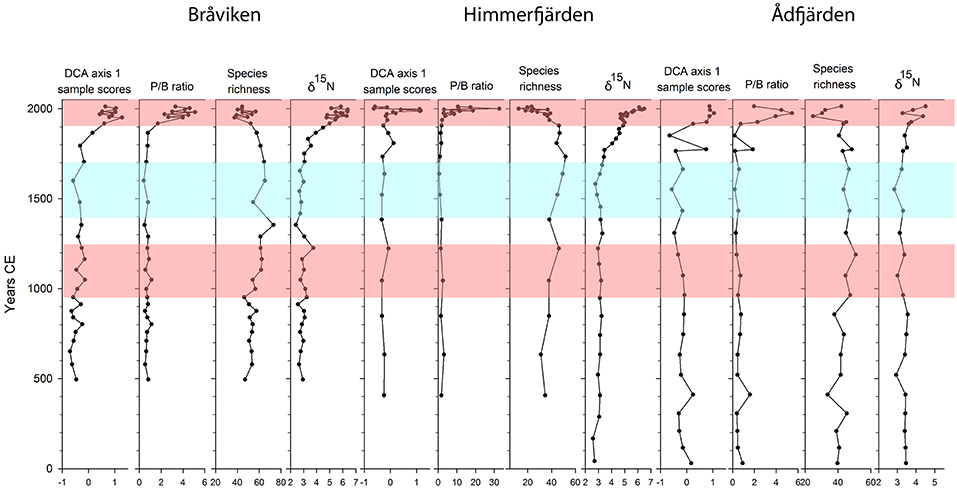
Figure 8. Summary figure showing axis 1 sample scores from a Detrended Correspondence Analysis (DCA), the pelagic/benthic (P/B) ratio, diatom species richness, and changes in the nitrogen stable isotope δ15N. DCA axis 1 summarizes trends and compositional changes in the diatom dataset over time. Medieval Climate Anomaly and Modern Warm Period are marked in red, and Little Ice Age in blue. These time periods are defined as by Mann et al. (2009) and Harland et al. (2013).
Due to the differences in carbon sources for phytoplankton and land plants, they produce organic matter with different stable carbon isotope (δ13C) values. Marine phytoplankton produce organic matter with δ13C values of −18 to −22%0, while land plants show values of −25 to −28 %0 (Kandasamy and Nagender Nath, 2016 and references therein). The δ13C values from Bråviken, Himmerfjärden, and Ådfjärden (Figure 4) lie between these two intervals with values of ca −22 to −25%0, indicating that the origin of the organic material derives both from terrestrial plants and marine phytoplankton. In Himmerfjärden there is a decrease in δ13C toward the top, suggesting increased primary production at this site. However, in a coastal and brackish system where the primary producers are a mixture of marine and freshwater algae, the interpretation of δ13C becomes more complicated. According to Lamb et al. (2006) δ13C values of land plants and freshwater algae overlaps, land plants displaying values of −21 to −32%0, and freshwater algae −26 to −30%0. The C/N ratio can then aid in interpreting the sources of organic matter. Since terrestrial plants consists to a high degree of nitrogen-poor cellulose and lignin, the C/N ratios are usually >12. In algae the C/N ratios are <10. The C/N ratios from Bråviken, Himmerfjärden, and Ådfjärden are all in the range of 6–10, suggesting that the origin of organic material in these sediments mostly derives from algae, i.e., is produced in the basin (Lamb et al., 2006). Bråviken and Ådfjärden display a decrease in C/N ratio in the topmost part of the cores, which could indicate even less input from land, or, more likely, higher primary production in these coastal waters. However, Lamb et al. (2006) also points out that even with the help of C/N ratio, it can be difficult to distinguish the sources of organic material in coastal areas with high algal production.
Laminated sediments have proven to be a useful proxy for hypoxia in the open Baltic Sea (Zillén et al., 2008 and references therein). Absence of major benthic fauna and bioturbation under hypoxic conditions facilitates the preservation of laminas. However, the lithologies of the cores from Bråviken, Himmerfjärden, and Ådfjärden are not as easy to interpret as the ones from the open Baltic Sea. Lithologies are shown in Figure 4, but these are in some measure uncertain in the identification of hypoxic intervals because of presence of diffusely laminated sediments and sulfide banding. Presumably these results can for example be explained by seasonal hypoxia and the dynamic nature of the coastal zone, with redox conditions shifting from oxic to hypoxic and vice versa. Recolonization events of benthic fauna would lead to bioturbation of laminated sequences, leaving them weakly laminated.
Changes in the Diatom Assemblages
The diatom records in this study dates back to ca 400 CE in Bråviken and Himmerfjärden, and to 500 BCE in Ådfjärden. We consider these records to reflect pristine conditions of the sites. In Bråviken and Ådfjärden the diatom assemblages are dominated by benthic taxa, with a high share of epiphytes (diatoms living attached to algae or submerged plants). These are for example Epithemia spp., Rhoicosphenia curvata, Cocconeis spp., Amphora pediculus and Opephora mutabilis. Also in Himmerfjärden these taxa are present, although in this record, pelagic taxa are dominating, except for in three levels, corresponding to ca 1520–1730 CE.
At a certain point in time, all three diatom records start to display major changes. These trends and compositional changes over time are summarized in the DCA axis 1 (Figure 8). The changes in life-form of the diatom taxa is reflected in the Pelagic/Benthic (P/B) ratio where an increasing trend in the P/B ratio reflects a decrease in benthic and epiphytic taxa, and a simultaneous increase in pelagic taxa.
The increasing trend in the P/B ratios starts ca 1900 CE in Bråviken and Ådfjärden, and ca 1950 CE in Himmerfjärden and is likely caused by a deterioration in water transparency, leading to a loss in benthic habitats, in particular macrophytes. This interpretation is further supported by the decreases in epiphytic taxa as illustrated in Figures 5–7. Similar patterns with increased P/B ratios have been shown in several studies from the Baltic Sea drainage area (Clarke et al., 2006; Ellegaard et al., 2006; Weckström, 2006; Andrén et al., 2016; Ning et al., 2018), and have been linked to agricultural expansion, industrialization and urbanization. In addition, several of these studies report a simultaneous decrease in species richness, also evident in our study (Figure 8).
The change in P/B ratios is also a result of an increase in the relative abundance of small centric diatom taxa which has been recognized in several paleoecological studies from the Baltic Sea as a response to eutrophic conditions (e.g., Andrén, 1999; Weckström, 2006; Tuovinen et al., 2010). In a dataset of 49 shallow embayments from the Gulf of Finland Weckström and Juggins (2006) showed how these taxa clearly increase in abundance with elevated nutrient levels (>600 μg·L−1 for total dissolved nitrogen and >60 μg·L−1 for total phosphorous). In the records from Bråviken, Himmerfjärden, and Ådfjärden, we register a pattern with increased relative abundances of small centric diatom taxa toward present day. These taxa include e.g., Stephanodiscus parvus, Thalassiosira proschkinae, Thalassiosira levanderi, and Cyclotella choctawhatcheeana, and this is interpreted as a result of eutrophication at these sites.
Small Stephanodiscus species (in particular S. parvus) are freshwater species, typical of nutrient-rich lakes (Bradshaw and Anderson, 2001; Renberg et al., 2001; Bradshaw et al., 2005). S. parvus and S. medius have been recorded in high abundances in the eutrophic and brackish Curonian Lagoon in the southeast Baltic Proper (Snoeijs, 1993–1998). S. medius, S. minutulus, and S. parvus have increased since the end of the nineteenth century in Bråviken, indicating enhanced eutrophic conditions.
The small pelagic taxon Cyclotella choctawhatcheeana is present in all three sites and is increasing toward present day in Himmerfjärden and Ådfjärden. This species blooms during warm summer months and has been shown to be an indicator of eutrophic conditions in the Baltic Sea (Andrén et al., 1999; Weckström et al., 2004) and in Chesapeake Bay, USA (Cooper, 1995). In Himmerfjärden C. choctawhatcheeana shows stable relative abundances of ca 15–20% until the 1970s−1980s when this species increases to relative abundances of almost 80% at some levels. This is attributed to the opening of the sewage treatment plant in the 1970s. Also Thalassiosira proschkinae has been found to indicate eutrophication in Chesapeake Bay (Cooper, 1995), and in a training set from the Gulf of Finland this species has been shown to respond to high phosphorus levels (Weckström and Juggins, 2006). T. proschkinae is present in Himmerfjärden from about 400 to 1500 CE when it disappears and reappear ca 1960 CE. This species is also present in Bråviken, showing an increase toward the end of the twentieth century.
Thalassiosira levanderi has been reported to dominate the spring bloom together with Pauliella taeniata and Chaetoceros spp. after winters with extended sea ice and late ice-out conditions in Himmerfjärden (Hajdu et al., 1997). However, T. levanderi is hard to interpret since it also seems to respond to elevated nutrient conditions (Hajdu et al., 1997). It has also been suggested that this species is more common after winters with weak or no ice cover (Tuovinen et al., 2010). T. levanderi is present at all our three study sites, with higher relative abundances toward the present day. This pattern has also been reported from a sediment core from the Bornholm basin (Andrén et al., 2000b). In Ådfjärden this species was more common during two intervals, ca year 0 CE, and toward present day. Since both ice extent and nutrient conditions play a role for the distribution of this species these two events might not represent comparable environmental conditions. However, these time intervals correspond to Roman Warm Period and Modern Warm Period (Wang et al., 2012; Harland et al., 2013), and our results indicate that this species benefits from conditions that prevail during warmer periods, e.g., with respect to salinity, stronger stratification, or nutrient availability.
Pauliella taeniata is very common in the plankton of the Baltic Sea (Snoeijs, 1993–1998). This species has also been shown to live in and on sea ice (Hajdu et al., 1997). With the exception of Himmerfjärden, this species shows an increasing trend toward the present day. The same general pattern has been reported from Gotland basin (Andrén et al., 2000a). P. taeniata shows its lowest relative abundances ca 1250–1950 CE in Bråviken, ca 1650 CE and from 2000 CE in Himmerfjärden, and ca 1850 CE in Ådfjärden. Nothing in our data indicates that P. taeniata reflects ice conditions, but this species probably responds to some other environmental variables such as nutrient availability, stratification or upwelling.
Aulacoseira islandica, Aulacoseira subarctica, and Aulacoseira ambigua are freshwater species that are common in Bråviken throughout the stratigraphy. Aulacoseira spp. form colonies, the frustules are heavily silicified and have a fast sinking rate (Lotter et al., 2010). Due to this, Aulacoseira spp. are favored by nutrient upwelling and turbulent waters (Wang et al., 2008). It has been recorded from lakes in regions with pronounced warming during the last century that heavily silicified Aulacoseira spp. decrease in abundance (Rühland et al., 2008). However, it has also been reported from a lake in the southern part of Kamchatka peninsula that A. subarctica did not do well in years with ice cover. This species need wind induced mixing and thrives during years when thermal stratification was delayed by cold and windy weather (Lepskaya et al., 2010). In Bråviken the recorded pattern indicates higher relative abundances of Aulacoseira spp. during the last 50 years and the MCA than during the LIA. This could be attributed to changes in the extension and duration of sea ice, but also to decreased river discharges during the LIA (Schimanke and Meier, 2016). Low levels of river discharges affect the salinity, but would also reduce the availability of silica in the Baltic Sea, which could have a negative effect on the heavily silicified Aulacoseira spp.
Baltic Sea Environmental Deterioration in a Long-Term Perspective
It has been suggested that the extensive areal distribution of hypoxia in the open Baltic Sea during the MCA, and the following re-oxygenation event was caused by fluctuations in land use, as a result of demography changes in the drainage area (Zillén and Conley, 2010). The results from Bråviken, Himmerfjärden, and Ådfjärden indicate that conditions in the coastal zone were not severely altered during the MCA (Figure 8). Since land use changes likely will influence the coastal zone first, before possible effects are registered in the open Baltic Sea, our results indicate that the changes in redox conditions in the open Baltic Sea during the MCA and the LIA were not caused by human activities on land. Land use changes during the last millennium might have affected the coastal ecosystems slightly. However, as the coastal areas were not heavily affected, it is unlikely that changes in demography and land use would have had major effects on development and persistence of hypoxia in the open Baltic Sea. This interpretation is further supported by results from Jokinen et al. (2018) and Ning et al. (2018). The extensive areal distribution of hypoxia in the open Baltic Sea during the MCA was more likely caused by the warmer climate. A warmer climate enhances stratification, which sustains hypoxia and anoxia in deep waters (Kabel et al., 2012).
In Bråviken the first signs of eutrophication are recorded ca 1800 CE. This is reflected in the increase in δ15N and in changes in the diatom assemblages, as illustrated by DCA axis 1 (Figure 8). Eutrophication of Bråviken could have been a direct result of the paper and textile industries and their discharges, intensified agriculture in the large drainage area, or an interaction of both causes. In Himmerfjärden the earliest sign of eutrophication is the increase in δ15N, starting ca 1800 CE. The eutrophication signals in Himmerfjärden get more pronounced from ca 1900 CE, with the decrease in diatom species richness, and from ca 1950 CE the increase in P/B ratio is recorded (Figure 8). This corresponds to the expansion of Södertälje and the industries in this area, during the 1940s. The opening of the sewage water treatment plant in 1974 is distinct in the diatom stratigraphy from Himmerfjärden, as reflected in DCA axis 1. In Ådfjärden the eutrophication signals are recorded from ca 1900 CE. This site is the most remote and “pristine” of the three sites in this study, with no urban area or extensive agriculture in its vicinity.
In a sediment record from the Swedish east coast dating back to 900 CE Ning et al. (2018) interpreted more eutrophic conditions from ca 1850 CE using the stable nitrogen isotope record. The diatom data in this study shows an increase in the P/B ratio starting ca 1900 CE. A study from the Archipelago Sea traced hypoxia and eutrophication in a record covering more than 1500 years (Jokinen et al., 2018). They report elevated δ15N values from ca 1900 CE. Both these studies show similar trends as those we have recorded in Bråviken, Himmerfjärden and Ådfjärden, although Bråviken, and Himmerfjärden show signs of eutrophication even earlier, around 1800 CE. Our results highlight the importance of a longer time perspective than the environmental monitoring can provide. Additional methods are needed in order to determine reference conditions and our studies of sediment cores have shown that this type of archives have great potential to fill the current knowledge gaps.
Conclusions
• We find no evidence in our data supporting that the extensive distribution of hypoxia in the open Baltic Sea during the Medieval Climate Anomaly was caused by human activities on land.
• The onset of eutrophication, as identified from stable nitrogen isotopes and changes in diatom composition, dates to ca 1800 CE in Bråviken and Himmerfjärden, and to ca 1900 CE in Ådfjärden.
• The ecosystem deterioration that have occurred in our three investigated coastal sites during the last two centuries and that have escalated during the twentieth century is unique in a thousand year perspective.
• The onset of these ecosystem changes is site dependent and reflects the local history and geography of the drainage areas.
• Our study highlights the importance of a long time perspective in the management of the Baltic Sea.
Author Contributions
LN, TA, and EA designed the study and performed the field work. LN did lab work, prepared the samples for geochemistry analyses and did the diatom analysis and wrote the manuscript for most parts. EA and TA aided in interpreting and discussing the results. TA produced the age models and wrote the parts on this in the manuscript. ML performed and supervised statistical analyses. MM provided Hg and 137Cs for correlation of the cores. TJA performed 210Pb-datings. All authors contributed to the writing of the manuscript.
Funding
This study was financially supported by a grant to EA provided by The Foundation for Baltic and East European Studies (1562/3.1.1/2013). EA and TA were further supported by Stockholm County Council. Östersjöstiftelsen is the Swedish name for The Foundation for Baltic and East European Studies.
Conflict of Interest Statement
The authors declare that the research was conducted in the absence of any commercial or financial relationships that could be construed as a potential conflict of interest.
Acknowledgments
We thank the captain and crew of M/S Fyrbyggaren, as well as R/V Skagerak. Heike Siegmund, Department of Geological Sciences, Stockholm University is thanked for help with stable isotope and elemental analyses. We also thank the two reviewers for constructive and helpful comments on the manuscript.
Supplementary Material
The Supplementary Material for this article can be found online at: https://www.frontiersin.org/articles/10.3389/fenvs.2019.00088/full#supplementary-material
References
Andrén, E. (1999). Changes in the composition of the diatom flora during the last century indicate increased eutrophication of the oder estuary, South-western Baltic Sea. Estuar. Coast. Shelf Sci. 48, 665–676. doi: 10.1006/ecss.1999.0480
Andrén, E., Andrén, T., and Kunzendorf, H. (2000a). Holocene history of the Baltic Sea as a background for assessing records of human impact in the sediments of the Gotland Basin. Holocene 10, 687–702. doi: 10.1191/09596830094944
Andrén, E., Andrén, T., and Sohlenius, G. (2000b). The Holocene history of the southwestern Baltic Sea as reflected in a sediment core from the Bornholm Basin. Boreas 29, 233–250. doi: 10.1080/030094800424259
Andrén, E., Shimmield, G., and Brand, T. (1999). Environmental changes of the last three centuries indicated by siliceous microfossil records from the southwestern Baltic Sea. Holocene 9, 25–38. doi: 10.1191/095968399676523977
Andrén, E., Telford, R. J., and Jonsson, P. (2016). Reconstructing the history of eutrophication and quantifying total nitrogen reference conditions in Bothnian Sea coastal waters. Estuar. Coast. Shelf Sci. 198, 320–328. doi: 10.1016/j.ecss.2016.07.015
Appleby, P. G. (2001). “Chronostratigraphic techniques in recent sediments,” in Tracking Environmental Change Using Lake Sediments, Vol 1: Basin Analysis, Coring and Chronological Techniques, eds W. M Last and J. P.Smol (Dordrecht: Kluwer Academic Publishers), 171–204.
Battarbee, R. W. (1986). “Diatom analysis,” in Handbook of Holocene Palaeoecology and Palaeohydrology, ed B. E. Berglund (Chichester: Johan Wiley & Sons Ltd., 527–570.
Bianchi, T. S., Engelhaupt, E., Westman, P., Andrén, T., Rolff, C., and Elmgren, R. (2000). Cyanobacterial blooms in the Baltic Sea: natural or human-induced? Limnol. Oceanogr. 45, 716–726. doi: 10.4319/lo.2000.45.3.0716
Birks, H. J. B., and Line, J. M. (1992). The use of rarefaction analysis for estimating palynological richness from quaternary pollen-analytical data. Holocene 2, 1–10. doi: 10.1177/095968369200200101
Blaauw, M. (2010). Methods and code for ‘classical’ age-modelling of radiocarbon sequences. Quat. Geochronol. 5, 512–518. doi: 10.1016/j.quageo.2010.01.002
Bradshaw, E. G., and Anderson, N. J. (2001). Validation of a diatom–phosphorus calibration set for Sweden. Freshw. Biol. 46, 1035–1048. doi: 10.1046/j.1365-2427.2001.00732.x
Bradshaw, E. G., Rasmussen, P., Nielsen, H., and Anderson, N. J. (2005). Mid-to late-Holocene land-use change and lake development at Dallund Sø, Denmark: trends in lake primary production as reflected by algal and macrophyte remains. Holocene 15, 1130–1142. doi: 10.1191/0959683605hl885rp
Clarke, A. L., Weckström, K., Conley, D. J., Anderson, N. J., Adser, F., Andrén, E., et al. (2006). Long-term trends in eutrophication and nutrients in the coastal zone. Limnol. Oceanogr. 51, 385–397. doi: 10.4319/lo.2006.51.1_part_2.0385
Cleve-Euler, A. (1951–1955). “Die Diatomeen von Schweden und Finnland,” in Kungliga Vetenskapsakademiens Handlingar I-V. (Stockholm: Almqvist & Wiksell), 4:e serien 2:1 (1951), 3:3 (1952), 4:1 (1953), 4:5 (1953), 5:4. (1955).
Conley, D. J., Carstensen, J., Aigars, J., Axe, P., Bonsdorff, E., Eremina, T., et al. (2011). Hypoxia is increasing in the coastal zone of the Baltic Sea. Environ. Sci. Technol. 45, 6777–6783. doi: 10.1021/es201212r
Cooper, S. R. (1995). Diatoms in sediment cores from the mesohaline chesapeake bay, U.s.a. Diatom Res. 10, 39–89 doi: 10.1080/0269249X.1995.9705329
Douglas Price, T., Arcini, C., Gustin, I., Drenzel, L., and Kalmring, S. (2018). Isotopes and human burials at Viking Age Birka and the Mälaren region, east central Sweden. J. Anthropol. Archaeol. 49, 19–38. doi: 10.1016/j.jaa.2017.10.002
Ellegaard, M., Clarke, A. L., Reuss, N., Drew, S., Weckström, K., Juggins, S., et al. (2006). Multi-proxy evidence of long-term changes in ecosystem structure in a Danish marine estuary, linked to increased nutrient loading. Estuar. Coast. Shelf Sci. 68, 567–578. doi: 10.1016/j.ecss.2006.03.013
Elmgren, R. (2001). Understanding human impact on the baltic ecosystem: changing views in recent decades. AMBIO J. Hum. Environ. 30, 222–231. doi: 10.1579/0044-7447-30.4.222
Elmgren, R., and Larsson, U. (1997). Himmerfjärden: Förändringar i ett Näringsbelastat Kustekosystem i Östersjön. Stockholm: Naturvårdsverket.
Grimm, E. C. (1987). CONISS: a FORTRAN 77 program for stratigraphically constrained cluster analysis by the method of incremental sum of squares. Comput. Geosci. 13, 13–35. doi: 10.1016/0098-3004(87)90022-7
Gustafsson, B. G., Schenk, F., Blenckner, T., Eilola, K., Meier, H. E. M., Müller-Karulis, B., et al. (2012). Reconstructing the development of baltic Sea eutrophication 1850–2006. AMBIO J. Hum. Environ. 41, 534–548. doi: 10.1007/s13280-012-0318-x
Hajdu, S., Larsson, U., and Skärlund, K. (1997). “Växtplankton,” in Himmerfjärden: Förändringar i ett Näringsbelastat Kustekosystem i Östersjön, eds R. Elmgren and U. Larsson (Stockholm: Naturvårdsverket, 63–79.
Harff, J., and Meyer, M. (2011). “Coastlines of the Baltic Sea – Zones of Competition Between Geological Processes and Changing Climate: Examples from the Southern Baltic.,” in The Baltic Sea Basin, eds J. Harff, S. Björck, and P. Hoth (Berlin; Heidelberg: Springer-Verlag), 149–164. doi: 10.1007/978-3-642-17220-5_7
Harland, R., Polovodova Asteman, I., and Nordberg, K. (2013). A two-millennium dinoflagellate cyst record from Gullmar Fjord, a Swedish Skagerrak sill fjord. Palaeogeogr. Palaeoclimatol. Palaeoecol. 392, 247–260. doi: 10.1016/j.palaeo.2013.09.006
Jokinen, S. A., Virtasalo, J. J., Jilbert, T., Kaiser, J., Dellwig, O., Arz, H. W., et al. (2018). A 1500-year multiproxy record of coastal hypoxia from the northern Baltic Sea indicates unprecedented deoxygenation over the 20th century. Biogeosciences 15, 3975–4001. doi: 10.5194/bg-15-3975-2018
Juggins, S. (2015). Rioja: Analysis of Quaternary Science Data. Available online at: https://cran.r-project.org/web/packages/rioja/index.html (accessed November 7, 2015).
Kabel, K., Moros, M., Porsche, C., Neumann, T., Adolphi, F., Andersen, T. J., et al. (2012). Impact of climate change on the Baltic Sea ecosystem over the past 1,000 years. Nat. Clim. Change 2, 871–874. doi: 10.1038/nclimate1595
Kandasamy, S., and Nagender Nath, B. (2016). Perspectives on the terrestrial organic matter transport and burial along the land-deep sea continuum: caveats in our understanding of biogeochemical processes and future needs. Front. Mar. Sci. 3:259 doi: 10.3389/fmars.2016.00259
Keeling, C. D. (1979). The Suess effect: 13 carbon-14 carbon interrelations. Environ. Int. 2, 229–300. doi: 10.1016/0160-4120(79)90005-9
Kotilainen, A. T., Arppe, L., Dobosz, S., Jansen, E., Kabel, K., Karhu, J., et al. (2014). Echoes from the Past: a healthy baltic sea requires more effort. AMBIO J. Hum. Environ. 43, 60–68 doi: 10.1007/s13280-013-0477-4
Krammer, K., and Lange-Bertalot, H. (1986–1991). In: Ettl, H., Gärtner J. G., Gerloff J., Heynig H., Mollenhauer D., eds. Süsswasserflora von Mitteleuropa Bd 2. Stuttgart: Fischer. T. 1, Naviculaceae (1986), T. 2, Bacillariaceae, Epithemiaceae, Surirellaceae (1988), T. 3, Centrales, Fragilariaceae, Eunotiaceae (1991) T. 4, Achnanthaceae (1991).
Lamb, A. L., Wilson, G. P., and Leng, M. J. (2006). A review of coastal palaeoclimate and relative sea-level reconstructions using δ13C and C/N ratios in organic material. Earth-Sci. Rev. 75, 29–57. doi: 10.1016/j.earscirev.2005.10.003
Leipe, T., Moros, M., Kotilainen, A., Vallius, H., Kabel, K., Endler, M., et al. (2013). Mercury in Baltic Sea sediments - natural background and anthropogenic impact. Chem. Erde-Geochem. 73, 249–259. doi: 10.1016/j.chemer.2013.06.005
Leppäranta, M., and Myrberg, K. (2009). Physical Oceanography of the Baltic Sea. Berlin: Springer/Praxis Pub.
Lepskaya, E. V., Jewson, D. H., and Usoltseva, M. V. (2010). Aulacoseira subarctica in Kurilskoye Lake, Kamchatka: a deep, oligotrophic lake and important Pacific salmon nursery. Diatom Res. 25, 323–335. doi: 10.1080/0269249X.2010.9705853
Ljungqvist, F. C., Krusic, P. J., Brattström, G., and Sundqvist, H. S. (2012). Northern Hemisphere temperature patterns in the last 12 centuries. Clim. Past 8, 227–249. doi: 10.5194/cp-8-227-2012
Lotter, A. F., Pienitz, R., and Schmidt, R. (2010). “Diatoms as indicators of environmental change in subarctic and alpine regions,” in The Diatoms : Applications for the Environmental and Earth Sciences, eds J. P. Smol and E. F. Stoermer (Cambridge: Cambridge University Press), 231–248. doi: 10.1017/CBO9780511763175.013
Lougheed, B. C., Filipsson, H. L., and Snowball, I. (2013). Large spatial variations in coastal 14C reservoir age–a case study from the Baltic Sea. Clim. Past 9, 1015–1028. doi: 10.5194/cp-9-1015-2013
Mann, M. E., Zhang, Z., Rutherford, S., Bradley, R. S., Hughes, M. K., Shindell, D., et al. (2009). Global signatures and dynamical origins of the little ice age and medieval climate anomaly. Science 326, 1256–1260. doi: 10.1126/science.1177303
Moros, M., Andersen, T. J., Schulz-Bull, D., Häusler, K., Bunke, D., Snowball, I., et al. (2017). Towards an event stratigraphy for Baltic Sea sediments deposited since AD 1900: approaches and challenges. Boreas 46, 129–142. doi: 10.1111/bor.12193
Myrdal, J. (1999). Det Svenska Jordbrukets Historia. [Bd 2], Jordbruket Under Feodalismen : 1000–1700. Stockholm: Natur och kultur.
Myrdal, J., and Morell, M. (2011). The Agrarian History of Sweden: From 4000 BC to AD 2000. Lund: Nordic Academic Press.
Ning, W., Nielsen, A. B., Norbäck Ivarsson, L., Jilbert, T., Åkesson, C. M., Slomp, C. P., et al. (2018). Anthropogenic and climatic impacts on a coastal environment in the Baltic Sea over the last 1000 years. Anthropocene 21, 66–79. doi: 10.1016/j.ancene.2018.02.003
Oksanen, J., Blanchet, F. G., Kindt, R., Legendre, P., Minchin, P. R., O'Hara, R. B., et al. (2015). Vegan: Community Ecology Package. Available online at: https://cran.r-project.org/web/packages/vegan/index.html (accessed November 7, 2015).
Persson, J., and Jonsson, P. (2000). Historical development of laminated sediments – an approach to detect soft sediment ecosystem changes in the Baltic Sea. Mar. Pollut. Bull. 40, 122–134. doi: 10.1016/S.0025-326X.(99)00180-0
R Core Team (2018). R: A Language and Environment for Statistical Computing. R Foundation for Statistical Computing, Vienna, Austria. Available online at: https://www.R-project.org/.
Reimer, P. J., Bard, E., Bayliss, A., Beck, J. W., Blackwell, P. G., Bronk Ramsey, C., et al. (2013). IntCal13 and Marine13 Radiocarbon Age Calibration Curves 0-50,000 Years Cal BP. Available online at: http://researchcommons.waikato.ac.nz/handle/10289/8955 (accessed December 9, 2015). doi: 10.2458/azu_js_rc.55.16947
Renberg, I., Bigler, C., Bindler, R., Norberg, M., Rydberg, J., and Segerström, U. (2009). Environmental history: a piece in the puzzle for establishing plans for environmental management. J. Environ. Manage. 90, 2794–2800. doi: 10.1016/j.jenvman.2009.03.008
Renberg, I., Bindler, R., Bradshaw, E., Emteryd, O., and McGowan, S. (2001). Sediment evidence of early eutrophication and heavy metal pollution of lake mälaren, Central Sweden. AMBIO J. Hum. Environ. 30, 496–502. doi: 10.1579/0044-7447-30.8.496
Rühland, K., Paterson, A. M., and Smol, J. P. (2008). Hemispheric-scale patterns of climate-related shifts in planktonic diatoms from North American and European lakes. Glob. Change Biol. 14, 2740–2754. doi: 10.1111/j.1365-2486.2008.01670.x
Saunders, K. M., and Taffs, K. H. (2009). Palaeoecology: a tool to improve the management of Australian estuaries. J. Environ. Manage. 90, 2730–2736. doi: 10.1016/j.jenvman.2009.03.001
Savage, C., Elmgren, R., and Larsson, U. (2002). Effects of sewage-derived nutrients on an estuarine macrobenthic community. Mar. Ecol. Prog. Ser. 243, 67–82. doi: 10.3354/meps243067
Savage, C., Leavitt, P. R., and Elmgren, R. (2010). Effects of land use, urbanization, and climate variability on coastal eutrophication in the Baltic Sea. Limnol. Oceanogr. 55, 1033–1046. doi: 10.4319/lo.2010.55.3.1033
Schimanke, S., and Meier, H. M. (2016). Decadal-to-centennial variability of salinity in the Baltic Sea. J. Clim. 29, 7173–7188. doi: 10.1175/JCLI-D-15-0443.1
Schrader, H.-J., and Gersonde, R. (1978). “Diatoms and silico-flagellates,” in Utrecht Micropaleontological Bulletins 17, Micropaleontological Counting Methods and Techniques, eds W. J. Zachariasse, W. R. Riedel, A. Sanfilippo, R. R. Schmidt, M. J. Brolsma, H. J. Schrader, et al. (Hoogeveen: Loonzetterij Abe), 127–176.
Sjunnesson, H., and Wahlberg, T. (2003). Papper och Massa i Östergötland: från Handpappersbruk Till Processindustri. Stockholm: Skogsindustrierna.
Snoeijs, P. (1993–1998). Intercalibration and distribution of diatom species in the Baltic Sea. Vol. 1-5. Uppsala: Opulus press. Vol 1. (1993). Snoeijs, P. ed., Vol 2 (1994). Snoeijs, P., and Vilbaste, S. eds. Vol 3 (1995). Snoeijs, P., and Potapova, M. eds. Vol 4 (1996). Snoeijs, P., and Kasperovičiene, J. eds. Vol 5 (1998). Snoeijs, P., and Balashova, N. eds.
Snoeijs, P., and Andrén, E. (2017). “Why is the Baltic Sea so special to live in?” in Biological Oceanography of the Baltic Sea, eds P. Snoeijs-Leijonmalm, H. Schubert, and T. Radziejewska (Dordrecht: Springer), 23–84. doi: 10.1007/978-94-007-0668-2_2
Snoeijs, P., and Potapova, M. (1998). Ecotypes or endemic species?-a hypothesis on the evolution of Diatoma taxa (Bacillariophyta) in the northern Baltic Sea. Nova Hedwig. 67, 303–348.
Swedish Geological Survey (2018). Swedish Geological Survey. Marine Geological Maps, Open Access Data (2018). Available online at: http://apps.sgu.se/kartgenerator/maporder_sv.html (access September 18, 2018).
Swedish Metrological Hydrological Institute (2018). Swedish Metrological and Hydrological Institute (SMHI) Open Access Data (2018). Available online at: https://www.smhi.se/klimatdata/oceanografi/havsmiljodata/marina-miljoovervakningsdata (access September 18, 2018).
Tuovinen, N., Weckström, K., and Virtasalo, J. J. (2010). Assessment of recent eutrophication and climate influence in the Archipelago Sea based on the subfossil diatom record. J. Paleolimnol. 44, 95–108. doi: 10.1007/s10933-009-9390-z
Vatteninformation Sverige (2018). Vatteninformation Sverige, (VISS) Open Access Data (2018). Available online at: http://viss.lansstyrelsen.se (accessed March 11, 2018).
Verburg, P. (2007). The need to correct for the Suess effect in the application of δ13C in sediment of autotrophic Lake Tanganyika, as a productivity proxy in the Anthropocene. J. Paleolimnol. 37, 591–602. doi: 10.1007/s10933-006-9056-z
Voss, M., Emeis, K.-C., Hille, S., Neumann, T., and Dippner, J. W. (2005). Nitrogen cycle of the Baltic Sea from an isotopic perspective. Glob. Biogeochem. Cycles 19:GB3001. doi: 10.1029/2004GB002338
Voss, M., Larsen, B., Leivuori, M., and Vallius, H. (2000). Stable isotope signals of eutrophication in Baltic Sea sediments. J. Mar. Syst. 25, 287–298. doi: 10.1016/S0924-7963(00)00022-1
Wang, L., Lu, H., Liu, J., Gu, Z., Mingram, J., Chu, G., et al. (2008). Diatom-based inference of variations in the strength of Asian winter monsoon winds between 17,500 and 6000 calendar years BP. J. Geophys. Res. Atmospheres 113:D21101 doi: 10.1029/2008JD010145
Wang, T., Surge, D., and Mithen, S. (2012). Seasonal temperature variability of the Neoglacial (3300–2500BP) and Roman Warm Period (2500–1600BP) reconstructed from oxygen isotope ratios of limpet shells (Patella vulgata), Northwest Scotland. Palaeogeogr. Palaeoclimatol. Palaeoecol. 317–318, 104–113. doi: 10.1016/j.palaeo.2011.12.016
Weckström, K. (2006). Assessing recent eutrophication in coastal waters of the gulf of finland (Baltic Sea) using Subfossil Diatoms. J. Paleolimnol. 35, 571–592. doi: 10.1007/s10933-005-5264-1
Weckström, K., and Juggins, S. (2006). Coastal diatom–environment relationships from the gulf of finland, Baltic Sea1. J. Phycol. 42, 21–35. doi: 10.1111/j.1529-8817.2006.00166.x
Weckström, K., Juggins, S., and Korhola, A. (2004). Quantifying background nutrient concentrations in coastal waters: a case study from an urban embayment of the Baltic Sea. AMBIO J. Hum. Environ. 33, 324–327. doi: 10.1579/0044-7447-33.6.324
Willis, K. J., and Birks, H. J. B. (2006). What is natural? The need for a long-term perspective in biodiversity conservation. Science 314, 1261–1265. doi: 10.1126/science.1122667
Witkowski, A., Lange-Bertalot, H., and Metzeltin, D. (2000). Diatom Flora of Marine Coasts / Iconographia Diatomologica, Vol. 7. Ruggell: Gantner.
Zillén, L., and Conley, D. J. (2010). Hypoxia and cyanobacteria blooms-are they really natural features of the late Holocene history of the Baltic Sea? Biogeosciences 7, 2567–2580. doi: 10.5194/bg-7-2567-2010
Keywords: diatom stratigraphy, stable nitrogen isotopes, hypoxia, Medieval Climate Anomaly, NW Baltic proper, nutrient discharge
Citation: Norbäck Ivarsson L, Andrén T, Moros M, Andersen TJ, Lönn M and Andrén E (2019) Baltic Sea Coastal Eutrophication in a Thousand Year Perspective. Front. Environ. Sci. 7:88. doi: 10.3389/fenvs.2019.00088
Received: 18 December 2018; Accepted: 27 May 2019;
Published: 12 June 2019.
Edited by:
Marcus Reckermann, Helmholtz Centre for Materials and Coastal Research (HZG), GermanyReviewed by:
Selvaraj Kandasamy, Xiamen University, ChinaOscar E. Romero, University of Bremen, Germany
Copyright © 2019 Norbäck Ivarsson, Andrén, Moros, Andersen, Lönn and Andrén. This is an open-access article distributed under the terms of the Creative Commons Attribution License (CC BY). The use, distribution or reproduction in other forums is permitted, provided the original author(s) and the copyright owner(s) are credited and that the original publication in this journal is cited, in accordance with accepted academic practice. No use, distribution or reproduction is permitted which does not comply with these terms.
*Correspondence: Lena Norbäck Ivarsson, bGVuYS5ub3JiYWNrLml2YXJzc29uQHNoLnNl