 Masih Eghdami
 Ana P. Barros
- Civil and Environmental Engineering, Duke University, Durham, NC, United States
Long-duration localized heavy rainfall (> 6 h, < 10 km2) was recorded by raingauges on October 4, 2013 at mid-elevations (~ 1, 500 m) in the Peruvian Andes, which was not apparent in infrared or microwave measurements from either geostationary or polar orbiting satellites. This spring event is investigated here through a numerical modeling study using the Weather and Research Forecasting (WRF) model, and examined in the context of the climatology of Cold Air Intrusions (CAIs) along the eastern flanks of the tropical Andes. The model results suggest significant precipitation enhancement from intense shallow convection at the CAI frontal boundary amplified by orographic lifting as it propagates northward latched to the slopes of Andes. Analysis of CAI mesoscale dynamics was conducted using four decades of European Center Medium-Range Weather Forecasts (ECMWF) reanalysis, Tropical Rainfall Measurement Mission (TRMM) data products, and rain-gauge observations with emphasis on characterizing year-round CAI frequency, CAI interactions with Andes topography, and their impact on orographic precipitation climatology. The data show a robust enhancement of the diurnal cycle of precipitation during CAI events in all seasons, and in particular increases in surface rainfall rate during early morning at intermediate elevations (~ 1,500 m), that is the eastern Andes orographic maximum. This link between CAI frequency and rainfall suggests that they play an important role in maintaining the Andes to Amazon year-round terrestrial connectivity through runoff production and transport by the river networks.
Introduction
The Andes mountain range is the most prominent topographic feature of South America and modulates the weather and climate of the continent (Garreaud, 2000, 2009). Orographic effects on synoptic and regional-scale weather and climate (Barros and Lettenmaier, 1994; Houze, 2012) can lead to localized extreme rainfall events causing floods, debris flow, and landslides that reshape the landscape (e.g., Lowman and Barros, 2014). South American Cold Air Intrusions (CAI) (hereafter referred to as CAI) are year-round synoptic scale phenomena that tie the mid-latitudes to the tropics along the eastern slopes of the Andes. The focus of this manuscript is on the role of CAI in the climatology of extreme orographic precipitation in the eastern Andes.
Synoptic-scale cold intrusions of mid-latitude air to the tropics are common along north-south oriented mountain ranges (Garreaud, 2001) including the Rockies (e.g., Schultz et al., 1997), the Himalayas (e.g., Chen et al., 2002), and the Andes (Garreaud and Wallace, 1998; Garreaud, 1999a,b, 2000; Vera and Vigliarolo, 2000). Garreaud (2000) synthesized the mean synoptic structure of CAI events in the Andes based on 17-years of National Centers for Environmental Prediction-National Center for Atmospheric Research (NCEP-NCAR) reanalysis and satellite measurements of outgoing longwave radiation (OLR) to show how orographic blocking forces geostrophic southerly winds to align with the Andes and transport cold air to the tropics. Earlier studies linked CAI occurrences in the austral winter to light rainfall alone, while estimating that CAI produce 25–50% of summer precipitation over central Amazonia and adjacent plains as a result of the enhanced convective environment ahead of the cold surge (Garreaud and Wallace, 1998). Cold season episodes cause significant temperature drops near the land-surface resulting in widespread freezing conditions in the mid-latitudes and subtropical South America that have severe adverse impacts on agriculture and people. Espinoza et al. (2013) analyzed winter frost episodes (June-July-August, JJA) using in situ temperature data from 1975 to 2001, and defined extreme cold events when minimum daily temperature drops below the 10th percentile. They reported different duration and intensities for winter frost events depending on latitude with 60% of the events in the subtropics lasting about 1 day, and 15% of the events in the tropics lasting as long as 3 days. Boers et al. (2014) reported results similar to Espinoza et al. (2013) but focused instead on extreme rainfall events in the Bolivian Andes during the monsoon season (December-January-February, DJF). Hurley et al. (2015) found that most of the snow accumulation on the Quelccaya Ice Cap (QIC) in the Peruvian Andes from ~ 2003 − 2013 occurred during the monsoon, with the heaviest events that account for 70% of total snow accumulation being associated with CAIs' frontal band of enhanced convection. Following Siqueira and Machado (2004), Siqueira et al. (2005) proposed classifying CAIs in three categories: (1) interaction with tropical convection during northward propagation, (2) interaction with tropical convection along a quasi-stationary northeast to southwest convection band, and (3) no interaction with tropical convection, with the first one being most relevant for this work. During the monsoon, CAI events have been linked to emergence of organized mesoscale convective systems (MCSs) over the southern La Plata Basin (Anabor et al., 2008; Boers et al., 2015). Anabor et al. (2008) point out that while the region of convective development typically propagates north and northwestward ahead of the CAI front with MCS activity propagating eastward, occasionally there is upstream southeastward MCS propagation that is tied to the position of the South Atlantic anticyclone. Boers et al. (2015) linked southeasterly propagation of convective precipitation clusters to the Bolivian Andes during the monsoon to pressure anomalies associated with the westerly Rossby Wave (RW) propagating over the Andes as it interacts in the leeside with the northwestern Argentinian low-pressure center (NAL, Seluchi et al., 2003). Besides the different modes of CAI interaction with tropical convection, past CAI climatology studies also focused on trajectory (Lupo et al., 2001) and life-cycle analysis related to westerly RW interactions between the subtropical and polar jets (Müller and Berri, 2007). In particular, Müller and Ambrizzi (2007) linked CAI causing generalized frosts to a double RW train approaching South America (SA) between the subtropical and polar jets. The trajectories of these anomalies may or may not merge as they approach western SA, which subsequently impacts whether they are in-phase (favorable to strong CAI) or out-of-phase on the lee side of the Andes.
The linkages between CAI timing and frequency over long time-scales were investigated by Li and Fu (2006). Specifically, they showed how CAIs played an important role in priming the large-scale environment over the Amazon for the monsoon onset by impacting upper troposphere conditions and low level moist static energy early in the austral spring. Furthermore, they attributed monsoon onset delays to decreased CAI frequency and intensity in the transition season (September, October, November, SON). This finding was confirmed by Yin et al. (2014) who pointed out that poleward displacement of the Southern Hemisphere Subtropical Jets under global warming leads to weaker CAI activity causing late initiation of the monsoon in global climate model (GCM) simulations. Nevertheless, Yin et al. (2013) showed that GCM's handicaps in predicting fully CAI space-time features result in significant simulated rainfall bias, especially in the transition seasons, and more so in the spring (SON). In the austral winter, that is the dry season (May-September), GCM CAI climatology also points to decreases in frequency albeit accompanied by increases in intensity under global warming (Cavalcanti et al., 2013).
An open question following Li and Fu's (2006) work concerns the relative role of local and remote processes. Local processes such as multiscale land-atmosphere interactions depending on land cover and soil moisture conditions can strongly influence the development and organization of the convective activity ahead of the storm. Moreover, telecoupling to remote climatological phenomena such El Niño Southern Oscillation (ENSO) and the Southern Annular Mode (SAM) plays a role in determining favorable or unfavorable SON environmental conditions for CAI's northward propagation (e.g., Siqueira and Machado, 2004). For instance, Medvigy et al. (2012) linked CAI frequency and intensity increases in the western Amazon to deforestation. Likewise, Sun and Barros (2015a) showed that decreases in evapotranspiration from Andean forests up to mid-elevations on the eastern slopes weaken convective activity, modifying the South American Low Level Jet (LLJ), ultimately reducing upslope moisture convergence and orographic precipitation. Besides being critical to moisture recycling in the Amazon proper, evapotranspiration from forests in the Amazon foreland also plays an important role in the dynamics of regional-scale circulations that modulate the diurnal cycle of precipitation in the Andes (Sun and Barros, 2015b). How these feedbacks may be enhanced or weakened in the future due to recent evidence of shifts in forest cover along the Andes foothills is an open question (Aide et al., 2019). Understanding the interplay of large-scale circulation, regional climate, and land-use and land-cover (LULC) change from the Andes to the Amazon, and potential alterations of CAI seasonality and consequently shifts of the timing of monsoon onset requires long-term high-resolution integrated modeling and observations.
Zipser et al. (2006) investigated global storm activity based on Tropical Rainfall Measurement Mission (TRMM) satellite observations: they used the 40-dBZ reflectivity height from the TRMM Precipitation Radar (PR) measurements as an indicator of updraft strength, along with the minimum brightness temperature of precipitation features at 37 and 85 GHz, and the collocated lightning flash rates. Their study shows that the most intense, long lasting, and deepest convection in the world occurs in subtropical South America, a finding replicated by Boers et al. (2016). Rasmussen and Houze (2011) classified Andean convective activity in three types according to their morphology: deep convective cores, wide convective cores, and storms with large stratiform regions, with the second type being the most frequent in the southeastern South America at lower elevations. Due to the challenges of correcting ground-clutter contamination and the complexity of low-level stratiform precipitation systems with embedded convection, the detection and classification of shallow orographic precipitation in mountainous regions is very challenging (Prat and Barros, 2010a,b; Duan et al., 2015; Arulraj and Barros, 2017, 2019) resulting in severe underestimation of precipitation rates in the eastern Andes (Lowman and Barros, 2014). Ground-based precipitation observations are therefore key to detect and measure extreme events such as the isolated (< 10 km2) torrential event (~ 30 mm hr−1 for 6 h) in the Peruvian Andes on October 4, 2013 that motivated this work (Figure 1).
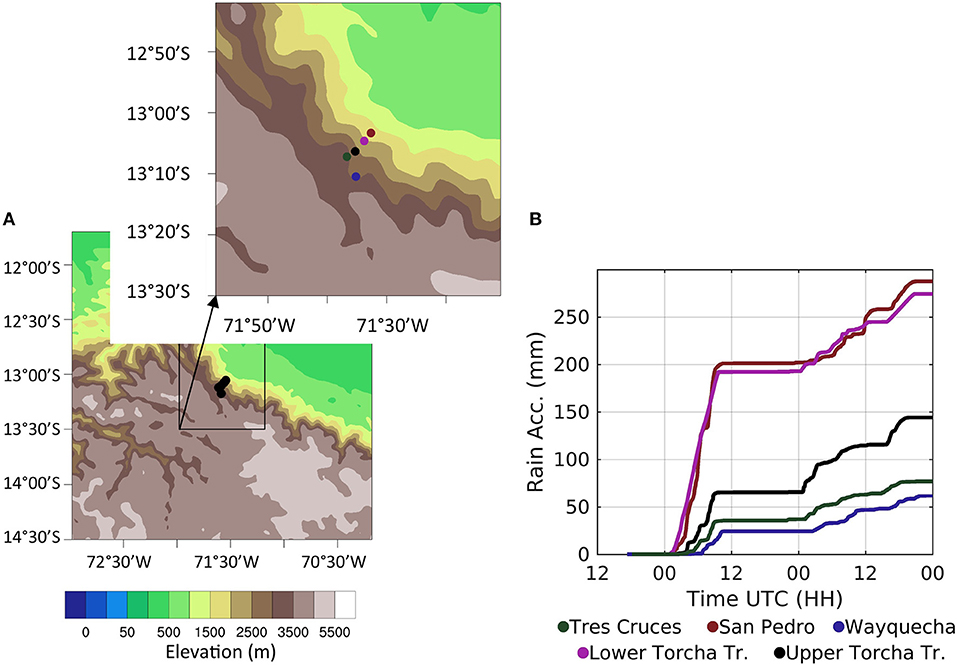
Figure 1. (A) Location of the rain-gauges used in this study and Madre de Dios Transect (inset) in the Peruvian Andes. (B) Cumulative rainfall curves (CRCs) from 2013-10-03 12:00 Local Time (LT) to 2013-10-06 00:00 LT for all rain-gauges. The CRC color is the same as the corresponding rain-gauge mark in the inset map.
Previous CAI studies have focused most often on CAI dynamics and cold season weather such as frost impacts. In this manuscript, the objective is to investigate the link between CAI and extreme orographic precipitation in the eastern Andes. Although a challenging endeavor due to scarce ground-based observations and remote sensing limitations, the integration of long-term reanalysis, satellite data, and rain-gauge observations enables probing the relationship between orographic precipitation extremes and CAIs in the context of regional weather and climate. Specifically, ERA-Interim reanalysis data (39 years) are used to revisit the mean structure and frequency of CAI events in the Peruvian Andes. The data and the methodology used for detecting CAI are presented in section Data and methodology, and the numerical simulations are described and examined vis-à-vis the CAI synoptic scale climatology from reanalysis in section Case study - October 4, 2013. In section Rainfall observations, long-term statistics of CAI are interpreted in the light of rainfall data in the foothills and western Amazon basin toward assessing the role of CAI on orographic precipitation climatology. Discussion and Conclusions follow in section Conclusions and Outlook.
Data and Methodology
Rainfall Data
A torrential rainfall event on October 4, 2013 was recorded by rain-gauges along an altitudinal transect in the Madre de Dios river basin (Barros, 2013) with up to 200 mm of rainfall measured over ~6 h at the orographic maximum (~ 1, 500 m elevation) in the eastern Andes comparable to precipitation produced by land-fallen tropical cyclones in the Atlantic Coastal Plain of the US. Figure 1 shows the geographic setting of all rain-gauges used in this study (right panel and inset) as well as the cumulative rainfall curves (CRCs) for the rain-gauges in the Madre de Dios transect during the event. The rain-gauge locations are provided in Table 1.
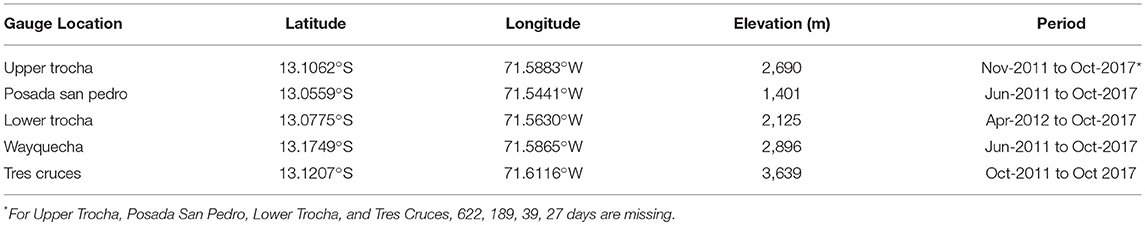
Table 1. Rain gauge location and time in service.
Precipitation Features (PFs, http://atmos.tamucc.edu/trmm/data/trmm/level_2/rpf/) derived from Tropical Rainfall Measuring Mission (TRMM) measurements after Nesbitt et al. (2000) and Liu et al. (2008) are used here to determine the composite diurnal cycle of rainfall on two altitudinal bands above and below the orographic maximum (~ 1,500 m). PFs were classified into five categories for analysis corresponding to 20, 30, 40, 50, 100 (mm hr−1) average areal rain rate (volumetric rain per unit area) and maximum near surface rain rate from the TRMM 2B31 product (Tropical Rainfall Measuring Mission, 2011). Terrain elevation at the center of each of PF determines the altitudinal band to which the PF belongs for a period of record of more than 16 years (December, 1997—September, 2014). The analysis is centered in the Peruvian Andes (9°−17°S, 60°−80°W) spanning a distance of about 400 km northward and southward from the Madre de Dios network, and one of the hot-spots region identified by Chavez and Takahashi (2017).
CAI Climatology
The CAI climatology was constructed based on 39 years of European Center for Medium-Range Weather Forecasts (ECMWF) ERA-Interim reanalysis between 1979 and 2017 (Berrisford et al., 2011; Dee et al., 2011). The data consist of 60 vertical levels from the surface to 0.1 hPa with horizontal resolution of 0.75° × 0.75° available daily at 00, 06, 12, and 18 UTC. Mean sea level pressure (MSLP), temperature at 925 hPa (T925), vertically integrated Moisture Convergence (MC) and horizontal wind and specific humidity at 12 pressure levels between 100 and 1,000 hPa (100, 200, 300, 400, 500, 600, 700, 800, 850, 900, 950, 1,000) are used in this study for CAI detection analysis following the methodology described by Garreaud (2000). First, an initial set of events is chosen based on the frequency with which the spatial average 24-h MSLP trends (δMSLP) in the region between 55.5° - 60°W and 22.50° - 27.00°S exceeds the 10th percentile of its monthly climatology. Next, to ensure the existence of a high pressure system, and therefore a cold front in the domain of study, only events for which the spatial average of MSLP exceeds the 10th percentile of its next-day monthly regional value are retained. The median of the time that the conditions for event detection are met is defined as day-0 and the 24 h before and after that time are defined as day-1 and day+1, respectively. For the analysis of rainfall data, the 2 day period between day-1 and day+1 is defined as a CAI event, and other times are considered as non-CAI days. Further, when the inter-event time is <2.5 days, only the stronger events are retained for analysis to ensure event independence. This methodology yields the detection of 726 events between 1979 and 2017.
Figure 2 shows 3 months of 24-h MSLP and MLSP trends (δMSLP), and 925 hPa-air temperature (T925) from the beginning of September until the end of November, 2013. The seven events detected during this period are identified by vertical lines. CAI intensity expressed in terms of pressure increase and temperature drop varies significantly from event to event. In particular, note that the pressure changes for the extreme event on October 4th, 2013 are not distinct from all the others. This suggests that beyond synoptic–scale forcing, there is an important role for regional—(moisture convergence, atmospheric stability) and local-scale conditions (orographic forcing) to determine the location and magnitude of extreme events.
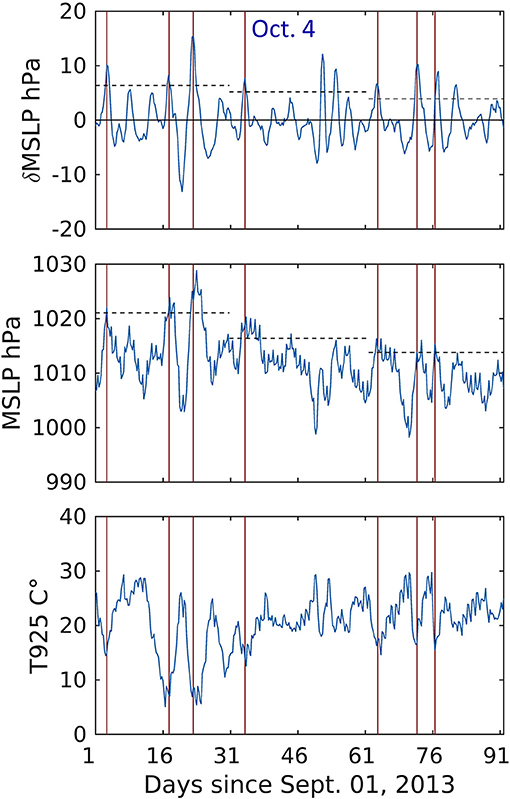
Figure 2. Time series of (top) 24-h Sea Level Pressure tendencies (δMSLP), (middle) averaged Sea Level Pressure (MSLP) and (bottom) 925-hPa air temperature averaged in the area between 55.5° - 60°W and 22.50°-27.00°S coordinates, starting from the beginning of Sept. until the end of Nov. 2013. The vertical lines mark CAI events detected during this period. The horizontal dashed lines show the monthly 10th percentile of δMSLP and MSLP in the top and middle panels, respectively.
Case Study—October 4, 2013
Previously, moist orographic processes over the Andes were simulated using the Weather and Research Forecasting (WRF, Skamarock et al., 2008) model by Sun and Barros (2015a,b) and de la Torre et al. (2015) among others. The WRF simulation of the October 2013 event presented here relies on these and other orographic precipitation studies with regard to selection of model physical parameterizations, numerical grid design, as well as specification of initial and boundary conditions.
A 3-domain one-way nested grid is set-up (Figure 3) with 18, 6, and 1.2 km grid-spacing following Sun and Barros (2014, 2015a) who successfully investigated interactions between strong synoptic systems and complex topography. Simulations were conducted using WRF 3.8.1 to solve the non-hydrostatic and fully compressible flow equations with a 6-h spin-up time in the outer domain and one-way coupling between nested grids. The grid-spacing ratio between the outer (D01, 18 km) and intermediate (D02, 6 km) domains is 1:3 with 316 ×496 and 433 ×547 horizontal grid points, respectively (Figure 3). The grid-spacing ratio between the intermediate and inner domains (D03, 1.2 km) with 756 ×726 horizontal grid points is 1:5. All the domains have 90 vertical atmospheric layers with top at 50 hPa, and 4 soil layers. Initial and boundary conditions are extracted from the National Centers for Environmental Prediction Final Operational Global Analysis (NCEP-FNL) available at 1° ×1° resolution every 6 h (Kalnay et al., 1996) with 26 vertical layers between 1,000 to 10 hPa in addition to the surface layer following Sun and Barros (2015a,b).
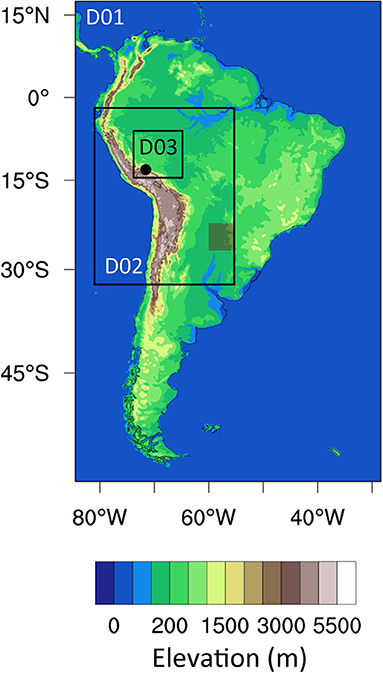
Figure 3. Domain setup for numerical simulations with 3 nested domains with increasingly higher grid resolution: D01 (18 km), D02 (6 km), and D03 (1.2 km). The small shaded box shows the region where the ECMWF reanalysis data are used for detecting the events. The black circle marks the region highlighted in Figure 1 where the rain-gauges are installed.
The selection of physical parameterizations was informed by recent studies of orographic precipitation (e.g., Wilson and Barros, 2015, 2017) and includes the Mellor–Yamada–Nakanishi–Niino (MYNN level 2.5; Nakanishi and Niino, 2006) planetary boundary layer scheme, the Milbrandt microphysics scheme (Milbrandt and Yau, 2005a,b), and the Noah land surface model (Ek et al., 2003). The Rapid Radiative Transfer Model (RRTM) (Mlawer et al., 1997) and the Dudhia scheme (Dudhia, 1989) are used to describe longwave and shortwave radiation at 1-min intervals. The Kain-Fritsch cumulus parameterization (Kain, 2004) scheme is applied in the outer and intermediate domains, whereas in the inner domain, convective processes are explicitly resolved.
Figure 4 shows simulated fields of MSLP, and 850 hPa winds and geopotential heights every 6 h starting on October 3 at 06Z. Synoptic scale context is provided by movies of the evolution of 500 and 850 hPa geopotential heights and winds in Supplemental Informations S1a,b. For reference, composite MSLP, and 850 hPa level horizontal winds for all CAI events in the austral spring (September, October, and November, SON) 1979–2017 are also provided for day-1, day-0, and day+1 (Supplemental Information S1c). The main driver of the October 2013 event is the migratory high-pressure system that moves eastward from the South Pacific associated with eastward mid-latitude wave propagation along the subtropical jet consistent with climatology (e.g., Garreaud, 2009). The large-scale structure shows poleward orientation of mid-latitude trajectories west of south SA due to orographic blocking by the Andes (Supplemental Informations S1a,b). The MSLP of the case study is about 5 hPa lower than climatology in the subtropics both for the day before (day-1) and the day of the event (day-0), which is favorable to convective activity. More interestingly, early on in the development of the October 4, 2013 event (day-1), a strong high-pressure system is present in the South Atlantic (~ 40°W, 50°S) that forms a stationary mid-latitude dipole with a low pressure center to the north (~40°S) at the same longitude. The dipole moves slowly eastward after 18Z on day-1 (October 3) and is out of the domain by day+1 (October 5). As the westerly migratory high-pressure system moves over the Andes (~ 45°S), atmospheric blocking by the mid-latitude pressure dipole enhances counterclockwise geostrophic circulation on the lee-side of the Andes, thus favoring the development of a mid-latitude anticyclone confined to continental SA (~60°W). Orographic blocking in the lower troposphere (< 700 hPa) to the west along the eastern slopes of the Andes forces the development of ageostrophic southerly winds pushing CAI that are further enhanced by cyclonic circulation over the Rio de la Plata (~55°W, 35°S) on day-0 and into day+1. Persistent southerly winds during this period reach the tropics fueling convective activity along the frontal boundary between the CAI air mass and warm moist tropical air well into day+2 (October 6, Figure 4). After the high-pressure system passes over the mountains, regional circulation changes returning to non-CAI conditions with northerly winds toward the South Atlantic Convergence Zone (SACZ) by day+3 (October 7, not shown).
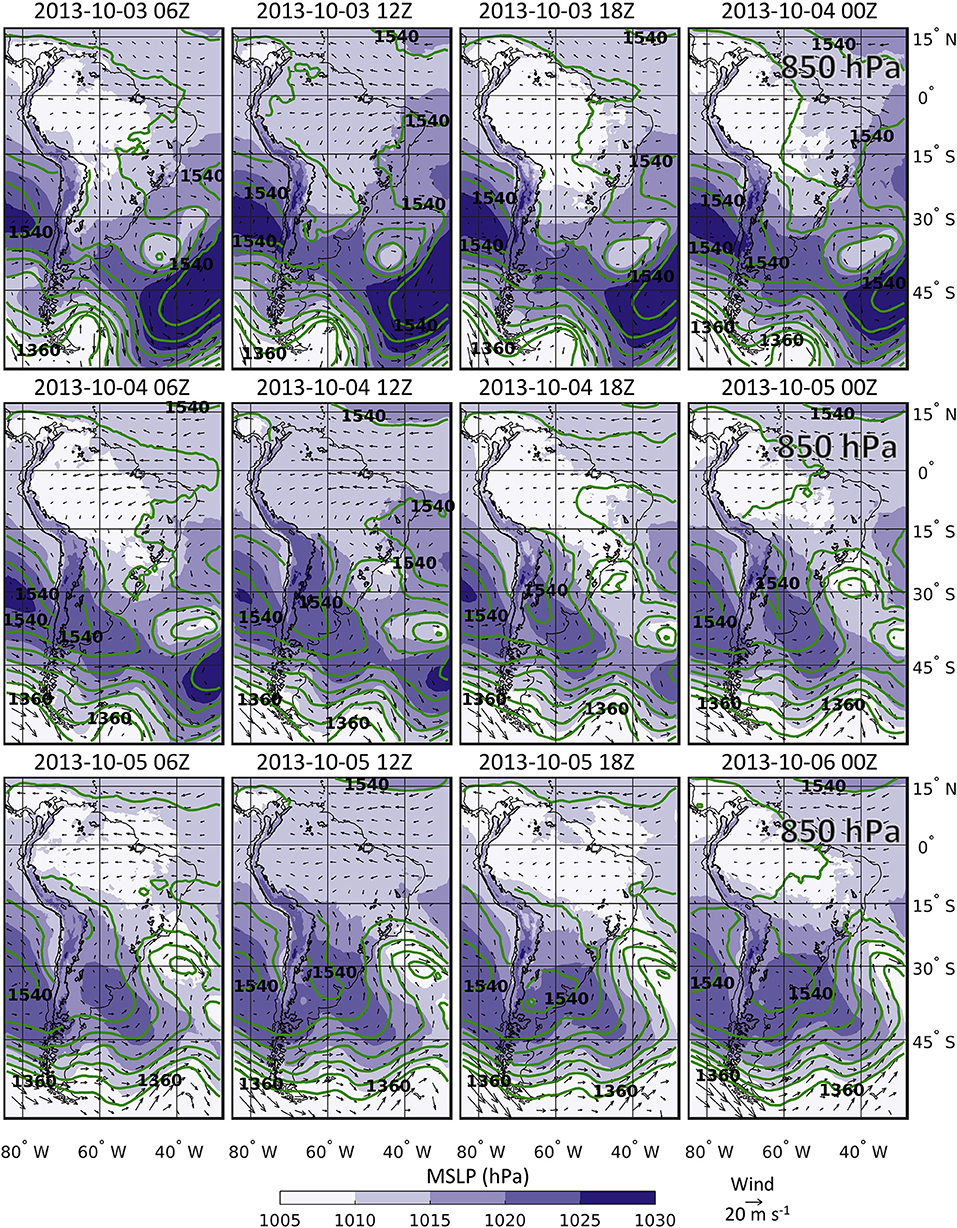
Figure 4. WRF simulation (D01, 18 km) of the October 4, 2013 CAI case study. The maps show Mean Sea Level Pressure (MSLP, shaded), 850 hPa level horizontal winds (arrows), and 850 hPa geopotential heights (green contours, 30 m interval) every 6 h starting on October 3 at 06Z. The black contour line shows the 2000 m elevation.
Figure 5 shows the simulated synoptic scale evolution of near the surface equivalent potential temperature (925 hPa) and Precipitable Water (PW) fields overlain the 300 hPa winds every 24 h October 3–7, 2013. There is a large contrast between very high PW (>50 mm) over the Amazon due to easterly advection of warm moist air from the tropical Atlantic and that piles up against the eastern Andes initially (bottom row, left panels) and subsequently becomes organized ahead of the CAI front, and PW (< 20 mm) in southern SA associated with low level cold advection behind the front. Easterly moisture transport from the Atlantic piles unstable moist air (60 mm PW) against the terrain ahead of the CAI front north of 15°S as it can be seen from the co-evolution of PW and 850 hPa winds (Supplemental Information S2).
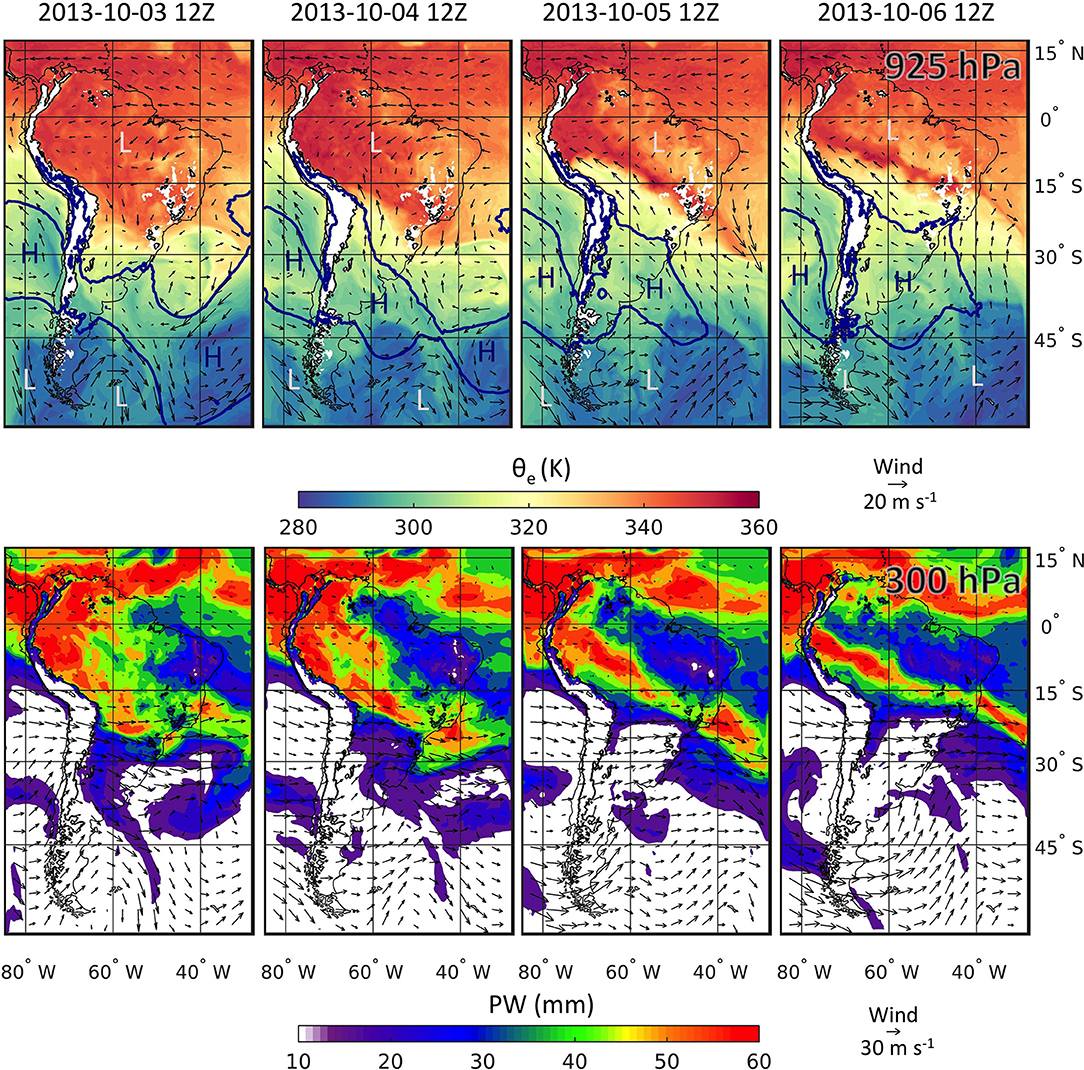
Figure 5. WRF simulation (D01, 18 km) of the CAI event on October 3–7, 2013. Top row shows the equivalent potential temperature and 925 hPa level horizontal wind fields. The blue contour line delineates the 1,020 hPa sea level pressure. Areas of high and low pressure are marked with H and L, respectively. Bottom row shows the Precipitable Water (PW) overlain on the 300 hPa level horizontal wind fields. A movie showing the temporal evolution of PW during the event duration is available as Supplemental Information S2.
The mesoscale evolution of the storm described by the vertically integrated Moisture Convergence ( where q is specific humidity and U is horizontal wind, p is pressure and g is the acceleration due to gravity), geopotential heights and horizontal winds at 850 hPa is presented in Figure 6. Initially, regional conditions are consistent with the typical wind patterns associated with the SACZ with streamlines in the NE-SE direction (Oct-03, 12Z). The color-scale is chosen to show the average behavior of MC. However, the maximum values can locally assume values as high as 30 (g m−2 s−1). Note evidence of a low-level mesoscale cyclonic vortex centered at 25°S and 65°W (consistent with the NAL) and high-pressure to the right (top row). Blocking of the easterly geostrophic flow as discussed above in the context of Figure 4 forces the alignment of northward low level flow along the eastern Andes, and the development of a cold front (e.g., the CAI front) as southerly air interacts with tropical moist air. Behind the front, an orographic blocking high forms in the subtropics that expands northward and strengthens with time eventually reaching the tropics in day-0 and into day+1.The cold front propagates northward reaching the subtropics (Oct-04, 00Z) with a well-defined region of strong convergence forming ahead of the cold front consistent with the PW patterns in Figure 5. The leading moist convergence zone (MCZ) advances with the CAI front along the Andes until it reaches ~6°S (Oct-06, 00Z).
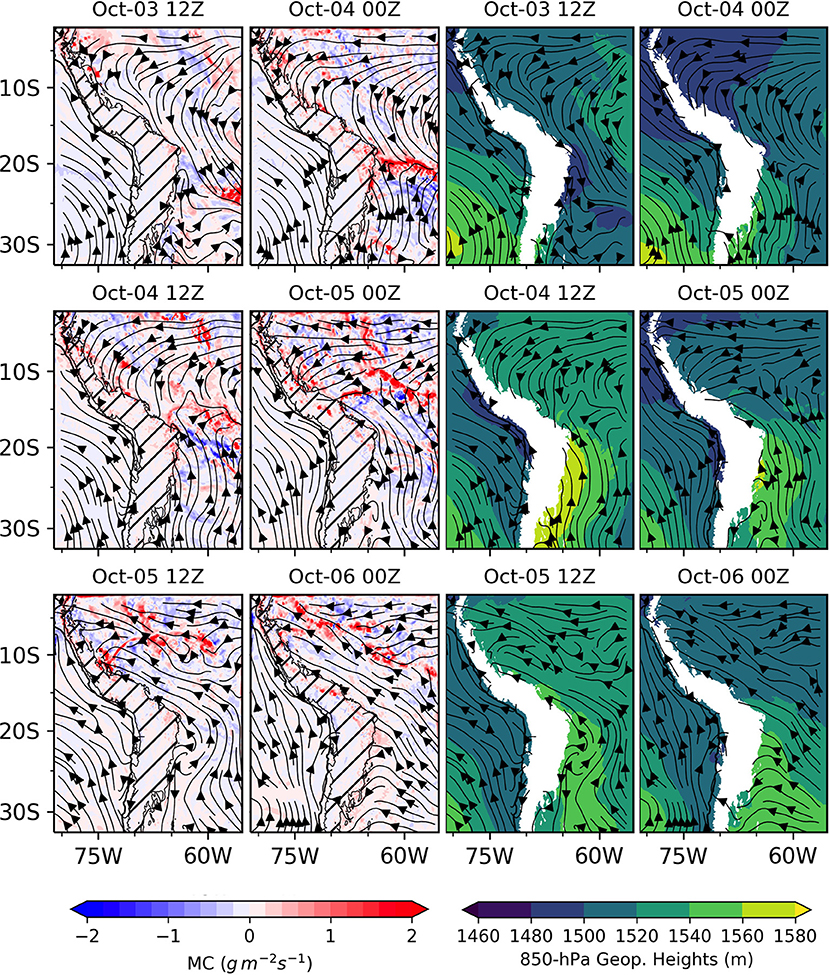
Figure 6. WRF simulation (D02, 6 km) of the CAI event on October 3–7, 2013. The first two columns show the integrated moisture convergence (MC) and 850 hPa level horizontal wind streamlines. The 1500 m orography is shown by southwest-northeast hatching. The second two columns show the 850 hPa level geopotential heights and horizontal wind streamlines. The white region is the area with pressures lower than 850 hPa.
Figure 7 shows the spatial distribution of simulated rainfall (Figures 7A,B) in the inner domain just as the CAI reaches its northernmost excursion and begins to retreat as per the meridional wind changes in Figure 7C. The model predicts localized precipitation accumulations of up to 172 mm (Figure 7B) against the 1,000 m elevation contour along a cross-section (cyan) at the latitude of the raingauge network in Figure 1. Note the rapid change in rainfall accumulations in Figure 7B from 50 to 160 mm over a period of 6 h as the CAI front arrives. Figure 7C suggests that low level northerly meridional winds are blocked by the terrain and by the southerly cold front over the low topography of the Amazon foreland basin. This blocking effect and change in wind regime that is accompanied by moisture convergence ahead of the storm can also be seen in Figure 6 (starting from Oct-4, 00Z). Convection initiates where northerly warm moist air piles against the terrain forcing localized upward motion to develop in the lower 1-2 km AMSL (2 km AMSL shown in Figure 7D; negligible at 1 km AMSL, not shown) producing heavy precipitation (purple shade in Figure 7B). Simulated updrafts can reach 35 m s−1 at higher altitudes (10−15 km). The model captures rainfall initiation with a 12–24 h delay in peak rainfall intensity relative to the Madre de Dios network (approximate time difference between purple and green shades in Figure 7B), but well within the time of arrival and movement of the CAI front along the Central Andes hot-spot region. Simulated rainfall intensities (1.2 km grid-spacing) are 3–4 times lower than rain-gauges (point scale), with rainfall occurring intermittently throughout the day in contrast with the observations that exhibit a mid-day rainfall break. Overall, the simulated rainfall accumulations at 1,500 m elevation vary between 131 and 172 mm in contrast with accumulations of 270–280 mm measured by the rain-gauges (Figure 1). Nevertheless, the spatial organization of simulated precipitation (Figure 7A) is consistent overall with the spatial distribution of precipitation features from the TRMM satellite climatology along the eastern slopes of the Andes with negligible precipitation or very light rainfall at higher elevations above the tree line (e.g., ~3,500 m) along the headwaters of the Amazon basin (Lowman and Barros, 2014).
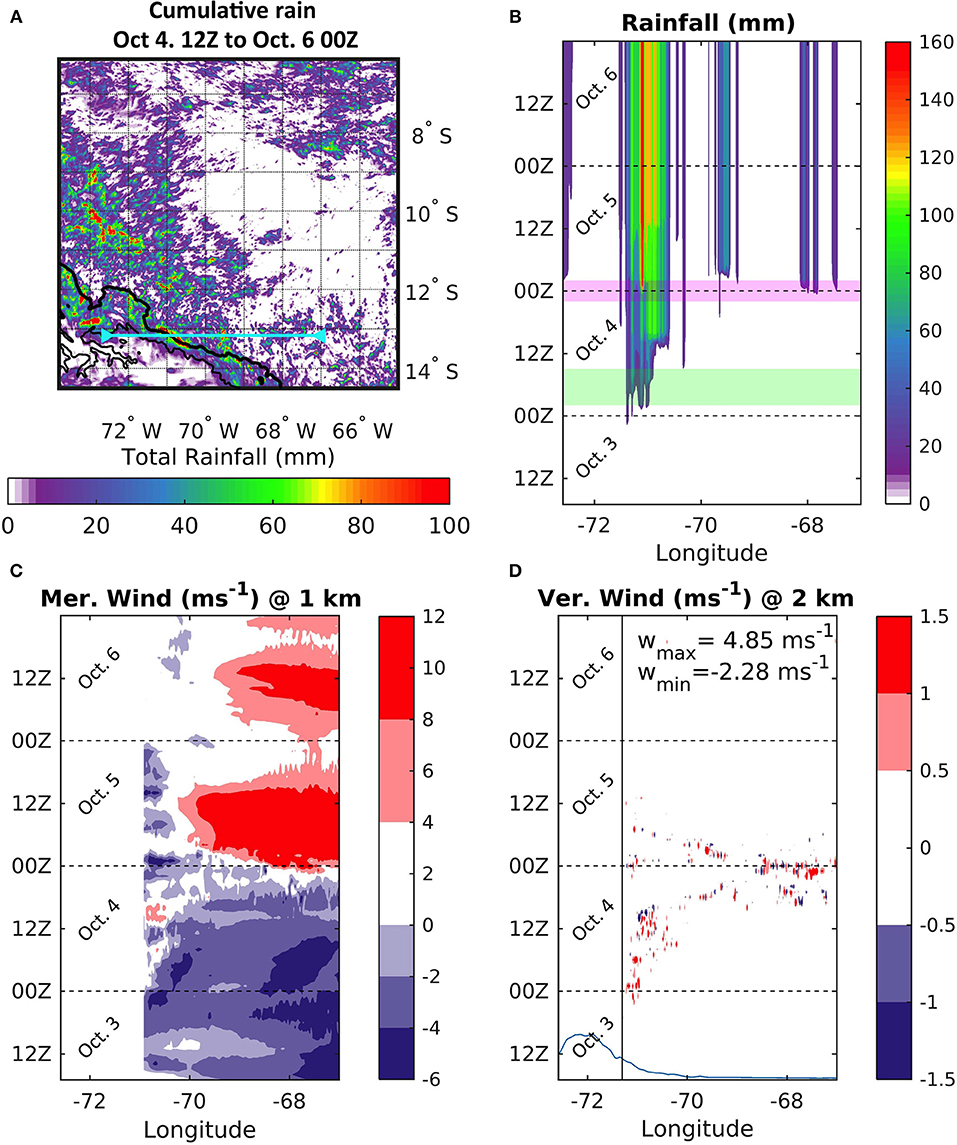
Figure 7. (A) Simulated cumulative rainfall from the high resolution domain (D03, 1.2 km) between Oct. 4, 12Z and Oct. 6, 00Z, 2013. The thick and thin black contour lines show the 1 km and 3.5 km topographic elevations, respectively; the cyan straight horizontal line marks the cross-section used in (B–D). (B) Total cumulative rainfall in the cross section, purple shading in (B) indicates time of maximum rainfall intensity in model simulations, green shading in (B) indicates time of maximum rainfall intensity in the Madre de Dios network; (C) longitude-time diagram of meridional wind interpolated to 1 km AMSL; and (D) longitude-time diagram of vertical wind at 2 km AMSL. Blue line in (D) represents the terrain cross-section, and the black line is marked on the 2 km elevation contour.
The vertical distribution of moisture content and frozen hydrometeors (Figure 8A), simulated reflectivity (Figure 8B), and vertical winds (Figure 8C) are shown in Figure 8 for the period of maximum simulated rainfall intensity along the cross-section marked in Figure 7A. The moisture content is the sum of water vapor, rain water, cloud water, and frozen phase (ice, snow, graupel, and hail) mixing ratios. The contour lines highlight the spatial distribution of frozen hydrometeors as a proxy for convective activity that extends to the higher levels in the atmosphere. Note the spatial alignment of high reflectivity cores of heavy precipitation (reflectivity up to 60 dBZ at 5 km AMSL) with the updrafts and downdrafts associated with localized orographic convection at mid-elevations (< 2 km) over the eastern slopes of the Andes. Furthermore, the region of well-developed convection to the east over the low topography of the Amazon is consistent with the position of the front and the spatial distribution of precipitable water (PW) west of 60°W in Figure 5. Orographic convection initiation takes place at the geographic intersection of the cold front with the terrain. This enhances localized low level stationary blocking by the terrain inducing a sloshing-like behavior along the front and spatially and temporally intermittent convective activity (Figure 7B). The convective cores shown in Figure 8 move zonally up and down (back-and-forth) along the slopes of the Andes and into the Amazon foreland throughout the day. The peak of simulated rainfall is delayed until the CAI frontal boundary pushes northward beyond the reference cross-section in Figure 7 with localized rainfall intensification tied to on-and-off convective activity against the terrain. The development of terrain-following convective activity along the CAI trajectory against the eastern slopes of the Peruvian Andes is in keeping with the spatial layout of precipitation hot-spots mapped by Chavez and Takahashi (2017) along elevation bands suitable for optimum orographic enhancement of precipitation (e.g., Sun and Barros, 2015a,b). Easterly moisture transport from the Atlantic piles unstable moist air (60 mm PW) against the terrain ahead of the CAI front north of 15°S as it can be seen from the co-evolution of PW and 850 hPa winds (Supplemental Information S2). Consumption of low level entropy supports upslope flow and enables convective initiation at elevations 1–2 km at the intersection of the terrain and the CAI front that results in the highly localized precipitation features in Figures 7, 8.
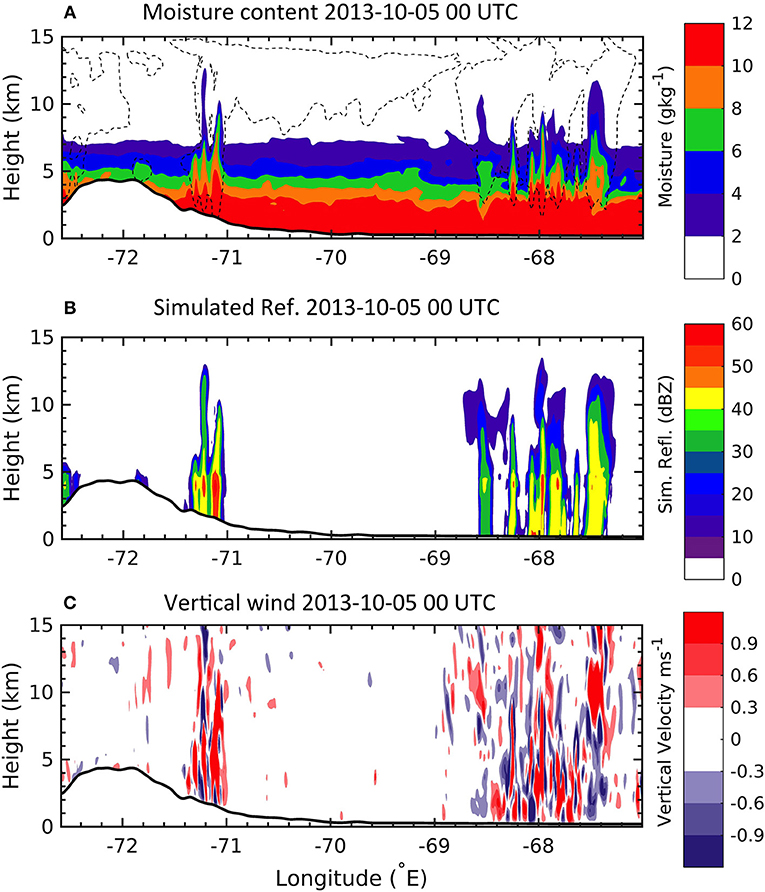
Figure 8. Cross section of (A) moisture content and frozen hydrometeors (B) simulated reflectivity and (C) vertical velocities at 2013-10-05 00:00 UTC. The dashed contour lines in (A) show the 3 × 10⁻³gkg−1 value of frozen phases. The cross section is shown in Figure 7A with cyan line at 13.16°S.
Figure 9 contrasts the mean structure of vertically integrated Moisture Convergence (MC) from reanalysis for austral spring (SON, top row) CAIs with simulated MC for the October 2013 event (bottom rows, see also Figure 6). Before the event begins (day-1, Figure 4) the convective area extends to the subtropics along with northwesterly winds associated to the SACZ. In the second day (day-0), MC from the Amazon and the tropical Atlantic is organized ahead of the CAI front with divergence trailing behind it. This large-scale arrangement maintains the spatial pattern and magnitude of tropical moisture convergence against the mountains before it detaches in the eastern Andes of Bolivia and turns southeastward guided by the CAI front. During day-0, the MCZ moves with the frontal boundary as it progresses northward while easterly winds weaken in the western Amazon basin. Day+1 circulation features are similar for the SON composite and the simulated event. Over northern SA, the wind fields are generally much weaker than climatology, with weak low level jet (WLLJ) conditions that favor MC and accumulation of moist unstable warm air ahead of the front, thus favorable to high precipitation in the Central Andes hot-spot region (Sun and Barros, 2015a,b; Chavez and Takahashi, 2017).
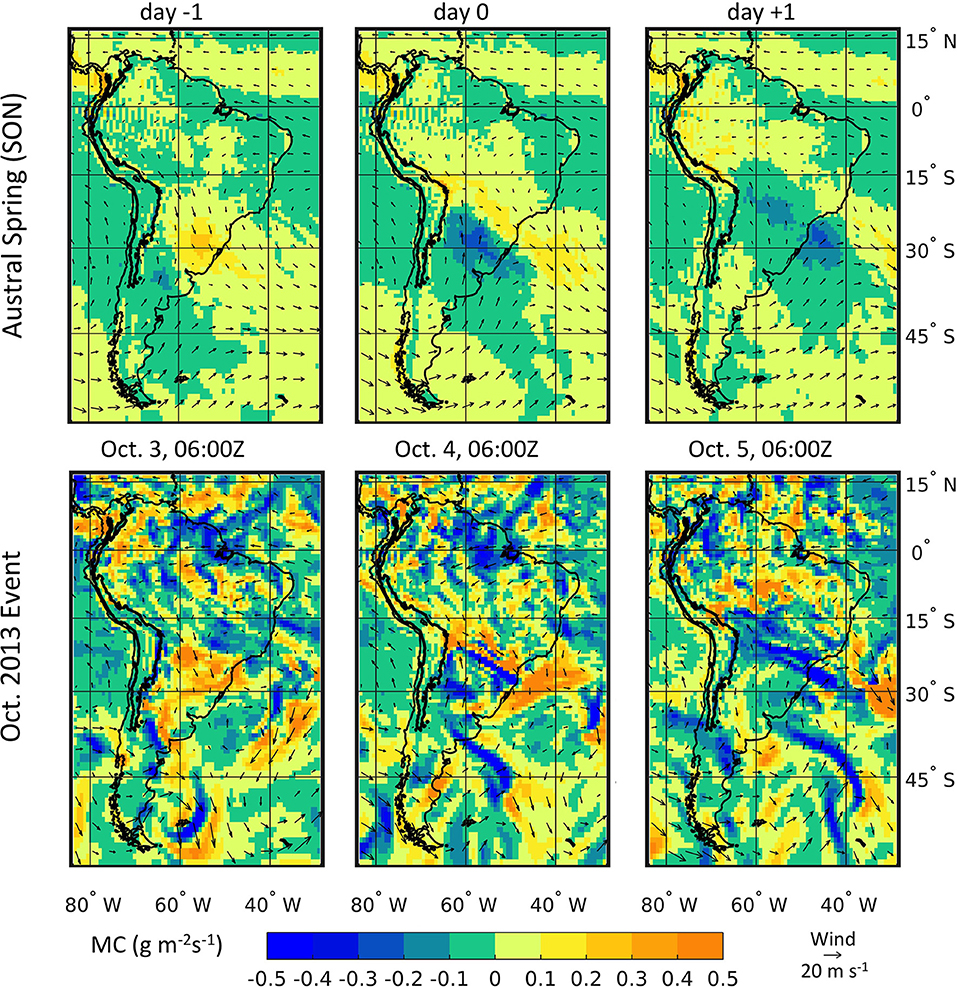
Figure 9. Top row: Composite vertically integrated Moisture Convergence (MC) patterns overlain on 850 hPa horizontal winds in the austral spring (SON) between 1979 and 2017 from ERA-Interim. The black contour line marks the 2000 m elevation. Bottom row: similar plots for the case-study CAI.
Rainfall Observations
In this section long-term statistics of CAI from reanalysis are interpreted in the context of rainfall measurements in the foothills and western Amazon basin.
The season time series of detected CAI events using the pressure data from ERA reanalysis is presented in Figure 10. The data show high-frequency of CAI in all seasons, albeit with large inter-annual variability. Interestingly, the range of inter-annual variability is higher in the austral summer (DJF) and fall (MAM) seasons compared to winter (JJA) and spring (SON) with increased summer activity in the last two decades. The reliability of CAI in the spring (SON) supports the argument for their important role in providing antecedent precipitation and atmospheric humidity necessary to condition the atmosphere for the monsoon season (Li and Fu, 2006; Yin et al., 2013, 2014).
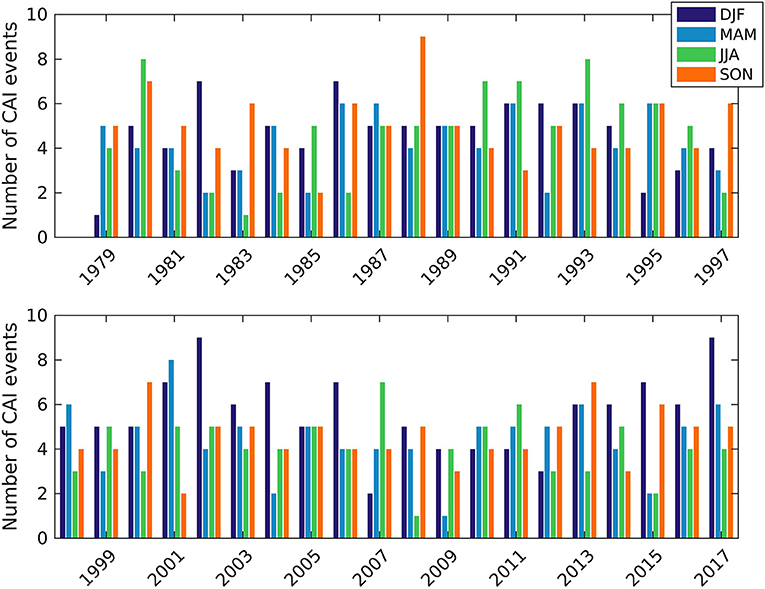
Figure 10. Seasonal time series of CAI events detected from ERA-Interim data 1979–2017 for the eastern side of the Andes cordillera.
The vertical profile of southerly moisture flux at an ERA-Interim grid-point in the Peruvian Andes close to the rain-gauge network used here (71.25°W, 12.75°S) is shown in Figure 11. Note how the average moisture flux significantly increases on day+1 (Figure 11B) compared to the average daily values for non-CAI conditions (Figure 11A), especially between ~800 and 600 hPa where most precipitation is produced. The maximum moisture flux is concurrent with CAI progression northward along the slopes of the eastern Andes to reach the rain-gauge network latitude in day+1 consistent with the simulation of the October 2013 CAI event (see Figure 6).
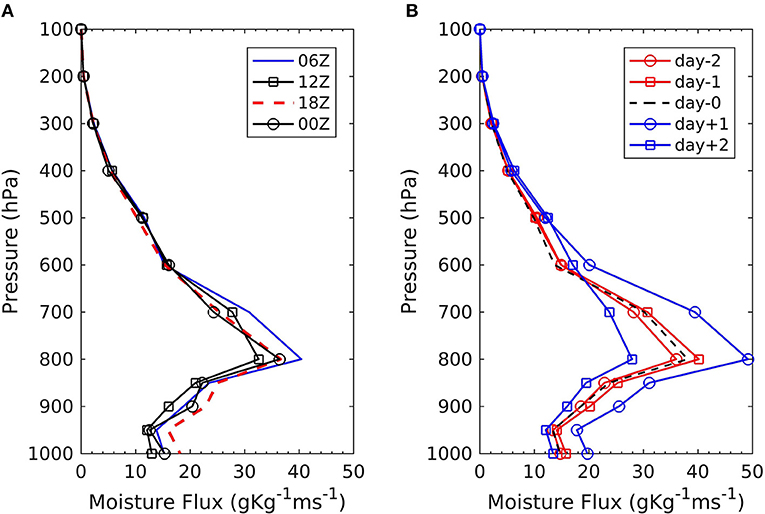
Figure 11. Vertical profile of moisture flux () from ERA-Interim: (A) climatological values at different times of the day (B) during CAI in September-October-November (SON) at (71.25°W, 12.75°S).
Figure 13 shows the diurnal cycle of rainfall metrics obtained from TRMM precipitation features below and above 1, 500 m terrain elevation in the Peruvian Andes hot-spot region [12°−14°S, Figure 12] for different elevation bands between December, 1997 and September, 2014 for CAI and non-CAI days, during the extended spring-summer rainy season (ONDJFM). The diurnal cycle of CAI maximum rainfall intensity shows increases up to 100% (Figure 13A) and higher values of volumetric rainfall (Figure 13E) in the early morning compared to non-CAI conditions in the orographic envelope between 500 and 1,500 m. The early morning peak in the 500–1,500 m elevation band is consistent with findings by Giovannettone and Barros (2009) who showed that nighttime and early morning convection in the central Andes is constrained to low elevations including inner mountain valleys and the foothills. This suggests enhancement of interactions among cold air pooling processes and low-level convergence of warm moist air at the CAI frontal boundary. Because TRMM products severely underestimate orographic precipitation (e.g., Prat and Barros, 2010a,b; Duan et al., 2015), the CAI signal on rainfall is likely underestimated (Figures 13C,D). The coefficients of variation (not shown) are similar for CAI and non-CAI conditions during the TRMM period of record with high values (2–3) for the near surface maximum rainfall and low (<1) for the areal average rain rate. Coefficients of variation are very high for volumetric rainfall as expected because of large event-to-event variability in convective activity, and thus rainfall intensity, as well as areal extent, and more so at higher elevations for non-CAI conditions reflecting the decrease in rainfall frequency and amount with altitude above the orographic precipitation maximum.
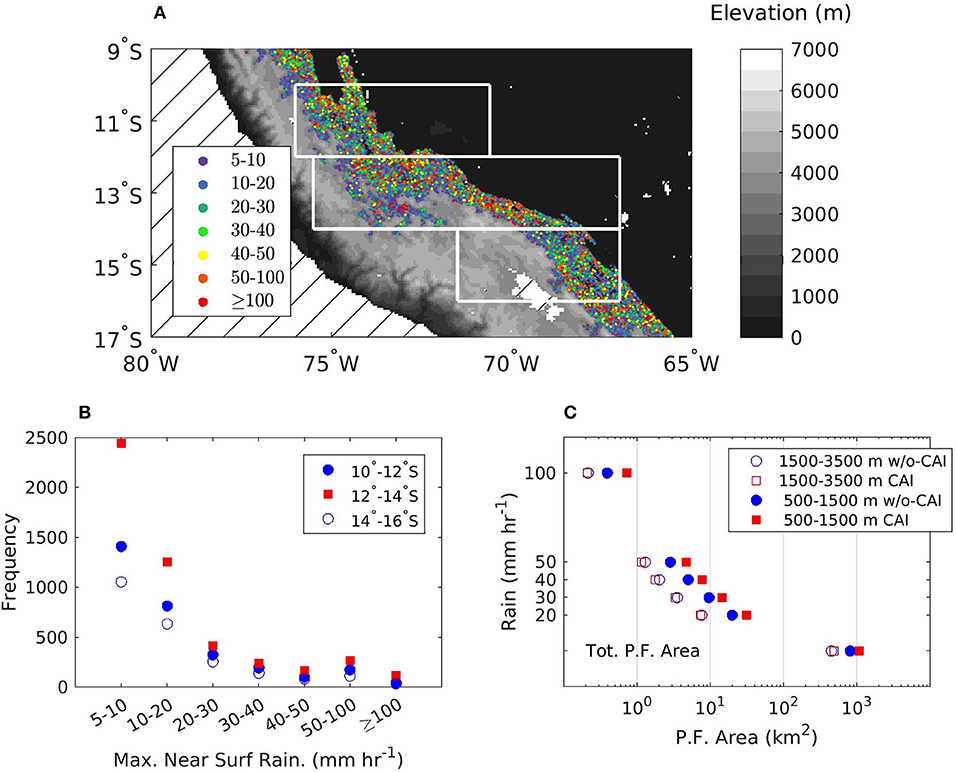
Figure 12. (A) Map of maximum near surface rain rate for the 16-year composite of TRMM Precipitation Features discussed in section Data and methodology overlaying the topography of the Central Andes and adjacent regions. The white boxes delimit three latitude bands including the Andes hot-spot area (central box, also the Madre de Dios rain-gauge network Figure 1) used for analysis in Figure 13. (B) The frequency of TRMM PFs binned with maximum near-surface rainfall rates for each latitude band. (C) Distribution of PF areal extent as a function of average rainfall rate for two elevation bands with and without CAI conditions.
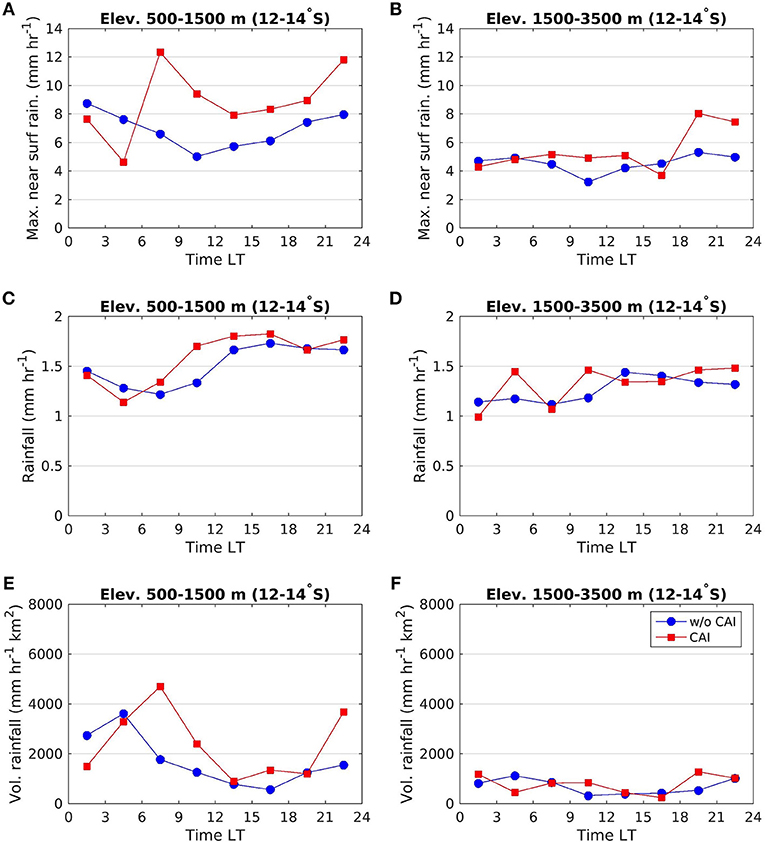
Figure 13. Diurnal cycle of (A,B) maximum near surface rain, (C,D) spatially averaged rain, and (E,F) volumetric rain associated with TRMM PFs over the Andes during ONDJFM between 12° and 14°S latitude (see Figure 12) for two elevation bands 500–1,500 m and 1,500–3,500 m. Circles show non-CAI climatology. Squares show the mean values between 1 day before (day-1) and 1 day after (day+1) the detected CAI events according to the methodology described in section Data and methodology.
Likewise, the diurnal cycle of rainfall at the gauges on the Madre de Dios altitudinal transect corresponding to 100 CAI events (during the period of record) is presented in Figure 14. Although each station shows a different diurnal cycle, there is a systematic increase of the rainfall intensity at all times of the day in all seasons during CAI events with maximum enhancement at San Pedro (~ 1, 500 m). The rainfall enhancement at Tres Cruces is remarkable given that this gauge is located at very high elevation above the tree line in the inner region of the Central Andes, which indicates for the first time that CAI events may play an important role in the water cycle of puna ecosystems in the High Andes beyond the negative impacts of frost reported in the literature. This implies that sustainability of puna ecosystems may be tied at least in part to the reliability of CAI activity. Note the significant difference in the spatial representativeness gap between the rain-gauge data (point scale) and the TRMM PFs (pixel scale ~ 25 km2). Consequently, to enable interpretation and analysis, it is proposed that the diurnal cycle of orographic rainfall by altitude based on TRMM PFs captures the most frequent timing of maximum rainfall during CAI events, whereas the raingauges capture significant localized enhancement of orographic precipitation by a factor of about 2 during CAI events.
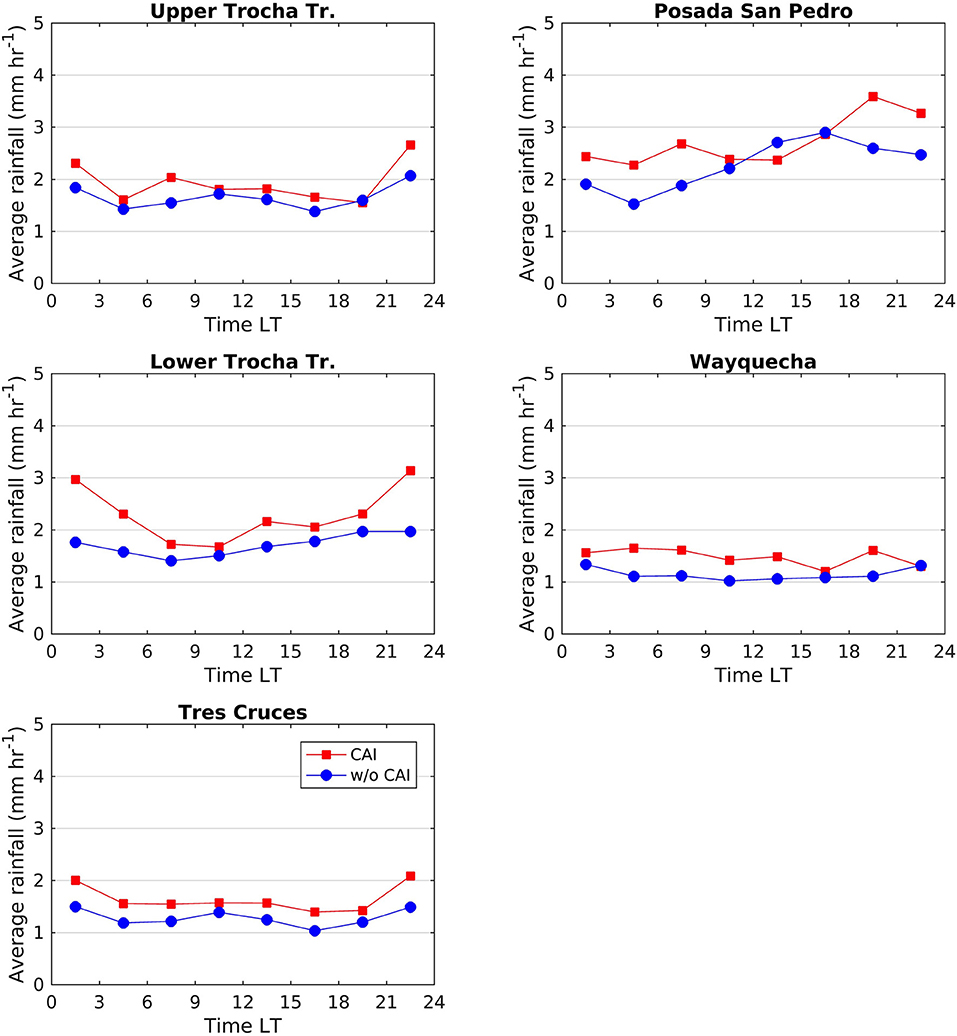
Figure 14. Diurnal cycle of mean rainfall intensity from five gauges in the Madre de Dios network from April 2012–2017. Mean value calculations do not include times without rain. Circles show non-CAI climatology and squares show the mean values between 1 day before and after the detected CAI events.
Conclusions and Outlook
Cold Air Intrusions are a key synoptic scale feature of South American climate and weather. In the present study, in situ rainfall measurements are used for the first time together with the longest period of available climatology from ECMWF ERA-Interim reanalysis (1979–2017) to investigate the connection between the CAI and orographic precipitation on the eastern flanks of the tropical Andes. An extreme precipitation event in October 2013 was selected for simulation and analysis. The simulated synoptic scale structure agrees well with the classic definition of CAI in previous studies. The model, although underestimating the rainfall amounts and intensities, produces the extreme localized rainfall patterns near the orographic maximum (~ 1,000–2,000 m) in the Central Andes suggested by the raingauge measurements for this case study. A careful study of the vertical structure of atmospheric moisture content and vertical winds shows strong shallow convection associated with high values of precipitation at the intersection of the CAI front with the Andes terrain explaining the localized enhancement of surface rainfall. The trajectory of shallow convection following the terrain as the CAI front propagates northward is in agreement with the orographic precipitation maximum on the Andes slopes inferred from rain-gauge observations, and the hot-spot clusters of precipitation features from satellite observations). The reanalysis climatology reveals that the moisture flux increases significantly at all heights during CAI events with a maximum of up to 50% between 800 and 600 hPa. The enhanced moisture flux is necessary to sustain strong shallow convection that translates into increased rainfall intensity and accumulations on the eastern slopes of Andes (~ 1000 − 2000 km) in TRMM products and in situ measurements. Specifically, analysis of the rain-gauge data shows strong precipitation enhancement (up to 100%) tied to CAI events. This behavior is also evident in the climatology of TRMM precipitation features that show enhancement of precipitation up to 100% in the early morning in the Peruvian Andes tied to enhance convective activity at low elevations. The multi-decadal record of CAI events derived from ERA-Interim indicates that CAIs are year-round phenomena, with frequency, intensity, and latitudinal excursion amplitude that exhibit variability at both seasonal and inter-annual scales. Nevertheless, reliability of CAI events in the spring season supports the notion that CAI precipitation makes an important contribution to priming the low-level troposphere over the Amazon basin prior to monsoon onset similar to previous studies. Localized very high orographic rainfall intensity in the region of study drives regional landslide activity consistent with the association of landform, precipitation, and erosion in the region of study.
Author Contributions
AB proposed the research idea and the research plan. ME implemented the research plan, performed the WRF simulations, and conducted the climatology analysis and interpretation of the results under the guidance of the AB. The two authors worked collaboratively in the preparation of the manuscript.
Conflict of Interest Statement
The authors declare that the research was conducted in the absence of any commercial or financial relationships that could be construed as a potential conflict of interest.
Acknowledgments
We would like to acknowledge high-performance computing support from Yellowstone (http://n2t.net/ark:/85065/d7wd3xhc) provided by NCAR's Computational and Information Systems Laboratory, sponsored by the National Science Foundation. We thank two Reviewers for helpful comments and constructive suggestions. This research was funded by NASA grant NNX16AL16G and NSF EAR0711430 with AB.
Supplementary Material
The Supplementary Material for this article can be found online at: https://www.frontiersin.org/articles/10.3389/fenvs.2019.00101/full#supplementary-material
References
Aide, T. M., Grau, H. R., Graesser, J., Andrade-Nunez, M. J., Araoz, E., Barros, A., et al. (2019). Woody vegetation dynamics in the tropical and subtropical Andes from 2001 to 2014: the impacts of land use change and climate. Glob. Change Biol. 25, 2112–2116. doi: 10.1111/gcb.14618
Anabor, V., Stensrud, D. J., and de Moraes, O. L. L. (2008). Serial upstream-propagating mesoscale convective system events over southeastern South America. Monthly Weather Rev. 136, 3087–3105. doi: 10.1175/2007MWR2334.1
Arulraj, M., and Barros, A. P. (2017). Shallow precipitation detection and classification using multifrequency radar observations and model simulations. J. Atmosphere. Oceanic Technol. 34, 1963–1983. doi: 10.1175/JTECH-D-17-0060.1
Arulraj, M., and Barros, A. P. (2019). Improving quantitative precipitation estimates in mountainous regions by modelling low-level seeder-feeder interactions constrained by Global Precipitation Measurement Dual-frequency Precipitation Radar measurements. Remote Sens. Environ. 231:111213. doi: 10.1016/j.rse.2019.111213
Barros, A. P. (2013). “Orographic precipitation, freshwater resources, and climate vulnerabilities in mountainous regions,” in Climate Vulnerability: Understanding and Addressing Threats to Essential Resources, Vol. 1, eds J. Adegoke and C. Y. Wright (Waltham, MA: Elsevier Inc.; Academic Press), 57–78. doi: 10.1016/B978-0-12-384703-4.00504-9
Barros, A. P., and Lettenmaier, D. P. (1994). Dynamic modeling of orographically induced precipitation. Rev. Geophys. 32, 265–284. doi: 10.1029/94RG00625
Berrisford, P., Dee, D., Poli, P., Brugge, R., Fielding, K., Fuentes, M., et al. (2011). The ERA-Interim 76 Archive, Version 2.0. Technical report, ECMWF.
Boers, N., Barbosa, H. M. J., Bookhagen, B., Marengo, J. A., Marwan, N., and Kurths, J. (2015). Propagation of strong rainfall events from southeastern South America to the central andes. J. Clim. 28, 7641–7658. doi: 10.1175/JCLI-D-15-0137.1
Boers, N., Bookhagen, B., Barbosa, H. M., Marwan, N., Kurths, J., and Marengo, J. (2014). Prediction of extreme floods in the eastern central Andes based on a complex networks approach. Nat. Commun. 5:5199. doi: 10.1038/ncomms6199
Boers, N., Bookhagen, B., Marwan, N., and Kurths, J. (2016). Spatiotemporal characteristics and synchronization of extreme rainfall in South America with focus on the Andes mountain range. Clim. Dynam. 46, 601–617. doi: 10.1007/s00382-015-2601-6
Cavalcanti, I. F., Müller, G. V., Andrade, K. M., and Long, M. E. F. (2013). Cold air intrusions over southeastern South America – GFDL model behavior regarding climate simulations in the 20th century and future projections. Glob. Planet. Change 111, 31–42. doi: 10.1016/j.gloplacha.2013.08.006
Chavez, S. P., and Takahashi, K. (2017). Orographic rainfall hot spots in the Andes-Amazon transition according to the TRMM precipitation radar and in situ data. J. Geophys. Res. 122, 5870–5882. doi: 10.1002/2016JD026282
Chen, T.-C., Yen, M.-C., Huang, W.-R., and Gallus, W. A. Jr. (2002). An east asian cold surge: case study. Monthly Weather Rev. 130, 2271–2290. doi: 10.1175/1520-0493(2002)130<2271:AEACSC>2.0.CO;2
de la Torre, A., Pessano, H., Hierro, R., Santos, J., Llamedo, P., and Alexander, P. (2015). The influence of topography on vertical velocity of air in relation to severe storms near the southern Andes mountains. Atmospher. Res. 156, 91–101. doi: 10.1016/j.atmosres.2014.12.020
Dee, D. P., Uppala, S. M., Simmons, A. J., Berrisford, P., Poli, P., Kobayashi, S., et al. (2011). The ERA-interim reanalysis: configuration and performance of the data assimilation system. Quart. J. R. Meteorol. Soc. 137, 553–597. doi: 10.1002/qj.828
Duan, Y., Wilson, A. M., and Barros, A. P. (2015). Scoping a field experiment: error diagnostics of TRMM precipitation radar estimates in complex terrain as a basis for IPHEX2014. Hydrol. Earth Syst. Sci. 19, 1501–1520. doi: 10.5194/hess-19-1501-2015
Dudhia, J. (1989). Numerical study of convection observed during the winter monsoon experiment using a mesoscale two-dimensional model. J. atmosphere. Sci. 46, 3077–3107. doi: 10.1175/1520-0469(1989)046<3077:NSOCOD>2.0.CO;2
Ek, M. B., Mitchell, K. E., Lin, Y., Rogers, E., Grunmann, P., Koren, V., et al. (2003). Implementation of NOAH land surface model advances in the national centers for environmental prediction operational mesoscale eta model. J. Geophys. Res. 108:8851. doi: 10.1029/2002JD003296
Espinoza, J. C., Ronchail, J., Lengaigne, M., Quispe, N., Silva, Y., Bettolli, M. L., et al. (2013). Revisiting wintertime cold air intrusions at the east of the Andes: propagating features from subtropical Argentina to Peruvian Amazon and relationship with large-scale circulation patterns. Clim. Dynam. 41, 1983–2002. doi: 10.1007/s00382-012-1639-y
Garreaud, R. (1999a). Cold air incursions over subtropical and tropical South America: a numerical case study. Monthly Weather Rev. 127, 2823–2853. doi: 10.1175/1520-0493(1999)127<2823:CAIOSA>2.0.CO;2
Garreaud, R. (1999b). Multiscale analysis of the summertime precipitation over the Central Andes. Monthly Weather Rev. 127, 901–921. doi: 10.1175/1520-0493(1999)127<0901:MAOTSP>2.0.CO;2
Garreaud, R. (2000). Cold air incursions over subtropical South America: mean structure and dynamics. Monthly Weather Rev. 128, 2544–2559. doi: 10.1175/1520-0493(2000)128<2544:CAIOSS>2.0.CO;2
Garreaud, R., and Wallace, J. M. (1998). Summertime incursions of midlatitude air into subtropical and tropical South America. Monthly Weather Rev. 126, 2713–2733. doi: 10.1175/1520-0493(1998)126<2713:SIOMAI>2.0.CO;2
Garreaud, R. D. (2001). Subtropical cold surges: regional aspects and global distribution. Int. J. Climatol. 21, 1181–1197. doi: 10.1002/joc.687
Garreaud, R. D. (2009). The Andes climate and weather. Adv. Geosci. 22, 3–11. doi: 10.5194/adgeo-22-3-2009
Giovannettone, J. P., and Barros, A. P. (2009). Probing regional orographic controls of precipitation and cloudiness in the central Andes using satellite data. J. Hydrometeorol. 10, 167–182. doi: 10.1175/2008JHM973.1
Houze, R. A. (2012). Orographic effects on precipitating clouds. Rev. Geophys. 50:RG1001. doi: 10.1029/2011RG000365
Hurley, J. V., Vuille, M., Hardy, D. R., Burns, S. J., and Thompson, L. G. (2015). Cold air incursions, δ18O variability, and monsoon dynamics associated with snow days at Quelccaya Ice Cap, Peru. J. Geophys. Res. 120, 7467–7487. doi: 10.1002/2015JD023323
Kain, J. S. (2004). The Kain-Fritsch convective parameterization: an update. J. Appl. Meteorol. 43, 170–181. doi: 10.1175/1520-0450(2004)043<0170:TKCPAU>2.0.CO;2
Kalnay, E., Kanamitsu, M., Kistler, R., Collins, W., Deaven, D., Gandin, L., et al. (1996). The NCEP/NCAR 40-year reanalysis project. Bull. Am. Meteorol. Soc. 77, 437–471. doi: 10.1175/1520-0477(1996)077<0437:TNYRP>2.0.CO;2
Li, W., and Fu, R. (2006). Influence of cold air intrusions on the wet season onset over Amazonia. J. Clim. 19, 257–275. doi: 10.1175/JCLI3614.1
Liu, C., Zipser, E. J., Cecil, D. J., Nesbitt, S. W., and Sherwood, S. (2008). A cloud and precipitation feature database from nine years of TRMM observations. J. Appl. Meteorol. Climatol. 47, 2712–2728. doi: 10.1175/2008JAMC1890.1
Lowman, L. E. L., and Barros, A. P. (2014). Investigating links between climate and orography in the Central Andes: coupling erosion and precipitation using a physical-statistical model. J. Geophys. Res. 119, 1322–1353. doi: 10.1002/2013JF002940
Lupo, A. R., Nocera, J. J., Bosart, L. F., Hoffman, E. G., and Knight, D. J. (2001). South american cold surges: types, composites, and case studies. Monthly Weather Rev. 129, 1021–1041. doi: 10.1175/1520-0493(2001)129<1021:SACSTC>2.0.CO;2
Medvigy, D., Walko, R. L., and Avissar, R. (2012). Simulated links between deforestation and extreme cold events in South America. J. Clim. 25, 3851–3866. doi: 10.1175/JCLI-D-11-00259.1
Milbrandt, J. A., and Yau, M. K. (2005a). A multimoment bulk microphysics parameterization. part I: Analysis of the role of the spectral shape parameter. J. atmosphere. Sci. 62, 3051–3064. doi: 10.1175/JAS3534.1
Milbrandt, J. A., and Yau, M. K. (2005b). A multimoment bulk microphysics parameterization. part II: A proposed three-moment closure and scheme description. J. atmosphere. Sci. 62, 3065–3081. doi: 10.1175/JAS3535.1
Mlawer, E. J., Taubman, S. J., Brown, P. D., Iacono, M. J., and Clough, S. A. (1997). Radiative transfer for inhomogeneous atmospheres: RRTM, a validated correlated-k model for the longwave. J. Geophys. Res. 102, 16663–16682. doi: 10.1029/97JD00237
Müller, G. V., and Ambrizzi, T. (2007). Teleconnection patterns and Rossby wave propagation associated with generalized frosts over southern South America. Clim. Dynam. 29, 633–645. doi: 10.1007/s00382-007-0253-x
Müller, G. V., and Berri, G. J. (2007). Atmospheric circulation associated with persistent generalized frosts in central-southern South America. Monthly Weather Rev. 135, 1268–1289. doi: 10.1175/MWR3344.1
Nakanishi, M., and Niino, H. (2006). An improved Mellor–Yamada level-3 model: its numerical stability and application to a regional prediction of advection fog. Bound. Layer Meteorol. 119, 397–407. doi: 10.1007/s10546-005-9030-8
Nesbitt, S. W., Zipser, E. J., and Cecil, D. J. (2000). A census of precipitation features in the tropics using TRMM: Radar, ice scattering, and lightning observations. J. Clim. 13, 4087–4106. doi: 10.1175/1520-0442(2000)013<4087:ACOPFI>2.0.CO;2
Prat, O. P., and Barros, A. P. (2010a). Assessing satellite-based precipitation estimates in the southern Appalachian Mountains using rain gauges and TRMM PR. Adv. Geosci. 25, 143–153. doi: 10.5194/adgeo-25-143-2010
Prat, O. P., and Barros, A. P. (2010b). Ground observations to characterize the spatial gradients and vertical structure of orographic precipitation experiments in the inner region of the Great Smoky Mountains. J. Hydrol. 391, 141–156. doi: 10.1016/j.jhydrol.2010.07.013
Rasmussen, K. L., and Houze, R. A. (2011). Orogenic convection in subtropical South America as seen by the TRMM satellite. Monthly Weather Rev. 139, 2399–2420. doi: 10.1175/MWR-D-10-05006.1
Schultz, D. M., Bracken, W. E., Bosart, L. F., Hakim, G. J., Bedrick, M. A., Dickinson, M. J., et al. (1997). The 1993 superstorm cold surge: frontal structure, gap flow, and tropical impact. Monthly Weather Rev.125, 5–39. doi: 10.1175/1520-0493(1997)125<0005:TSCSFS>2.0.CO;2
Seluchi, M. E., Saulo, A. C., Nicolini, M., and Satyamurty, P. (2003). The northwestern argentinean low: a study of two typical events. Mon. Wea. Rev. 131, 2361–2378. doi: 10.1175/1520-0493(2003)131<2361:TNALAS>2.0.CO;2
Siqueira, J. R., and Machado, L. A. T. (2004). Influence of the frontal systems on the day-to-day convection variability over South America. J. Clim. 17, 1754–1766. doi: 10.1175/1520-0442(2004)017<1754:IOTFSO>2.0.CO;2
Siqueira, J. R., Rossow, W. B., Machado, L. A. T., and Pearl, C. (2005). Structural characteristics of convective systems over South America related to cold-frontal incursions. Monthly Weather Rev. 133, 1045–1064. doi: 10.1175/MWR2888.1
Skamarock, W., Klemp, J., Dudhia, J., Gill, D., Barker, D., Duda, M., et al. (2008). A Description of the Advanced Research Wrf Version 3, Ncar Technical Note, Mesoscale and Microscale Meteorology Division. National Center for Atmospheric Research, Boulder, Colorado, USA.
Sun, X., and Barros, A. P. (2014). High resolution simulation of tropical storm Ivan (2004) in the Southern Appalachians: role of planetary boundary-layer schemes and cumulus parametrization. Q. J. R. Meteorol. Soc. 140, 1847–1865. doi: 10.1002/qj.2255
Sun, X., and Barros, A. P. (2015a). Impact of Amazonian evapotranspiration on moisture transport and convection along the eastern flanks of the tropical Andes. Quart. J. R. Meteorol. Soc. 141, 3325–3343. doi: 10.1002/qj.2615
Sun, X., and Barros, A. P. (2015b). Isolating the role of surface evapotranspiration on moist convection along the eastern flanks of the tropical Andes using a quasi-idealized approach. J. atmosphere. Sci. 72, 243–261. doi: 10.1175/JAS-D-14-0048.1
Tropical Rainfall Measuring Mission. (2011). TRMM Combined Precipitation Radar and Microwave Imager Rainfall Profile L2 1.5 hours V7, Greenbelt, MD, Goddard Earth Sciences Data and Information Services Center (GESDISC): Available online at: https://disc.gsfc.nasa.gov/datacollection/TRMM_2B31_7.html
Vera, C. S., and Vigliarolo, P. K. (2000). A diagnostic study of cold-air outbreaks over South America. Monthly Weather Rev. 128, 3–24. doi: 10.1175/1520-0493(2000)128<0003:ADSOCA>2.0.CO;2
Wilson, A. M., and Barros, A. P. (2015). Landform controls on low level moisture convergence and the diurnal cycle of warm season orographic rainfall in the southern Appalachians. J. Hydrol. 531, 475–493. doi: 10.1016/j.jhydrol.2015.10.068
Wilson, A. M., and Barros, A. P. (2017). Orographic land-atmosphere interactions and the diurnal cycle of low-level clouds and fog. J. Hydrometeorol. 18, 1513–1533. doi: 10.1175/JHM-D-16-0186.1
Yin, L., Fu, R., Shevliakova, E., and Dickinson, R. E. (2013). How well can CMIP5 simulate precipitation and its controlling processes over tropical South America? Clim. Dynam. 41, 3127–3143. doi: 10.1007/s00382-012-1582-y
Yin, L., Fu, R., Zhang, Y., Arias, P. A., Fernando, D. N., Li, W., et al. (2014). What controls the interannual variation of the wet season onsets over the Amazon? J. Geophys. Res. 119, 2314–2328. doi: 10.1002/2013JD021349
Keywords: orographic rainfall, Andes, cold front, extreme events, water cycle
Citation: Eghdami M and Barros AP (2019) Extreme Orographic Rainfall in the Eastern Andes Tied to Cold Air Intrusions. Front. Environ. Sci. 7:101. doi: 10.3389/fenvs.2019.00101
Received: 29 January 2019; Accepted: 13 June 2019;
Published: 02 July 2019.
Edited by:
Frauke Feser, Helmholtz Centre for Materials and Coastal Research (HZG), GermanyReviewed by:
Ronny Petrik, Helmholtz Centre for Materials and Coastal Research (HZG), GermanyFederico Porcu, University of Bologna, Italy
Copyright © 2019 Eghdami and Barros. This is an open-access article distributed under the terms of the Creative Commons Attribution License (CC BY). The use, distribution or reproduction in other forums is permitted, provided the original author(s) and the copyright owner(s) are credited and that the original publication in this journal is cited, in accordance with accepted academic practice. No use, distribution or reproduction is permitted which does not comply with these terms.
*Correspondence: Ana P. Barros, YmFycm9zQGR1a2UuZWR1