 Martina Artmann
 Christian Mueller2
 Lukas Goetzlich
- 1Leibniz Institute of Ecological Urban and Regional Development, Dresden, Germany
- 2Department of Geodesy, Bochum University of Applied Sciences, Bochum, Germany
- 3Department of Geography and Geology, University of Salzburg, Salzburg, Austria
Urban green spaces (UGS) are crucial providers of cultural ecosystem services such as recreation. So that urban residents can benefit from UGS recreation, there is a need for good access to these, in particular for elderlies with reduced mobility. Recent research on accessibility has often neglected to consider real distances to green spaces and emerging barriers as well as the demand by specific user groups for UGS accessibility. In the light of demographic aging and ongoing urbanization, this study investigates in an explorative case study the potential and actual access to UGS for elderlies living in care facilities in Salzburg (Austria). By connecting a GIS network-analysis with a survey among elderlies of four care facilities, the results give insights into the supply and demand concerning UGS accessibility. The supply analysis showed that the majority of UGS are situated between 500 and 1,000 m. Due to barriers identified by the elderlies hindering the pathways to the UGS, time losses occur and the security of the old-aged is under risk. The demand side showed that despite the supply of UGS within 1,000 m, elderlies mostly visit UGS outside the service area. More research is needed to include elderlies' supply and demand regarding UGS qualities when analyzing UGS accessibility by considering greater sample sizes.
Introduction
Urban green spaces (UGS) such as parks, urban agriculture, community gardens or urban forests (Breuste et al., 2013) are major contributors of ecosystem services, in particular for recreational activities (Maes et al., 2012). Recreation as one example of cultural ecosystem services can be defined as “Recreational pleasure people derive from natural or cultivated ecosystems” (Elmqvist et al., 2014, Appendix). UGS need to be accessible so that residents can profit from recreation in these spaces (Paracchini et al., 2014; Peña et al., 2015; Grunewald et al., 2017). A range of studies proved that proximity to UGS has positive impacts on human well-being such as physical and mental health benefits as well as social cohesion (see Kabisch et al., 2016; Larson et al., 2016; Grunewald et al., 2017 for an overview). In the face of the worldwide ongoing urbanization, also policy recognized the need for UGS access. For instance, one sub-target of the eleventh goal of the 2030 Agenda for Sustainable Development recommends the provisioning of secure and accessible UGS, in particular for vulnerable population groups such as elderly and children (United Nations, 2015).
Major factors of accessibility refer to spatial preconditions including a pedestrian friendly distance between residential areas and the green spaces which should then be accessible to the public and of minimum size (Kabisch et al., 2016; Grunewald et al., 2017). Indicators for evaluating spatial accessibility to UGS include metrics such as UGS per capita (Fuller and Gaston, 2009; Badiu et al., 2016) or per block (Larondelle and Lauf, 2016). These indicators are often used as proxies for accessibility reflecting normative assumptions. In scientific studies residential proximities are for instance defined by green spaces of a minimum size of 2 ha within a distance between 300 and 500 m (Kabisch et al., 2016) or at national scale in Germany by green spaces of at least 1 ha within a path distance of 500 m (Grunewald et al., 2017). These indicators can provide important insights for urban planning on meeting thresholds to secure a sufficient supply of UGS. However, when assessing accessibility to UGS, some limits and research gaps occur in methodological and contextual terms.
In methodological terms, network analysis is argued to provide a detailed evaluation of accessibility since it includes real walking distances and considers physical obstacles which inhibit traversing (e.g., buildings, highways) (Handley et al., 2003; Oh and Jeong, 2007; Sander et al., 2010; La Rosa, 2014; Richter et al., 2016; Grunewald et al., 2017). Thus, the body of work applying network analysis to assess accessibility to UGS is growing (Oh and Jeong, 2007; Comber et al., 2008; Moseley et al., 2013; La Rosa, 2014). That a range of recent studies also deals with more simple methods such as green space per capita or distances by buffer analysis (Hillsdon et al., 2006; Kabisch et al., 2016; Grunewald et al., 2017; Wüstemann et al., 2017) can be due to high demand on data and the resolution thereof, technical know-how and work load to establish a network analysis in a GIS (Handley et al., 2003; La Rosa, 2014; Richter et al., 2016). However, such methods are argued to overestimate the real supply from accessible green spaces compared to network analysis. Therefore, analyzing UGS accessibility by Euclidian distances represents a rather simplified picture of accessibility neglecting the real (longer) distances (La Rosa, 2014; Richter et al., 2016). For some issues (e.g., noise pollution) the Euclidean distance to facilities makes sense. However, a network-based accessibility analysis outperforms Euclidean distances for most planning issues. Network distances can either be derived using a node and edge model or a transition raster based on the pedestrian, bicycle, and road networks. The walking, biking, and car driving distances can be calculated as accumulated travel costs through this transition raster to the respective facilities or green spaces (Mueller et al., 2018). To get a clear picture of UGS accessibility, also physical barriers influencing the access to green spaces need to be taken into account (Handley et al., 2003; Van Herzele and Wiedemann, 2003). In this regard, evaluating the travel time to a destination can provide more valid results for physical barriers than the distance of the shortest route only (Dai, 2011). To our knowledge, current studies analyzing UGS accessibility neglect any physical obstacles or barriers jeopardizing UGS accessibility.
In contextual terms, taking into account cities as socio-ecological systems, there is further research needed to consider different population groups and their access to UGS (Kabisch et al., 2016) for describing the demand on UGS accessibility. Studies analyzing the spatial accessibility to UGS focus in particular on the supply side. However, accessibility to green spaces has to differ between actual (referring to the demand side and the actual use of green spaces) and potential accessibility (referring to the supply side and the green spaces available within a certain distance) (Dai, 2011). In general, further research is needed to evaluate the demand on and supply of ecosystem services by integrating social indicators such as age (Kabisch et al., 2016; Larondelle and Lauf, 2016). Specifically in terms of UGS accessibility, there is an increasing importance of good accessibility to UGS for the elderly for whom the real proximity from their residence to the green site for recreation is of major importance (Boone et al., 2009; Kabisch and Haase, 2014; La Rosa, 2014; Artmann et al., 2017). Indeed, because of reduced mobility and poor health status, elderly use mostly the nearest green spaces (Schipperijn et al., 2010a). Green spaces within a walking distance can then have positive impact on life satisfaction for the elderly (Sugiyama et al., 2009), health (Takano et al., 2002; Sugiyama and Ward Thompson, 2008) and social integration (Kweon et al., 1998).
Bringing the methodological and contextual aspects together, spatial network analysis interlinked with socio-economic or socio-demographic factors such as age can support decision-makers to identify gaps in community access (La Rosa, 2014). Current studies on accessibility analysis show that lack of income and socio-economic status (Byrne et al., 2009; Leslie et al., 2010; McConnacie and Shackleton, 2010) or racial/ethnic disparities (Wolch et al., 2005; Boone et al., 2009; Dai, 2011; Johnson-Gaither, 2011) can negatively correlate with UGS accessibility. Some studies interlink accessibility with age such as middle-aged adults (Hillsdon et al., 2006), children and youth (Wolch et al., 2005, 2011; Johnson-Gaither, 2011). However, none of these studies apply a network analysis but rather more simple methods such as buffer analysis (Wolch et al., 2005; Boone et al., 2009; Johnson-Gaither, 2011), road distances between the location of residents and nearest access points of green spaces (Barbosa et al., 2007) or green space per capita (McConnacie and Shackleton, 2010). To our knowledge only one study used network analysis examining the supply of accessibility to UGS for different religious and ethnic groups in an English city (Comber et al., 2008), but none focused on the aging population.
Taking into account the methodological requirements for accessibility analysis of UGS and contextual research demand to focus on accessibility by the aging population in specific contexts, this research analyzes the actual and potential accessibility to UGS by elderly living in care facilities. We focus on care facilities since they provide a place of residence for elderly residents with physical and/or mental impairments and reduced mobility, and thus we assume that this population group in particular needs good accessibility to UGS supporting their living quality (Artmann et al., 2017). The research objectives of this study are:
1) to set up a GIS network analysis, as a powerful toolset for this purpose (Comber et al., 2008), for identifying the potential accessibility to UGS by elderlies living in care facilities (representing the potential supply of recreational ecosystem services as potential access) while taking into consideration spatial distances and time losses due to physical barriers to reach the destination and
2) to cross-check the actual accessibility to UGS analyzing if accessible UGS in terms of spatial distance and shortest route taken is visited by elderlies residing in care facilities (representing the demand of recreational ecosystem services).
To approach the research objectives, our study employs in an explorative case study a mixed-method approach combining GIS network analysis and a survey with residents of care facilities for elderly residents in the city of Salzburg (Austria). By doing so this paper bridges the gap between supply and demand of cultural ecosystem services (Hegetschweiler et al., 2017), while focusing on the recreational value of UGS and their accessibility for elderly residents. Taking into account the fact that care facilities for elderly rate UGS as being of high importance for the elderly (Artmann et al., 2017), we hypothesize on the supply side that UGS for residents of care facilities for elderly indicate good (250 m) and medium accessibility (500 m) following the recommendations by Mueller et al. (2017) (see section GIS Network Analysis to Identify the Supply of Green Spaces Accessibility). On the demand side, we assume that elderly who were living in care facilities visited accessible UGS identified on the supply side within a maximum service area of 1,000 m (Mueller et al., 2017) due to potentially reduced mobility (Artmann et al., 2017). Although studies like Mueller et al. (2017) and Artmann et al. (2017) emphasize the importance of accessible UGS for elderly, there is a lack of empirical studies that provide in-depth insights into the spatial relevance of UGS accessibility for elderly living in care facilities.
Case Study
The focus of our study is Salzburg (Austria). Salzburg represents a small but growing city in Central Europe. Salzburg counts a population of 154,820 (2018) of which a share of 10% is aged 75 years or older (Stadt Salzburg, 2018). The report about challenges for housing in the light of the demographic change in the federal state Salzburg stated that, besides the supply of affordable apartments, good accessibility to green spaces is an important criterion for living quality for the elderly (Holzinger, 2015). A previous study in Salzburg indeed documented a high importance of accessibility to UGS for elderlies living in care facilities (Artmann et al., 2017). In general, Salzburg can be considered a green city that includes a range of parks, cemeteries, local hills, and blue infrastructure. However, the share of green spaces differs between the south and the north. In the south of the city, a higher degree of green spaces combined with a lower population density improves the proportion of green spaces compared to the north which has a high share of sealed areas and high population densities (Kabisch et al., 2014). UGS planning in Salzburg is of major importance. In 1988 the city's Green Space Declaration was implemented to protect the high share of green spaces (57% of the city's territory) despite the growing population (Amt für Stadtplanung und Verkehr, 2009). The result is that there is high competition for space between green and gray infrastructure in Salzburg's densifying urban areas which may lead locally to a lack of urban greening.
Methods
Analyzing the Demand on Green Space Accessibility by Elderlies
Survey
In order to investigate the demand for UGS accessibility by elderlies living in care facilities, a survey with guided interviews was conducted. In this regard, we compare the demand side and actual accessibility with the actual use of the UGS assuming that all residents of the care facility have similar desires for recreational activities on UGS, but their level of fulfillment depends on distance to the UGS (Baró et al., 2016) and the health status of the elderly (Artmann et al., 2017). Thus, the purpose of the survey was to find out about UGS, routes and barriers perceived by the target group and to include these spatial objects as a qualitative component in a quantitative network analysis.
Therefore, inhabitants of four care facilities in Salzburg were interviewed. The selection was made out of 15 care facilities which are located within the city of Salzburg (Artmann et al., 2017). Since one facility was closing, 14 facilities were contacted by phone calls and e-mails and asked for permission to interview their inhabitants. The number of participants was limited to four care facilities since 10 of the available care facilities refused or canceled the permission to interview their residents, because, for instance, residents do not leave the care facility. For the survey only residents were chosen who regularly (at least a few times a month) visit UGS. This was done by the director or nurses of the facility. To proof if the selection was accurate the residents were interviewed. When they answered that they do not visit UGS regularly they were left out in the final analysis. Since the survey did not harm the physical or psychological integrity nor the rights of privacy of the study participants, the corresponding author as study lead did not need approval, according to §145, from the ethics committee of the Paris Lodron University Salzburg, Austria (https://www.uni-salzburg.at/index.php?id=31053).
Figure 1 shows a map of Salzburg and the location of the care facilities for elderly which participated in the survey.
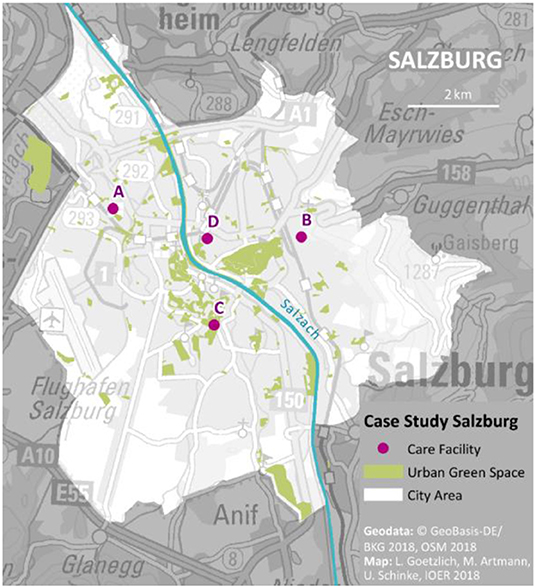
Figure 1. The case study Salzburg and surveyed care facilities.
The questionnaire included three sections. The first stated general questions about which UGS were visited, when and how often. In this step, every UGS in the city of Salzburg that is declared as UGS by Copernicus (2018), classified as park by Open Street Map (2018), or named by the interviewees was considered a potential destination, thereby considered relevant UGS for recreation. The second part of the survey focused on the question how UGS are reached. In order to find out about the routes old-aged citizens use, a city map was given to the participants of the survey, on which they could mark the route and streets they use to reach the UGS. The final part of the survey concentrated on barriers to UGS access and the issue of whether they limit the visits to UGS. The last question contained the generic terms and keywords of the data model of Mueller et al. (2017). For example: waste bins, footways or trees. The questions of the survey are listed in Supplementary Material.
The interviews were conducted between November and December 2017 interviewing in total 23 elderlies (see Table 1).
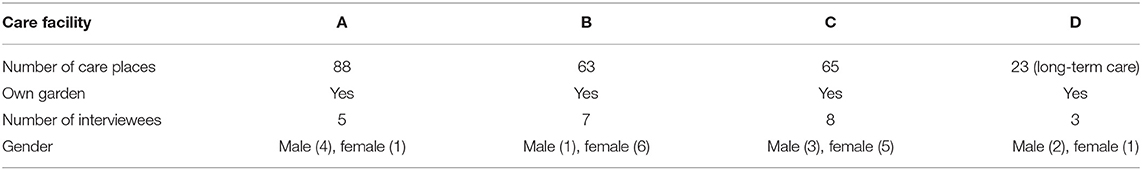
Table 1. Care facilities and survey participants.
Mapping of Barriers Influencing Urban Green Space Accessibility
The barrier analyses influencing the accessibility to UGS included first the identification of relevant barriers by Global Navigation Satellite System (GNSS) and second the mapping of these barriers in the surrounding area of the care facilities for the elderly. First, the barrier types were defined according to the survey (see section Survey). The second step of the barrier analysis was to map the identified barriers along the routes that were named by the participants in the survey. Therefore, a Juno mapping device with the software TerraSync by the Trimble Company was used. The post processing was undertaken in PathFinder Office. Finally, the barriers named by the elderlies were mapped. In order to work with traffic lights as a specific barrier, an Open Government Data (OGD) file was used. OGD are spatial data that are freely available on the internet. The used data are freely available for public use, reuse and redistribution. These data are managed by a governmental authority (Working Group on Open Government Data, 2018).
GIS Network Analysis to Identify the Supply of Green Spaces Accessibility
To assess the supply of UGS accessibility, the network analysis was split into two parts: First, basic network analysis without barriers was conducted. Secondly, a network analysis which took the influence of barriers into account was performed. The network analyses were carried out using the ESRI ArcGIS Network Analysist extension with the tools Make Service Area Layer, Make Closest Facility Layer and Make Route Layer. Walking distance and walking time were defined as costs and determined as the horizontal distance between two points through the network, while the walking time was calculated out of the walking distance and the walking speed. The speed of slow walking elderly was set after a literature review as 1 m/s (Knoflacher, 1995; Ghanbari and Ghanbari, 2013; Duim et al., 2017). Finally, the 14 care facilities for elderly in Salzburg were defined as origins and the service areas (mainly including parks, meadows, banks of the Salzach river and wooded areas as well as UGS visited by the elderly) considering walking time as the cost parameter were calculated and grouped in three categories after executing the operation “Make Service Area Layer”: One of 250 m (good accessibility), 500 m (medium accessibility), and 1,000 m (poor accessibility) according to Mueller et al. (2017). For walking time, service areas of 10, 20, and 30 min were used (Barbosa et al., 2007; Poelmann, 2016; Xu et al., 2017). We use criteria, distance and walking time to underscore the versatility of our GIS data model. Distance calculated on the network is highly precise and can be used to model different modes of transportation. The service areas were established by applying an appropriate walking speed for elderlies as the focus group in our analysis. The two other tools were used to ascertain the route actually used and the shortest routes from a facility to a certain UGS. In a second step, barriers were added to the analysis. Barriers were classified into restrictions and added costs (for example time loss). Barriers which would make it impossible to pass were classified as restriction (prohibitions, blockades, fences). All other barriers were organized as added costs (footways with slopes, crossings with traffic lights) with varying influences on the routes. The time loss for slopes was specified according to the length of the slope. Values for decreased walking speed on slopes were found in the studies of Knoflacher (1995) and adjusted for elderly by the publication of Duim et al. (2017), resulting in a walking speed for slow walking elderly on slopes as 0.62 m/s. This is a mean value for slopes between 1 and 20%. Values for slopes with more than 20% vertical drop were not calculated, because stairs would be used in urban planning instead (Knoflacher, 1995). For waiting times at traffic lights a time loss of 30 s was added to the route, which is in accordance with Brenner (2005). Finally the shortest routes were compared to the routes elderlies used in reality.
Data Analysis
In line with the research objectives, the data from the survey and GIS analysis were analyzed by using SPSS 22 (IBM Corp., Armonk, NY, USA). To identify any correlations between transportation mode and distances to the UGS or shortest routes taken, a Kruskal-Wallis test was applied. The relationship between distances to UGS and frequency of visits was assessed using Spearman rank correlations.
Results
Potential Accessibility to Urban Green Spaces—The Supply Side
Table 2 shows that only a few UGS can be found within 250 or 500 m. Indeed, for care facility B no UGS can be found at all within this service area. Most UGS are found between 500 and 1,000 m distances and can be reached between 20 and 30 min walking time. When considering walking time instead of walking distance, more UGS are found within the service areas. For each care facility it was examined whether the required time to reach the five nearest UGS changes when adding barriers. Since for care facility B only four UGS were found, 19 UGS were analyzed. Regarding the time required to reach the nearest UGS on the shortest routes from each care facility, elderlies needed between 4 min 11 s and 26 min 5 s without considering barriers. The most frequently mentioned barriers according to the elderlies and included in the analysis are roadworks and shortcomings of footways, like bad conditions, width, and slope. They were mentioned by 25% of the interviewees. Attention was also drawn to the barriers which 13% of the interviewees named: stairs, showcases, benches, crossings, guideposts. Benches were perceived as barriers if they are standing in the way. Elements that were perceived by <13% of respondents as barriers (e.g., dustbins, trees, ramps) were not included in the analysis.
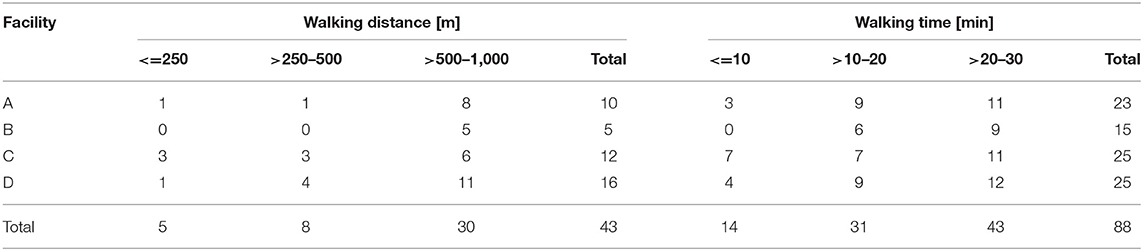
Table 2. Supply in terms of number of urban green spaces classified by distance and walking time (without barriers).
The accessibility analysis of the five nearest UGS to the care facilities according to time shows that on average a time loss between 57 s and 4 min 32 s can be observed when barriers are considered (see Table 3). The maximum time loss observed is 8 min 1 s related to care facility B. For seven out of 19 UGS analyzed, no time loss can be observed. The time losses differ between the care facilities. For instance, for care facility A and D low time losses below 1.5 min can be observed on average. In contrast, for care facility B and C time losses are on average higher than 3 min. The higher time losses for care facility B and C can be explained by slopes or, for instance, by the fact that the straight route to an urban park can no longer be chosen because it lacks footways. No footways are a security risk. Therefore, elderlies must take an indirect, safer route which results in time loss. Without barriers 18 min 4 s are needed to reach the destination, while by including barriers 26 min 5 s are necessary. In the case of the care facility C the impedances of barriers on the shortest routes are clearly visible as well. By looking at the route to the UGS in the south (a graveyard visited by an elderely), this becomes more concrete (see Figure 3, section Actual Accessibility to Urban Green Spaces—The Demand Side). While the route with barriers is straighter, the route without barriers is more indirect. The reason for this is slopes and prohibitions for walking on the original route. Consequently a time loss of 3 min 7 s occurs (22 min 18 s on straight barrier free route, 25 min 25 s on route with included barriers).
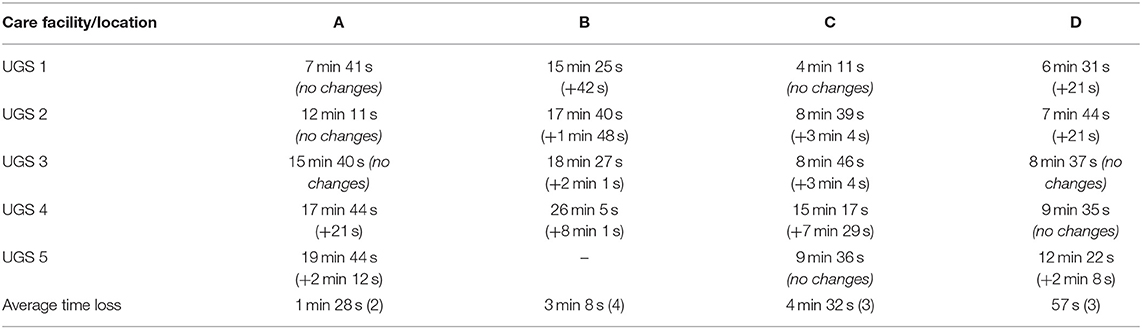
Table 3. Access to the five nearest urban green spaces (UGS) in terms of time without barriers and time loss as a result of barriers (in brackets).
Actual Accessibility to Urban Green Spaces—The Demand Side
Comparing the supply of UGS within the service area of 1,000 m with the actual demand, the results show that over half of the UGS (62%) within 1,000 m are not visited by the elderlies. In total, 69% of the UGS visited are further away than 1,000 m (see Figure 2A). In particular, elderlies residing in care facility D visit UGS outside the 1,000 m service area (mainly parks) although this facility has the highest share of UGS within the threshold distance (see Table 2, section Potential Accessibility to Urban Green Spaces—The Supply Side). Most of the elderlies state that they walk to the UGS (48%) and 35% of elderlies reach the destination by wheelchair. 17% of residents use the car (see Figure 2B). Those elderlies who use the car take the longest distances to the UGS reaching a maximum up to 7,387 m (see Figure 2C). However, an elderly living in care facility C visits one UGS at a distance of 6,738 m using a wheelchair. Elderlies reaching the UGS by wheelchair cover on average longer distances (1,581 m) than elderlies walking (1,264 m). All elderlies using a car visit UGS outside the service area of 1,000 m (see Figure 2D). More UGS reached by walking fall within 1,000 m. In contrast, more UGS accessed by wheelchair are farther away than 1,000 m. A Kruskal-Wallis test showed a significant correlation [χ2(2) = 10.832, p = 0.004] suggesting that the actual accessibility (demand) to UGS correlates with the travel mode. The subsequently conducted post-hoc tests (Dunn-Bonferroni tests) prove that the groups between elderlies reaching the UGS by car and walking are significantly different (z = −3.041, p = 0.007). The effective power of 0.61 can be interpreted as a strong effect according to the classification by Cohen (1988) and it may be concluded that UGS farther away are in particular reached by car and, respectively, closer green spaces by foot.
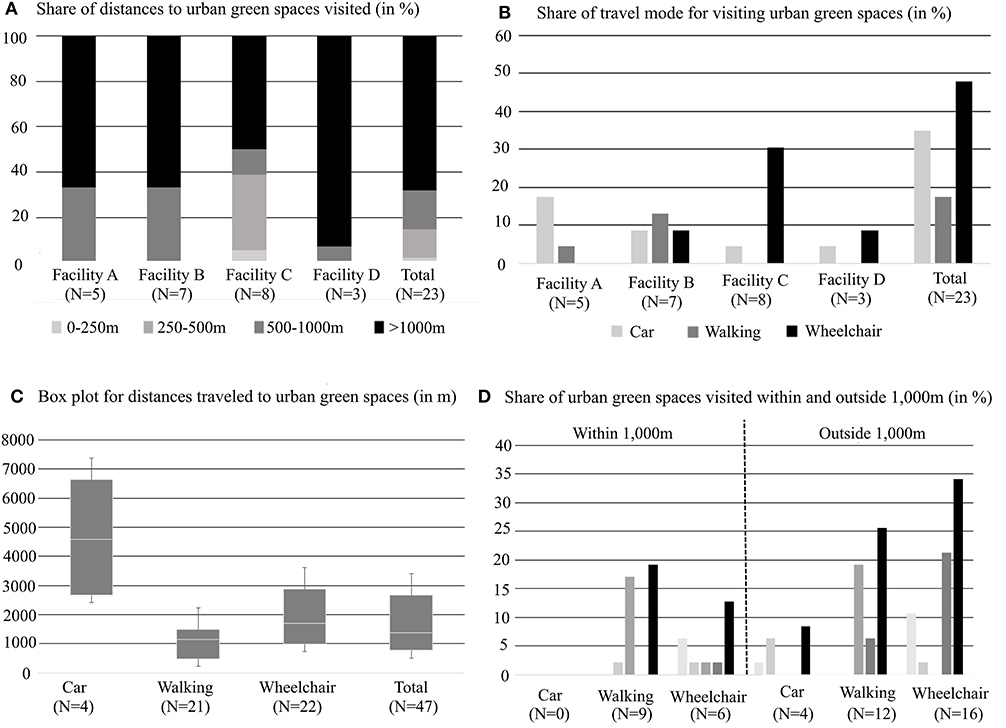
Figure 2. Actual accessibility to urban green spaces. (A) Share of distances to urban green spaces visited (in %). (B) Share of travel mode for visiting urban green spaces (in %). (C) Box plot for distances traveled to urban green spaces (in m). (D) Share of urban green spaces visited within and outside 1,000 m (in %).
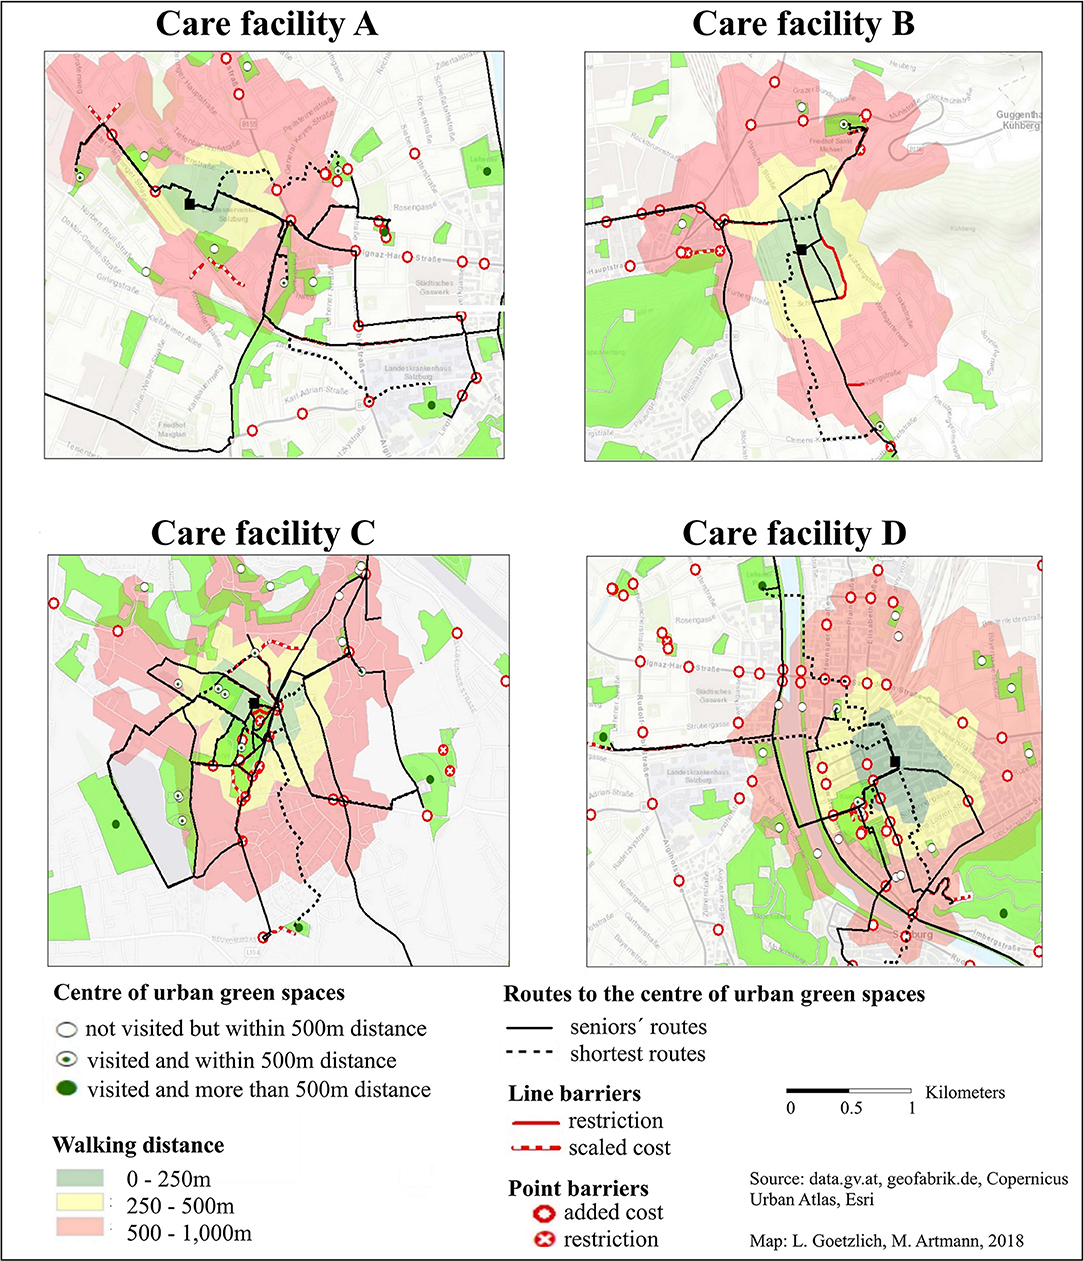
Figure 3. Routes with barriers and walking distances to urban green spaces.
The most visited UGS are parks (50%) followed by blue infrastructure (e.g., lakes, 26%). Green open spaces account for 9% and destinations relating to circular tracks without naming a specific UGS account for 7%. The green spaces are mostly visited a few times a week (37%) or daily (35%). No correlation between the frequency of visiting UGS and distances to these could be found.
Figure 3 displays four maps that contain routes and UGS for the four interviewed care facilities. Only routes leading to close UGS (within 1,000 m walking distance) in the context of the network analysis are shown in the maps. Concerning the routes to the closest UGS, only the routes the elderlies used are shown. Some people preferred circular tracks (e.g., care facility C) for which no shortest route can be provided. For the routes taken by car, no shortest route is provided here as well, since this does not guarantee a convenient route, and comparing the demand by car drivers with the supply of UGS according to walking distances is not reasonable. For the car route variables such as traffic are important as well, which is not a subject of the study. The results show that the elderlies mostly prefer the shortest routes, regardless of whether or not they are walking or using a wheelchair. In particular, for UGS reached by foot (11 of 13), the shortest routes are taken. For the UGS accessed by wheelchair, it is slightly less frequent that elderlies take the shortest routes (18 out of 22) (see Table 4). No statistical correlations could be found between shortest routes taken and transportation mode.
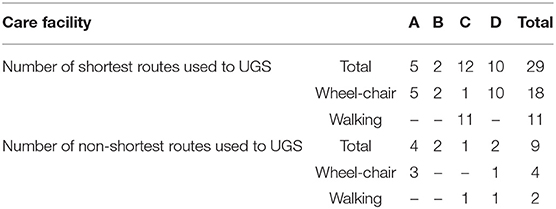
Table 4. Shortest routes taken to urban green spaces (UGS).
Discussion
Supply and Demand Concerning Urban Green Space Accessibility for Elderlies
Despite our supply-side hypothesis that UGS for residents of care facilities indicate good accessibility, the analysis of the service areas related to the four care facilities showed that only a few UGS within 250 or 500 m can be found. This also holds true for other care facilities in Salzburg. While Artmann et al. (2017) found that urban parks are the most frequently visited green spaces by elderlies living in care facilities, our analysis shows that, out of a total of 15 care facilities in Salzburg (Artmann et al., 2017), 40% provide access to urban parks within 500 m, 33% between 500 and 1,000 m and 27% outside the service area (see Figure 4). Taking into account the recommendation by research that UGS should be reached within 500 m walking distance (Kabisch et al., 2016; Grunewald et al., 2017), these results are crucial, in particular since the use of UGS outside care facilities depends on the health status of the elderlies (Artmann et al., 2017). Since there is the demand by the SDGs to provide access to vulnerable population groups such as the elderly (United Nations, 2015), monitoring accessibility to UGS should not only take into account green spaces in relation to the population in general (Kabisch et al., 2016; Grunewald et al., 2017) or related to specific population groups based on their place of residence (Takano et al., 2002; Wüstemann et al., 2017), but also social infrastructure and their equipment with green spaces. Indeed, green spaces related to social infrastructure can provide health benefits. For instance, hospital gardens can improve clinical outcomes (Sherman et al., 2005), or school gardens can promote children's vegetable consumption (Ratcliffe et al., 2009).
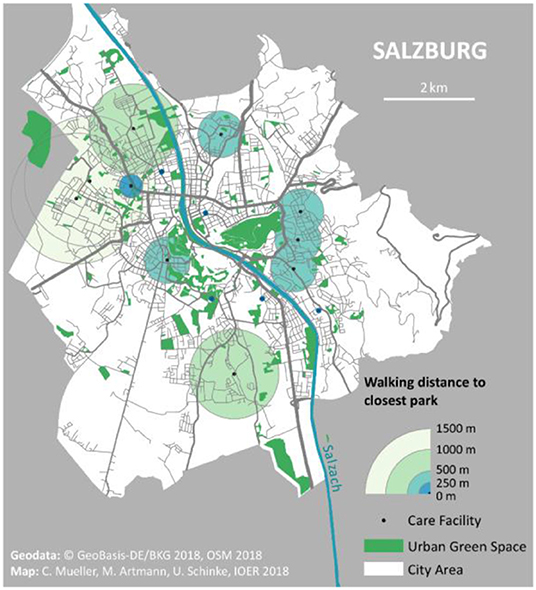
Figure 4. Accessibility of urban parks for care facilities for the elderly in Salzburg.
Despite our hypothesis on the demand side assuming that elderly living in care facilities visited the UGS within the service areas, our study found that the elderlies surveyed mostly visit UGS outside the service area of 1,000 m, not only by car but also by wheelchair and also by foot up to a distance of 2.8 km. This finding is consistent with other research, suggesting that distance might not be a barrier for visiting green spaces (Hillsdon et al., 2006; Nielsen and Hansen, 2007; Schipperijn et al., 2010b). That elderlies visited UGS farther away might be due to the fact that retired elderlies have more time for longer walking due to fewer obligations (Shigematsu et al., 2009). That this study involved only elderlies visiting green spaces on their own, suggesting that they have a good health status and are mobile, might be another reason why in particular UGS outside the service area were visited. Thus, for elderlies with limited mobility, spatial access might be more relevant than for healthy elderlies (Artmann et al., 2017). Other reasons might be the lack of UGS features within the service areas which are important to elderlies, such as frequent benches for resting (Artmann et al., 2017) or soft and even pavement in the pathways (Zhai and Baran, 2017). Further demands on UGS activities by elderlies can include the observation of nature, recreation and intergenerational contact (Artmann et al., 2017). In general, a current review found that relationships between supply and demand of cultural ecosystem services related to urban green infrastructures were often times not significant and that supply-demand relationships are complex and need further research (Hegetschweiler et al., 2017). The findings from this study suggest that the linking of supply and demand of accessibility needs to take into consideration further demands on UGS qualities such as those done by Stessens et al. (2017), which combined green space quality and proximity. To interlink access indicators with green space qualities is also important for the analysis of more precise health impacts by urban nature since residential proximity indicators do not reflect the entire picture of green space accessibility (Ekkel and de Vries, 2017).
Although our findings propose that distance alone is not a main driver for explaining the demand on UGS, it should be mentioned that distance nevertheless should be considered for the planning of UGS. Thus, according to our findings in particular elderlies reaching green spaces on foot need UGS within a walking distance. However, destinations outside the service area need to be taken into account for potential destinations for the elderlies as well. Thus, walkable accessibility to recreation facilities such as parks can support active lifestyles for older adults by providing a destination for walking (Shigematsu et al., 2009). In fact, the fulfillment of the need for autonomy is a major motivator for older adults to visit parks which can be supported by a natural environment but also through low distance to the park from older adult residences (Gibson, 2018). In terms of routes chosen to reach UGS, elderlies seem to prefer the shortest routes to the green spaces regardless of any barriers. For the potential accessibility the study found some crucial barriers for the elderlies which can reduce the safety to reach their destination. To promote walking among older adults, it is important to fix barriers such as sub-standard sidewalk quality (Mitra et al., 2015). Including physical barriers in the network analysis can be considered as a major contribution of this study and can support urban planning for providing safe accessibility to UGS. Future research should therefore also integrate the quality of routes to the UGS for a comprehensive analysis.
Study Limitations
A major limitation of the study is that only 23 individuals took part in the study, due to a lack of authorization from the facilities and health conditions of elderlies, so that the representativeness of the study is put into question. Since our study had narrow study parameters focusing on actual and potential accessibility of UGS and related barriers, a small sample size might be justified (Malterud et al., 2016). Besides, we used the survey data quantitatively by applying statistical tests. All in all, this study can be considered an explorative case study providing first insights into the role of supply of and demand on UGS accessibility for elderly living in care facilities linking GIS network analysis and questionnaires. More research with increased sample sizes is needed to verify our findings.
Regarding the questionnaire and the assessment of the routes the interviewees took to reach the UGS, a certain degree of ambiguity remains. This is due to the fact that elderlies often had difficulty in remembering the exact routes they took. Firstly, it was particularly hard for residents not regularly visiting UGS to mark the exact route. Secondly, the question about features perceived as barriers that was based on the data model was not always completely answered. For example, only one person could provide information about toilets, entries, ticket machines, bus stops, or car parks. Therefore, it is reasonable to ask to what degree these could be defined as barriers or to use suggested barriers from literature such as that of Van Herzele and Wiedemann (2003). However, this presents the risk that non-user-specific physical barriers are taken into account which can demotivate older residents, in particular, from leaving their homes (WHO, 2007). Future studies can link qualitative with quantitative empirical social research methods and accompany the elderlies on their way to the green space applying behavioral observations. Such a mixed-method approach can provide comprehensive data for understanding UGS accessibility and its usability (Wright Wendel et al., 2012). In fact, our demand-side approach focuses so far on the actual use of UGS neglecting elderlies' needs related with UGS usability.
Regarding the GNSS used to map the barriers on the routes elderlies mentioned, it was remarkable that the accuracy of a maximum of 20 cm was not sufficient, in particular with line barriers. For this reason, the mapped lines could not be used for the analysis and the exact location had to be extracted from the shape file for the streets of Salzburg that was also used for the network analysis. The location of the point data had to be corrected in ArcGIS through editing because their position was not exactly on the street network. Additionally, without locations on the network dataset, calculations are useless. However, no problems occurred when using the ArcGIS network analysis. It is a very convenient and useful tool to generate service areas and routes to facilities. The main advantage is that the calculation is based on network distances and not Euclidean distances, therefore the results are based on almost realistic distances. One problem might be that a service area calculation with barriers does not lead to meaningful results. Furthermore, the literature provided less information about the impact of the barriers on the routes, so that time loss due to bad surface conditions or roadworks could not be included in the analysis. Besides, crosswalks have not been taken into account in the analysis since the input dataset does only contain streets and crossings. However, values for the waiting time at traffic lights and mean values for time loss on slopes, at least, could be found. Using mean values introduces another limitation. Elderlies might lose less time on flat slopes than on steep ones. Due to a lack of information and the data structure, this could not be included in the study. Another shortcoming of the analysis with the variable of walking time is that the walking time of the questioned elderlies could not be measured, so values from literature were used instead.
Conclusion
Based on an explorative empirical research in Salzburg (Austria), this study sheds light on the potential and actual accessibility to UGS for elderlies living in care facilities. Despite the small sample size, by combining a network analysis with a survey, the study can draw some conclusions regarding the role of accessibility to UGS in terms of green space management and methodological implications.
In terms of management, the results show the value of bringing together supply and demand as regards UGS accessibility. The supply analysis on the example for Salzburg showed that only a few UGS are provided within a good accessibility (500 m) and that barriers along the routes jeopardize the accessibility to UGS—both aspects might be crucial for elderlies with reduced mobility. To provide accessibility to UGS also for vulnerable population groups such as elderlies, green space monitoring should take into account the equipment of social infrastructure with green spaces as well as the safety of routes to the UGS. Analyzing the accessibility demand, elderlies living in care facilities visit in particular UGS outside the service are of 1,000 m whereby elderlies tend to visit closer UGS on foot compared to elderlies using a car. We conclude that distance is not a strong predictor for visiting UGS but, aside from the mode, other aspects such as qualities of UGS visited, time resources and health status of elderlies might be of higher importance for choosing UGS. Further accessibility analysis for elderlies with a greater sample size should reflect what kind of ecosystem services UGS supply, in relation to the demand on UGS by the elderlies.
In methodological terms, this study has demonstrated that network analysis is a tool to link actual and potential accessibility of UGS. The enrichment of the spatial network analysis model is based on information gathered by interviewing the elderlies and by including the obstacles and impedances they pointed out and come across when moving around town to visit UGS. The differences in travel time add a layer of actual accessibility over the network and provide a more nuanced space-time link between cultural ecosystem services provided by UGS and specific groups of beneficiaries. We juxtaposed routes actually taken and shortest routes and analyzed the role of transportation mode for accessibility. Thus, actual and potential accessibility of UGS connecting GIS analysis and survey data is a comprehensive approach toward obtaining a more complete picture for urban planning in order to better understand visitor behavior in terms of mobility and UGS demand. Given the small sample size in our study, we cannot generalize the findings and may have introduced bias resulting from the city context or the respondents. We could envisage further research that makes use of trackers the elderlies take with them on their routes to get a more robust data base on walking speed and stops along the way and how this relates to obstacles and barriers that were identified by the elderlies. This and future studies on UGS accessibility for elderlies might inform age-group-sensitive planning and UGS design.
Data Availability
The datasets generated for this study are available on request to the corresponding author.
Author Contributions
LG and AH conceptualized and designed the study. LG and CM collected, digitized, and organized the data. MA and LG analyzed the data. MA conceptualized and wrote the paper. CM, LG, and AH contributed sections of the manuscript. All authors contributed in the reading, and approved the submitted version.
Funding
We acknowledge financial support by the Open Access Publication Fund of the University of Salzburg.
Conflict of Interest Statement
The authors declare that the research was conducted in the absence of any commercial or financial relationships that could be construed as a potential conflict of interest.
Supplementary Material
The Supplementary Material for this article can be found online at: https://www.frontiersin.org/articles/10.3389/fenvs.2019.00136/full#supplementary-material
References
Amt für Stadtplanung und Verkehr (2009). Die zukünftige Entwicklung der Stadt Salzburg. Räumliches Entwicklungskonzept der Stadt Salzburg REK 2007 (The Future Development of the City of Salzburg. Spatial Development Concept of the City Salzburg REK 2007. Available onlien at: https://www.stadt-salzburg.at/REK_GR/REK2007_Textteile_Druckfassung.pdf (accessed October 9, 2018).
Artmann, M., Chen, X., Ioja, C., Hof, A., Onose, D., Ponizy, L., et al. (2017). The role of urban green spaces in care facilities for elderly people across European cities. Urban For. Urban Green. 27, 203–213. doi: 10.1016/j.ufug.2017.08.007
Badiu, D. L., Ioja, C. I., Patroescu, M., Breuste, J., Artmann, M., Nita, M. R., et al. (2016). Is urban green space per capita a valuable target to achieve cities'sustainability goals? Romania as a case study. Ecol. Indic. 70, 53–66. doi: 10.1016/j.ecolind.2016.05.044
Barbosa, O., Tratalos, J. A., Armsworth, P. R., Davies, R. G., Fuller, R. A., Johnson, P., et al. (2007). Who benefits from access to green space? A case study from Sheffield, UK. Landscape Urban Plan. 83, 187–195. doi: 10.1016/j.landurbplan.2007.04.004
Baró, F., Palomo, I., Zulian, G., Vizcaino, P., Haase, D., and Gómez-Baggethun, E. (2016). Mapping ecosystem service capacity, flow and demand for landscape and urban planning: a case study in the Barcelona metropolitan region. Land Use Policy 57, 405–427. doi: 10.1016/j.landusepol.2016.06.006
Boone, C. G., Buckley, G. L., Morgan Grove, J., and Sister, C. (2009). Parks and people: an environmental justice inquiry in Baltimore, Maryland. Ann. Assoc. Am. Geogr. 99, 767–787. doi: 10.1080/00045600903102949
Brenner, M. (2005). “Lichtsignalsteuerung,” in Stadtverkehrsplanung. Grundlagen, Methoden, Ziele, eds G. Steierwald, H. D. Künne, and W. Vogt (Berlin; Heidelberg: Springer, 720–779.
Breuste, J., Haase, D., and Elmqvist, T. (2013). “Urban landscapes and ecosystem services,” in Ecosystem Services in Agricultural and Urban Landscapes, eds S. Wratten, H. Sandhu, R. Cullen, and R. Costanza (Oxford: Wiley, 83–104.
Byrne, J., Wolch, J., and Zhang, J. (2009). Planning for environmental justice in an urban national park. J. Environ. Plan. Manage. 52, 365–392. doi: 10.1080/09640560802703256
Comber, A., Brunsdon, C., and Green, E. (2008). Using a GIS-based network analysis to determine urban greenspace accessibility for different ethnic and religious groups. Landscape Urban Plan. 86, 103–114. doi: 10.1016/j.landurbplan.2008.01.002
Copernicus (2018). Urban Atlas 2012. Available online at: https://land.copernicus.eu/local/urban-atlas/urban-atlas-2012 (accessed January 25, 2018).
Dai, D. (2011). Racial/ethnic and socioeconomic disparities in urban green space accessibility: where to intervene? Landscape Urban Plan. 102, 234–244. doi: 10.1016/j.landurbplan.2011.05.002
Duim, E., Lebrão, M. L., and Antunes, J. L. F. (2017). Walking speed of older people and pedestrian crossing time. J. Transp. Health 5, 70–76. doi: 10.1016/j.jth.2017.02.001
Ekkel, D. E., and de Vries, S. (2017). Nearby green space and human health: evaluating accessibility metrics. Landscape Urban Plan. 157, 214–220. doi: 10.1016/j.landurbplan.2016.06.008
Elmqvist, T., Cornell, S., Öhman, M. C., Daw, T., Moberg, F., Norström, A., et al. (2014). Global Sustainability and Human Prosperity: – Contribution to the Post-2015 Agenda and the Development of Sustainable Development Goals. Copenhagen: Council of Ministers.
Fuller, R. A., and Gaston, K. J. (2009). The scaling of green space coverage in European cities. Biol. Lett. 5, 352–355.doi: 10.1098/rsbl.2009.0010
Ghanbari, A., and Ghanbari, M. (2013). Assessing spatial distribution of tabriz parks by GIS (compared network analysis and buffering). Geogr. Environ. Plan. J. 50, 57–60.
Gibson, S. C. (2018). “Let's go to the park.” An investigation of older adults in Australia and their motivations for park visitation. Landsc. Urban Plan. 180, 234–246. doi: 10.1016/j.landurbplan.2018.08.019
Grunewald, K., Richter, B., Meinel, G., Herold, H., and Syrbe, R.-U. (2017). Proposal of indicators regarding the provision and accessibility of green spaces for assessing the ecosystem service recreation in the city” in Germany. Int. J. Biodivers. Sci. Ecosyst. Serv. Manag. 13, 26–39. doi: 10.1080/21513732.2017.1283361
Handley, J., Pauleit, S., Slinn, P., Lindley, S., Baker, M., Barber, A., et al. (2003). Providing Accessible Natural Greenspace in Towns and Cities: A Practical Guide to Assessing the Resource and Implementing Local Standards for Provision. Available online at: http://publications.naturalengland.org.uk/file/78003 (accessed April 24, 2017).
Hegetschweiler, T. K., de Vries, S., Arnberger, A., Bell, S., Brennan, M., Siter, N., et al. (2017). Linking demand and supply factors in identifying cultural ecosystem services of urban green infrastructures: a review of European studies. Urban For. Urban Green. 21, 48–59. doi: 10.1016/j.ufug.2016.11.002
Hillsdon, M., Panter, J., Foster, C., and Jones, A. (2006). The relationship between access and quality of urban green space with population physical activity. Public Health 120, 1127–1132. doi: 10.1016/j.puhe.2006.10.007
Holzinger, H. (2015). Hans Holzinger: Demografischer Wandel und Wohnen im Alter. Eine Herausforderung für den Salzburger Wohnbau (Demographic Change and Living in Old Age. A Challenge for Housing in Salzburg). Available online at: https://jungkbibliothek.files.wordpress.com/2015/01/h_holzinger_wohnen-im-alter_herausforderung-fc3bcr-salzburgs-wohnbau.pdf (accessed June 30, 2017).
Johnson-Gaither, C. (2011). Latino park access: examining environmental equity in a “new destination” county in the south. J. Park Recreat. Adm. 29, 37–52.
Kabisch, N., and Haase, D. (2014). Green justice or just green? Provision of urban green spaces in Berlin, Germany. Landscape Urban Plan. 122, 129–139. doi: 10.1016/j.landurbplan.2013.11.016
Kabisch, N., Larondelle, N., and Artmann, M. (2014). “Urban ecosystem services in Berlin, Germany and Salzburg, Austria: climate regulation and recreation function,” in Human-Environmental Interactions in Cities: Challenges and Opportunities of Urban Land Use Planning and Green Infrastructure, eds N. Kabisch, N. Larondelle, A. Reeve, and M. Artmann (Newcastle: Cambridge Scholars Publishing, 66–80.
Kabisch, N., Strohbach, M., Haase, D., and Kronenberg, J. (2016). Urban green space availability in European cities. Ecol. Indic. 70, 586–596. doi: 10.1016/j.ecolind.2016.02.029
Knoflacher, H. (1995). Fußgeher- und Fahrradverkehr Planungsprinzipien (Pedestrian and Bicycle Traffic Planning Principles). Vienna: Böhlau.
Kweon, B.-S., Sullivan, W. C., and Wiley, A. R. (1998). Green common spaces and the social integration of inner-city older adults. Environ. Behav. 30, 832–858. doi: 10.1177/001391659803000605
La Rosa, D. (2014). Accessibility to greenspaces: GIS based indicators for sustainable planning in a dense urban context. Ecol. Indic. 42, 122–134. doi: 10.1016/j.ecolind.2013.11.011
Larondelle, N., and Lauf, S. (2016). Balancing demand and supply of multiple urban ecosystem services on different spatial scales. Ecosyst. Serv. 22, 18–31. doi: 10.1016/j.ecoser.2016.09.008
Larson, L. R., Keith, S. J., Fernandez, M., Hallo, J. C., Shager, C. S., and Jennings, V. (2016). Ecosystem services and urban greenways: what's the public's perspective. Ecosyst. Serv. 22, 111–116. doi: 10.1016/j.ecoser.2016.10.004
Leslie, E., Cerin, E., and Kremer, P. (2010). Perceived neighborhood environment and park use as mediators of the effect of area socio-economic status on walking behaviors. J. Phys. Act. Health 7, 802–810. doi: 10.1123/jpah.7.6.802
Maes, J., Hauck, J., Paracchini, M. L., Ratamäki, O., Termansen, M., Perez-Soba, M., et al. (2012). A Spatial Assessment of Ecosystem Services in Europe: Methods, Case Studies and Policy Analysis - Phase 2. Synthesis Report. PEER Report No 4. Ispra: Partnership for European Environmental Research.
Malterud, K., Siersma, V. D., and Guassora, A. D. (2016). Sample size in qualitative interview studies: guided by information power. Qual. Health Res. 26, 1753–1760. doi: 10.1177/1049732315617444
McConnacie, M. M., and Shackleton, C. M. (2010). Public green space inequality in small towns in South Africa. Habitat Int. 34, 244–248. doi: 10.1016/j.habitatint.2009.09.009
Mitra, R., Siva, H., and Kehler, M. (2015). Walk-friendly suburbs for older adults? Exploring the enablers and barriers to walking in a large suburban municipality in Canada. J. Aging Stud. 35, 10–19. doi: 10.1016/j.jaging.2015.07.002
Moseley, D., Marzano, M., Chetcuti, J., and Wwatts, K. (2013). Green networks for people: application of a functional approach to support the planning and management of greenspace. Landscape Urban Plan. 116, 1–12. doi: 10.1016/j.landurbplan.2013.04.004
Mueller, C., Beyel, S., and Klein, U. (2017). Barrierefreie Erreichbarkeit von Einrichtungen der lokalen Daseinsvorsorge und Raumattraktivität für Senioren. GIS-basierte demographische Betroffenheitsanalyse und kartographische Darstellungen zur Erkenntnisgewinnung (Barrier-free accessibility of facilities of the local general interest and space attractiveness for seniors. GIS-based demographic impact analysis and cartographic representations to gain insight). Kartogr. Nachr. 67, 202–209.
Mueller, C., Klein, U., and Hof, A. (2018). An easy-to-use spatial simulation for urban planning in smaller municipalities. Comput. Environ. Urban Syst. 71, 109–119. doi: 10.1016/j.compenvurbsys.2018.05.002
Nielsen, T. S., and Hansen, K. B. (2007). Do green areas affect health? Results from a Danish survey on the use of green areas and health indicators. Health Place 13, 839–850. doi: 10.1016/j.healthplace.2007.02.001
Oh, K., and Jeong, S. (2007). Assessing the spatial distribution of urban parks using GIS. Landscape Urban Plan. 82, 25–32. doi: 10.1016/j.landurbplan.2007.01.014
Open Street Map (2018). Geofabrik. Available online at: https://www.geofabrik.de/ (accessed January 25, 2018).
Paracchini, M. L., Zulian, G., Kopperoinen, L., Maes, J., Schägner, J. P., Termansen, M., et al. (2014). Mapping cultural ecosystem services: a framework to assess the potential for outdoor recreation across the EU. Ecol. Indic. 45, 371–385. doi: 10.1016/j.ecolind.2014.04.018
Peña, L., Casado-Arzuaga, I., and Onaindia, M. (2015). Mapping recreation supply and demand using an ecological and a social evaluation approach. Ecosyst. Serv. 13, 108–118. doi: 10.1016/j.ecoser.2014.12.008
Poelmann, H. (2016). A Walk to the Park. Assessing Access to Green Areas in Europe's Cities. European Commission Working papers. Available online at: http://ec.europa.eu/regional_policy/sources/docgener/work/2016_03_green_urban_area.pdf (accessed October 9, 2018).
Ratcliffe, M. M., Merrigan, K. A., Rogers, B. L., and Goldberg, J. P. (2009). The effects of school garden experiences on middle school-aged students' knowledge, attitudes, and behaviors associated with vegetable consumption. Health Promot. Practice 12, 36–43. doi: 10.1177/1524839909349182
Richter, B., Grunewald, K., and Meinel, G. (2016). Analyse von Wegedistanzen in Städten zur Verifizierung des Ökosystemleistungsindikators “Erreichbarkeit öffentlicher Grünflächen” (Analysis of distances in cities for the verification of the ecosystem performance indicator “accessibility of public green spaces”). AGIT 2, 472–481. doi: 10.14627/537622063
Sander, H. A., Ghosh, D.-, van Riper, D., and Manson, S. M. (2010). How do you measure distance in spatial models? An example using open-space valuation. Environ. Plan. B 37, 874–894. doi: 10.1068/b35126
Schipperijn, J., Ekholm, O., Stigsdotter, U. K., Toftager, M., Bentsen, P., Kamper-Jørgensen, F., et al. (2010b). Factors influencing the use of green space: results from a Danish national representative survey. Landscape Urban Plan. 95, 130–137. doi: 10.1016/j.landurbplan.2009.12.010
Schipperijn, J., Stigsdotter, U. K., Randrup, T. B., and Troelsen, J. (2010a). Influences on the use of urban green space – A case study in Odense, Denmark. Urban For. Urban Green. 9, 25–32. doi: 10.1016/j.ufug.2009.09.002
Sherman, S. A., Varni, J. W., Ulrich, R. S., and Malcaren, V. L. (2005). Post-occupancy evaluation of healing gardens in a pediatric cancer center. Landscape Urban Plan. 73, 167–183. doi: 10.1016/j.landurbplan.2004.11.013
Shigematsu, R., Sallis, J. F., Conway, T. L., Saelens, B. E., Frank, L. D., Cain, K. L., et al. (2009). Age differences in the relation of perceived neighborhood environment to walking. Med. Sci. Sports Exerc. 41, 314–321. doi: 10.1249/MSS.0b013e318185496c
Stadt Salzburg (2018). Einwohner- Bevölkerungsstatistik (Population Statistics). Available online at: https://www.stadt-salzburg.at/internet/bildung_kultur/salzburg_in_zahlen/einwohner_bevoelkeru_321402/bevoelkerungszahlen_1_1_2018_465586.htm (accessed July 9, 2018).
Stessens, P., Khan, A. Z., Huysmans, M., and Canters, F. (2017). Analysing urban green space accessibility and quality: A GIS-based model as spatial decision support for urban ecosystem services in Brussels. Ecosyst. Serv. 28, 328–340. doi: 10.1016/j.ecoser.2017.10.016
Sugiyama, T., and Ward Thompson, C. (2008). Associations between characteristics of neighbourhood open space and older people's walking. Urban For. Urban Green. 7, 41–51. doi: 10.1016/j.ufug.2007.12.002
Sugiyama, T., Ward Thompson, C., and Alves, S. (2009). Associations between neighborhood open space attributes and quality of life for older people in Britain. Environ. Behav. 41, 3–21. doi: 10.1177/0013916507311688
Takano, T., Nakamura, K., and Watanabe, M. (2002). Urban residential environments and senior citizens' longevity in megacity areas: the importance of walkable green spaces. J. Epidemiol. Commun. Health 56, 913–918. doi: 10.1136/jech.56.12.913
United Nations (2015). Transforming Our World: The 2030 Agenda for Sustainable Development. Available online at: https://sustainabledevelopment.un.org/content/documents/7891Transforming%20Our%20World.pdf (accessed January 12, 2018).
Van Herzele, A., and Wiedemann, T. (2003). A monitoring tool for the provision of accessible and attractive urban green spaces. Landscape Urban Plan. 63, 109–126. doi: 10.1016/S0169-2046(02)00192-5
WHO (2007). Global Age-Friendly Cities: A guide. Available online at: http://www.who.int/ageing/publications/Global_age_friendly_cities_Guide_English.pdf (accessed October 19, 2015).
Wolch, J., Jerett, M., Reynolds, K., McConnel, R., Chang, R., Dahmann, N., et al. (2011). Childhood obesity and proximity to urban parks and recreational resources: a longitudinal cohort study. Health Place 17, 207–214. doi: 10.1016/j.healthplace.2010.10.001
Wolch, J., Wilson, J. P., and Fehrenbach, J. (2005). Parks and park funding in Los Angeles: an equity-mapping analysis. Urban Geogr. 26, 4–35. doi: 10.2747/0272-3638.26.1.4
Working Group on Open Government Data (2018). Open Government Data. Available online at: https://opengovernmentdata.org/ (accessed April 13, 2018).
Wright Wendel, H. E., Zarger, R. K., and Mihelcic, J. (2012). Accessibility and usability: green space preferences, perceptions, and barriers in a rapidly urbanizing city in Latin America. Landscape Urban Plan. 107, 272–282. doi: 10.1016/j.landurbplan.2012.06.003
Wüstemann, H., Kalisch, D., and Kolbe, J. (2017). Access to urban green space and environmental inequalities in Germany. Landscape Urban Plan. 164, 124–131. doi: 10.1016/j.landurbplan.2017.04.002
Xu, M., Xin, J., Su, S., Wenig, M., and Cai, Z. (2017). Social inequalities of park accessibility in Shenzhen, China: the role of park quality, transport modes, and hierarchical socioeconomic characteristics. J. Transp. Geogr. 62, 38–50. doi: 10.1016/j.jtrangeo.2017.05.010
Keywords: healthy aging, urban green space accessibility, network analysis, cultural ecosystem services, Salzburg
Citation: Artmann M, Mueller C, Goetzlich L and Hof A (2019) Supply and Demand Concerning Urban Green Spaces for Recreation by Elderlies Living in Care Facilities: The Role of Accessibility in an Explorative Case Study in Austria. Front. Environ. Sci. 7:136. doi: 10.3389/fenvs.2019.00136
Received: 13 May 2019; Accepted: 04 September 2019;
Published: 02 October 2019.
Edited by:
Ioan Cristian Ioja, University of Bucharest, RomaniaReviewed by:
Constantina Alina Hossu, University of Bucharest, RomaniaDiana Andreea Onose, University of Bucharest, Romania
Salman Qureshi, Humboldt University of Berlin, Germany
Copyright © 2019 Artmann, Mueller, Goetzlich and Hof. This is an open-access article distributed under the terms of the Creative Commons Attribution License (CC BY). The use, distribution or reproduction in other forums is permitted, provided the original author(s) and the copyright owner(s) are credited and that the original publication in this journal is cited, in accordance with accepted academic practice. No use, distribution or reproduction is permitted which does not comply with these terms.
*Correspondence: Angela Hof, YW5nZWxhLmhvZkBzYmcuYWMuYXQ=